drainage calculations for 302-304 whiting street
TRANSCRIPT
James Engineering, Inc. 125 Great Rock Road, Hanover, Ma 02339
1
December 22,2019
Drainage Calculations
For 302-304 Whiting Street
Prepared for; South Shore Habitat for Humanity
156 East Street Weymouth, MA 02043
Table of Contents Description page no. Purpose 2 Method 2 Assumptions 2 Project Description 2 Watershed Data 3 Existing Conditions 4 Proposed Conditions 6 Storm Water Standards 10
James Engineering, Inc. 125 Great Rock Road, Hanover, Ma 02339
2
Purpose The purpose of this report is to review the proposed development at 302-304 Whiting Street and determine the impact of the proposed development on the abutting lot and treat the runoff from the proposed impervious surfaces on the lot in accordance with the stormwater standards. Method The calculation will be based upon the SCS TR-20 Model using HYDRO-CAD 10.0 software to conduct the calculations. Assumptions Minimum Tc 6 minutes CN Assumptions A Impervious 98 Gravel Driveway 96 Lawn-poor 42 Woodland 30 Lawn/shoulder 39 Project Description The proposed development of the lot at 302-304 Whiting Street will be 2 single-family dwellings. The existing dwelling at 302 Whiting will be removed in conjunction with this development and replaced further back from the wetlands at the rear of the parcel. The 2 dwellings will share a common driveway that will follow the existing gravel driveway. Overall, the proposed development will be:
1,344 sq. ft. dwelling 160 sq. ft. sheds 3,822 sq. ft. driveway, and 80 sq. ft. walkways
The primary goal of the design will be to reduce the peak rates and volume of runoff from the site in all directions. The lot is 41,287+ square feet in size and will be subdivided into 2 separate parcels with each individual dwelling being located on its own lot. Overall, the parcel has 152.0’ of frontage along Whiting Street. The site currently is a single family 2-bedroom dwelling that is located at the rear of the parcel. The wetlands and a perennial stream are located at the rear of the parcel. Approximately 153 square feet of the parcel is located within the limits of the flagged wetlands. The 200’ riverfront area extends up to within 80’+ of the front property line. The existing dwelling is currently only 59’ from the wetlands and 84’ from the top of bank for the stream. The land slopes dramatically from the existing house down to the wetlands and there is a series of stepped masonry walls along back northwest corner of the lot. The abutter to the north and west is the Derby Brook Condominiums. The entrance driveway into this complex is parallel with the northerly property line. There are 2 stormwater features between the entrance roadway into the condominiums and the northerly property line. From Whiting Street west there is a rain garden approximately 120’ long along the southerly edge of the driveway. The parcel currently slopes at
James Engineering, Inc. 125 Great Rock Road, Hanover, Ma 02339
3
a 5+hor:1vert slope down from elevation 52.0 at the top of the lot to elevation 135.0 at the edge of the rain garden. This slope is currently lightly grass covered. The flow from the rain garden is split and flows either directly across the driveway towards the stream with extremely larger flows being directed into a detention basin located just west of the northwest corner of our lot. At the top of the lot in front of the existing dwelling, the lot is primarily a bare gravel surface that allows vehicular access to the dwelling. The proposed development will be 2 3-bedroom single-family dwellings which will be accessed from whiting street by a common drive that will come into the site at the southerly edge of the parcel where the existing gravel driveway is located. The common driveway will be paved and will be sloped back towards Whiting Street. The driveway will be 110’+ long, with a 20’ wide travel lane and a 12” cape cod berm along the northerly edge. A catch basin will be located at station 0+21 which will collect the runoff from most of the common driveway and the individual parking areas for each lot and direct it into an infiltration trench. The catch basin will be equipped with an insert that will treat the runoff prior to discharge into the infiltration chambers. The first dwelling will be located 29.7’ off of the whiting street right of way and completely out of the riverfront area. The 2nd house will be located 140.3’ off of the whiting street layout and will be 133’ from the top of bank outside of the inner riparian zone and outside of the 100’ buffer to the vegetated wetlands. A drywell will be provided for the roof runoff.
James Engineering, Inc. 125 Great Rock Road, Hanover, Ma 02339
4
Existing Conditions The limits of the watershed analysis will extend to the property line for both existing and proposed conditions. Runoff from the site will flow in 4 directions.
Towards Route 53 Towards the derby brook upper rain garden Towards the derby brook lower rain garden Towards the stream away from the derby brook improvements.
Ultimately, all of the runoff from the site will flow into the stream behind the site. We will look at the total runoff from the site to ensure that peak flow rates are not increased off site and we will also look at the flows directed into the derby brook stormwater improvements to ensure that they are not impacted by the development. 1S To Whiting Street Drainage Area- 10,790.0 sq. ft. 0.25 acres Land Use Use Area (s.f.) CN Grass-fair 4,890 49 Driveway 5,900 96 Tc Use 6 minutes as a minimum 2S To Derby Brook Rain Garden Drainage Area- 14,854.3 sq. ft. 0.34 acres Land Use Use Area (s.f.) CN Gravel drive 1,754 96 Meadow 13,100 49 Tc Sheet flow 48’ s=0.01 grass, short Shallow concentrated flow 70’ s=0.25 short grass
James Engineering, Inc. 125 Great Rock Road, Hanover, Ma 02339
5
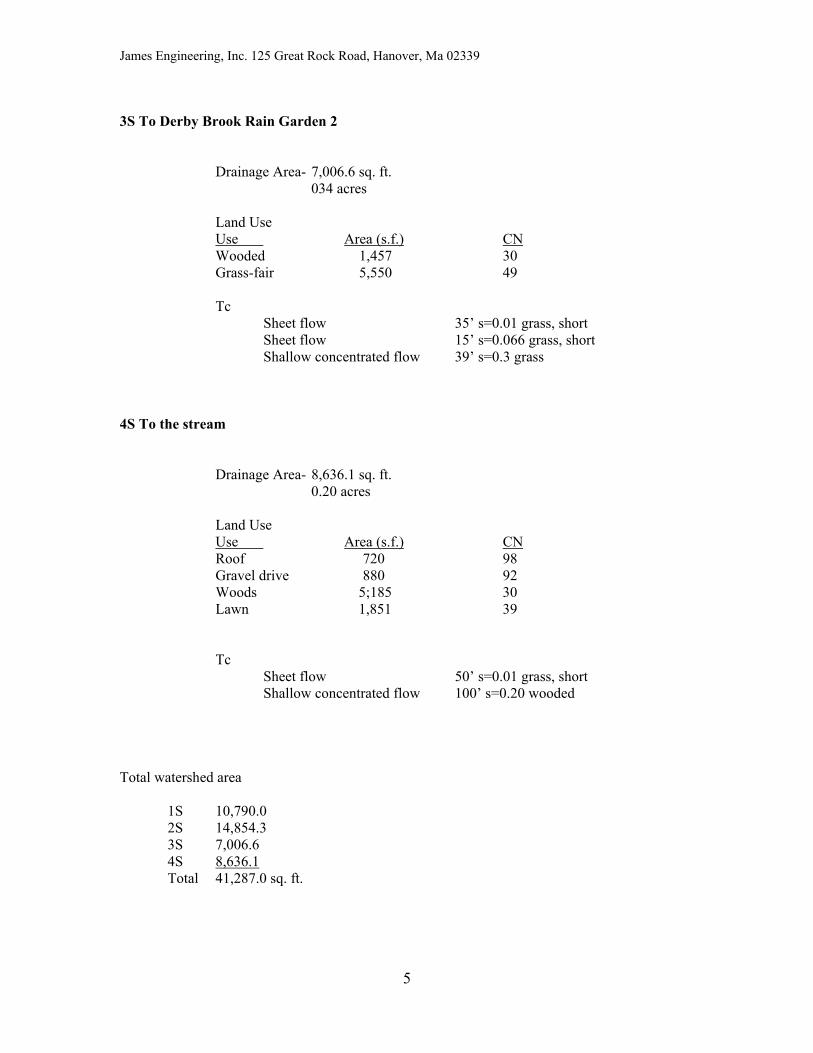
3S To Derby Brook Rain Garden 2 Drainage Area- 7,006.6 sq. ft. 034 acres Land Use Use Area (s.f.) CN Wooded 1,457 30 Grass-fair 5,550 49 Tc Sheet flow 35’ s=0.01 grass, short Sheet flow 15’ s=0.066 grass, short Shallow concentrated flow 39’ s=0.3 grass 4S To the stream Drainage Area- 8,636.1 sq. ft. 0.20 acres Land Use Use Area (s.f.) CN Roof 720 98 Gravel drive 880 92 Woods 5;185 30 Lawn 1,851 39 Tc Sheet flow 50’ s=0.01 grass, short Shallow concentrated flow 100’ s=0.20 wooded Total watershed area
1S 10,790.0 2S 14,854.3 3S 7,006.6 4S 8,636.1 Total 41,287.0 sq. ft.
James Engineering, Inc. 125 Great Rock Road, Hanover, Ma 02339
6
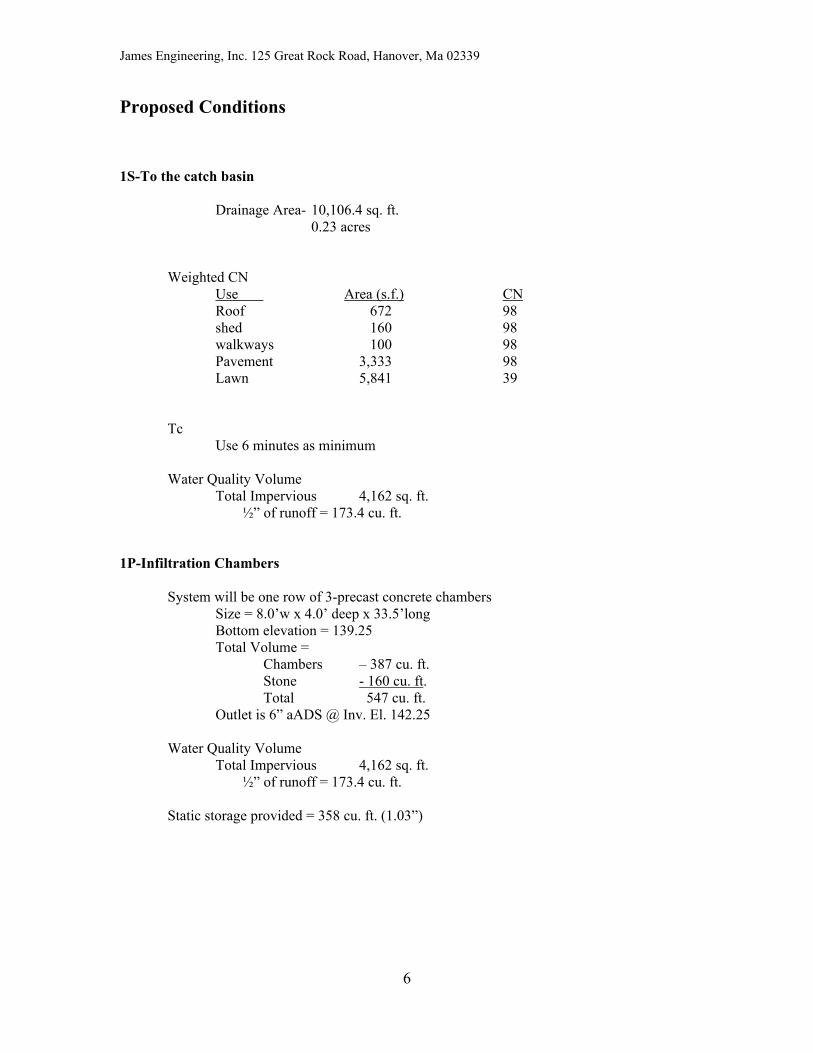
Proposed Conditions 1S-To the catch basin Drainage Area- 10,106.4 sq. ft. 0.23 acres
Weighted CN Use Area (s.f.) CN Roof 672 98 shed 160 98 walkways 100 98 Pavement 3,333 98 Lawn 5,841 39
Tc Use 6 minutes as minimum
Water Quality Volume Total Impervious 4,162 sq. ft.
½” of runoff = 173.4 cu. ft. 1P-Infiltration Chambers System will be one row of 3-precast concrete chambers Size = 8.0’w x 4.0’ deep x 33.5’long Bottom elevation = 139.25 Total Volume = Chambers – 387 cu. ft. Stone - 160 cu. ft. Total 547 cu. ft. Outlet is 6” aADS @ Inv. El. 142.25
Water Quality Volume Total Impervious 4,162 sq. ft.
½” of runoff = 173.4 cu. ft. Static storage provided = 358 cu. ft. (1.03”)
James Engineering, Inc. 125 Great Rock Road, Hanover, Ma 02339
7
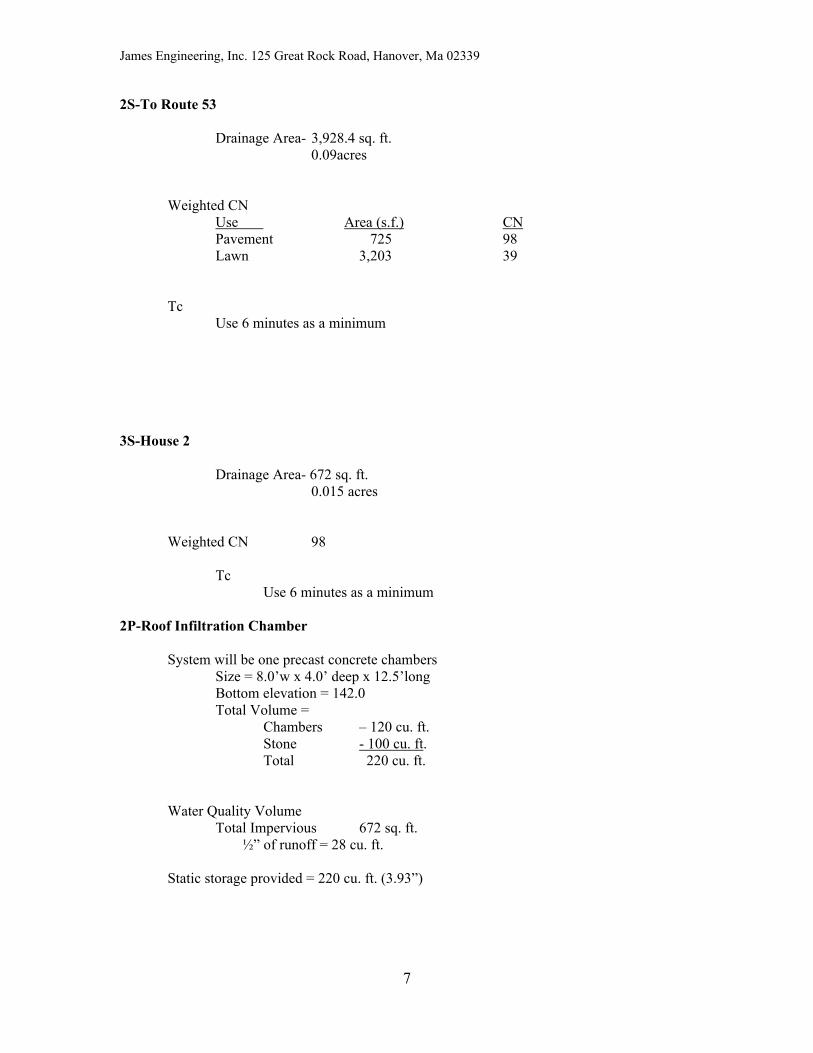
2S-To Route 53 Drainage Area- 3,928.4 sq. ft. 0.09acres
Weighted CN Use Area (s.f.) CN Pavement 725 98 Lawn 3,203 39
Tc Use 6 minutes as a minimum 3S-House 2 Drainage Area- 672 sq. ft. 0.015 acres
Weighted CN 98 Tc Use 6 minutes as a minimum 2P-Roof Infiltration Chamber System will be one precast concrete chambers Size = 8.0’w x 4.0’ deep x 12.5’long Bottom elevation = 142.0 Total Volume = Chambers – 120 cu. ft. Stone - 100 cu. ft. Total 220 cu. ft.
Water Quality Volume Total Impervious 672 sq. ft.
½” of runoff = 28 cu. ft. Static storage provided = 220 cu. ft. (3.93”)
James Engineering, Inc. 125 Great Rock Road, Hanover, Ma 02339
8
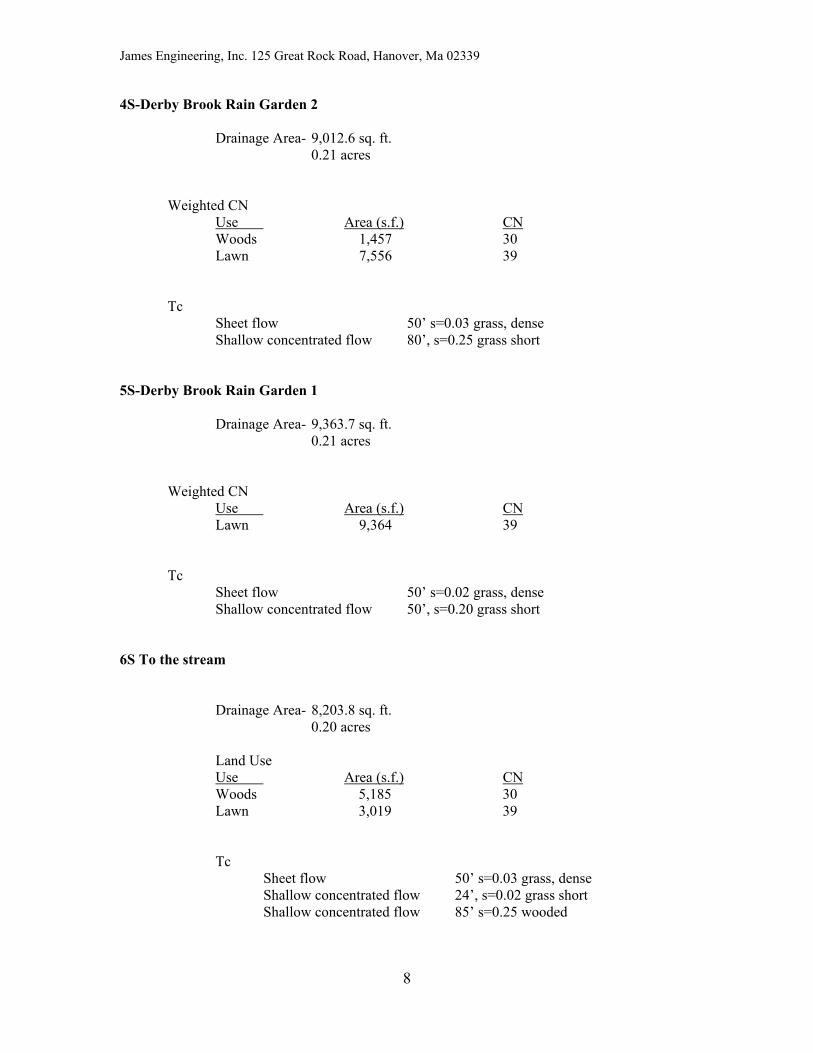
4S-Derby Brook Rain Garden 2 Drainage Area- 9,012.6 sq. ft. 0.21 acres
Weighted CN Use Area (s.f.) CN Woods 1,457 30 Lawn 7,556 39
Tc Sheet flow 50’ s=0.03 grass, dense Shallow concentrated flow 80’, s=0.25 grass short 5S-Derby Brook Rain Garden 1 Drainage Area- 9,363.7 sq. ft. 0.21 acres
Weighted CN Use Area (s.f.) CN Lawn 9,364 39
Tc Sheet flow 50’ s=0.02 grass, dense Shallow concentrated flow 50’, s=0.20 grass short 6S To the stream Drainage Area- 8,203.8 sq. ft. 0.20 acres Land Use Use Area (s.f.) CN Woods 5,185 30 Lawn 3,019 39 Tc Sheet flow 50’ s=0.03 grass, dense Shallow concentrated flow 24’, s=0.02 grass short Shallow concentrated flow 85’ s=0.25 wooded
James Engineering, Inc. 125 Great Rock Road, Hanover, Ma 02339
9
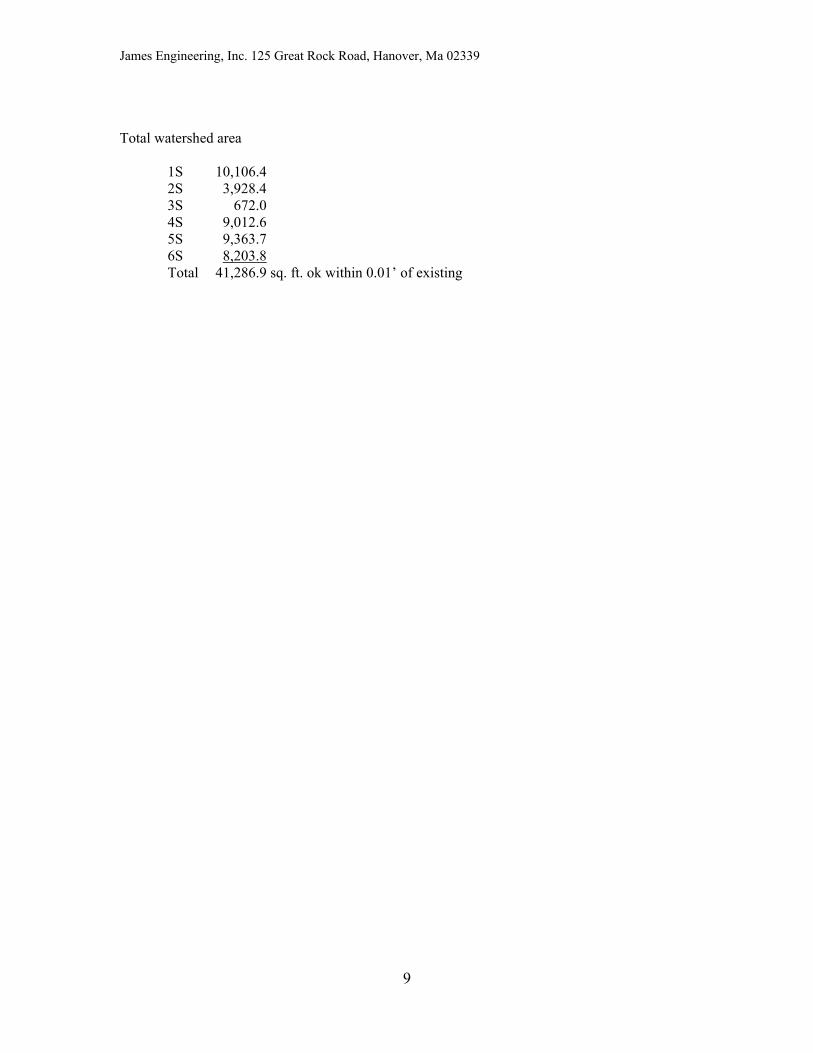
Total watershed area
1S 10,106.4 2S 3,928.4 3S 672.0 4S 9,012.6 5S 9,363.7 6S 8,203.8 Total 41,286.9 sq. ft. ok within 0.01’ of existing

James Engineering, Inc. 125 Great Rock Road, Hanover, Ma 02339
10
Storm Water Standards Standard No. 1, Untreated Discharges The proposed storm water system will collect and treat the runoff from nearly all the proposed impervious surfaces in the development. Approximately 600 square feet of the driveway pavement is too close to the existing pavement in Whiting Street to be collected and routed to the infiltration chamber system. This area will be partially treated by the new catch basin. 150 square feet of the new driveway pavement to this catch basin is in the right of way. I consider the remaining 600 square feet of pavement on the lot not treated to the full extent of the standards deminimus in comparison with the remainder of the impervious surfaces in the watershed. Standard No. 2, Peak Discharge Rates The development of the lot did not modify the land use of the lot significantly. Most of the area used in the development had already been altered by prior development. Final development of the lot will actually heal some of the scars of the prior use and maintenance. Accordingly, all of the flows in each direction have been reduced significantly. To Derby Brook
To Whiting Street Existing Proposed Difference 2 Year Storm 0.32 cfs 0.0 -99.9% 10 Year Storm 0.65 cfs 0.04 cfs -93.8% 25 Year Storm 0.84 cfs 0.22 cfs -73.8% 100 Year Storm 1.20 cfs 0.73 cfs -39.1% To Stream Existing Proposed Difference 2 Year Storm 0.0 cfs 0.0 cfs -99.9% 10 Year Storm 0.02 cfs 0.002 cfs -90.0% 25 Year Storm 0.06 cfs 0.006 cfs -90.0% 100 Year Storm 0.18 cfs 0.02 cfs -88.9%
Site Total Existing Proposed Difference 2 Year Storm 0.04cfs 0.0 cfs -99.9% 10 Year Storm 0.25 cfs 0.01 cfs -96.0% 25 Year Storm 0.41 cfs 0.04 cfs -90.0% 100 Year Storm 0.78 cfs 0.15 cfs -80.7%
Site Total Existing Proposed Difference 2 Year Storm 0.04cfs 0.0 cfs -99.9% 10 Year Storm 0.25 cfs 0.01 cfs -96.0% 25 Year Storm 0.41 cfs 0.04 cfs -90.0% 100 Year Storm 0.78 cfs 0.15 cfs -80.7%

James Engineering, Inc. 125 Great Rock Road, Hanover, Ma 02339
11
Standard No. 3, Recharge The proposed infiltration chambers and the roof system for 302 whiting will provide all of the infiltration capacity required. This volume is: Static Storage Provided Chamber system 358 cu. ft. Roof system 220 cu. ft. Required infiltration 0.65” Impervious area 5,406 sq. ft. Infiltration volume required 292.8 cu. ft.
Standard No. 4, Water Quality There are only 2 treatment trains. The driveway system and the roof drywell for 302 Whiting. The pretreatment for the chamber system will be provided by the fabco filter. Driveway Item Description Removal rate Actual removal Remaining Total Removal Chamber system 80% 80% 20 % 80 % Roof runoff Item Description Removal rate Actual removal Remaining Total Removal Drywell 80% 80% 20% 80%
Standard No. 5, Land Use with Higher Potential Pollution Loads This standard is not applicable to a residential lot Standard No. 6, Critical Areas This standard is not applicable to this site
James Engineering, Inc. 125 Great Rock Road, Hanover, Ma 02339
12
Standard No. 7, Redevelopment This standard is partially applicable to this site; however, no credits have been taken Standard No. 8, Construction Period Pollution Control The site does not qualify under the NPDES CGP. Accordingly, a Storm Water Pollution Prevention Plan is not required. 12” mulch logs will be placed along the lower edge of the development area to prevent sediment transport on to the abutting lot and the wetland resources. The existing gravel driveway will be used as primary access onto the site and will provide the track pad required. Once disturbed for installation of the utilities, a 50’ long pad of 1-1/2” aggregate will be placed on the construction access. Standard No. 9, Operation and Maintenance The O & M manual for the lot is attached hereto Standard No. 10, Illicit Discharge statement I do hereby certify that there are no illicit discharges proposed on site. ___________________________________ Gary D. James, P.E.

James Engineering, Inc. 125 Great Rock Road, Hanover, Ma 02339
13
Existing Conditions Hydro-Cad Printout
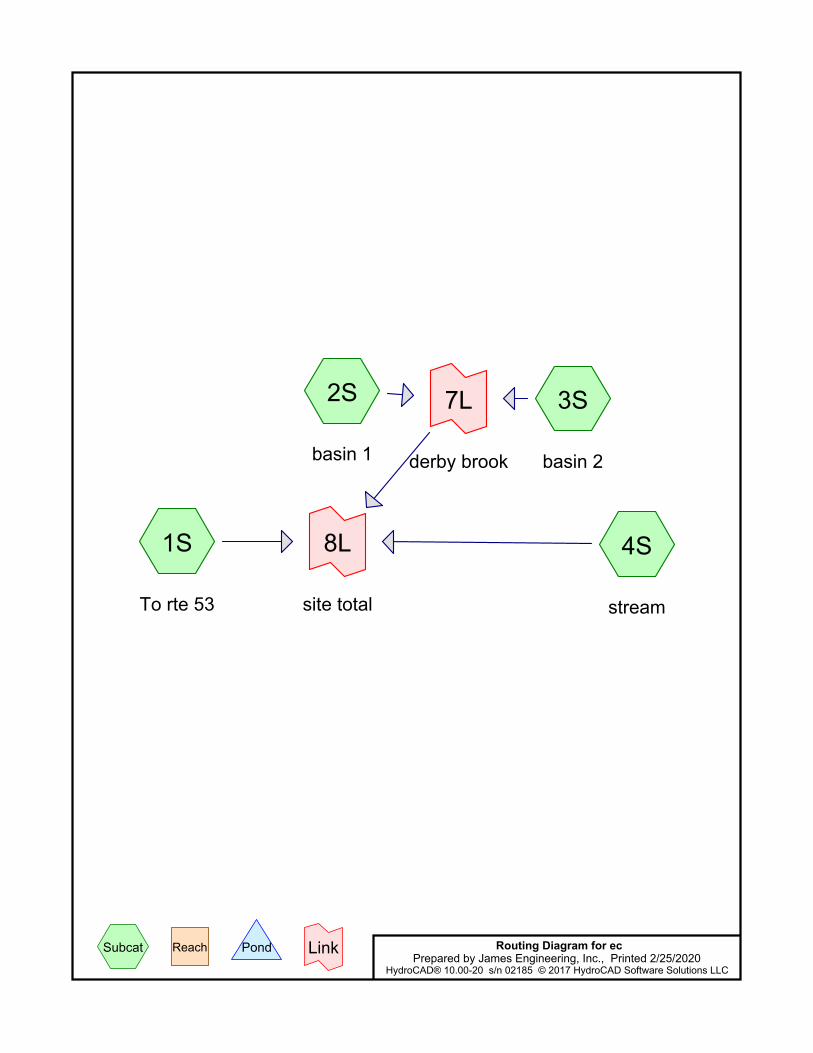
1S
To rte 53
2S
basin 1
3S
basin 2
4S
stream
7L
derby brook
8L
site total
Routing Diagram for ecPrepared by James Engineering, Inc., Printed 2/25/2020
HydroCAD® 10.00-20 s/n 02185 © 2017 HydroCAD Software Solutions LLC
Subcat Reach Pond Link

ec Printed 2/25/2020Prepared by James Engineering, Inc.
Page 2HydroCAD® 10.00-20 s/n 02185 © 2017 HydroCAD Software Solutions LLC
Area Listing (all nodes)
Area(acres)
CN Description(subcatchment-numbers)
0.413 49 50-75% Grass cover, Fair, HSG A (1S, 2S)0.170 39 >75% Grass cover, Good, HSG A (3S, 4S)0.196 96 Gravel surface, HSG A (1S, 2S, 4S)0.017 98 Roofs, HSG A (4S)0.152 30 Woods, Good, HSG A (3S, 4S)
0.948 55 TOTAL AREA
ec Printed 2/25/2020Prepared by James Engineering, Inc.
Page 3HydroCAD® 10.00-20 s/n 02185 © 2017 HydroCAD Software Solutions LLC
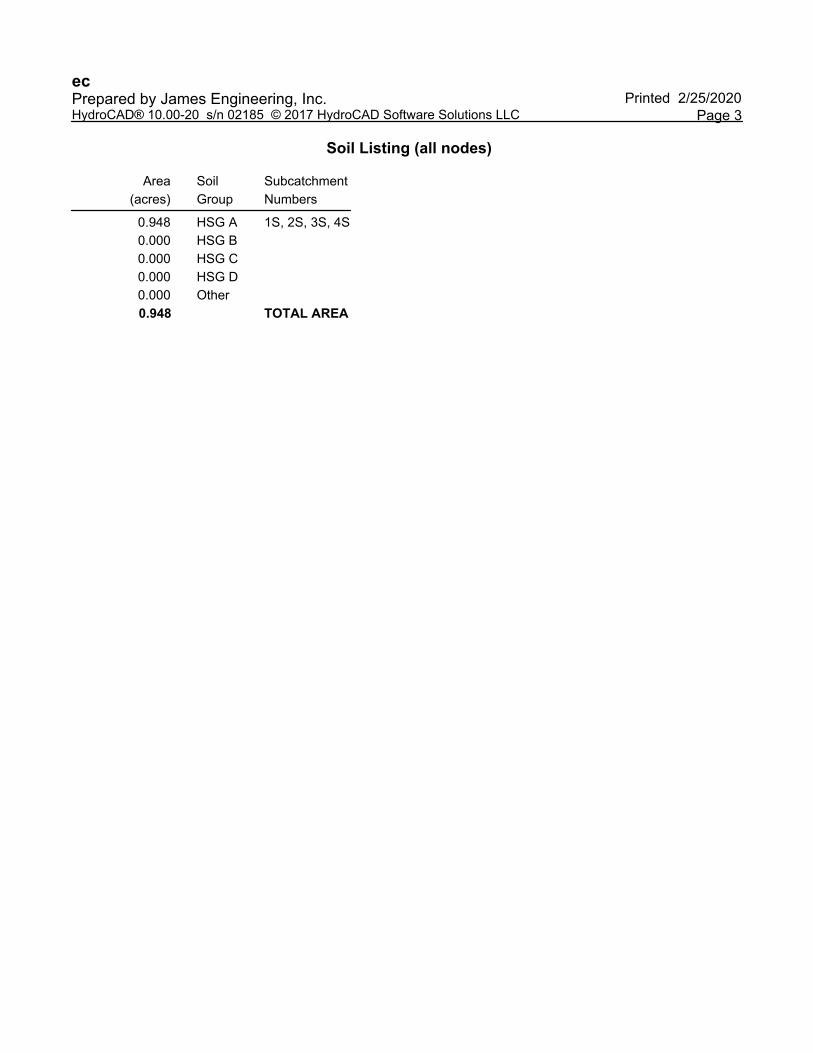
Soil Listing (all nodes)
Area(acres)
SoilGroup
SubcatchmentNumbers
0.948 HSG A 1S, 2S, 3S, 4S0.000 HSG B0.000 HSG C0.000 HSG D0.000 Other
0.948 TOTAL AREA
ec Printed 2/25/2020Prepared by James Engineering, Inc.
Page 4HydroCAD® 10.00-20 s/n 02185 © 2017 HydroCAD Software Solutions LLC
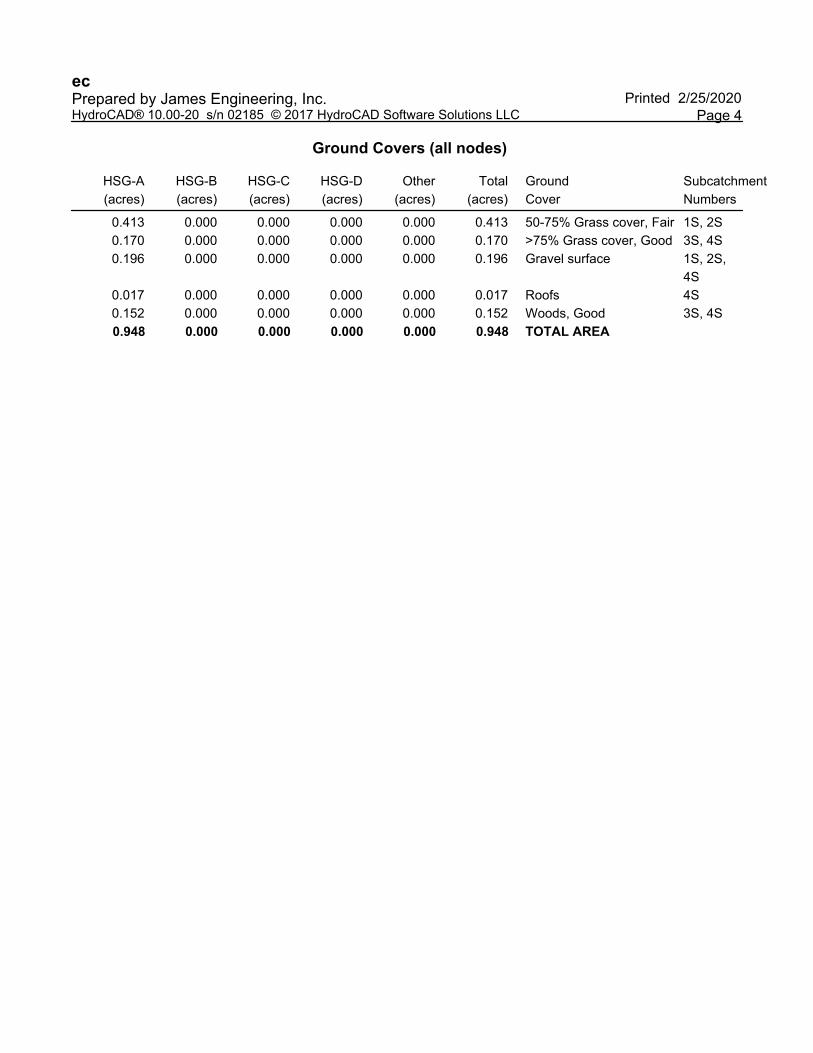
Ground Covers (all nodes)
HSG-A(acres)
HSG-B(acres)
HSG-C(acres)
HSG-D(acres)
Other(acres)
Total(acres)
GroundCover
SubcatchmentNumbers
0.413 0.000 0.000 0.000 0.000 0.413 50-75% Grass cover, Fair 1S, 2S0.170 0.000 0.000 0.000 0.000 0.170 >75% Grass cover, Good 3S, 4S0.196 0.000 0.000 0.000 0.000 0.196 Gravel surface 1S, 2S,
4S0.017 0.000 0.000 0.000 0.000 0.017 Roofs 4S0.152 0.000 0.000 0.000 0.000 0.152 Woods, Good 3S, 4S
0.948 0.000 0.000 0.000 0.000 0.948 TOTAL AREA
Type III 24-hr 2-Yr Rainfall=3.30"ec Printed 2/25/2020Prepared by James Engineering, Inc.
Page 5HydroCAD® 10.00-20 s/n 02185 © 2017 HydroCAD Software Solutions LLC
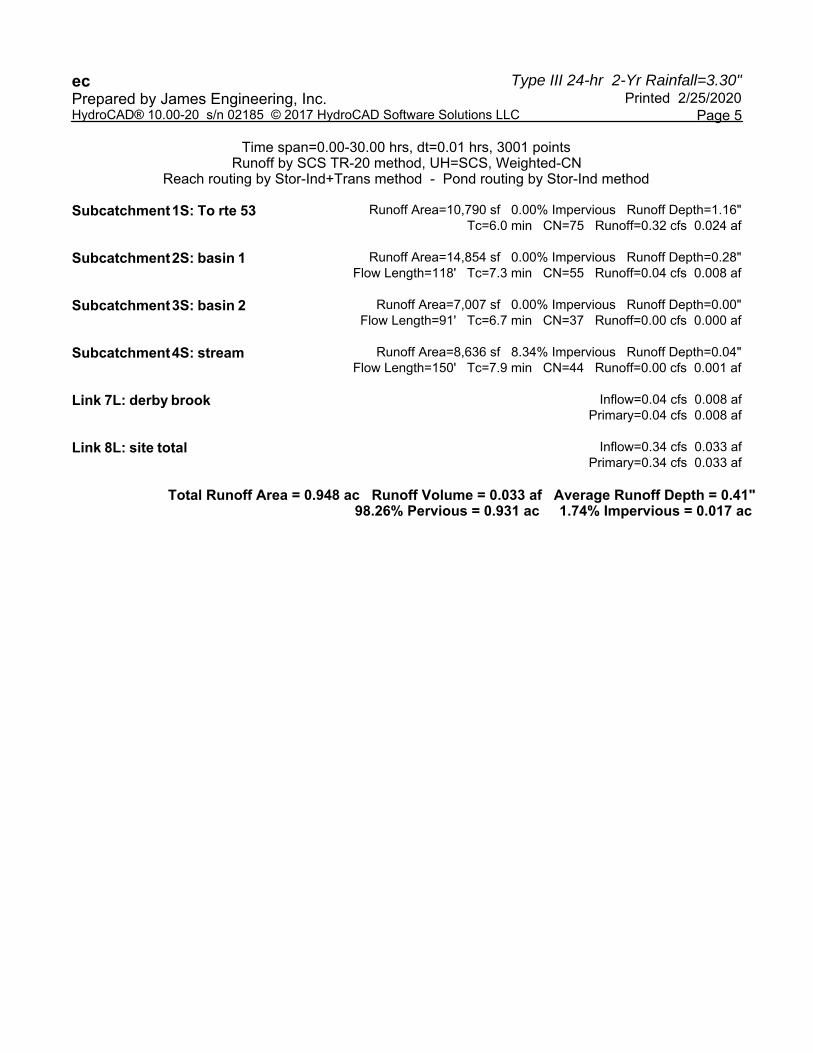
Time span=0.00-30.00 hrs, dt=0.01 hrs, 3001 pointsRunoff by SCS TR-20 method, UH=SCS, Weighted-CN
Reach routing by Stor-Ind+Trans method - Pond routing by Stor-Ind method
Runoff Area=10,790 sf 0.00% Impervious Runoff Depth=1.16"Subcatchment 1S: To rte 53 Tc=6.0 min CN=75 Runoff=0.32 cfs 0.024 af
Runoff Area=14,854 sf 0.00% Impervious Runoff Depth=0.28"Subcatchment 2S: basin 1 Flow Length=118' Tc=7.3 min CN=55 Runoff=0.04 cfs 0.008 af
Runoff Area=7,007 sf 0.00% Impervious Runoff Depth=0.00"Subcatchment 3S: basin 2 Flow Length=91' Tc=6.7 min CN=37 Runoff=0.00 cfs 0.000 af
Runoff Area=8,636 sf 8.34% Impervious Runoff Depth=0.04"Subcatchment 4S: stream Flow Length=150' Tc=7.9 min CN=44 Runoff=0.00 cfs 0.001 af
Inflow=0.04 cfs 0.008 afLink 7L: derby brook Primary=0.04 cfs 0.008 af
Inflow=0.34 cfs 0.033 afLink 8L: site total Primary=0.34 cfs 0.033 af
Total Runoff Area = 0.948 ac Runoff Volume = 0.033 af Average Runoff Depth = 0.41"98.26% Pervious = 0.931 ac 1.74% Impervious = 0.017 ac
Type III 24-hr 2-Yr Rainfall=3.30"ec Printed 2/25/2020Prepared by James Engineering, Inc.
Page 6HydroCAD® 10.00-20 s/n 02185 © 2017 HydroCAD Software Solutions LLC
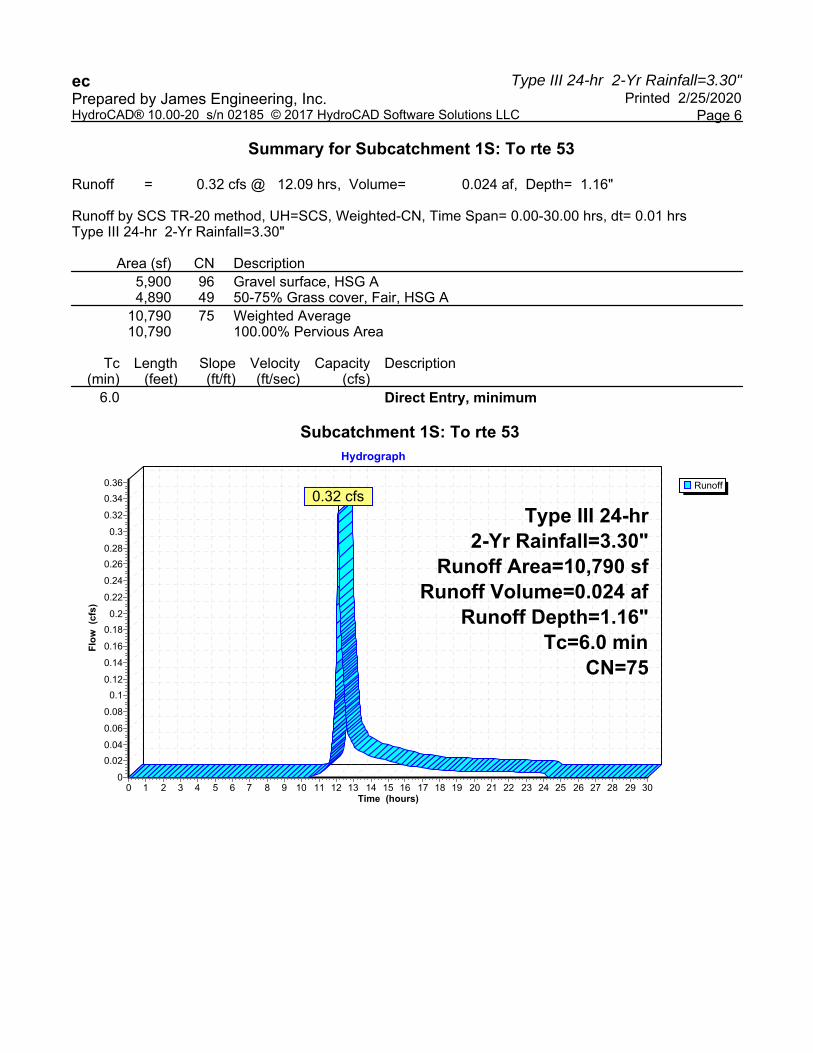
Summary for Subcatchment 1S: To rte 53
Runoff = 0.32 cfs @ 12.09 hrs, Volume= 0.024 af, Depth= 1.16"
Runoff by SCS TR-20 method, UH=SCS, Weighted-CN, Time Span= 0.00-30.00 hrs, dt= 0.01 hrsType III 24-hr 2-Yr Rainfall=3.30"
Area (sf) CN Description5,900 96 Gravel surface, HSG A4,890 49 50-75% Grass cover, Fair, HSG A
10,790 75 Weighted Average10,790 100.00% Pervious Area
Tc Length Slope Velocity Capacity Description(min) (feet) (ft/ft) (ft/sec) (cfs)
6.0 Direct Entry, minimum
Subcatchment 1S: To rte 53
Runoff
Hydrograph
Time (hours)3029282726252423222120191817161514131211109876543210
Flo
w (
cfs)
0.36
0.34
0.32
0.3
0.28
0.26
0.24
0.22
0.2
0.18
0.16
0.14
0.12
0.1
0.08
0.06
0.04
0.02
0
Type III 24-hr2-Yr Rainfall=3.30"
Runoff Area=10,790 sfRunoff Volume=0.024 af
Runoff Depth=1.16"Tc=6.0 min
CN=75
0.32 cfs
Type III 24-hr 2-Yr Rainfall=3.30"ec Printed 2/25/2020Prepared by James Engineering, Inc.
Page 7HydroCAD® 10.00-20 s/n 02185 © 2017 HydroCAD Software Solutions LLC
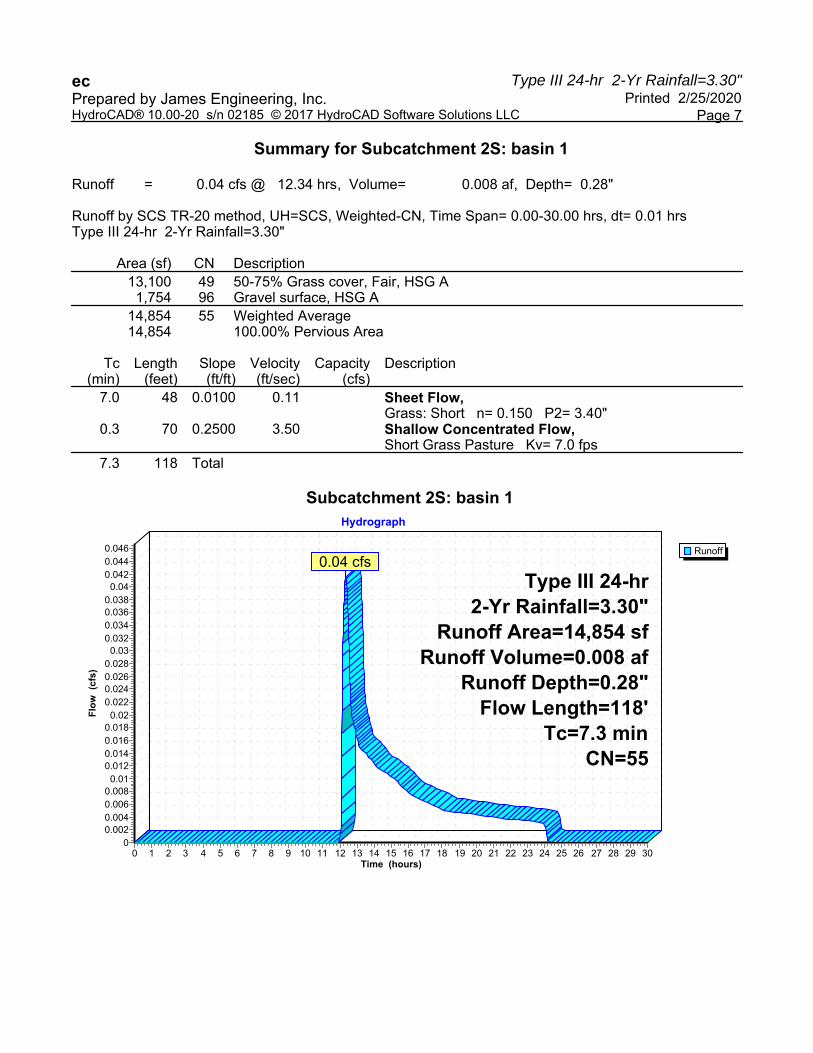
Summary for Subcatchment 2S: basin 1
Runoff = 0.04 cfs @ 12.34 hrs, Volume= 0.008 af, Depth= 0.28"
Runoff by SCS TR-20 method, UH=SCS, Weighted-CN, Time Span= 0.00-30.00 hrs, dt= 0.01 hrsType III 24-hr 2-Yr Rainfall=3.30"
Area (sf) CN Description13,100 49 50-75% Grass cover, Fair, HSG A
1,754 96 Gravel surface, HSG A14,854 55 Weighted Average14,854 100.00% Pervious Area
Tc Length Slope Velocity Capacity Description(min) (feet) (ft/ft) (ft/sec) (cfs)
7.0 48 0.0100 0.11 Sheet Flow, Grass: Short n= 0.150 P2= 3.40"
0.3 70 0.2500 3.50 Shallow Concentrated Flow, Short Grass Pasture Kv= 7.0 fps
7.3 118 Total
Subcatchment 2S: basin 1
Runoff
Hydrograph
Time (hours)3029282726252423222120191817161514131211109876543210
Flo
w (
cfs)
0.0460.0440.042
0.040.0380.0360.0340.032
0.030.0280.0260.0240.022
0.020.0180.0160.0140.012
0.010.0080.0060.0040.002
0
Type III 24-hr2-Yr Rainfall=3.30"
Runoff Area=14,854 sfRunoff Volume=0.008 af
Runoff Depth=0.28"Flow Length=118'
Tc=7.3 minCN=55
0.04 cfs

Type III 24-hr 2-Yr Rainfall=3.30"ec Printed 2/25/2020Prepared by James Engineering, Inc.
Page 8HydroCAD® 10.00-20 s/n 02185 © 2017 HydroCAD Software Solutions LLC
Summary for Subcatchment 3S: basin 2
[45] Hint: Runoff=Zero
Runoff = 0.00 cfs @ 0.00 hrs, Volume= 0.000 af, Depth= 0.00"
Runoff by SCS TR-20 method, UH=SCS, Weighted-CN, Time Span= 0.00-30.00 hrs, dt= 0.01 hrsType III 24-hr 2-Yr Rainfall=3.30"
Area (sf) CN Description1,457 30 Woods, Good, HSG A5,550 39 >75% Grass cover, Good, HSG A7,007 37 Weighted Average7,007 100.00% Pervious Area
Tc Length Slope Velocity Capacity Description(min) (feet) (ft/ft) (ft/sec) (cfs)
5.4 35 0.0100 0.11 Sheet Flow, Grass: Short n= 0.150 P2= 3.40"
1.1 16 0.1250 0.25 Sheet Flow, Grass: Short n= 0.150 P2= 3.40"
0.2 40 0.3000 3.83 Shallow Concentrated Flow, Short Grass Pasture Kv= 7.0 fps
6.7 91 Total
Subcatchment 3S: basin 2
Runoff
Hydrograph
Time (hours)3029282726252423222120191817161514131211109876543210
Flo
w (
cfs)
1
0
Type III 24-hr2-Yr Rainfall=3.30"
Runoff Area=7,007 sfRunoff Volume=0.000 af
Runoff Depth=0.00"Flow Length=91'
Tc=6.7 minCN=37
0.00 cfs
Type III 24-hr 2-Yr Rainfall=3.30"ec Printed 2/25/2020Prepared by James Engineering, Inc.
Page 9HydroCAD® 10.00-20 s/n 02185 © 2017 HydroCAD Software Solutions LLC
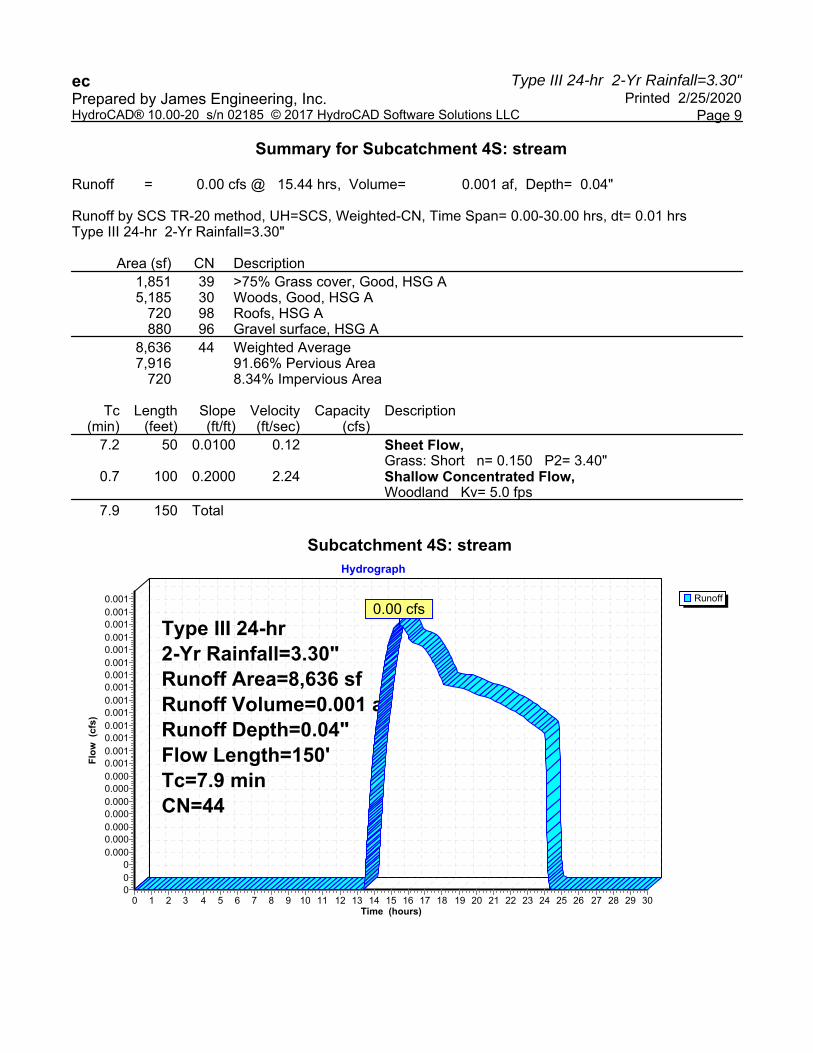
Summary for Subcatchment 4S: stream
Runoff = 0.00 cfs @ 15.44 hrs, Volume= 0.001 af, Depth= 0.04"
Runoff by SCS TR-20 method, UH=SCS, Weighted-CN, Time Span= 0.00-30.00 hrs, dt= 0.01 hrsType III 24-hr 2-Yr Rainfall=3.30"
Area (sf) CN Description1,851 39 >75% Grass cover, Good, HSG A5,185 30 Woods, Good, HSG A
720 98 Roofs, HSG A880 96 Gravel surface, HSG A
8,636 44 Weighted Average7,916 91.66% Pervious Area
720 8.34% Impervious Area
Tc Length Slope Velocity Capacity Description(min) (feet) (ft/ft) (ft/sec) (cfs)
7.2 50 0.0100 0.12 Sheet Flow, Grass: Short n= 0.150 P2= 3.40"
0.7 100 0.2000 2.24 Shallow Concentrated Flow, Woodland Kv= 5.0 fps
7.9 150 Total
Subcatchment 4S: stream
Runoff
Hydrograph
Time (hours)3029282726252423222120191817161514131211109876543210
Flo
w (
cfs)
0.0010.0010.0010.0010.0010.0010.0010.0010.0010.0010.0010.0010.0010.0010.0000.0000.0000.0000.0000.0000.000
000
Type III 24-hr2-Yr Rainfall=3.30"Runoff Area=8,636 sfRunoff Volume=0.001 afRunoff Depth=0.04"Flow Length=150'Tc=7.9 minCN=44
0.00 cfs
Type III 24-hr 2-Yr Rainfall=3.30"ec Printed 2/25/2020Prepared by James Engineering, Inc.
Page 10HydroCAD® 10.00-20 s/n 02185 © 2017 HydroCAD Software Solutions LLC
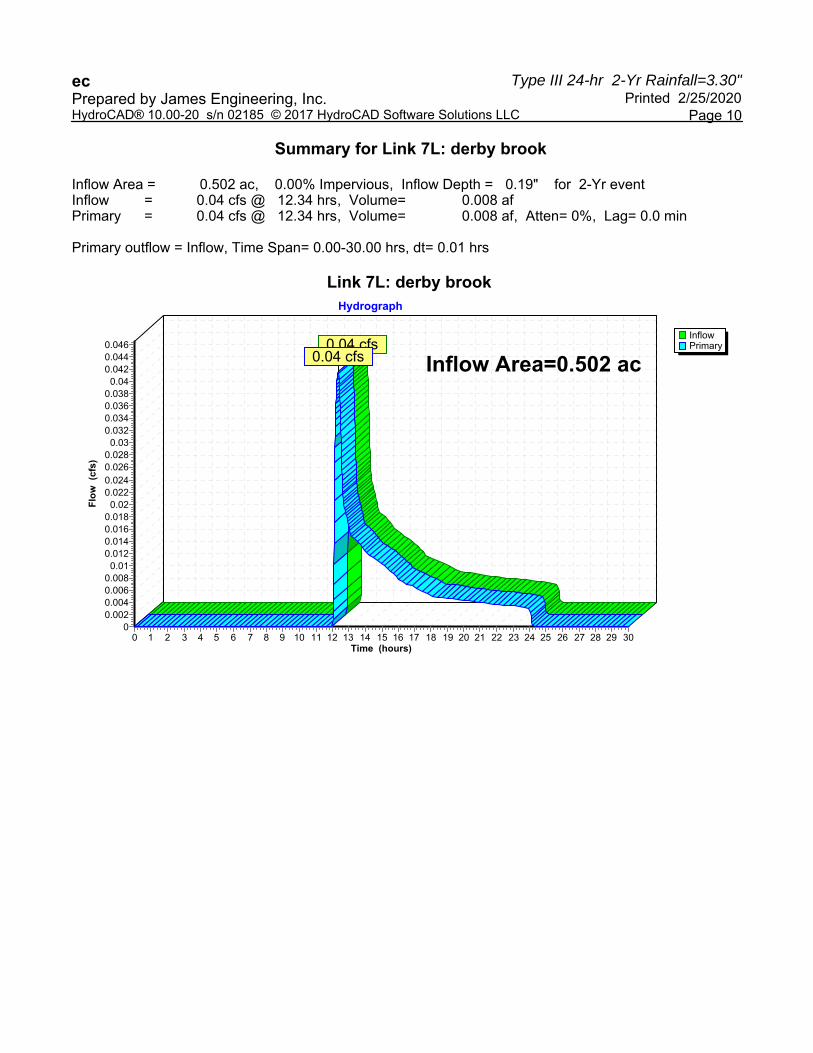
Summary for Link 7L: derby brook
Inflow Area = 0.502 ac, 0.00% Impervious, Inflow Depth = 0.19" for 2-Yr eventInflow = 0.04 cfs @ 12.34 hrs, Volume= 0.008 afPrimary = 0.04 cfs @ 12.34 hrs, Volume= 0.008 af, Atten= 0%, Lag= 0.0 min
Primary outflow = Inflow, Time Span= 0.00-30.00 hrs, dt= 0.01 hrs
Link 7L: derby brook
InflowPrimary
Hydrograph
Time (hours)3029282726252423222120191817161514131211109876543210
Flo
w (
cfs)
0.0460.0440.042
0.040.0380.0360.0340.032
0.030.0280.0260.0240.022
0.020.0180.0160.0140.012
0.010.0080.0060.0040.002
0
Inflow Area=0.502 ac0.04 cfs
0.04 cfs

Type III 24-hr 2-Yr Rainfall=3.30"ec Printed 2/25/2020Prepared by James Engineering, Inc.
Page 11HydroCAD® 10.00-20 s/n 02185 © 2017 HydroCAD Software Solutions LLC
Summary for Link 8L: site total
Inflow Area = 0.948 ac, 1.74% Impervious, Inflow Depth = 0.41" for 2-Yr eventInflow = 0.34 cfs @ 12.10 hrs, Volume= 0.033 afPrimary = 0.34 cfs @ 12.10 hrs, Volume= 0.033 af, Atten= 0%, Lag= 0.0 min
Primary outflow = Inflow, Time Span= 0.00-30.00 hrs, dt= 0.01 hrs
Link 8L: site total
InflowPrimary
Hydrograph
Time (hours)3029282726252423222120191817161514131211109876543210
Flo
w (
cfs)
0.36
0.34
0.32
0.3
0.28
0.26
0.24
0.22
0.2
0.18
0.16
0.14
0.12
0.1
0.08
0.06
0.04
0.02
0
Inflow Area=0.948 ac0.34 cfs
0.34 cfs
Type III 24-hr 10-Yr Rainfall=4.75"ec Printed 2/25/2020Prepared by James Engineering, Inc.
Page 12HydroCAD® 10.00-20 s/n 02185 © 2017 HydroCAD Software Solutions LLC
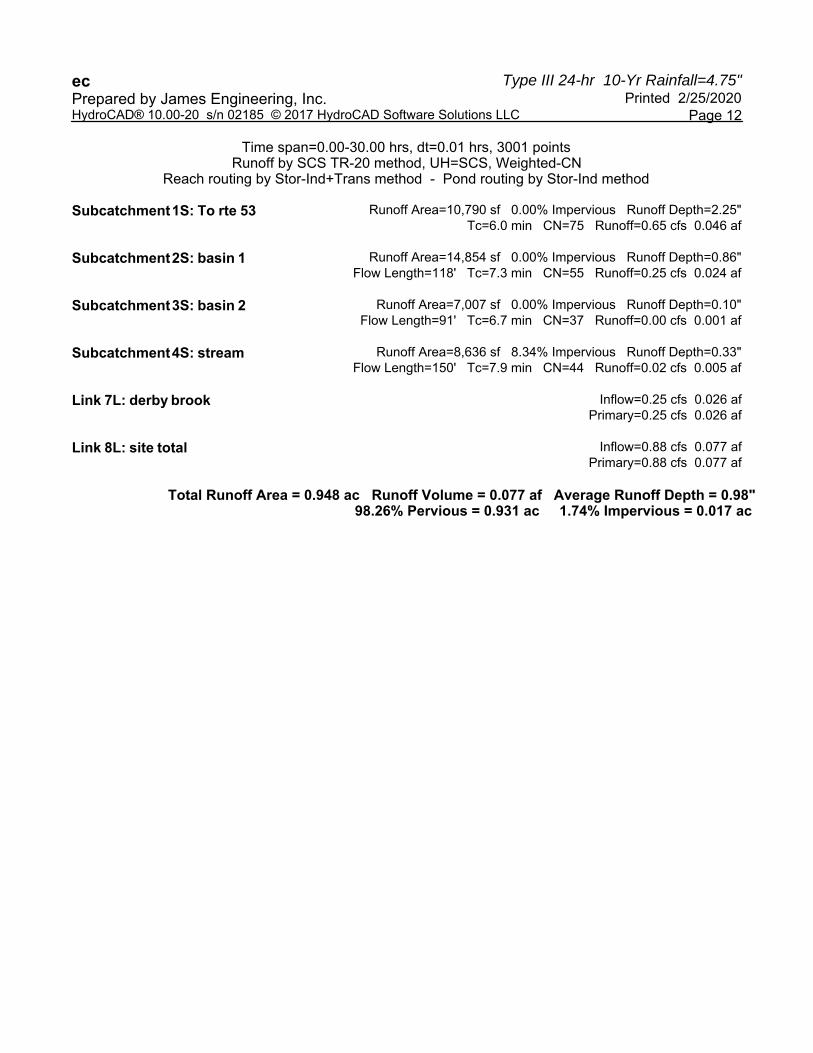
Time span=0.00-30.00 hrs, dt=0.01 hrs, 3001 pointsRunoff by SCS TR-20 method, UH=SCS, Weighted-CN
Reach routing by Stor-Ind+Trans method - Pond routing by Stor-Ind method
Runoff Area=10,790 sf 0.00% Impervious Runoff Depth=2.25"Subcatchment 1S: To rte 53 Tc=6.0 min CN=75 Runoff=0.65 cfs 0.046 af
Runoff Area=14,854 sf 0.00% Impervious Runoff Depth=0.86"Subcatchment 2S: basin 1 Flow Length=118' Tc=7.3 min CN=55 Runoff=0.25 cfs 0.024 af
Runoff Area=7,007 sf 0.00% Impervious Runoff Depth=0.10"Subcatchment 3S: basin 2 Flow Length=91' Tc=6.7 min CN=37 Runoff=0.00 cfs 0.001 af
Runoff Area=8,636 sf 8.34% Impervious Runoff Depth=0.33"Subcatchment 4S: stream Flow Length=150' Tc=7.9 min CN=44 Runoff=0.02 cfs 0.005 af
Inflow=0.25 cfs 0.026 afLink 7L: derby brook Primary=0.25 cfs 0.026 af
Inflow=0.88 cfs 0.077 afLink 8L: site total Primary=0.88 cfs 0.077 af
Total Runoff Area = 0.948 ac Runoff Volume = 0.077 af Average Runoff Depth = 0.98"98.26% Pervious = 0.931 ac 1.74% Impervious = 0.017 ac

Type III 24-hr 10-Yr Rainfall=4.75"ec Printed 2/25/2020Prepared by James Engineering, Inc.
Page 13HydroCAD® 10.00-20 s/n 02185 © 2017 HydroCAD Software Solutions LLC
Summary for Subcatchment 1S: To rte 53
Runoff = 0.65 cfs @ 12.09 hrs, Volume= 0.046 af, Depth= 2.25"
Runoff by SCS TR-20 method, UH=SCS, Weighted-CN, Time Span= 0.00-30.00 hrs, dt= 0.01 hrsType III 24-hr 10-Yr Rainfall=4.75"
Area (sf) CN Description5,900 96 Gravel surface, HSG A4,890 49 50-75% Grass cover, Fair, HSG A
10,790 75 Weighted Average10,790 100.00% Pervious Area
Tc Length Slope Velocity Capacity Description(min) (feet) (ft/ft) (ft/sec) (cfs)
6.0 Direct Entry, minimum
Subcatchment 1S: To rte 53
Runoff
Hydrograph
Time (hours)3029282726252423222120191817161514131211109876543210
Flo
w (
cfs)
0.7
0.65
0.6
0.55
0.5
0.45
0.4
0.35
0.3
0.25
0.2
0.15
0.1
0.05
0
Type III 24-hr10-Yr Rainfall=4.75"
Runoff Area=10,790 sfRunoff Volume=0.046 af
Runoff Depth=2.25"Tc=6.0 min
CN=75
0.65 cfs
Type III 24-hr 10-Yr Rainfall=4.75"ec Printed 2/25/2020Prepared by James Engineering, Inc.
Page 14HydroCAD® 10.00-20 s/n 02185 © 2017 HydroCAD Software Solutions LLC
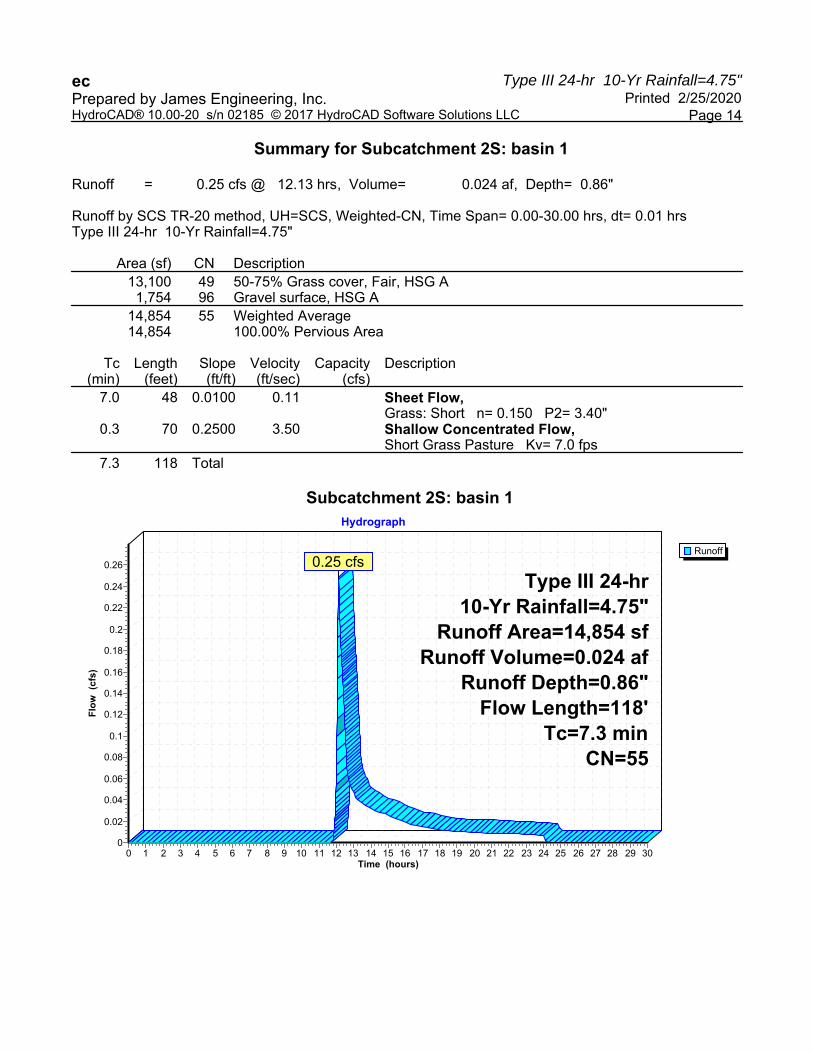
Summary for Subcatchment 2S: basin 1
Runoff = 0.25 cfs @ 12.13 hrs, Volume= 0.024 af, Depth= 0.86"
Runoff by SCS TR-20 method, UH=SCS, Weighted-CN, Time Span= 0.00-30.00 hrs, dt= 0.01 hrsType III 24-hr 10-Yr Rainfall=4.75"
Area (sf) CN Description13,100 49 50-75% Grass cover, Fair, HSG A
1,754 96 Gravel surface, HSG A14,854 55 Weighted Average14,854 100.00% Pervious Area
Tc Length Slope Velocity Capacity Description(min) (feet) (ft/ft) (ft/sec) (cfs)
7.0 48 0.0100 0.11 Sheet Flow, Grass: Short n= 0.150 P2= 3.40"
0.3 70 0.2500 3.50 Shallow Concentrated Flow, Short Grass Pasture Kv= 7.0 fps
7.3 118 Total
Subcatchment 2S: basin 1
Runoff
Hydrograph
Time (hours)3029282726252423222120191817161514131211109876543210
Flo
w (
cfs)
0.26
0.24
0.22
0.2
0.18
0.16
0.14
0.12
0.1
0.08
0.06
0.04
0.02
0
Type III 24-hr10-Yr Rainfall=4.75"
Runoff Area=14,854 sfRunoff Volume=0.024 af
Runoff Depth=0.86"Flow Length=118'
Tc=7.3 minCN=55
0.25 cfs
Type III 24-hr 10-Yr Rainfall=4.75"ec Printed 2/25/2020Prepared by James Engineering, Inc.
Page 15HydroCAD® 10.00-20 s/n 02185 © 2017 HydroCAD Software Solutions LLC
Summary for Subcatchment 3S: basin 2
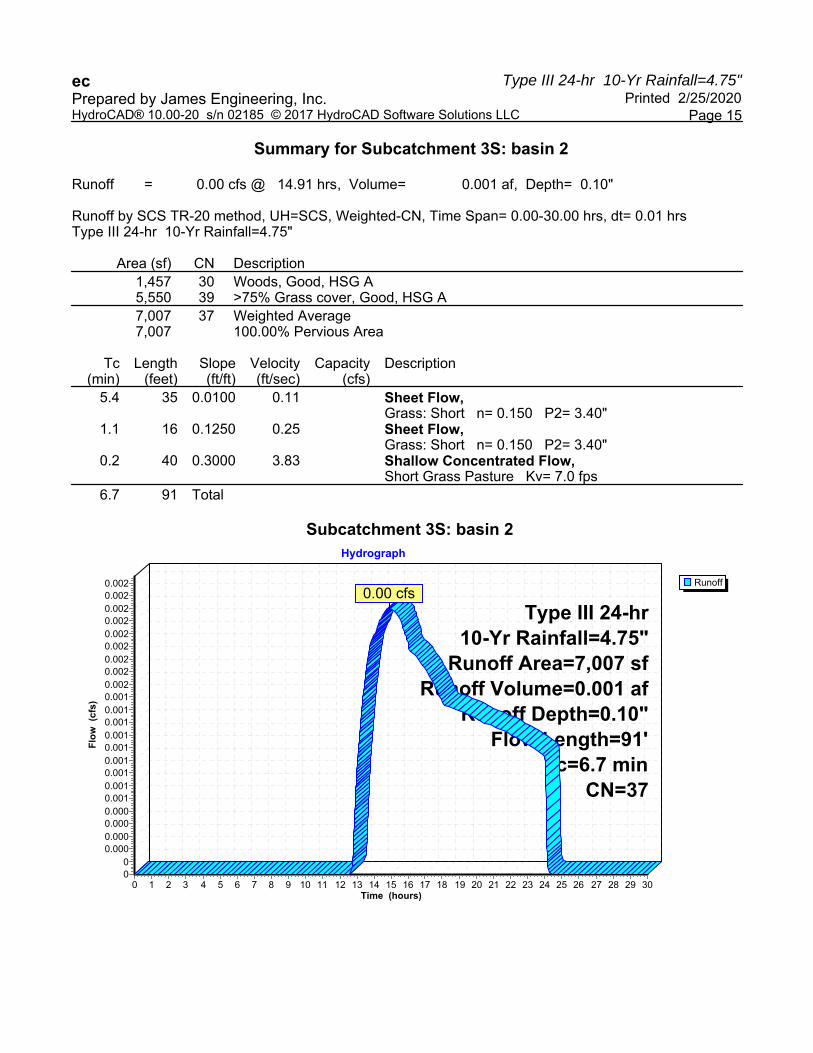
Runoff = 0.00 cfs @ 14.91 hrs, Volume= 0.001 af, Depth= 0.10"
Runoff by SCS TR-20 method, UH=SCS, Weighted-CN, Time Span= 0.00-30.00 hrs, dt= 0.01 hrsType III 24-hr 10-Yr Rainfall=4.75"
Area (sf) CN Description1,457 30 Woods, Good, HSG A5,550 39 >75% Grass cover, Good, HSG A7,007 37 Weighted Average7,007 100.00% Pervious Area
Tc Length Slope Velocity Capacity Description(min) (feet) (ft/ft) (ft/sec) (cfs)
5.4 35 0.0100 0.11 Sheet Flow, Grass: Short n= 0.150 P2= 3.40"
1.1 16 0.1250 0.25 Sheet Flow, Grass: Short n= 0.150 P2= 3.40"
0.2 40 0.3000 3.83 Shallow Concentrated Flow, Short Grass Pasture Kv= 7.0 fps
6.7 91 Total
Subcatchment 3S: basin 2
Runoff
Hydrograph
Time (hours)3029282726252423222120191817161514131211109876543210
Flo
w (
cfs)
0.0020.0020.0020.0020.0020.0020.0020.0020.0020.0010.0010.0010.0010.0010.0010.0010.0010.0010.0000.0000.0000.000
00
Type III 24-hr10-Yr Rainfall=4.75"
Runoff Area=7,007 sfRunoff Volume=0.001 af
Runoff Depth=0.10"Flow Length=91'
Tc=6.7 minCN=37
0.00 cfs

Type III 24-hr 10-Yr Rainfall=4.75"ec Printed 2/25/2020Prepared by James Engineering, Inc.
Page 16HydroCAD® 10.00-20 s/n 02185 © 2017 HydroCAD Software Solutions LLC
Summary for Subcatchment 4S: stream
Runoff = 0.02 cfs @ 12.39 hrs, Volume= 0.005 af, Depth= 0.33"
Runoff by SCS TR-20 method, UH=SCS, Weighted-CN, Time Span= 0.00-30.00 hrs, dt= 0.01 hrsType III 24-hr 10-Yr Rainfall=4.75"
Area (sf) CN Description1,851 39 >75% Grass cover, Good, HSG A5,185 30 Woods, Good, HSG A
720 98 Roofs, HSG A880 96 Gravel surface, HSG A
8,636 44 Weighted Average7,916 91.66% Pervious Area
720 8.34% Impervious Area
Tc Length Slope Velocity Capacity Description(min) (feet) (ft/ft) (ft/sec) (cfs)
7.2 50 0.0100 0.12 Sheet Flow, Grass: Short n= 0.150 P2= 3.40"
0.7 100 0.2000 2.24 Shallow Concentrated Flow, Woodland Kv= 5.0 fps
7.9 150 Total
Subcatchment 4S: stream
Runoff
Hydrograph
Time (hours)3029282726252423222120191817161514131211109876543210
Flo
w (
cfs)
0.026
0.024
0.022
0.02
0.018
0.016
0.014
0.012
0.01
0.008
0.006
0.004
0.002
0
Type III 24-hr10-Yr Rainfall=4.75"
Runoff Area=8,636 sfRunoff Volume=0.005 af
Runoff Depth=0.33"Flow Length=150'
Tc=7.9 minCN=44
0.02 cfs

Type III 24-hr 10-Yr Rainfall=4.75"ec Printed 2/25/2020Prepared by James Engineering, Inc.
Page 17HydroCAD® 10.00-20 s/n 02185 © 2017 HydroCAD Software Solutions LLC
Summary for Link 7L: derby brook
Inflow Area = 0.502 ac, 0.00% Impervious, Inflow Depth = 0.61" for 10-Yr eventInflow = 0.25 cfs @ 12.13 hrs, Volume= 0.026 afPrimary = 0.25 cfs @ 12.13 hrs, Volume= 0.026 af, Atten= 0%, Lag= 0.0 min
Primary outflow = Inflow, Time Span= 0.00-30.00 hrs, dt= 0.01 hrs
Link 7L: derby brook
InflowPrimary
Hydrograph
Time (hours)3029282726252423222120191817161514131211109876543210
Flo
w (
cfs)
0.26
0.24
0.22
0.2
0.18
0.16
0.14
0.12
0.1
0.08
0.06
0.04
0.02
0
Inflow Area=0.502 ac0.25 cfs
0.25 cfs

Type III 24-hr 10-Yr Rainfall=4.75"ec Printed 2/25/2020Prepared by James Engineering, Inc.
Page 18HydroCAD® 10.00-20 s/n 02185 © 2017 HydroCAD Software Solutions LLC
Summary for Link 8L: site total
Inflow Area = 0.948 ac, 1.74% Impervious, Inflow Depth = 0.98" for 10-Yr eventInflow = 0.88 cfs @ 12.10 hrs, Volume= 0.077 afPrimary = 0.88 cfs @ 12.10 hrs, Volume= 0.077 af, Atten= 0%, Lag= 0.0 min
Primary outflow = Inflow, Time Span= 0.00-30.00 hrs, dt= 0.01 hrs
Link 8L: site total
InflowPrimary
Hydrograph
Time (hours)3029282726252423222120191817161514131211109876543210
Flo
w (
cfs)
0.95
0.9
0.85
0.8
0.75
0.7
0.65
0.6
0.55
0.5
0.45
0.4
0.35
0.3
0.25
0.2
0.15
0.1
0.05
0
Inflow Area=0.948 ac0.88 cfs
0.88 cfs

Type III 24-hr 25-Yr Rainfall=5.55"ec Printed 2/25/2020Prepared by James Engineering, Inc.
Page 19HydroCAD® 10.00-20 s/n 02185 © 2017 HydroCAD Software Solutions LLC
Time span=0.00-30.00 hrs, dt=0.01 hrs, 3001 pointsRunoff by SCS TR-20 method, UH=SCS, Weighted-CN
Reach routing by Stor-Ind+Trans method - Pond routing by Stor-Ind method
Runoff Area=10,790 sf 0.00% Impervious Runoff Depth=2.90"Subcatchment 1S: To rte 53 Tc=6.0 min CN=75 Runoff=0.84 cfs 0.060 af
Runoff Area=14,854 sf 0.00% Impervious Runoff Depth=1.27"Subcatchment 2S: basin 1 Flow Length=118' Tc=7.3 min CN=55 Runoff=0.41 cfs 0.036 af
Runoff Area=7,007 sf 0.00% Impervious Runoff Depth=0.24"Subcatchment 3S: basin 2 Flow Length=91' Tc=6.7 min CN=37 Runoff=0.01 cfs 0.003 af
Runoff Area=8,636 sf 8.34% Impervious Runoff Depth=0.57"Subcatchment 4S: stream Flow Length=150' Tc=7.9 min CN=44 Runoff=0.06 cfs 0.009 af
Inflow=0.41 cfs 0.039 afLink 7L: derby brook Primary=0.41 cfs 0.039 af
Inflow=1.27 cfs 0.109 afLink 8L: site total Primary=1.27 cfs 0.109 af
Total Runoff Area = 0.948 ac Runoff Volume = 0.109 af Average Runoff Depth = 1.37"98.26% Pervious = 0.931 ac 1.74% Impervious = 0.017 ac

Type III 24-hr 25-Yr Rainfall=5.55"ec Printed 2/25/2020Prepared by James Engineering, Inc.
Page 20HydroCAD® 10.00-20 s/n 02185 © 2017 HydroCAD Software Solutions LLC
Summary for Subcatchment 1S: To rte 53
Runoff = 0.84 cfs @ 12.09 hrs, Volume= 0.060 af, Depth= 2.90"
Runoff by SCS TR-20 method, UH=SCS, Weighted-CN, Time Span= 0.00-30.00 hrs, dt= 0.01 hrsType III 24-hr 25-Yr Rainfall=5.55"
Area (sf) CN Description5,900 96 Gravel surface, HSG A4,890 49 50-75% Grass cover, Fair, HSG A
10,790 75 Weighted Average10,790 100.00% Pervious Area
Tc Length Slope Velocity Capacity Description(min) (feet) (ft/ft) (ft/sec) (cfs)
6.0 Direct Entry, minimum
Subcatchment 1S: To rte 53
Runoff
Hydrograph
Time (hours)3029282726252423222120191817161514131211109876543210
Flo
w (
cfs)
0.9
0.85
0.8
0.75
0.7
0.65
0.6
0.55
0.5
0.45
0.4
0.35
0.3
0.25
0.2
0.15
0.1
0.05
0
Type III 24-hr25-Yr Rainfall=5.55"
Runoff Area=10,790 sfRunoff Volume=0.060 af
Runoff Depth=2.90"Tc=6.0 min
CN=75
0.84 cfs

Type III 24-hr 25-Yr Rainfall=5.55"ec Printed 2/25/2020Prepared by James Engineering, Inc.
Page 21HydroCAD® 10.00-20 s/n 02185 © 2017 HydroCAD Software Solutions LLC
Summary for Subcatchment 2S: basin 1
Runoff = 0.41 cfs @ 12.12 hrs, Volume= 0.036 af, Depth= 1.27"
Runoff by SCS TR-20 method, UH=SCS, Weighted-CN, Time Span= 0.00-30.00 hrs, dt= 0.01 hrsType III 24-hr 25-Yr Rainfall=5.55"
Area (sf) CN Description13,100 49 50-75% Grass cover, Fair, HSG A
1,754 96 Gravel surface, HSG A14,854 55 Weighted Average14,854 100.00% Pervious Area
Tc Length Slope Velocity Capacity Description(min) (feet) (ft/ft) (ft/sec) (cfs)
7.0 48 0.0100 0.11 Sheet Flow, Grass: Short n= 0.150 P2= 3.40"
0.3 70 0.2500 3.50 Shallow Concentrated Flow, Short Grass Pasture Kv= 7.0 fps
7.3 118 Total
Subcatchment 2S: basin 1
Runoff
Hydrograph
Time (hours)3029282726252423222120191817161514131211109876543210
Flo
w (
cfs)
0.460.440.42
0.40.380.360.340.32
0.30.280.260.240.22
0.20.180.160.140.12
0.10.080.060.040.02
0
Type III 24-hr25-Yr Rainfall=5.55"
Runoff Area=14,854 sfRunoff Volume=0.036 af
Runoff Depth=1.27"Flow Length=118'
Tc=7.3 minCN=55
0.41 cfs

Type III 24-hr 25-Yr Rainfall=5.55"ec Printed 2/25/2020Prepared by James Engineering, Inc.
Page 22HydroCAD® 10.00-20 s/n 02185 © 2017 HydroCAD Software Solutions LLC
Summary for Subcatchment 3S: basin 2
Runoff = 0.01 cfs @ 12.47 hrs, Volume= 0.003 af, Depth= 0.24"
Runoff by SCS TR-20 method, UH=SCS, Weighted-CN, Time Span= 0.00-30.00 hrs, dt= 0.01 hrsType III 24-hr 25-Yr Rainfall=5.55"
Area (sf) CN Description1,457 30 Woods, Good, HSG A5,550 39 >75% Grass cover, Good, HSG A7,007 37 Weighted Average7,007 100.00% Pervious Area
Tc Length Slope Velocity Capacity Description(min) (feet) (ft/ft) (ft/sec) (cfs)
5.4 35 0.0100 0.11 Sheet Flow, Grass: Short n= 0.150 P2= 3.40"
1.1 16 0.1250 0.25 Sheet Flow, Grass: Short n= 0.150 P2= 3.40"
0.2 40 0.3000 3.83 Shallow Concentrated Flow, Short Grass Pasture Kv= 7.0 fps
6.7 91 Total
Subcatchment 3S: basin 2
Runoff
Hydrograph
Time (hours)3029282726252423222120191817161514131211109876543210
Flo
w (
cfs)
0.009
0.009
0.008
0.007
0.007
0.006
0.006
0.005
0.005
0.004
0.004
0.003
0.003
0.002
0.002
0.001
0.001
0.000
0
Type III 24-hr25-Yr Rainfall=5.55"
Runoff Area=7,007 sfRunoff Volume=0.003 af
Runoff Depth=0.24"Flow Length=91'
Tc=6.7 minCN=37
0.01 cfs

Type III 24-hr 25-Yr Rainfall=5.55"ec Printed 2/25/2020Prepared by James Engineering, Inc.
Page 23HydroCAD® 10.00-20 s/n 02185 © 2017 HydroCAD Software Solutions LLC
Summary for Subcatchment 4S: stream
Runoff = 0.06 cfs @ 12.28 hrs, Volume= 0.009 af, Depth= 0.57"
Runoff by SCS TR-20 method, UH=SCS, Weighted-CN, Time Span= 0.00-30.00 hrs, dt= 0.01 hrsType III 24-hr 25-Yr Rainfall=5.55"
Area (sf) CN Description1,851 39 >75% Grass cover, Good, HSG A5,185 30 Woods, Good, HSG A
720 98 Roofs, HSG A880 96 Gravel surface, HSG A
8,636 44 Weighted Average7,916 91.66% Pervious Area
720 8.34% Impervious Area
Tc Length Slope Velocity Capacity Description(min) (feet) (ft/ft) (ft/sec) (cfs)
7.2 50 0.0100 0.12 Sheet Flow, Grass: Short n= 0.150 P2= 3.40"
0.7 100 0.2000 2.24 Shallow Concentrated Flow, Woodland Kv= 5.0 fps
7.9 150 Total
Subcatchment 4S: stream
Runoff
Hydrograph
Time (hours)3029282726252423222120191817161514131211109876543210
Flo
w (
cfs)
0.06
0.055
0.05
0.045
0.04
0.035
0.03
0.025
0.02
0.015
0.01
0.005
0
Type III 24-hr25-Yr Rainfall=5.55"
Runoff Area=8,636 sfRunoff Volume=0.009 af
Runoff Depth=0.57"Flow Length=150'
Tc=7.9 minCN=44
0.06 cfs

Type III 24-hr 25-Yr Rainfall=5.55"ec Printed 2/25/2020Prepared by James Engineering, Inc.
Page 24HydroCAD® 10.00-20 s/n 02185 © 2017 HydroCAD Software Solutions LLC
Summary for Link 7L: derby brook
Inflow Area = 0.502 ac, 0.00% Impervious, Inflow Depth = 0.94" for 25-Yr eventInflow = 0.41 cfs @ 12.12 hrs, Volume= 0.039 afPrimary = 0.41 cfs @ 12.12 hrs, Volume= 0.039 af, Atten= 0%, Lag= 0.0 min
Primary outflow = Inflow, Time Span= 0.00-30.00 hrs, dt= 0.01 hrs
Link 7L: derby brook
InflowPrimary
Hydrograph
Time (hours)3029282726252423222120191817161514131211109876543210
Flo
w (
cfs)
0.460.440.42
0.40.380.360.340.32
0.30.280.260.240.22
0.20.180.160.140.12
0.10.080.060.040.02
0
Inflow Area=0.502 ac0.41 cfs
0.41 cfs

Type III 24-hr 25-Yr Rainfall=5.55"ec Printed 2/25/2020Prepared by James Engineering, Inc.
Page 25HydroCAD® 10.00-20 s/n 02185 © 2017 HydroCAD Software Solutions LLC
Summary for Link 8L: site total
Inflow Area = 0.948 ac, 1.74% Impervious, Inflow Depth = 1.37" for 25-Yr eventInflow = 1.27 cfs @ 12.10 hrs, Volume= 0.109 afPrimary = 1.27 cfs @ 12.10 hrs, Volume= 0.109 af, Atten= 0%, Lag= 0.0 min
Primary outflow = Inflow, Time Span= 0.00-30.00 hrs, dt= 0.01 hrs
Link 8L: site total
InflowPrimary
Hydrograph
Time (hours)3029282726252423222120191817161514131211109876543210
Flo
w (
cfs)
1
0
Inflow Area=0.948 ac1.27 cfs
1.27 cfs
Type III 24-hr 100-Yr Rainfall=7.00"ec Printed 2/25/2020Prepared by James Engineering, Inc.
Page 26HydroCAD® 10.00-20 s/n 02185 © 2017 HydroCAD Software Solutions LLC
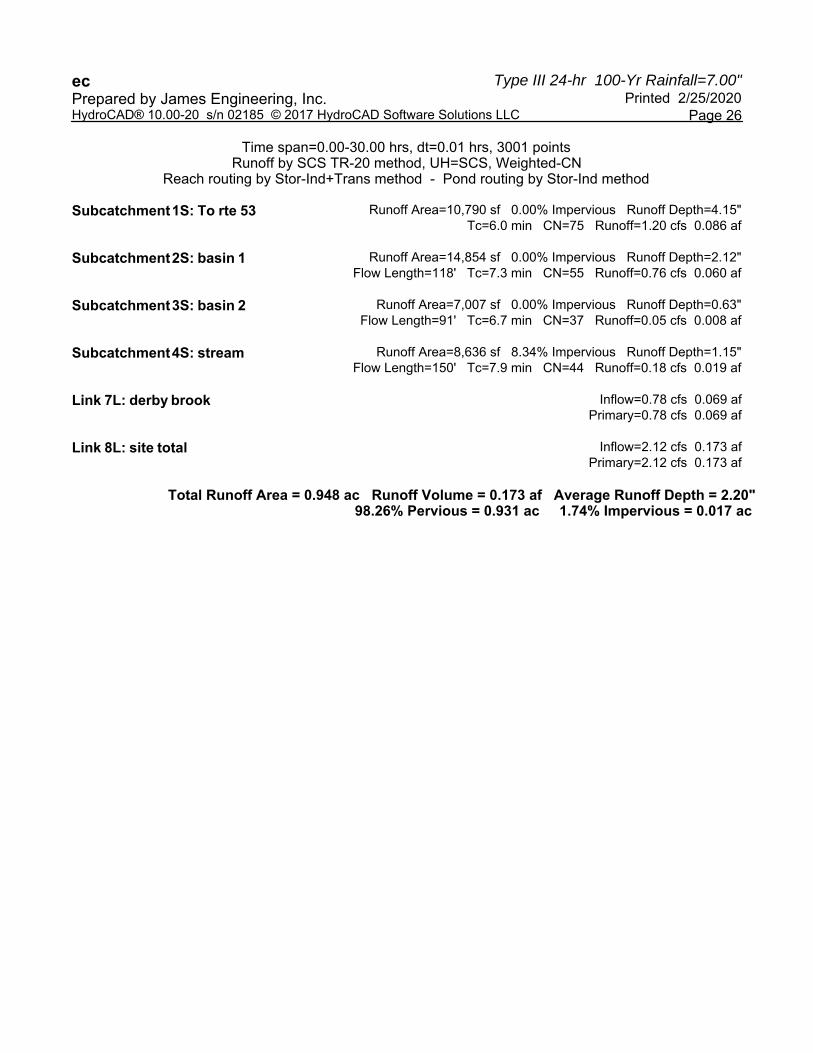
Time span=0.00-30.00 hrs, dt=0.01 hrs, 3001 pointsRunoff by SCS TR-20 method, UH=SCS, Weighted-CN
Reach routing by Stor-Ind+Trans method - Pond routing by Stor-Ind method
Runoff Area=10,790 sf 0.00% Impervious Runoff Depth=4.15"Subcatchment 1S: To rte 53 Tc=6.0 min CN=75 Runoff=1.20 cfs 0.086 af
Runoff Area=14,854 sf 0.00% Impervious Runoff Depth=2.12"Subcatchment 2S: basin 1 Flow Length=118' Tc=7.3 min CN=55 Runoff=0.76 cfs 0.060 af
Runoff Area=7,007 sf 0.00% Impervious Runoff Depth=0.63"Subcatchment 3S: basin 2 Flow Length=91' Tc=6.7 min CN=37 Runoff=0.05 cfs 0.008 af
Runoff Area=8,636 sf 8.34% Impervious Runoff Depth=1.15"Subcatchment 4S: stream Flow Length=150' Tc=7.9 min CN=44 Runoff=0.18 cfs 0.019 af
Inflow=0.78 cfs 0.069 afLink 7L: derby brook Primary=0.78 cfs 0.069 af
Inflow=2.12 cfs 0.173 afLink 8L: site total Primary=2.12 cfs 0.173 af
Total Runoff Area = 0.948 ac Runoff Volume = 0.173 af Average Runoff Depth = 2.20"98.26% Pervious = 0.931 ac 1.74% Impervious = 0.017 ac
Type III 24-hr 100-Yr Rainfall=7.00"ec Printed 2/25/2020Prepared by James Engineering, Inc.
Page 27HydroCAD® 10.00-20 s/n 02185 © 2017 HydroCAD Software Solutions LLC
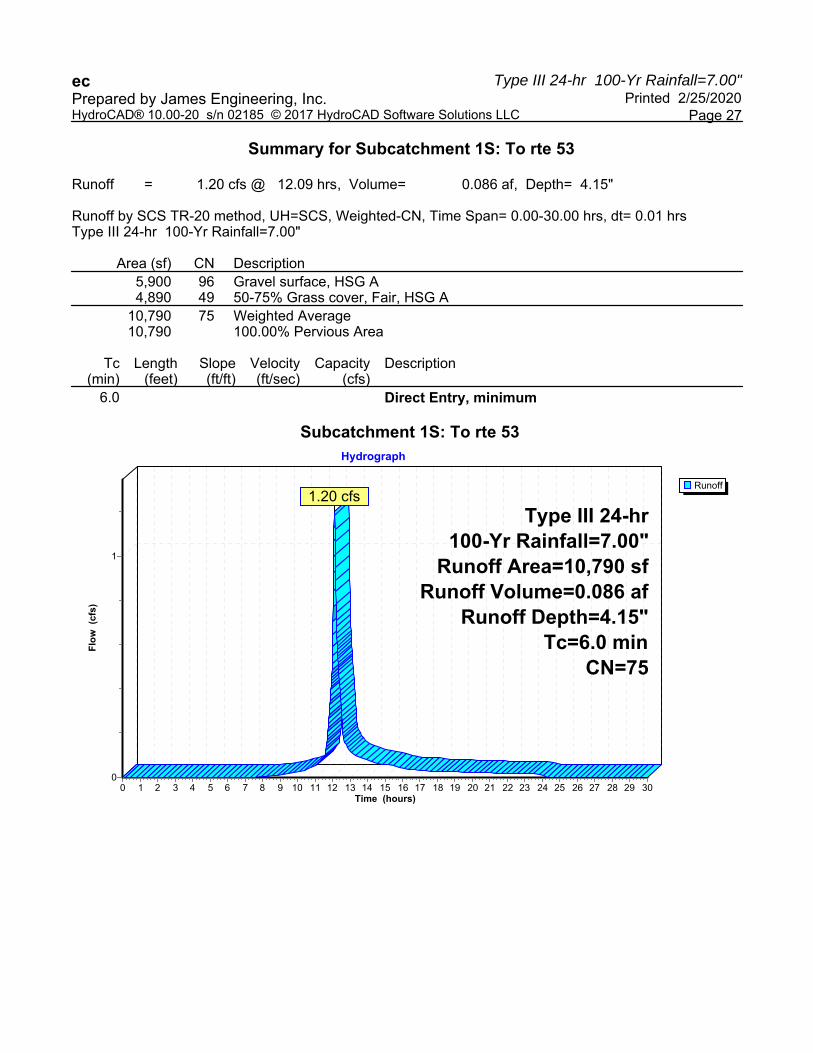
Summary for Subcatchment 1S: To rte 53
Runoff = 1.20 cfs @ 12.09 hrs, Volume= 0.086 af, Depth= 4.15"
Runoff by SCS TR-20 method, UH=SCS, Weighted-CN, Time Span= 0.00-30.00 hrs, dt= 0.01 hrsType III 24-hr 100-Yr Rainfall=7.00"
Area (sf) CN Description5,900 96 Gravel surface, HSG A4,890 49 50-75% Grass cover, Fair, HSG A
10,790 75 Weighted Average10,790 100.00% Pervious Area
Tc Length Slope Velocity Capacity Description(min) (feet) (ft/ft) (ft/sec) (cfs)
6.0 Direct Entry, minimum
Subcatchment 1S: To rte 53
Runoff
Hydrograph
Time (hours)3029282726252423222120191817161514131211109876543210
Flo
w (
cfs)
1
0
Type III 24-hr100-Yr Rainfall=7.00"
Runoff Area=10,790 sfRunoff Volume=0.086 af
Runoff Depth=4.15"Tc=6.0 min
CN=75
1.20 cfs
Type III 24-hr 100-Yr Rainfall=7.00"ec Printed 2/25/2020Prepared by James Engineering, Inc.
Page 28HydroCAD® 10.00-20 s/n 02185 © 2017 HydroCAD Software Solutions LLC
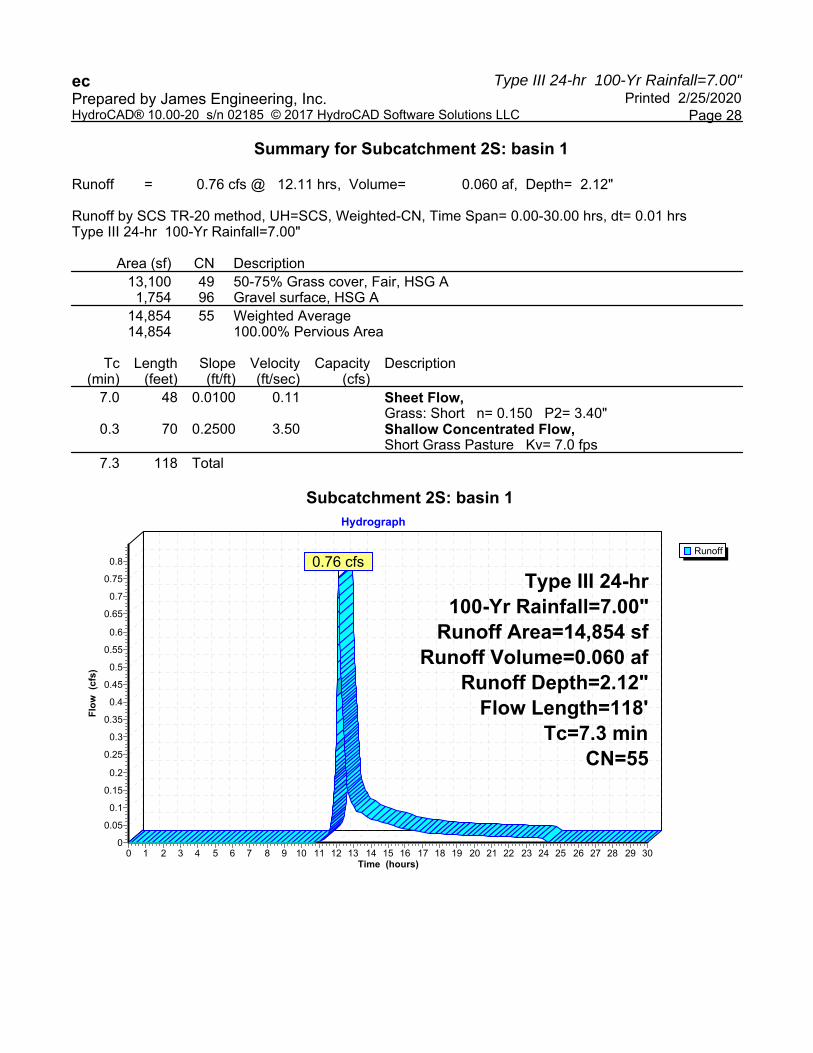
Summary for Subcatchment 2S: basin 1
Runoff = 0.76 cfs @ 12.11 hrs, Volume= 0.060 af, Depth= 2.12"
Runoff by SCS TR-20 method, UH=SCS, Weighted-CN, Time Span= 0.00-30.00 hrs, dt= 0.01 hrsType III 24-hr 100-Yr Rainfall=7.00"
Area (sf) CN Description13,100 49 50-75% Grass cover, Fair, HSG A
1,754 96 Gravel surface, HSG A14,854 55 Weighted Average14,854 100.00% Pervious Area
Tc Length Slope Velocity Capacity Description(min) (feet) (ft/ft) (ft/sec) (cfs)
7.0 48 0.0100 0.11 Sheet Flow, Grass: Short n= 0.150 P2= 3.40"
0.3 70 0.2500 3.50 Shallow Concentrated Flow, Short Grass Pasture Kv= 7.0 fps
7.3 118 Total
Subcatchment 2S: basin 1
Runoff
Hydrograph
Time (hours)3029282726252423222120191817161514131211109876543210
Flo
w (
cfs)
0.8
0.75
0.7
0.65
0.6
0.55
0.5
0.45
0.4
0.35
0.3
0.25
0.2
0.15
0.1
0.05
0
Type III 24-hr100-Yr Rainfall=7.00"
Runoff Area=14,854 sfRunoff Volume=0.060 af
Runoff Depth=2.12"Flow Length=118'
Tc=7.3 minCN=55
0.76 cfs

Type III 24-hr 100-Yr Rainfall=7.00"ec Printed 2/25/2020Prepared by James Engineering, Inc.
Page 29HydroCAD® 10.00-20 s/n 02185 © 2017 HydroCAD Software Solutions LLC
Summary for Subcatchment 3S: basin 2
Runoff = 0.05 cfs @ 12.31 hrs, Volume= 0.008 af, Depth= 0.63"
Runoff by SCS TR-20 method, UH=SCS, Weighted-CN, Time Span= 0.00-30.00 hrs, dt= 0.01 hrsType III 24-hr 100-Yr Rainfall=7.00"
Area (sf) CN Description1,457 30 Woods, Good, HSG A5,550 39 >75% Grass cover, Good, HSG A7,007 37 Weighted Average7,007 100.00% Pervious Area
Tc Length Slope Velocity Capacity Description(min) (feet) (ft/ft) (ft/sec) (cfs)
5.4 35 0.0100 0.11 Sheet Flow, Grass: Short n= 0.150 P2= 3.40"
1.1 16 0.1250 0.25 Sheet Flow, Grass: Short n= 0.150 P2= 3.40"
0.2 40 0.3000 3.83 Shallow Concentrated Flow, Short Grass Pasture Kv= 7.0 fps
6.7 91 Total
Subcatchment 3S: basin 2
Runoff
Hydrograph
Time (hours)3029282726252423222120191817161514131211109876543210
Flo
w (
cfs)
0.050.0480.0460.0440.042
0.040.0380.0360.0340.032
0.030.0280.0260.0240.022
0.020.0180.0160.0140.012
0.010.0080.0060.0040.002
0
Type III 24-hr100-Yr Rainfall=7.00"Runoff Area=7,007 sf
Runoff Volume=0.008 afRunoff Depth=0.63"
Flow Length=91'Tc=6.7 min
CN=37
0.05 cfs
Type III 24-hr 100-Yr Rainfall=7.00"ec Printed 2/25/2020Prepared by James Engineering, Inc.
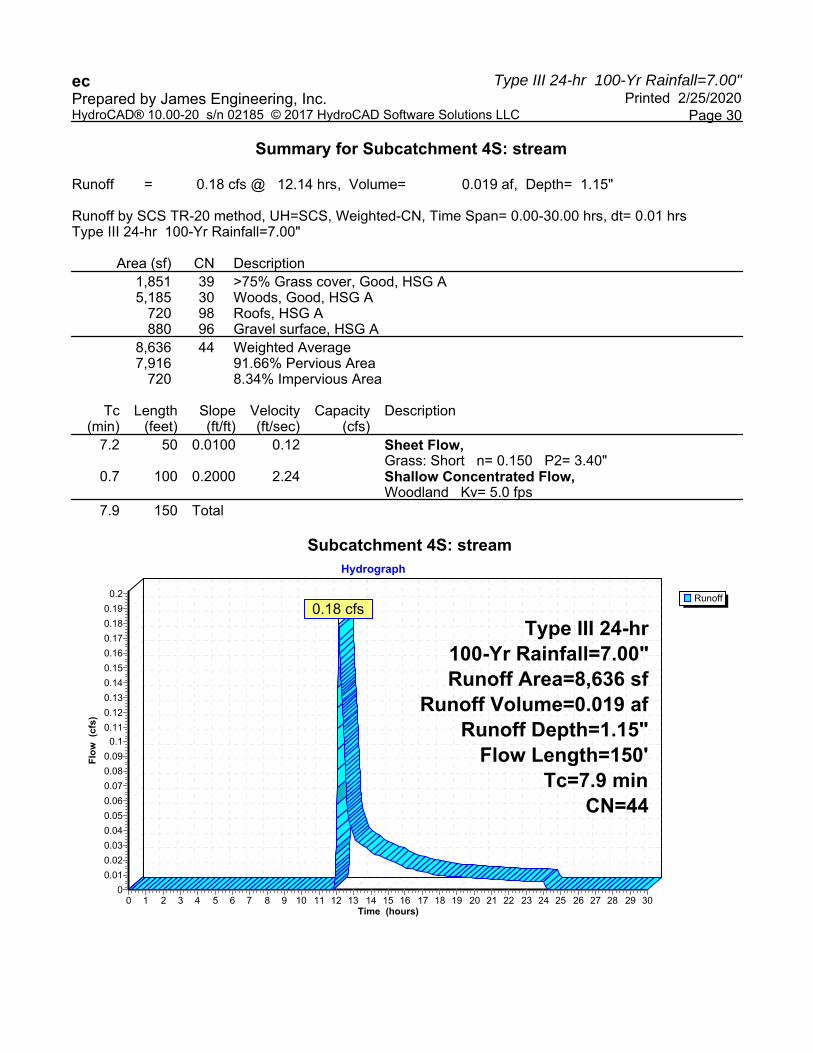
Page 30HydroCAD® 10.00-20 s/n 02185 © 2017 HydroCAD Software Solutions LLC
Summary for Subcatchment 4S: stream
Runoff = 0.18 cfs @ 12.14 hrs, Volume= 0.019 af, Depth= 1.15"
Runoff by SCS TR-20 method, UH=SCS, Weighted-CN, Time Span= 0.00-30.00 hrs, dt= 0.01 hrsType III 24-hr 100-Yr Rainfall=7.00"
Area (sf) CN Description1,851 39 >75% Grass cover, Good, HSG A5,185 30 Woods, Good, HSG A
720 98 Roofs, HSG A880 96 Gravel surface, HSG A
8,636 44 Weighted Average7,916 91.66% Pervious Area
720 8.34% Impervious Area
Tc Length Slope Velocity Capacity Description(min) (feet) (ft/ft) (ft/sec) (cfs)
7.2 50 0.0100 0.12 Sheet Flow, Grass: Short n= 0.150 P2= 3.40"
0.7 100 0.2000 2.24 Shallow Concentrated Flow, Woodland Kv= 5.0 fps
7.9 150 Total
Subcatchment 4S: stream
Runoff
Hydrograph
Time (hours)3029282726252423222120191817161514131211109876543210
Flo
w (
cfs)
0.2
0.19
0.18
0.17
0.16
0.15
0.14
0.13
0.12
0.11
0.1
0.09
0.08
0.07
0.06
0.05
0.04
0.03
0.02
0.01
0
Type III 24-hr100-Yr Rainfall=7.00"Runoff Area=8,636 sf
Runoff Volume=0.019 afRunoff Depth=1.15"
Flow Length=150'Tc=7.9 min
CN=44
0.18 cfs

Type III 24-hr 100-Yr Rainfall=7.00"ec Printed 2/25/2020Prepared by James Engineering, Inc.
Page 31HydroCAD® 10.00-20 s/n 02185 © 2017 HydroCAD Software Solutions LLC
Summary for Link 7L: derby brook
Inflow Area = 0.502 ac, 0.00% Impervious, Inflow Depth = 1.64" for 100-Yr eventInflow = 0.78 cfs @ 12.12 hrs, Volume= 0.069 afPrimary = 0.78 cfs @ 12.12 hrs, Volume= 0.069 af, Atten= 0%, Lag= 0.0 min
Primary outflow = Inflow, Time Span= 0.00-30.00 hrs, dt= 0.01 hrs
Link 7L: derby brook
InflowPrimary
Hydrograph
Time (hours)3029282726252423222120191817161514131211109876543210
Flo
w (
cfs)
0.85
0.8
0.75
0.7
0.65
0.6
0.55
0.5
0.45
0.4
0.35
0.3
0.25
0.2
0.15
0.1
0.05
0
Inflow Area=0.502 ac0.78 cfs
0.78 cfs

Type III 24-hr 100-Yr Rainfall=7.00"ec Printed 2/25/2020Prepared by James Engineering, Inc.
Page 32HydroCAD® 10.00-20 s/n 02185 © 2017 HydroCAD Software Solutions LLC
Summary for Link 8L: site total
Inflow Area = 0.948 ac, 1.74% Impervious, Inflow Depth = 2.20" for 100-Yr eventInflow = 2.12 cfs @ 12.10 hrs, Volume= 0.173 afPrimary = 2.12 cfs @ 12.10 hrs, Volume= 0.173 af, Atten= 0%, Lag= 0.0 min
Primary outflow = Inflow, Time Span= 0.00-30.00 hrs, dt= 0.01 hrs
Link 8L: site total
InflowPrimary
Hydrograph
Time (hours)3029282726252423222120191817161514131211109876543210
Flo
w (
cfs)
2
1
0
Inflow Area=0.948 ac2.12 cfs
2.12 cfs
James Engineering, Inc. 125 Great Rock Road, Hanover, Ma 02339
14
Proposed Conditions Hydro-CAD printout

1S
cbasin
2S
to rte 53
3S
house 2
4S
back basin
5S
front basin
6S
stream
1P
inf 1
2P
roof
3L
rte 53
4L
site total
5L
derby brook
Routing Diagram for pcPrepared by James Engineering, Inc., Printed 2/25/2020
HydroCAD® 10.00-20 s/n 02185 © 2017 HydroCAD Software Solutions LLC
Subcat Reach Pond Link
pc Printed 2/25/2020Prepared by James Engineering, Inc.
Page 2HydroCAD® 10.00-20 s/n 02185 © 2017 HydroCAD Software Solutions LLC
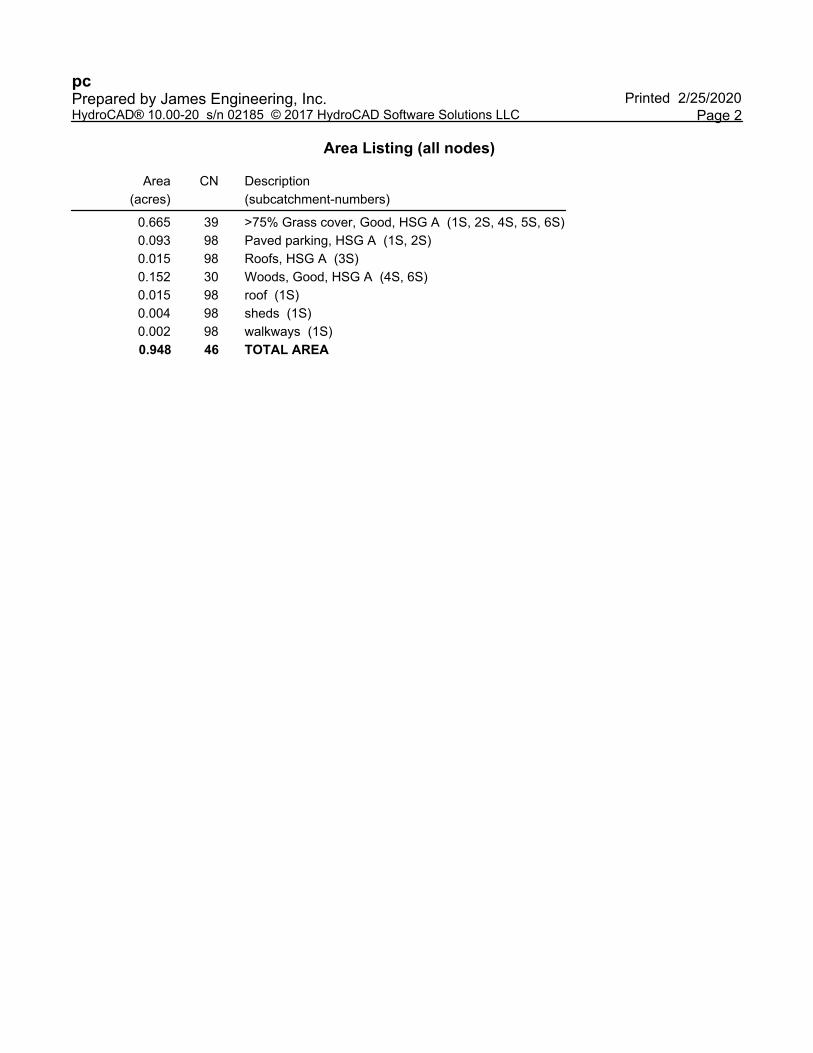
Area Listing (all nodes)
Area(acres)
CN Description(subcatchment-numbers)
0.665 39 >75% Grass cover, Good, HSG A (1S, 2S, 4S, 5S, 6S)0.093 98 Paved parking, HSG A (1S, 2S)0.015 98 Roofs, HSG A (3S)0.152 30 Woods, Good, HSG A (4S, 6S)0.015 98 roof (1S)0.004 98 sheds (1S)0.002 98 walkways (1S)
0.948 46 TOTAL AREA
pc Printed 2/25/2020Prepared by James Engineering, Inc.
Page 3HydroCAD® 10.00-20 s/n 02185 © 2017 HydroCAD Software Solutions LLC
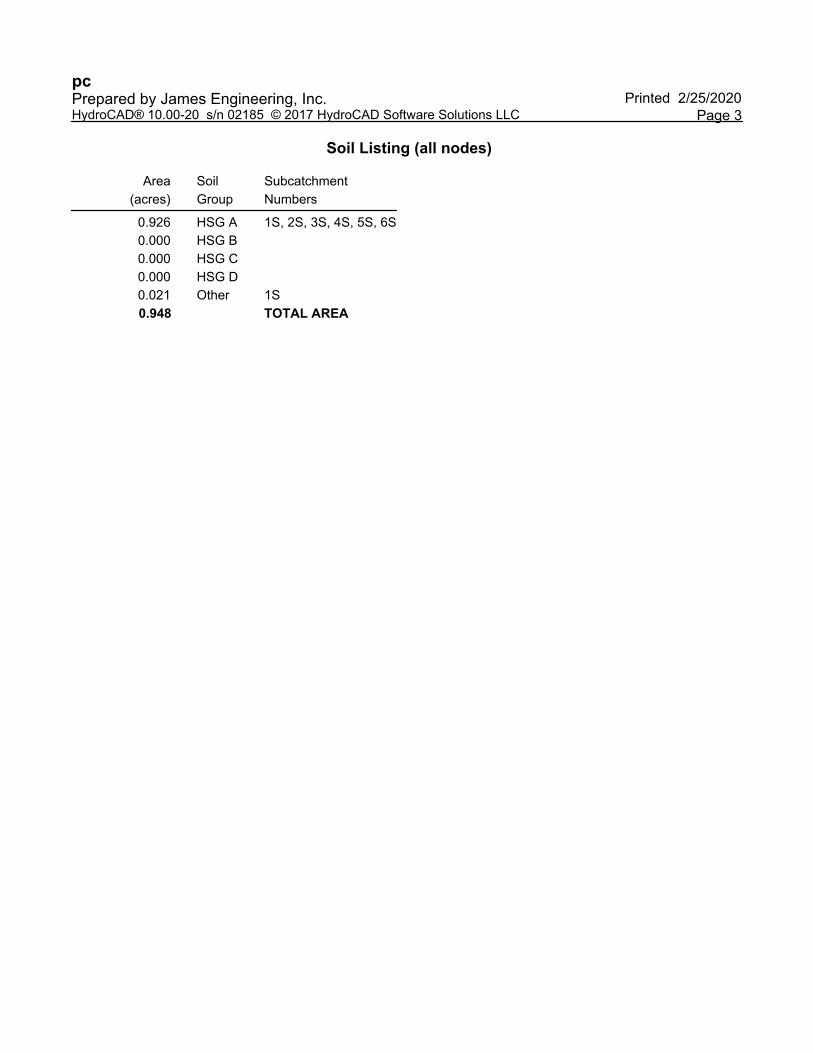
Soil Listing (all nodes)
Area(acres)
SoilGroup
SubcatchmentNumbers
0.926 HSG A 1S, 2S, 3S, 4S, 5S, 6S0.000 HSG B0.000 HSG C0.000 HSG D0.021 Other 1S
0.948 TOTAL AREA

pc Printed 2/25/2020Prepared by James Engineering, Inc.
Page 4HydroCAD® 10.00-20 s/n 02185 © 2017 HydroCAD Software Solutions LLC
Ground Covers (all nodes)
HSG-A(acres)
HSG-B(acres)
HSG-C(acres)
HSG-D(acres)
Other(acres)
Total(acres)
GroundCover
SubcatchmentNumbers
0.665 0.000 0.000 0.000 0.000 0.665 >75% Grass cover, Good 1S, 2S, 4S, 5S, 6S
0.093 0.000 0.000 0.000 0.000 0.093 Paved parking 1S, 2S0.015 0.000 0.000 0.000 0.000 0.015 Roofs 3S0.152 0.000 0.000 0.000 0.000 0.152 Woods, Good 4S, 6S0.000 0.000 0.000 0.000 0.015 0.015 roof 1S0.000 0.000 0.000 0.000 0.004 0.004 sheds 1S0.000 0.000 0.000 0.000 0.002 0.002 walkways 1S
0.926 0.000 0.000 0.000 0.021 0.948 TOTAL AREA
Type III 24-hr 2-Yr Rainfall=3.30"pc Printed 2/25/2020Prepared by James Engineering, Inc.
Page 5HydroCAD® 10.00-20 s/n 02185 © 2017 HydroCAD Software Solutions LLC
Time span=0.00-30.00 hrs, dt=0.01 hrs, 3001 pointsRunoff by SCS TR-20 method, UH=SCS, Weighted-CN
Reach routing by Stor-Ind+Trans method - Pond routing by Stor-Ind method
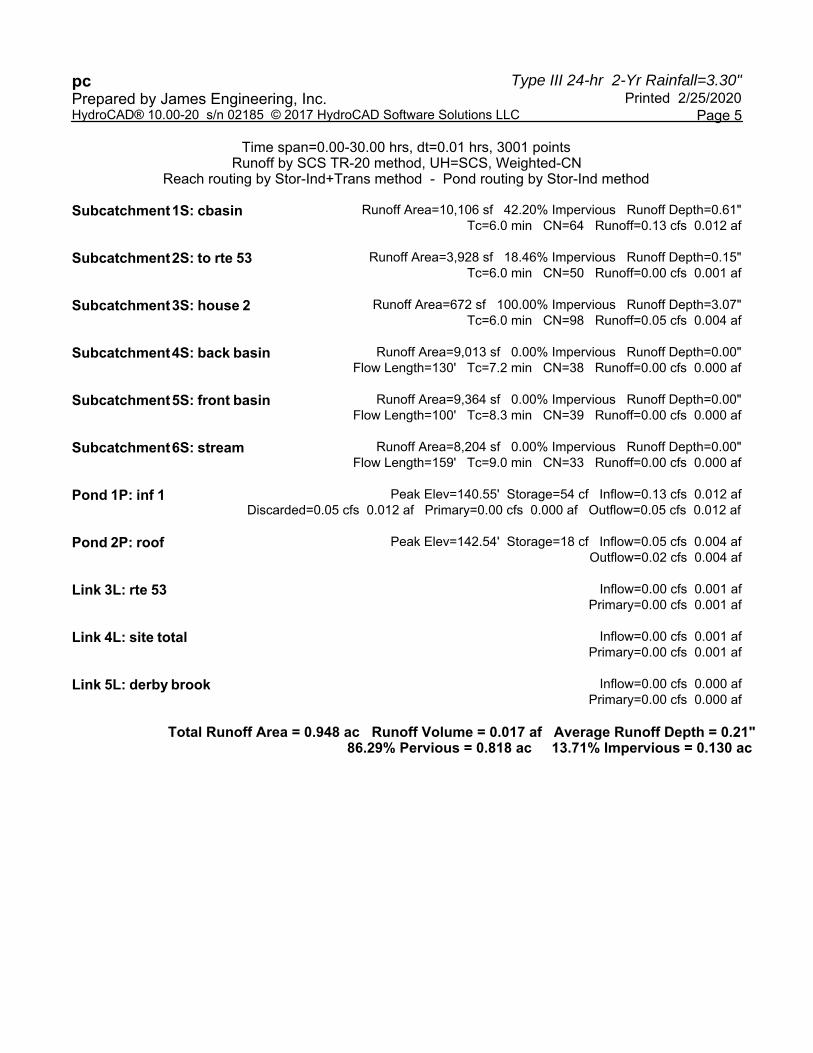
Runoff Area=10,106 sf 42.20% Impervious Runoff Depth=0.61"Subcatchment 1S: cbasin Tc=6.0 min CN=64 Runoff=0.13 cfs 0.012 af
Runoff Area=3,928 sf 18.46% Impervious Runoff Depth=0.15"Subcatchment 2S: to rte 53 Tc=6.0 min CN=50 Runoff=0.00 cfs 0.001 af
Runoff Area=672 sf 100.00% Impervious Runoff Depth=3.07"Subcatchment 3S: house 2 Tc=6.0 min CN=98 Runoff=0.05 cfs 0.004 af
Runoff Area=9,013 sf 0.00% Impervious Runoff Depth=0.00"Subcatchment 4S: back basin Flow Length=130' Tc=7.2 min CN=38 Runoff=0.00 cfs 0.000 af
Runoff Area=9,364 sf 0.00% Impervious Runoff Depth=0.00"Subcatchment 5S: front basin Flow Length=100' Tc=8.3 min CN=39 Runoff=0.00 cfs 0.000 af
Runoff Area=8,204 sf 0.00% Impervious Runoff Depth=0.00"Subcatchment 6S: stream Flow Length=159' Tc=9.0 min CN=33 Runoff=0.00 cfs 0.000 af
Peak Elev=140.55' Storage=54 cf Inflow=0.13 cfs 0.012 afPond 1P: inf 1 Discarded=0.05 cfs 0.012 af Primary=0.00 cfs 0.000 af Outflow=0.05 cfs 0.012 af
Peak Elev=142.54' Storage=18 cf Inflow=0.05 cfs 0.004 afPond 2P: roof Outflow=0.02 cfs 0.004 af
Inflow=0.00 cfs 0.001 afLink 3L: rte 53 Primary=0.00 cfs 0.001 af
Inflow=0.00 cfs 0.001 afLink 4L: site total Primary=0.00 cfs 0.001 af
Inflow=0.00 cfs 0.000 afLink 5L: derby brook Primary=0.00 cfs 0.000 af
Total Runoff Area = 0.948 ac Runoff Volume = 0.017 af Average Runoff Depth = 0.21"86.29% Pervious = 0.818 ac 13.71% Impervious = 0.130 ac
Type III 24-hr 2-Yr Rainfall=3.30"pc Printed 2/25/2020Prepared by James Engineering, Inc.
Page 6HydroCAD® 10.00-20 s/n 02185 © 2017 HydroCAD Software Solutions LLC
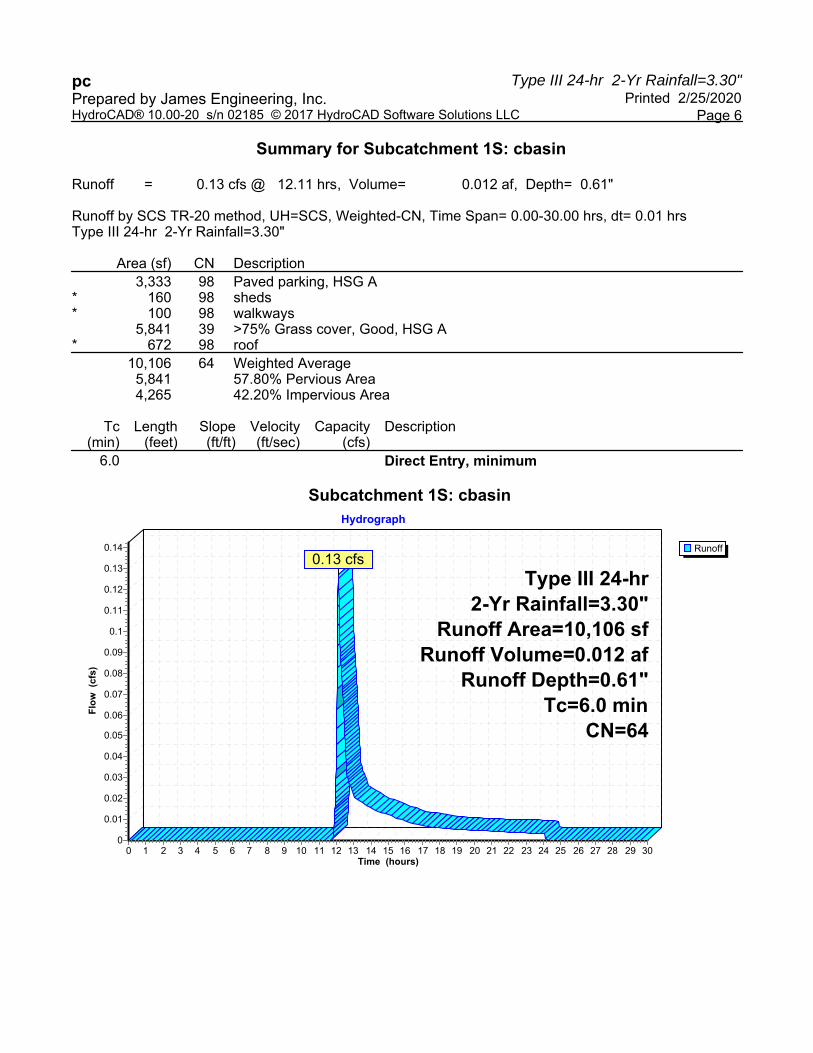
Summary for Subcatchment 1S: cbasin
Runoff = 0.13 cfs @ 12.11 hrs, Volume= 0.012 af, Depth= 0.61"
Runoff by SCS TR-20 method, UH=SCS, Weighted-CN, Time Span= 0.00-30.00 hrs, dt= 0.01 hrsType III 24-hr 2-Yr Rainfall=3.30"
Area (sf) CN Description3,333 98 Paved parking, HSG A
* 160 98 sheds* 100 98 walkways
5,841 39 >75% Grass cover, Good, HSG A* 672 98 roof
10,106 64 Weighted Average5,841 57.80% Pervious Area4,265 42.20% Impervious Area
Tc Length Slope Velocity Capacity Description(min) (feet) (ft/ft) (ft/sec) (cfs)
6.0 Direct Entry, minimum
Subcatchment 1S: cbasin
Runoff
Hydrograph
Time (hours)3029282726252423222120191817161514131211109876543210
Flo
w (
cfs)
0.14
0.13
0.12
0.11
0.1
0.09
0.08
0.07
0.06
0.05
0.04
0.03
0.02
0.01
0
Type III 24-hr2-Yr Rainfall=3.30"
Runoff Area=10,106 sfRunoff Volume=0.012 af
Runoff Depth=0.61"Tc=6.0 min
CN=64
0.13 cfs

Type III 24-hr 2-Yr Rainfall=3.30"pc Printed 2/25/2020Prepared by James Engineering, Inc.
Page 7HydroCAD® 10.00-20 s/n 02185 © 2017 HydroCAD Software Solutions LLC
Summary for Subcatchment 2S: to rte 53
Runoff = 0.00 cfs @ 12.45 hrs, Volume= 0.001 af, Depth= 0.15"
Runoff by SCS TR-20 method, UH=SCS, Weighted-CN, Time Span= 0.00-30.00 hrs, dt= 0.01 hrsType III 24-hr 2-Yr Rainfall=3.30"
Area (sf) CN Description3,203 39 >75% Grass cover, Good, HSG A
725 98 Paved parking, HSG A3,928 50 Weighted Average3,203 81.54% Pervious Area
725 18.46% Impervious Area
Tc Length Slope Velocity Capacity Description(min) (feet) (ft/ft) (ft/sec) (cfs)
6.0 Direct Entry,
Subcatchment 2S: to rte 53
Runoff
Hydrograph
Time (hours)3029282726252423222120191817161514131211109876543210
Flo
w (
cfs)
0.003
0.003
0.003
0.003
0.003
0.002
0.002
0.002
0.002
0.002
0.001
0.001
0.001
0.001
0.001
0.000
0.000
0
Type III 24-hr2-Yr Rainfall=3.30"
Runoff Area=3,928 sfRunoff Volume=0.001 af
Runoff Depth=0.15"Tc=6.0 min
CN=50
0.00 cfs
Type III 24-hr 2-Yr Rainfall=3.30"pc Printed 2/25/2020Prepared by James Engineering, Inc.
Page 8HydroCAD® 10.00-20 s/n 02185 © 2017 HydroCAD Software Solutions LLC
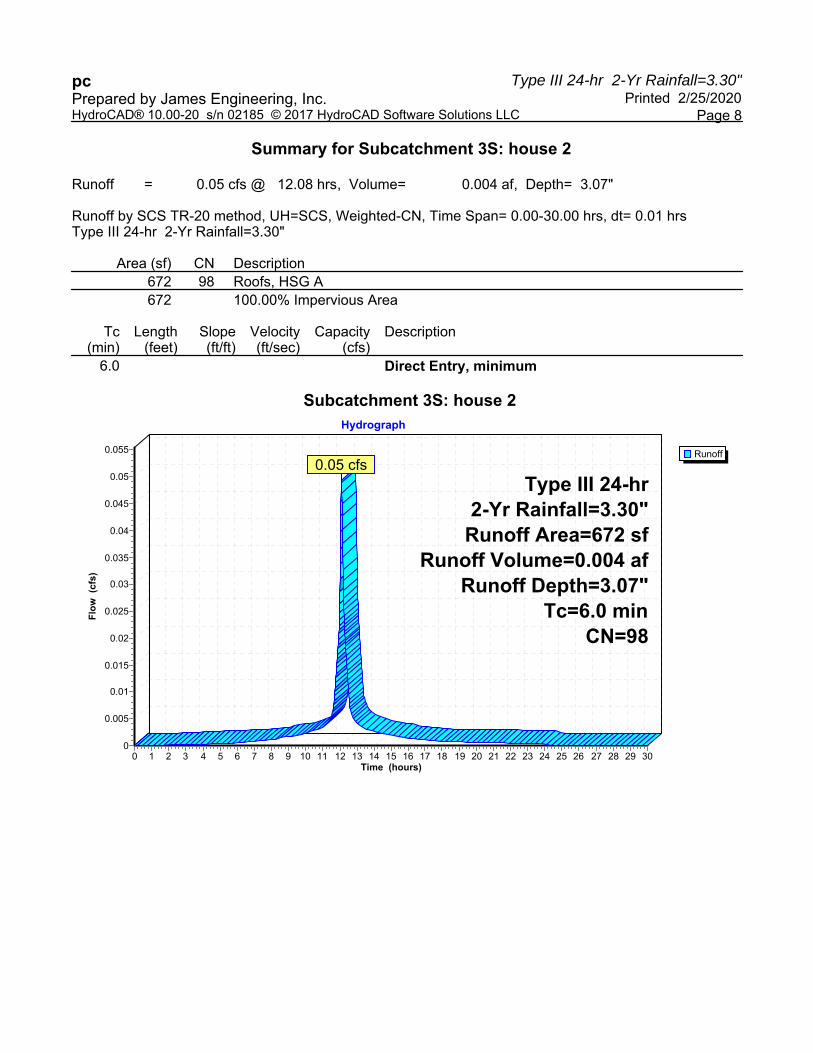
Summary for Subcatchment 3S: house 2
Runoff = 0.05 cfs @ 12.08 hrs, Volume= 0.004 af, Depth= 3.07"
Runoff by SCS TR-20 method, UH=SCS, Weighted-CN, Time Span= 0.00-30.00 hrs, dt= 0.01 hrsType III 24-hr 2-Yr Rainfall=3.30"
Area (sf) CN Description672 98 Roofs, HSG A672 100.00% Impervious Area
Tc Length Slope Velocity Capacity Description(min) (feet) (ft/ft) (ft/sec) (cfs)
6.0 Direct Entry, minimum
Subcatchment 3S: house 2
Runoff
Hydrograph
Time (hours)3029282726252423222120191817161514131211109876543210
Flo
w (
cfs)
0.055
0.05
0.045
0.04
0.035
0.03
0.025
0.02
0.015
0.01
0.005
0
Type III 24-hr2-Yr Rainfall=3.30"
Runoff Area=672 sfRunoff Volume=0.004 af
Runoff Depth=3.07"Tc=6.0 min
CN=98
0.05 cfs
Type III 24-hr 2-Yr Rainfall=3.30"pc Printed 2/25/2020Prepared by James Engineering, Inc.
Page 9HydroCAD® 10.00-20 s/n 02185 © 2017 HydroCAD Software Solutions LLC
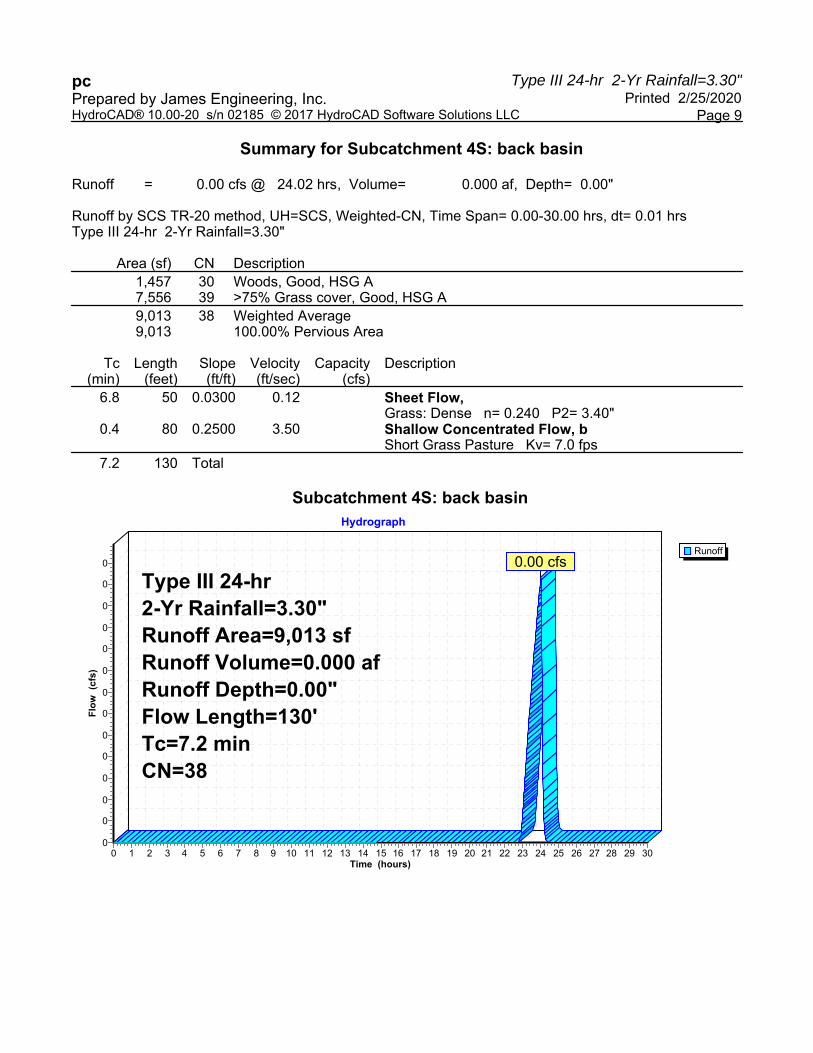
Summary for Subcatchment 4S: back basin
Runoff = 0.00 cfs @ 24.02 hrs, Volume= 0.000 af, Depth= 0.00"
Runoff by SCS TR-20 method, UH=SCS, Weighted-CN, Time Span= 0.00-30.00 hrs, dt= 0.01 hrsType III 24-hr 2-Yr Rainfall=3.30"
Area (sf) CN Description1,457 30 Woods, Good, HSG A7,556 39 >75% Grass cover, Good, HSG A9,013 38 Weighted Average9,013 100.00% Pervious Area
Tc Length Slope Velocity Capacity Description(min) (feet) (ft/ft) (ft/sec) (cfs)
6.8 50 0.0300 0.12 Sheet Flow, Grass: Dense n= 0.240 P2= 3.40"
0.4 80 0.2500 3.50 Shallow Concentrated Flow, bShort Grass Pasture Kv= 7.0 fps
7.2 130 Total
Subcatchment 4S: back basin
Runoff
Hydrograph
Time (hours)3029282726252423222120191817161514131211109876543210
Flo
w (
cfs)
0
0
0
0
0
0
0
0
0
0
0
0
0
0
Type III 24-hr2-Yr Rainfall=3.30"Runoff Area=9,013 sfRunoff Volume=0.000 afRunoff Depth=0.00"Flow Length=130'Tc=7.2 minCN=38
0.00 cfs
Type III 24-hr 2-Yr Rainfall=3.30"pc Printed 2/25/2020Prepared by James Engineering, Inc.
Page 10HydroCAD® 10.00-20 s/n 02185 © 2017 HydroCAD Software Solutions LLC
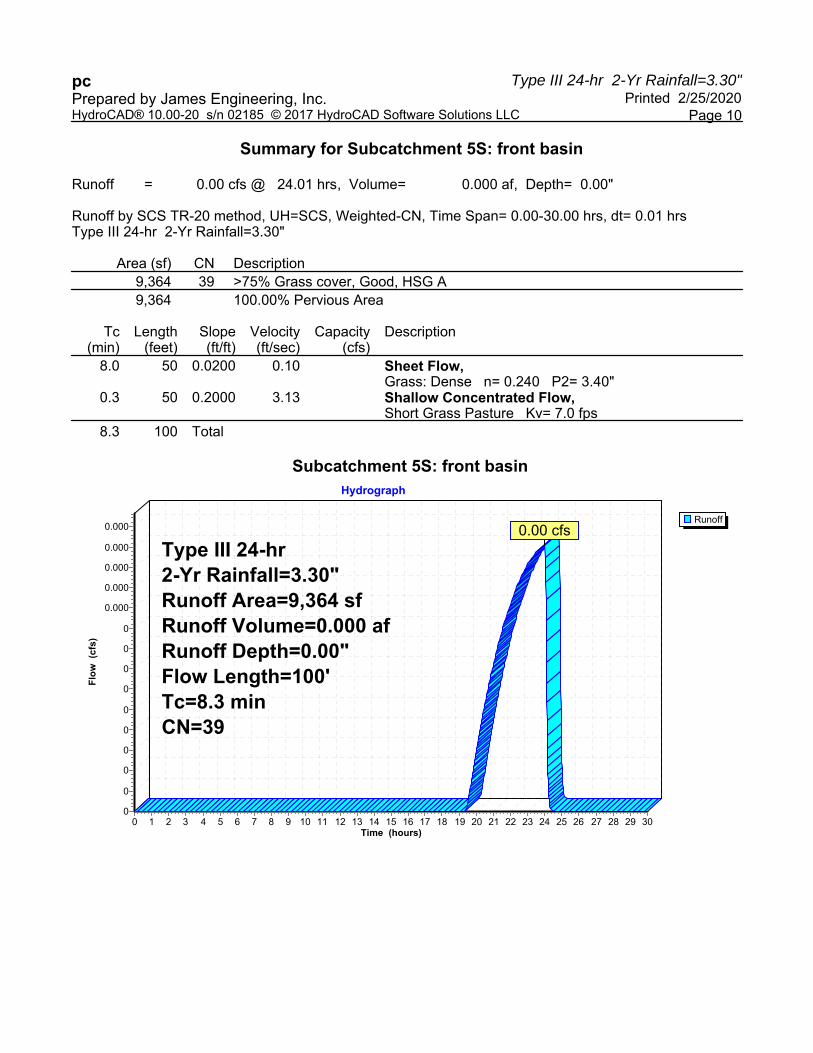
Summary for Subcatchment 5S: front basin
Runoff = 0.00 cfs @ 24.01 hrs, Volume= 0.000 af, Depth= 0.00"
Runoff by SCS TR-20 method, UH=SCS, Weighted-CN, Time Span= 0.00-30.00 hrs, dt= 0.01 hrsType III 24-hr 2-Yr Rainfall=3.30"
Area (sf) CN Description9,364 39 >75% Grass cover, Good, HSG A9,364 100.00% Pervious Area
Tc Length Slope Velocity Capacity Description(min) (feet) (ft/ft) (ft/sec) (cfs)
8.0 50 0.0200 0.10 Sheet Flow, Grass: Dense n= 0.240 P2= 3.40"
0.3 50 0.2000 3.13 Shallow Concentrated Flow, Short Grass Pasture Kv= 7.0 fps
8.3 100 Total
Subcatchment 5S: front basin
Runoff
Hydrograph
Time (hours)3029282726252423222120191817161514131211109876543210
Flo
w (
cfs)
0.000
0.000
0.000
0.000
0.000
0
0
0
0
0
0
0
0
0
0
Type III 24-hr2-Yr Rainfall=3.30"Runoff Area=9,364 sfRunoff Volume=0.000 afRunoff Depth=0.00"Flow Length=100'Tc=8.3 minCN=39
0.00 cfs
Type III 24-hr 2-Yr Rainfall=3.30"pc Printed 2/25/2020Prepared by James Engineering, Inc.
Page 11HydroCAD® 10.00-20 s/n 02185 © 2017 HydroCAD Software Solutions LLC
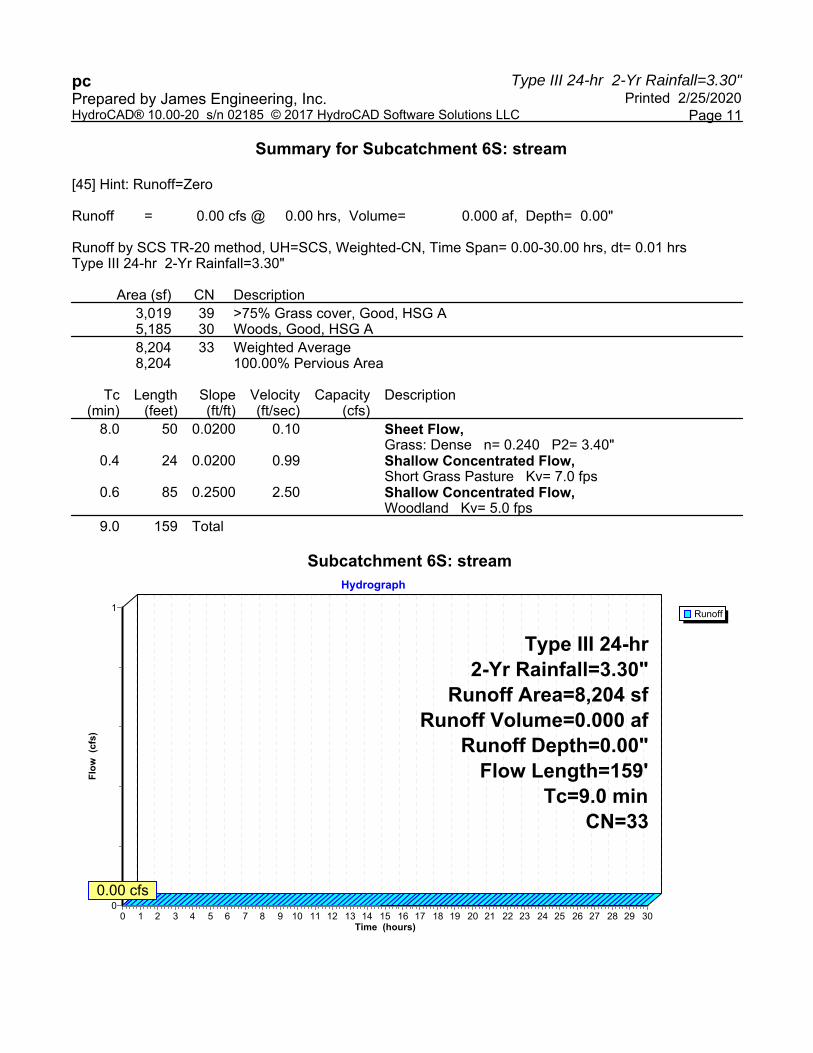
Summary for Subcatchment 6S: stream
[45] Hint: Runoff=Zero
Runoff = 0.00 cfs @ 0.00 hrs, Volume= 0.000 af, Depth= 0.00"
Runoff by SCS TR-20 method, UH=SCS, Weighted-CN, Time Span= 0.00-30.00 hrs, dt= 0.01 hrsType III 24-hr 2-Yr Rainfall=3.30"
Area (sf) CN Description3,019 39 >75% Grass cover, Good, HSG A5,185 30 Woods, Good, HSG A8,204 33 Weighted Average8,204 100.00% Pervious Area
Tc Length Slope Velocity Capacity Description(min) (feet) (ft/ft) (ft/sec) (cfs)
8.0 50 0.0200 0.10 Sheet Flow, Grass: Dense n= 0.240 P2= 3.40"
0.4 24 0.0200 0.99 Shallow Concentrated Flow, Short Grass Pasture Kv= 7.0 fps
0.6 85 0.2500 2.50 Shallow Concentrated Flow, Woodland Kv= 5.0 fps
9.0 159 Total
Subcatchment 6S: stream
Runoff
Hydrograph
Time (hours)3029282726252423222120191817161514131211109876543210
Flo
w (
cfs)
1
0
Type III 24-hr2-Yr Rainfall=3.30"
Runoff Area=8,204 sfRunoff Volume=0.000 af
Runoff Depth=0.00"Flow Length=159'
Tc=9.0 minCN=33
0.00 cfs
Type III 24-hr 2-Yr Rainfall=3.30"pc Printed 2/25/2020Prepared by James Engineering, Inc.
Page 12HydroCAD® 10.00-20 s/n 02185 © 2017 HydroCAD Software Solutions LLC
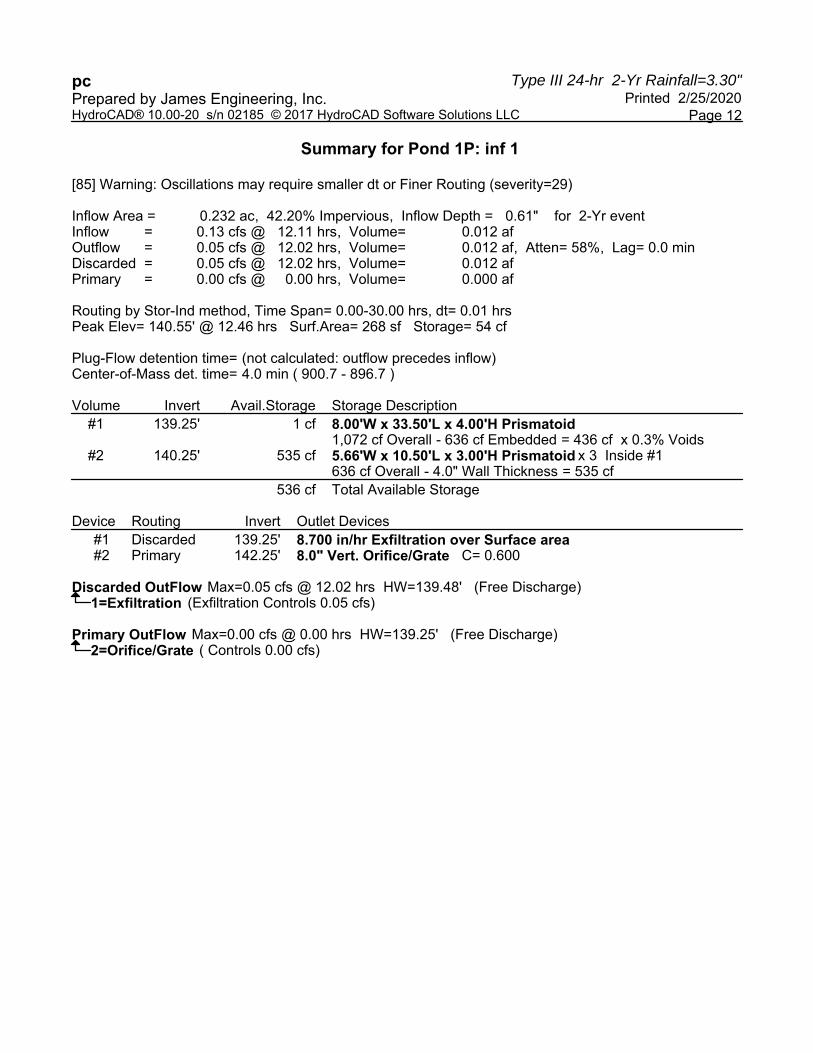
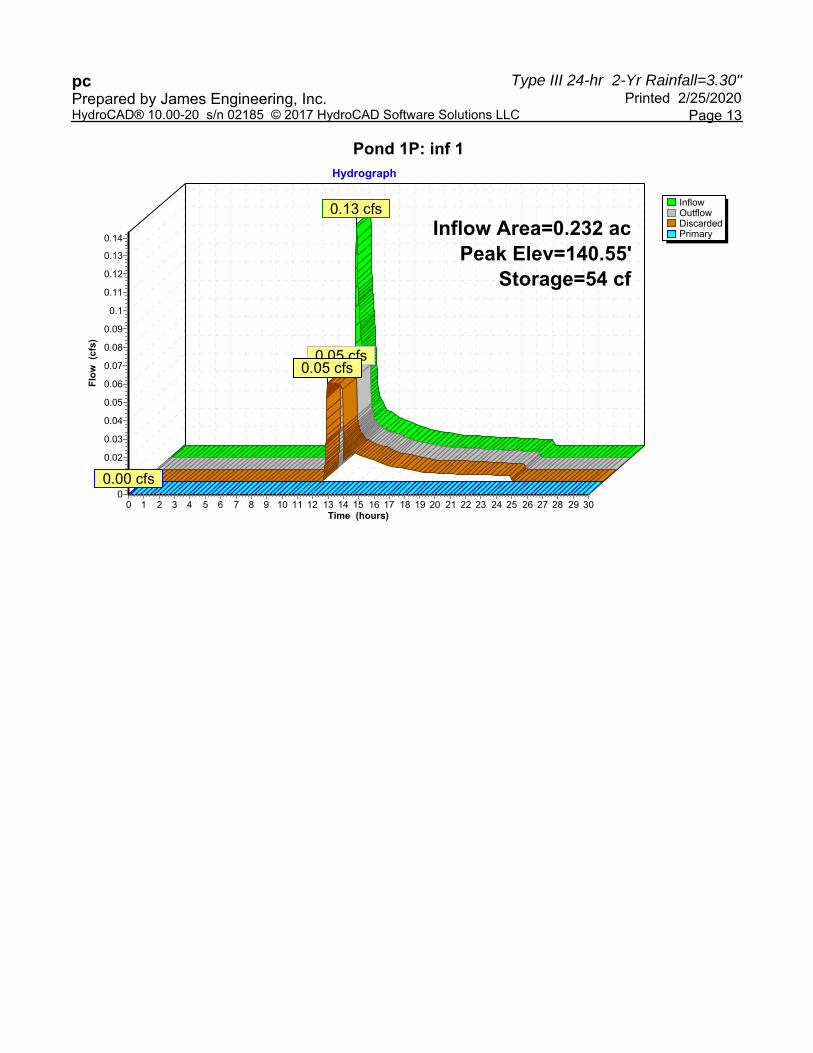
Summary for Pond 1P: inf 1
[85] Warning: Oscillations may require smaller dt or Finer Routing (severity=29)
Inflow Area = 0.232 ac, 42.20% Impervious, Inflow Depth = 0.61" for 2-Yr eventInflow = 0.13 cfs @ 12.11 hrs, Volume= 0.012 afOutflow = 0.05 cfs @ 12.02 hrs, Volume= 0.012 af, Atten= 58%, Lag= 0.0 minDiscarded = 0.05 cfs @ 12.02 hrs, Volume= 0.012 afPrimary = 0.00 cfs @ 0.00 hrs, Volume= 0.000 af
Routing by Stor-Ind method, Time Span= 0.00-30.00 hrs, dt= 0.01 hrsPeak Elev= 140.55' @ 12.46 hrs Surf.Area= 268 sf Storage= 54 cf
Plug-Flow detention time= (not calculated: outflow precedes inflow)Center-of-Mass det. time= 4.0 min ( 900.7 - 896.7 )
Volume Invert Avail.Storage Storage Description#1 139.25' 1 cf 8.00'W x 33.50'L x 4.00'H Prismatoid
1,072 cf Overall - 636 cf Embedded = 436 cf x 0.3% Voids#2 140.25' 535 cf 5.66'W x 10.50'L x 3.00'H Prismatoid x 3 Inside #1
636 cf Overall - 4.0" Wall Thickness = 535 cf536 cf Total Available Storage
Device Routing Invert Outlet Devices#1 Discarded 139.25' 8.700 in/hr Exfiltration over Surface area #2 Primary 142.25' 8.0" Vert. Orifice/Grate C= 0.600
Discarded OutFlow Max=0.05 cfs @ 12.02 hrs HW=139.48' (Free Discharge)1=Exfiltration (Exfiltration Controls 0.05 cfs)
Primary OutFlow Max=0.00 cfs @ 0.00 hrs HW=139.25' (Free Discharge)2=Orifice/Grate ( Controls 0.00 cfs)
Type III 24-hr 2-Yr Rainfall=3.30"pc Printed 2/25/2020Prepared by James Engineering, Inc.
Page 13HydroCAD® 10.00-20 s/n 02185 © 2017 HydroCAD Software Solutions LLC
Pond 1P: inf 1
InflowOutflowDiscardedPrimary
Hydrograph
Time (hours)3029282726252423222120191817161514131211109876543210
Flo
w (
cfs)
0.14
0.13
0.12
0.11
0.1
0.09
0.08
0.07
0.06
0.05
0.04
0.03
0.02
0.01
0
Inflow Area=0.232 acPeak Elev=140.55'
Storage=54 cf
0.13 cfs
0.05 cfs0.05 cfs
0.00 cfs
Type III 24-hr 2-Yr Rainfall=3.30"pc Printed 2/25/2020Prepared by James Engineering, Inc.
Page 14HydroCAD® 10.00-20 s/n 02185 © 2017 HydroCAD Software Solutions LLC
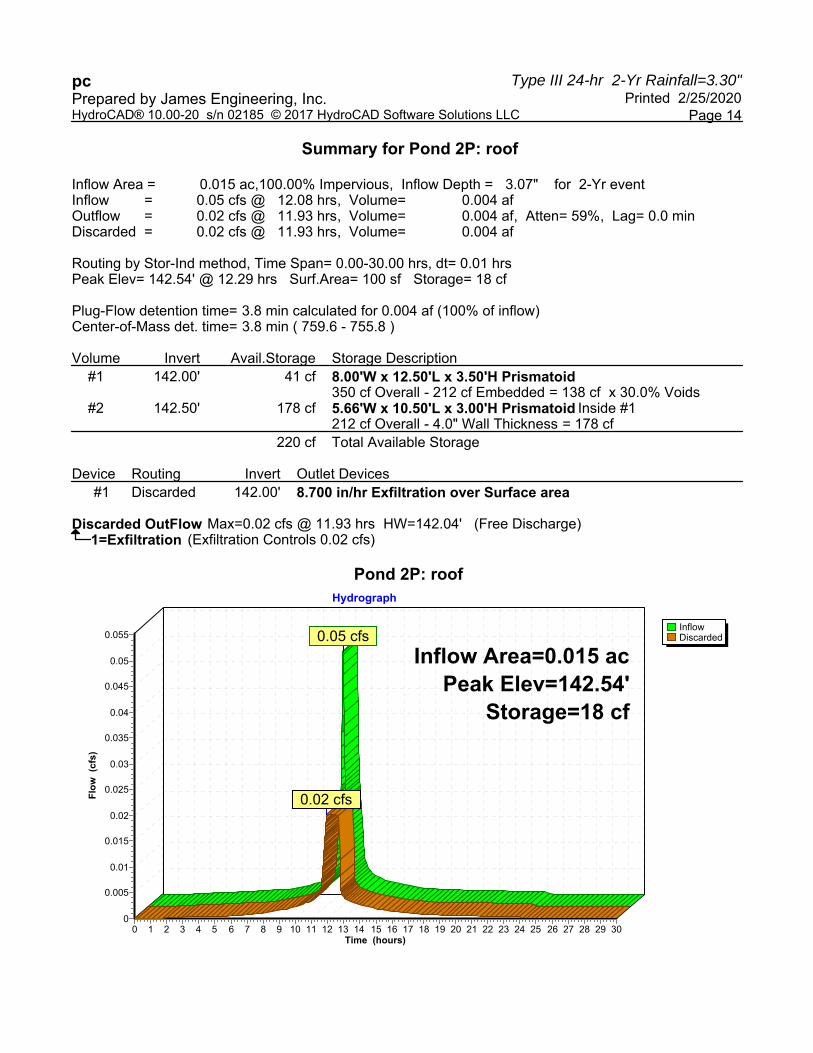
Summary for Pond 2P: roof
Inflow Area = 0.015 ac,100.00% Impervious, Inflow Depth = 3.07" for 2-Yr eventInflow = 0.05 cfs @ 12.08 hrs, Volume= 0.004 afOutflow = 0.02 cfs @ 11.93 hrs, Volume= 0.004 af, Atten= 59%, Lag= 0.0 minDiscarded = 0.02 cfs @ 11.93 hrs, Volume= 0.004 af
Routing by Stor-Ind method, Time Span= 0.00-30.00 hrs, dt= 0.01 hrsPeak Elev= 142.54' @ 12.29 hrs Surf.Area= 100 sf Storage= 18 cf
Plug-Flow detention time= 3.8 min calculated for 0.004 af (100% of inflow)Center-of-Mass det. time= 3.8 min ( 759.6 - 755.8 )
Volume Invert Avail.Storage Storage Description#1 142.00' 41 cf 8.00'W x 12.50'L x 3.50'H Prismatoid
350 cf Overall - 212 cf Embedded = 138 cf x 30.0% Voids#2 142.50' 178 cf 5.66'W x 10.50'L x 3.00'H Prismatoid Inside #1
212 cf Overall - 4.0" Wall Thickness = 178 cf220 cf Total Available Storage
Device Routing Invert Outlet Devices#1 Discarded 142.00' 8.700 in/hr Exfiltration over Surface area
Discarded OutFlow Max=0.02 cfs @ 11.93 hrs HW=142.04' (Free Discharge)1=Exfiltration (Exfiltration Controls 0.02 cfs)
Pond 2P: roof
InflowDiscarded
Hydrograph
Time (hours)3029282726252423222120191817161514131211109876543210
Flo
w (
cfs)
0.055
0.05
0.045
0.04
0.035
0.03
0.025
0.02
0.015
0.01
0.005
0
Inflow Area=0.015 acPeak Elev=142.54'
Storage=18 cf
0.05 cfs
0.02 cfs
Type III 24-hr 2-Yr Rainfall=3.30"pc Printed 2/25/2020Prepared by James Engineering, Inc.
Page 15HydroCAD® 10.00-20 s/n 02185 © 2017 HydroCAD Software Solutions LLC
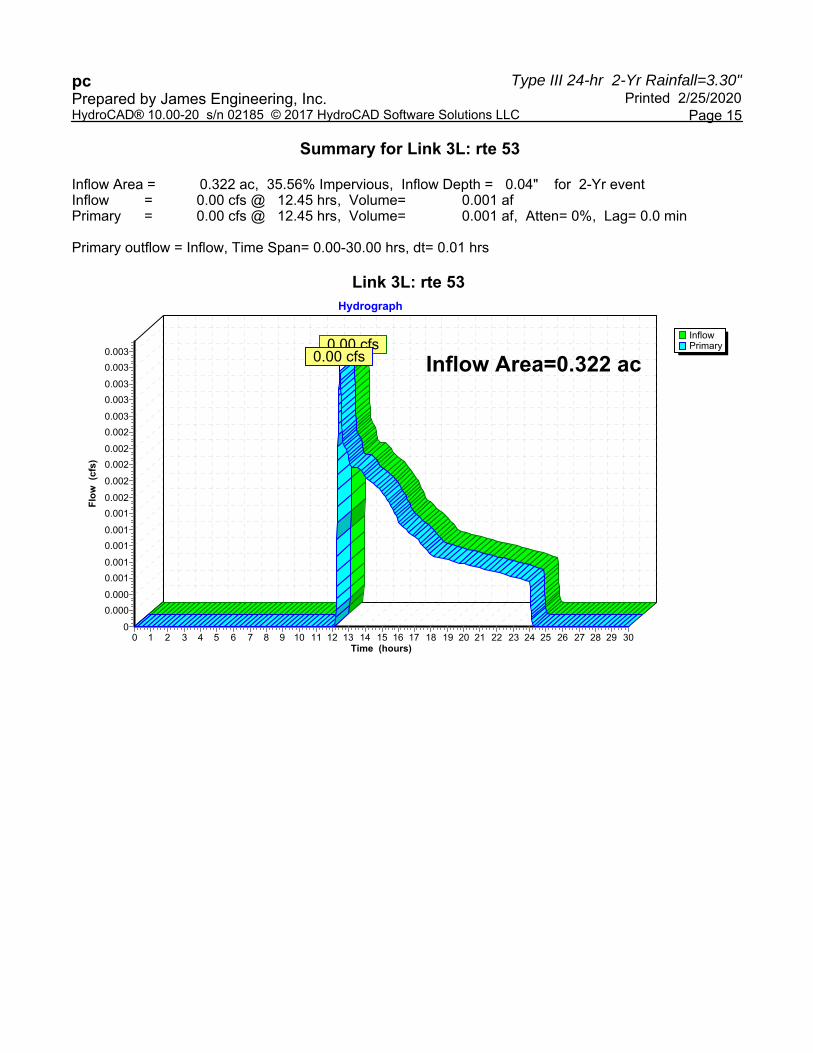
Summary for Link 3L: rte 53
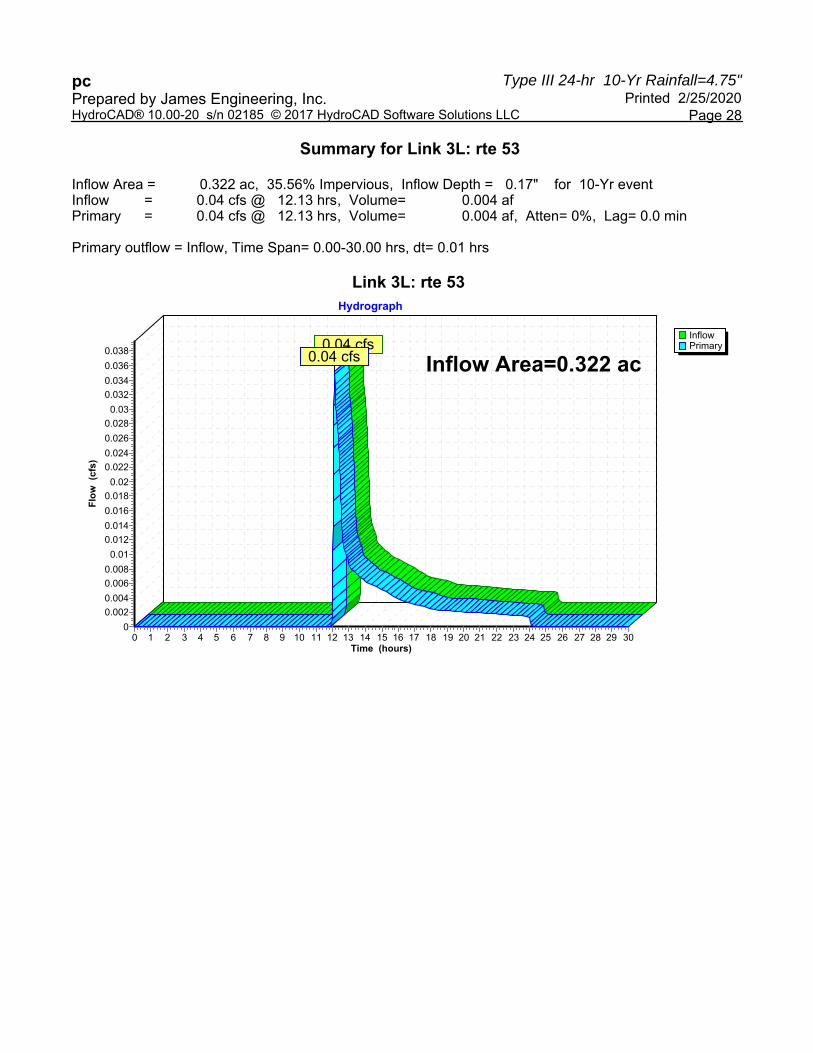
Inflow Area = 0.322 ac, 35.56% Impervious, Inflow Depth = 0.04" for 2-Yr eventInflow = 0.00 cfs @ 12.45 hrs, Volume= 0.001 afPrimary = 0.00 cfs @ 12.45 hrs, Volume= 0.001 af, Atten= 0%, Lag= 0.0 min
Primary outflow = Inflow, Time Span= 0.00-30.00 hrs, dt= 0.01 hrs
Link 3L: rte 53
InflowPrimary
Hydrograph
Time (hours)3029282726252423222120191817161514131211109876543210
Flo
w (
cfs)
0.003
0.003
0.003
0.003
0.003
0.002
0.002
0.002
0.002
0.002
0.001
0.001
0.001
0.001
0.001
0.000
0.000
0
Inflow Area=0.322 ac0.00 cfs
0.00 cfs

Type III 24-hr 2-Yr Rainfall=3.30"pc Printed 2/25/2020Prepared by James Engineering, Inc.
Page 16HydroCAD® 10.00-20 s/n 02185 © 2017 HydroCAD Software Solutions LLC
Summary for Link 4L: site total
Inflow Area = 0.932 ac, 12.29% Impervious, Inflow Depth = 0.01" for 2-Yr eventInflow = 0.00 cfs @ 12.45 hrs, Volume= 0.001 afPrimary = 0.00 cfs @ 12.45 hrs, Volume= 0.001 af, Atten= 0%, Lag= 0.0 min
Primary outflow = Inflow, Time Span= 0.00-30.00 hrs, dt= 0.01 hrs
Link 4L: site total
InflowPrimary
Hydrograph
Time (hours)3029282726252423222120191817161514131211109876543210
Flo
w (
cfs)
0.003
0.003
0.003
0.003
0.003
0.002
0.002
0.002
0.002
0.002
0.001
0.001
0.001
0.001
0.001
0.000
0.000
0
Inflow Area=0.932 ac0.00 cfs
0.00 cfs
Type III 24-hr 2-Yr Rainfall=3.30"pc Printed 2/25/2020Prepared by James Engineering, Inc.
Page 17HydroCAD® 10.00-20 s/n 02185 © 2017 HydroCAD Software Solutions LLC
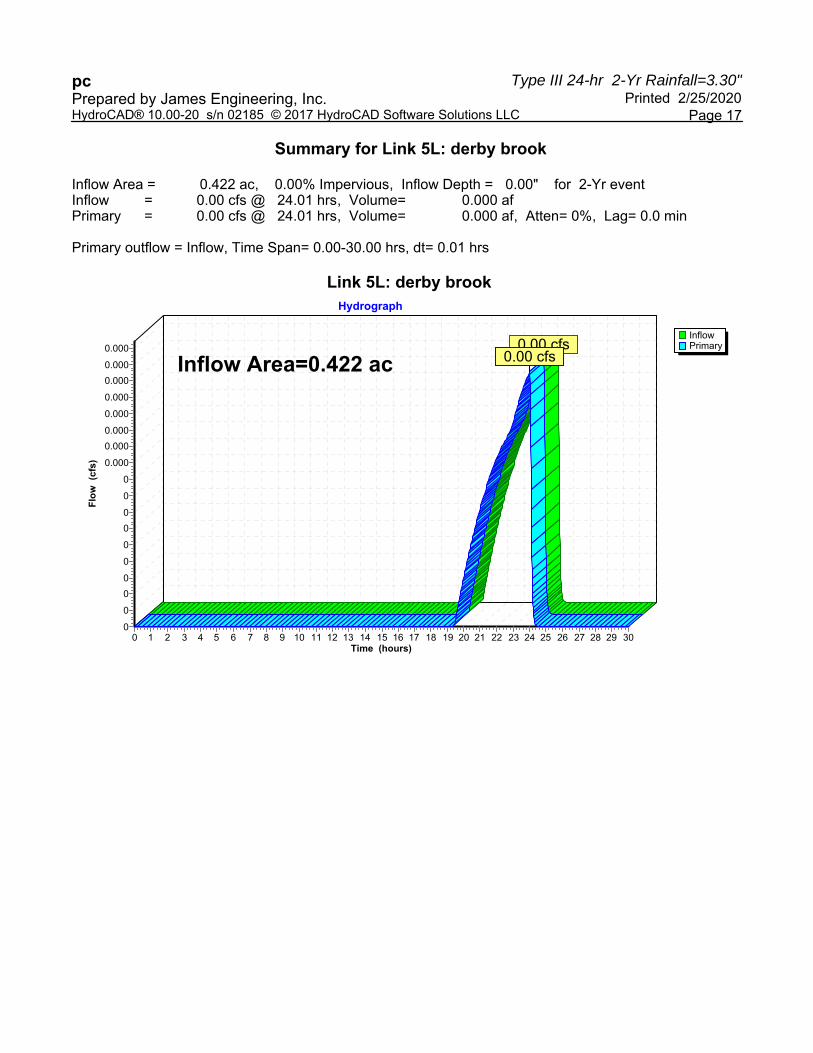
Summary for Link 5L: derby brook
Inflow Area = 0.422 ac, 0.00% Impervious, Inflow Depth = 0.00" for 2-Yr eventInflow = 0.00 cfs @ 24.01 hrs, Volume= 0.000 afPrimary = 0.00 cfs @ 24.01 hrs, Volume= 0.000 af, Atten= 0%, Lag= 0.0 min
Primary outflow = Inflow, Time Span= 0.00-30.00 hrs, dt= 0.01 hrs
Link 5L: derby brook
InflowPrimary
Hydrograph
Time (hours)3029282726252423222120191817161514131211109876543210
Flo
w (
cfs)
0.000
0.000
0.000
0.000
0.000
0.000
0.000
0.000
0
0
0
0
0
0
0
0
0
0
Inflow Area=0.422 ac0.00 cfs
0.00 cfs
Type III 24-hr 10-Yr Rainfall=4.75"pc Printed 2/25/2020Prepared by James Engineering, Inc.
Page 18HydroCAD® 10.00-20 s/n 02185 © 2017 HydroCAD Software Solutions LLC
Time span=0.00-30.00 hrs, dt=0.01 hrs, 3001 pointsRunoff by SCS TR-20 method, UH=SCS, Weighted-CN
Reach routing by Stor-Ind+Trans method - Pond routing by Stor-Ind method
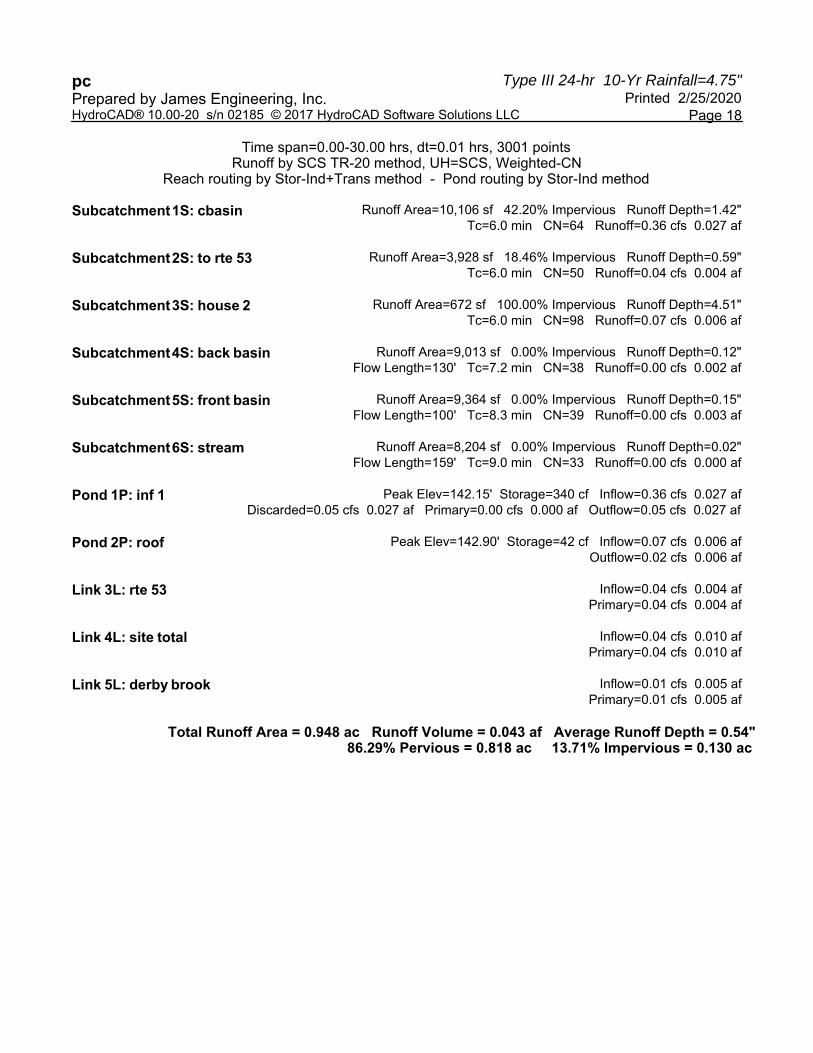
Runoff Area=10,106 sf 42.20% Impervious Runoff Depth=1.42"Subcatchment 1S: cbasin Tc=6.0 min CN=64 Runoff=0.36 cfs 0.027 af
Runoff Area=3,928 sf 18.46% Impervious Runoff Depth=0.59"Subcatchment 2S: to rte 53 Tc=6.0 min CN=50 Runoff=0.04 cfs 0.004 af
Runoff Area=672 sf 100.00% Impervious Runoff Depth=4.51"Subcatchment 3S: house 2 Tc=6.0 min CN=98 Runoff=0.07 cfs 0.006 af
Runoff Area=9,013 sf 0.00% Impervious Runoff Depth=0.12"Subcatchment 4S: back basin Flow Length=130' Tc=7.2 min CN=38 Runoff=0.00 cfs 0.002 af
Runoff Area=9,364 sf 0.00% Impervious Runoff Depth=0.15"Subcatchment 5S: front basin Flow Length=100' Tc=8.3 min CN=39 Runoff=0.00 cfs 0.003 af
Runoff Area=8,204 sf 0.00% Impervious Runoff Depth=0.02"Subcatchment 6S: stream Flow Length=159' Tc=9.0 min CN=33 Runoff=0.00 cfs 0.000 af
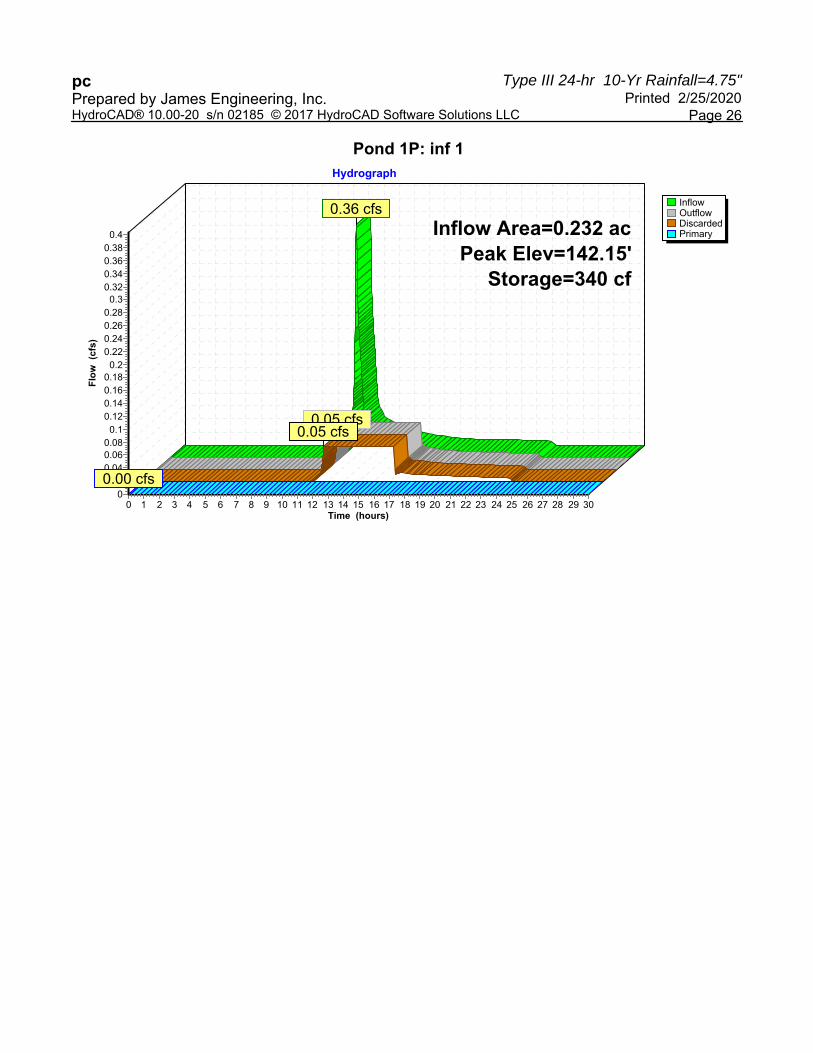
Peak Elev=142.15' Storage=340 cf Inflow=0.36 cfs 0.027 afPond 1P: inf 1 Discarded=0.05 cfs 0.027 af Primary=0.00 cfs 0.000 af Outflow=0.05 cfs 0.027 af
Peak Elev=142.90' Storage=42 cf Inflow=0.07 cfs 0.006 afPond 2P: roof Outflow=0.02 cfs 0.006 af
Inflow=0.04 cfs 0.004 afLink 3L: rte 53 Primary=0.04 cfs 0.004 af
Inflow=0.04 cfs 0.010 afLink 4L: site total Primary=0.04 cfs 0.010 af
Inflow=0.01 cfs 0.005 afLink 5L: derby brook Primary=0.01 cfs 0.005 af
Total Runoff Area = 0.948 ac Runoff Volume = 0.043 af Average Runoff Depth = 0.54"86.29% Pervious = 0.818 ac 13.71% Impervious = 0.130 ac

Type III 24-hr 10-Yr Rainfall=4.75"pc Printed 2/25/2020Prepared by James Engineering, Inc.
Page 19HydroCAD® 10.00-20 s/n 02185 © 2017 HydroCAD Software Solutions LLC
Summary for Subcatchment 1S: cbasin
Runoff = 0.36 cfs @ 12.10 hrs, Volume= 0.027 af, Depth= 1.42"
Runoff by SCS TR-20 method, UH=SCS, Weighted-CN, Time Span= 0.00-30.00 hrs, dt= 0.01 hrsType III 24-hr 10-Yr Rainfall=4.75"
Area (sf) CN Description3,333 98 Paved parking, HSG A
* 160 98 sheds* 100 98 walkways
5,841 39 >75% Grass cover, Good, HSG A* 672 98 roof
10,106 64 Weighted Average5,841 57.80% Pervious Area4,265 42.20% Impervious Area
Tc Length Slope Velocity Capacity Description(min) (feet) (ft/ft) (ft/sec) (cfs)
6.0 Direct Entry, minimum
Subcatchment 1S: cbasin
Runoff
Hydrograph
Time (hours)3029282726252423222120191817161514131211109876543210
Flo
w (
cfs)
0.4
0.38
0.36
0.34
0.32
0.3
0.28
0.26
0.24
0.22
0.2
0.18
0.16
0.14
0.12
0.1
0.08
0.06
0.04
0.02
0
Type III 24-hr10-Yr Rainfall=4.75"
Runoff Area=10,106 sfRunoff Volume=0.027 af
Runoff Depth=1.42"Tc=6.0 min
CN=64
0.36 cfs
Type III 24-hr 10-Yr Rainfall=4.75"pc Printed 2/25/2020Prepared by James Engineering, Inc.
Page 20HydroCAD® 10.00-20 s/n 02185 © 2017 HydroCAD Software Solutions LLC
Summary for Subcatchment 2S: to rte 53
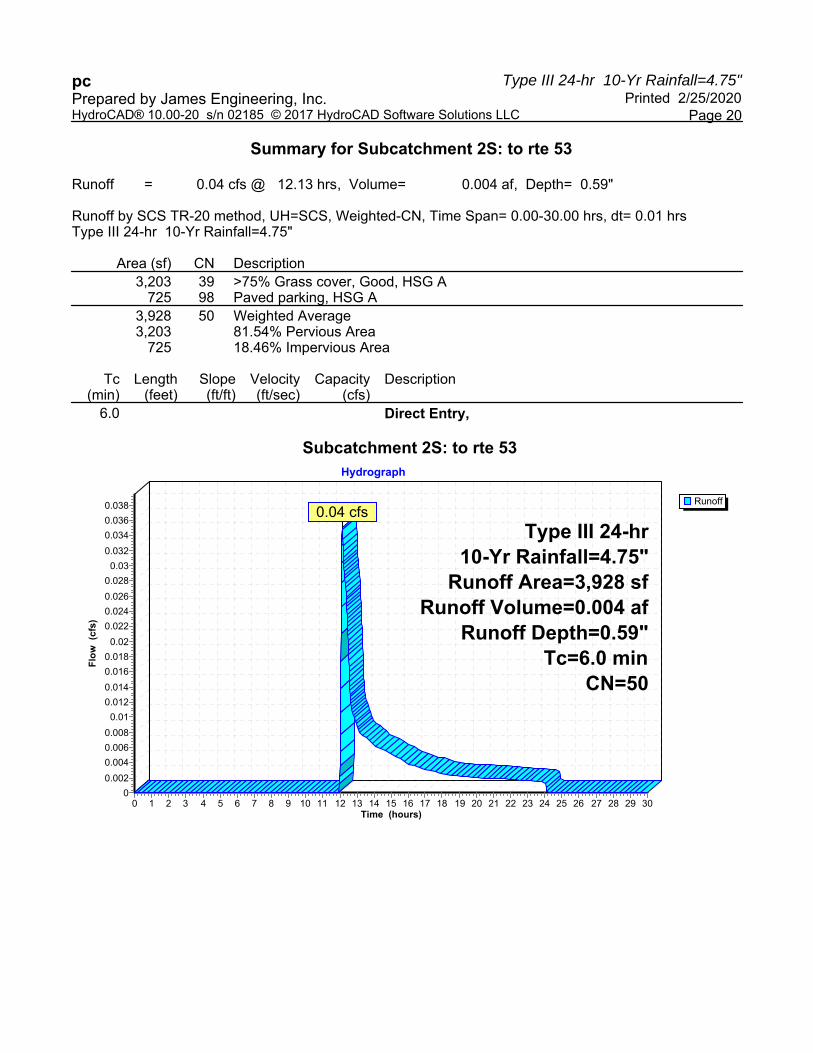
Runoff = 0.04 cfs @ 12.13 hrs, Volume= 0.004 af, Depth= 0.59"
Runoff by SCS TR-20 method, UH=SCS, Weighted-CN, Time Span= 0.00-30.00 hrs, dt= 0.01 hrsType III 24-hr 10-Yr Rainfall=4.75"
Area (sf) CN Description3,203 39 >75% Grass cover, Good, HSG A
725 98 Paved parking, HSG A3,928 50 Weighted Average3,203 81.54% Pervious Area
725 18.46% Impervious Area
Tc Length Slope Velocity Capacity Description(min) (feet) (ft/ft) (ft/sec) (cfs)
6.0 Direct Entry,
Subcatchment 2S: to rte 53
Runoff
Hydrograph
Time (hours)3029282726252423222120191817161514131211109876543210
Flo
w (
cfs)
0.038
0.036
0.034
0.032
0.03
0.028
0.026
0.024
0.022
0.02
0.018
0.016
0.014
0.012
0.01
0.008
0.006
0.004
0.002
0
Type III 24-hr10-Yr Rainfall=4.75"
Runoff Area=3,928 sfRunoff Volume=0.004 af
Runoff Depth=0.59"Tc=6.0 min
CN=50
0.04 cfs
Type III 24-hr 10-Yr Rainfall=4.75"pc Printed 2/25/2020Prepared by James Engineering, Inc.
Page 21HydroCAD® 10.00-20 s/n 02185 © 2017 HydroCAD Software Solutions LLC
Summary for Subcatchment 3S: house 2
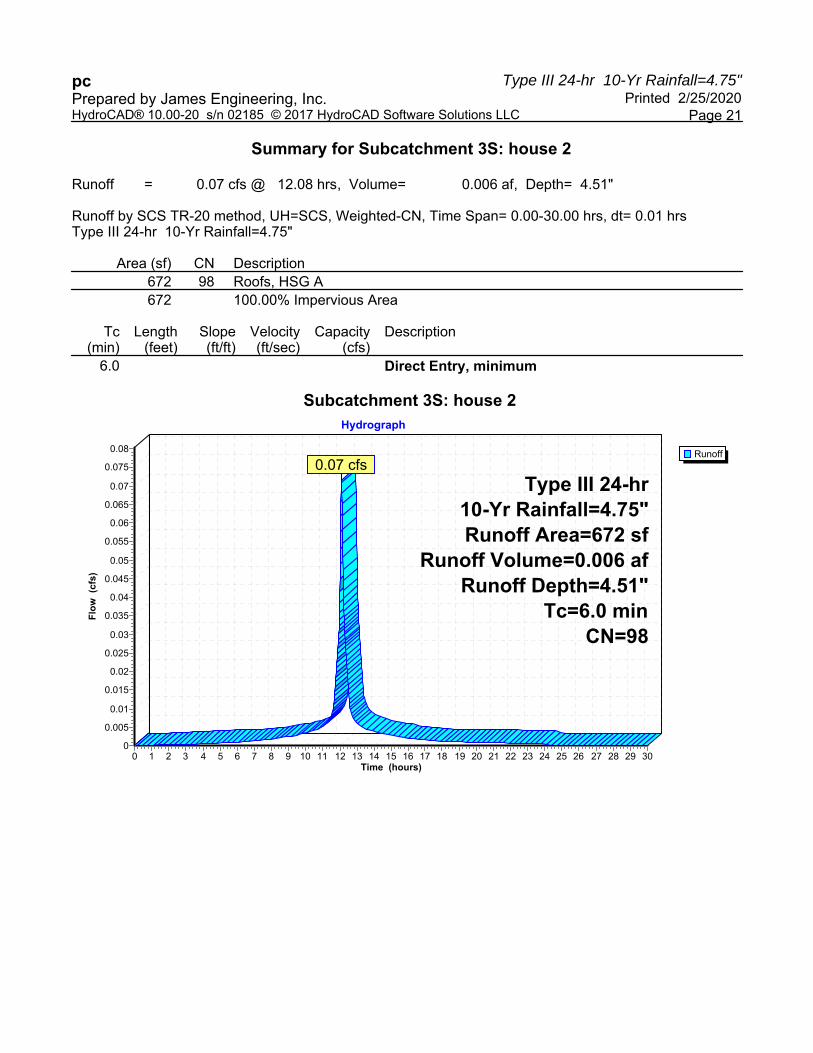
Runoff = 0.07 cfs @ 12.08 hrs, Volume= 0.006 af, Depth= 4.51"
Runoff by SCS TR-20 method, UH=SCS, Weighted-CN, Time Span= 0.00-30.00 hrs, dt= 0.01 hrsType III 24-hr 10-Yr Rainfall=4.75"
Area (sf) CN Description672 98 Roofs, HSG A672 100.00% Impervious Area
Tc Length Slope Velocity Capacity Description(min) (feet) (ft/ft) (ft/sec) (cfs)
6.0 Direct Entry, minimum
Subcatchment 3S: house 2
Runoff
Hydrograph
Time (hours)3029282726252423222120191817161514131211109876543210
Flo
w (
cfs)
0.08
0.075
0.07
0.065
0.06
0.055
0.05
0.045
0.04
0.035
0.03
0.025
0.02
0.015
0.01
0.005
0
Type III 24-hr10-Yr Rainfall=4.75"Runoff Area=672 sf
Runoff Volume=0.006 afRunoff Depth=4.51"
Tc=6.0 minCN=98
0.07 cfs
Type III 24-hr 10-Yr Rainfall=4.75"pc Printed 2/25/2020Prepared by James Engineering, Inc.
Page 22HydroCAD® 10.00-20 s/n 02185 © 2017 HydroCAD Software Solutions LLC
Summary for Subcatchment 4S: back basin
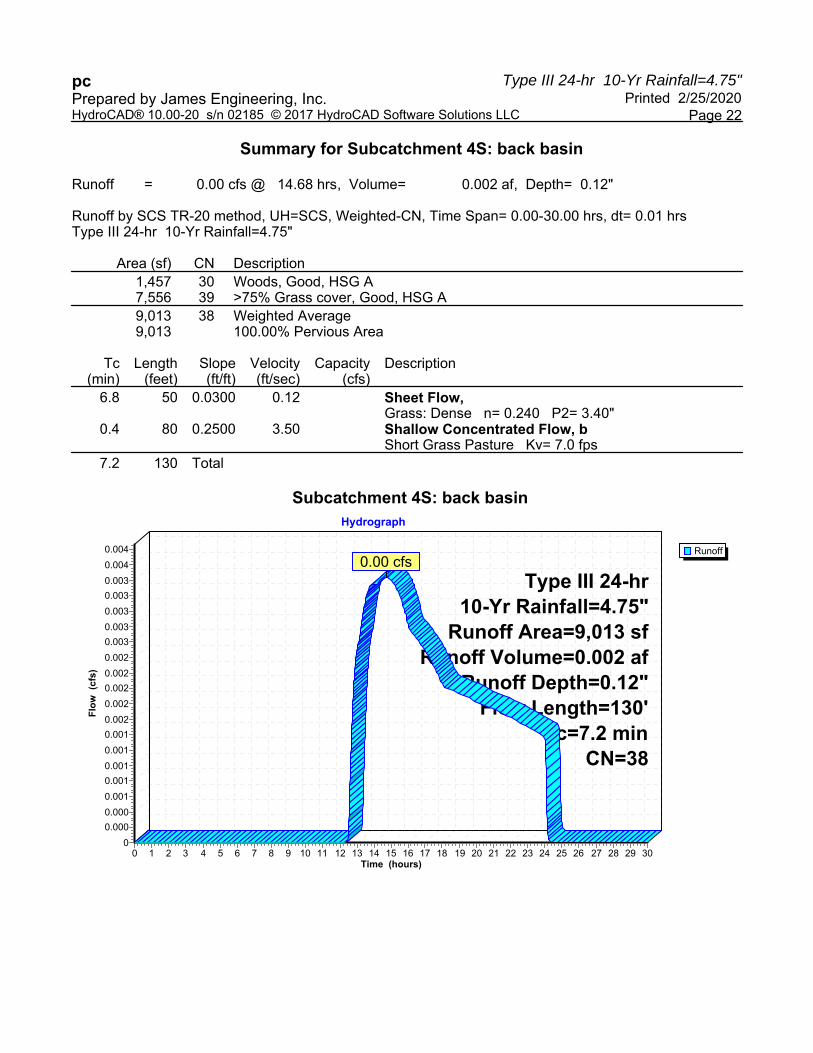
Runoff = 0.00 cfs @ 14.68 hrs, Volume= 0.002 af, Depth= 0.12"
Runoff by SCS TR-20 method, UH=SCS, Weighted-CN, Time Span= 0.00-30.00 hrs, dt= 0.01 hrsType III 24-hr 10-Yr Rainfall=4.75"
Area (sf) CN Description1,457 30 Woods, Good, HSG A7,556 39 >75% Grass cover, Good, HSG A9,013 38 Weighted Average9,013 100.00% Pervious Area
Tc Length Slope Velocity Capacity Description(min) (feet) (ft/ft) (ft/sec) (cfs)
6.8 50 0.0300 0.12 Sheet Flow, Grass: Dense n= 0.240 P2= 3.40"
0.4 80 0.2500 3.50 Shallow Concentrated Flow, bShort Grass Pasture Kv= 7.0 fps
7.2 130 Total
Subcatchment 4S: back basin
Runoff
Hydrograph
Time (hours)3029282726252423222120191817161514131211109876543210
Flo
w (
cfs)
0.004
0.004
0.003
0.003
0.003
0.003
0.003
0.002
0.002
0.002
0.002
0.002
0.001
0.001
0.001
0.001
0.001
0.000
0.000
0
Type III 24-hr10-Yr Rainfall=4.75"
Runoff Area=9,013 sfRunoff Volume=0.002 af
Runoff Depth=0.12"Flow Length=130'
Tc=7.2 minCN=38
0.00 cfs
Type III 24-hr 10-Yr Rainfall=4.75"pc Printed 2/25/2020Prepared by James Engineering, Inc.
Page 23HydroCAD® 10.00-20 s/n 02185 © 2017 HydroCAD Software Solutions LLC
Summary for Subcatchment 5S: front basin
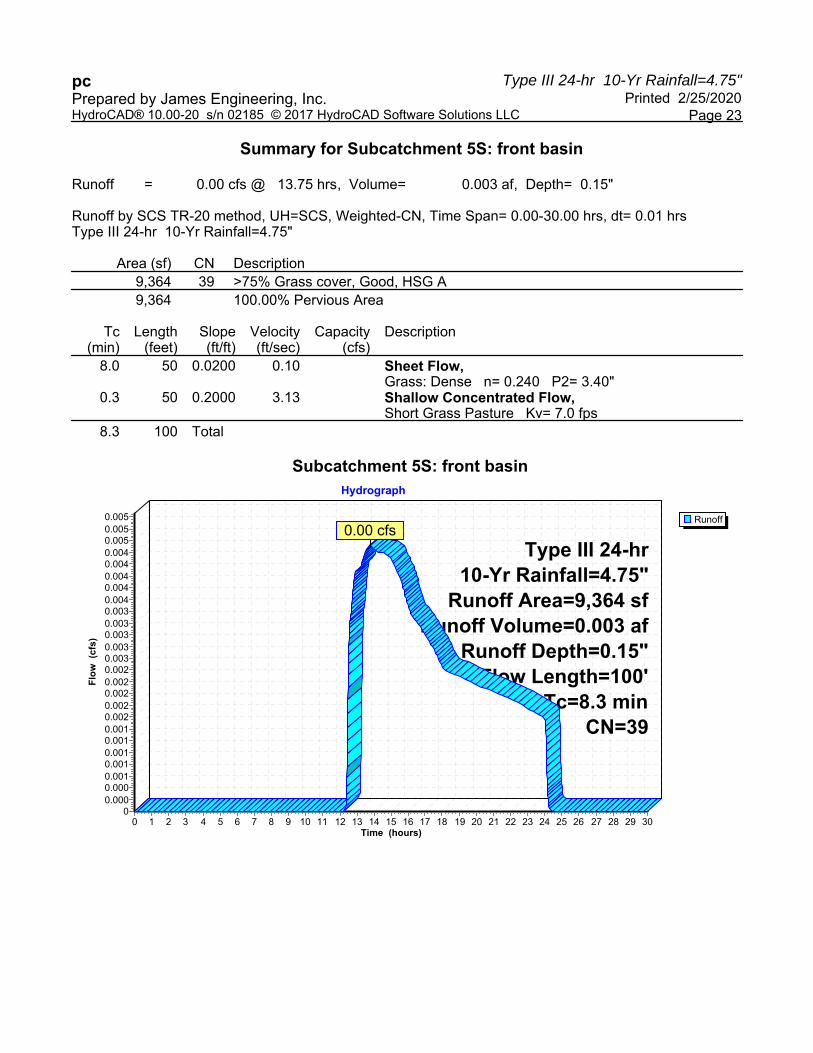
Runoff = 0.00 cfs @ 13.75 hrs, Volume= 0.003 af, Depth= 0.15"
Runoff by SCS TR-20 method, UH=SCS, Weighted-CN, Time Span= 0.00-30.00 hrs, dt= 0.01 hrsType III 24-hr 10-Yr Rainfall=4.75"
Area (sf) CN Description9,364 39 >75% Grass cover, Good, HSG A9,364 100.00% Pervious Area
Tc Length Slope Velocity Capacity Description(min) (feet) (ft/ft) (ft/sec) (cfs)
8.0 50 0.0200 0.10 Sheet Flow, Grass: Dense n= 0.240 P2= 3.40"
0.3 50 0.2000 3.13 Shallow Concentrated Flow, Short Grass Pasture Kv= 7.0 fps
8.3 100 Total
Subcatchment 5S: front basin
Runoff
Hydrograph
Time (hours)3029282726252423222120191817161514131211109876543210
Flo
w (
cfs)
0.0050.0050.0050.0040.0040.0040.0040.0040.0030.0030.0030.0030.0030.0020.0020.0020.0020.0020.0010.0010.0010.0010.0010.0000.000
0
Type III 24-hr10-Yr Rainfall=4.75"
Runoff Area=9,364 sfRunoff Volume=0.003 af
Runoff Depth=0.15"Flow Length=100'
Tc=8.3 minCN=39
0.00 cfs

Type III 24-hr 10-Yr Rainfall=4.75"pc Printed 2/25/2020Prepared by James Engineering, Inc.
Page 24HydroCAD® 10.00-20 s/n 02185 © 2017 HydroCAD Software Solutions LLC
Summary for Subcatchment 6S: stream
Runoff = 0.00 cfs @ 21.31 hrs, Volume= 0.000 af, Depth= 0.02"
Runoff by SCS TR-20 method, UH=SCS, Weighted-CN, Time Span= 0.00-30.00 hrs, dt= 0.01 hrsType III 24-hr 10-Yr Rainfall=4.75"
Area (sf) CN Description3,019 39 >75% Grass cover, Good, HSG A5,185 30 Woods, Good, HSG A8,204 33 Weighted Average8,204 100.00% Pervious Area
Tc Length Slope Velocity Capacity Description(min) (feet) (ft/ft) (ft/sec) (cfs)
8.0 50 0.0200 0.10 Sheet Flow, Grass: Dense n= 0.240 P2= 3.40"
0.4 24 0.0200 0.99 Shallow Concentrated Flow, Short Grass Pasture Kv= 7.0 fps
0.6 85 0.2500 2.50 Shallow Concentrated Flow, Woodland Kv= 5.0 fps
9.0 159 Total
Subcatchment 6S: stream
Runoff
Hydrograph
Time (hours)3029282726252423222120191817161514131211109876543210
Flo
w (
cfs)
0.001
0.001
0.001
0.000
0.000
0.000
0.000
0.000
0.000
0.000
0
0
0
Type III 24-hr10-Yr Rainfall=4.75"Runoff Area=8,204 sfRunoff Volume=0.000 afRunoff Depth=0.02"Flow Length=159'Tc=9.0 minCN=33
0.00 cfs

Type III 24-hr 10-Yr Rainfall=4.75"pc Printed 2/25/2020Prepared by James Engineering, Inc.
Page 25HydroCAD® 10.00-20 s/n 02185 © 2017 HydroCAD Software Solutions LLC
Summary for Pond 1P: inf 1
[85] Warning: Oscillations may require smaller dt or Finer Routing (severity=22)
Inflow Area = 0.232 ac, 42.20% Impervious, Inflow Depth = 1.42" for 10-Yr eventInflow = 0.36 cfs @ 12.10 hrs, Volume= 0.027 afOutflow = 0.05 cfs @ 11.81 hrs, Volume= 0.027 af, Atten= 85%, Lag= 0.0 minDiscarded = 0.05 cfs @ 11.81 hrs, Volume= 0.027 afPrimary = 0.00 cfs @ 0.00 hrs, Volume= 0.000 af
Routing by Stor-Ind method, Time Span= 0.00-30.00 hrs, dt= 0.01 hrsPeak Elev= 142.15' @ 12.83 hrs Surf.Area= 268 sf Storage= 340 cf
Plug-Flow detention time= (not calculated: outflow precedes inflow)Center-of-Mass det. time= 48.0 min ( 915.0 - 867.0 )
Volume Invert Avail.Storage Storage Description#1 139.25' 1 cf 8.00'W x 33.50'L x 4.00'H Prismatoid
1,072 cf Overall - 636 cf Embedded = 436 cf x 0.3% Voids#2 140.25' 535 cf 5.66'W x 10.50'L x 3.00'H Prismatoid x 3 Inside #1
636 cf Overall - 4.0" Wall Thickness = 535 cf536 cf Total Available Storage
Device Routing Invert Outlet Devices#1 Discarded 139.25' 8.700 in/hr Exfiltration over Surface area #2 Primary 142.25' 8.0" Vert. Orifice/Grate C= 0.600
Discarded OutFlow Max=0.05 cfs @ 11.81 hrs HW=139.34' (Free Discharge)1=Exfiltration (Exfiltration Controls 0.05 cfs)
Primary OutFlow Max=0.00 cfs @ 0.00 hrs HW=139.25' (Free Discharge)2=Orifice/Grate ( Controls 0.00 cfs)
Type III 24-hr 10-Yr Rainfall=4.75"pc Printed 2/25/2020Prepared by James Engineering, Inc.
Page 26HydroCAD® 10.00-20 s/n 02185 © 2017 HydroCAD Software Solutions LLC
Pond 1P: inf 1
InflowOutflowDiscardedPrimary
Hydrograph
Time (hours)3029282726252423222120191817161514131211109876543210
Flo
w (
cfs)
0.40.380.360.340.32
0.30.280.260.240.22
0.20.180.160.140.12
0.10.080.060.040.02
0
Inflow Area=0.232 acPeak Elev=142.15'
Storage=340 cf
0.36 cfs
0.05 cfs0.05 cfs
0.00 cfs

Type III 24-hr 10-Yr Rainfall=4.75"pc Printed 2/25/2020Prepared by James Engineering, Inc.
Page 27HydroCAD® 10.00-20 s/n 02185 © 2017 HydroCAD Software Solutions LLC
Summary for Pond 2P: roof
Inflow Area = 0.015 ac,100.00% Impervious, Inflow Depth = 4.51" for 10-Yr eventInflow = 0.07 cfs @ 12.08 hrs, Volume= 0.006 afOutflow = 0.02 cfs @ 11.79 hrs, Volume= 0.006 af, Atten= 72%, Lag= 0.0 minDiscarded = 0.02 cfs @ 11.79 hrs, Volume= 0.006 af
Routing by Stor-Ind method, Time Span= 0.00-30.00 hrs, dt= 0.01 hrsPeak Elev= 142.90' @ 12.42 hrs Surf.Area= 100 sf Storage= 42 cf
Plug-Flow detention time= 9.2 min calculated for 0.006 af (100% of inflow)Center-of-Mass det. time= 9.2 min ( 758.1 - 748.9 )
Volume Invert Avail.Storage Storage Description#1 142.00' 41 cf 8.00'W x 12.50'L x 3.50'H Prismatoid
350 cf Overall - 212 cf Embedded = 138 cf x 30.0% Voids#2 142.50' 178 cf 5.66'W x 10.50'L x 3.00'H Prismatoid Inside #1
212 cf Overall - 4.0" Wall Thickness = 178 cf220 cf Total Available Storage
Device Routing Invert Outlet Devices#1 Discarded 142.00' 8.700 in/hr Exfiltration over Surface area
Discarded OutFlow Max=0.02 cfs @ 11.79 hrs HW=142.04' (Free Discharge)1=Exfiltration (Exfiltration Controls 0.02 cfs)
Pond 2P: roof
InflowDiscarded
Hydrograph
Time (hours)3029282726252423222120191817161514131211109876543210
Flo
w (
cfs)
0.08
0.075
0.07
0.065
0.06
0.055
0.05
0.045
0.04
0.035
0.03
0.025
0.02
0.015
0.01
0.005
0
Inflow Area=0.015 acPeak Elev=142.90'
Storage=42 cf
0.07 cfs
0.02 cfs
Type III 24-hr 10-Yr Rainfall=4.75"pc Printed 2/25/2020Prepared by James Engineering, Inc.
Page 28HydroCAD® 10.00-20 s/n 02185 © 2017 HydroCAD Software Solutions LLC
Summary for Link 3L: rte 53
Inflow Area = 0.322 ac, 35.56% Impervious, Inflow Depth = 0.17" for 10-Yr eventInflow = 0.04 cfs @ 12.13 hrs, Volume= 0.004 afPrimary = 0.04 cfs @ 12.13 hrs, Volume= 0.004 af, Atten= 0%, Lag= 0.0 min
Primary outflow = Inflow, Time Span= 0.00-30.00 hrs, dt= 0.01 hrs
Link 3L: rte 53
InflowPrimary
Hydrograph
Time (hours)3029282726252423222120191817161514131211109876543210
Flo
w (
cfs)
0.038
0.036
0.034
0.032
0.03
0.028
0.026
0.024
0.022
0.02
0.018
0.016
0.014
0.012
0.01
0.008
0.006
0.004
0.002
0
Inflow Area=0.322 ac0.04 cfs
0.04 cfs

Type III 24-hr 10-Yr Rainfall=4.75"pc Printed 2/25/2020Prepared by James Engineering, Inc.
Page 29HydroCAD® 10.00-20 s/n 02185 © 2017 HydroCAD Software Solutions LLC
Summary for Link 4L: site total
Inflow Area = 0.932 ac, 12.29% Impervious, Inflow Depth = 0.12" for 10-Yr eventInflow = 0.04 cfs @ 12.13 hrs, Volume= 0.010 afPrimary = 0.04 cfs @ 12.13 hrs, Volume= 0.010 af, Atten= 0%, Lag= 0.0 min
Primary outflow = Inflow, Time Span= 0.00-30.00 hrs, dt= 0.01 hrs
Link 4L: site total
InflowPrimary
Hydrograph
Time (hours)3029282726252423222120191817161514131211109876543210
Flo
w (
cfs)
0.038
0.036
0.034
0.032
0.03
0.028
0.026
0.024
0.022
0.02
0.018
0.016
0.014
0.012
0.01
0.008
0.006
0.004
0.002
0
Inflow Area=0.932 ac0.04 cfs
0.04 cfs

Type III 24-hr 10-Yr Rainfall=4.75"pc Printed 2/25/2020Prepared by James Engineering, Inc.
Page 30HydroCAD® 10.00-20 s/n 02185 © 2017 HydroCAD Software Solutions LLC
Summary for Link 5L: derby brook
Inflow Area = 0.422 ac, 0.00% Impervious, Inflow Depth = 0.14" for 10-Yr eventInflow = 0.01 cfs @ 13.82 hrs, Volume= 0.005 afPrimary = 0.01 cfs @ 13.82 hrs, Volume= 0.005 af, Atten= 0%, Lag= 0.0 min
Primary outflow = Inflow, Time Span= 0.00-30.00 hrs, dt= 0.01 hrs
Link 5L: derby brook
InflowPrimary
Hydrograph
Time (hours)3029282726252423222120191817161514131211109876543210
Flo
w (
cfs)
0.009
0.008
0.007
0.007
0.006
0.006
0.005
0.005
0.004
0.004
0.003
0.003
0.002
0.002
0.001
0.001
0.000
0
Inflow Area=0.422 ac0.01 cfs
0.01 cfs

Type III 24-hr 25-Yr Rainfall=5.55"pc Printed 2/25/2020Prepared by James Engineering, Inc.
Page 31HydroCAD® 10.00-20 s/n 02185 © 2017 HydroCAD Software Solutions LLC
Time span=0.00-30.00 hrs, dt=0.01 hrs, 3001 pointsRunoff by SCS TR-20 method, UH=SCS, Weighted-CN
Reach routing by Stor-Ind+Trans method - Pond routing by Stor-Ind method
Runoff Area=10,106 sf 42.20% Impervious Runoff Depth=1.95"Subcatchment 1S: cbasin Tc=6.0 min CN=64 Runoff=0.51 cfs 0.038 af
Runoff Area=3,928 sf 18.46% Impervious Runoff Depth=0.93"Subcatchment 2S: to rte 53 Tc=6.0 min CN=50 Runoff=0.07 cfs 0.007 af
Runoff Area=672 sf 100.00% Impervious Runoff Depth=5.31"Subcatchment 3S: house 2 Tc=6.0 min CN=98 Runoff=0.08 cfs 0.007 af
Runoff Area=9,013 sf 0.00% Impervious Runoff Depth=0.28"Subcatchment 4S: back basin Flow Length=130' Tc=7.2 min CN=38 Runoff=0.02 cfs 0.005 af
Runoff Area=9,364 sf 0.00% Impervious Runoff Depth=0.32"Subcatchment 5S: front basin Flow Length=100' Tc=8.3 min CN=39 Runoff=0.02 cfs 0.006 af
Runoff Area=8,204 sf 0.00% Impervious Runoff Depth=0.10"Subcatchment 6S: stream Flow Length=159' Tc=9.0 min CN=33 Runoff=0.00 cfs 0.002 af
Peak Elev=142.48' Storage=399 cf Inflow=0.51 cfs 0.038 afPond 1P: inf 1 Discarded=0.05 cfs 0.033 af Primary=0.17 cfs 0.005 af Outflow=0.23 cfs 0.038 af
Peak Elev=143.12' Storage=58 cf Inflow=0.08 cfs 0.007 afPond 2P: roof Outflow=0.02 cfs 0.007 af
Inflow=0.22 cfs 0.012 afLink 3L: rte 53 Primary=0.22 cfs 0.012 af
Inflow=0.25 cfs 0.024 afLink 4L: site total Primary=0.25 cfs 0.024 af
Inflow=0.04 cfs 0.011 afLink 5L: derby brook Primary=0.04 cfs 0.011 af
Total Runoff Area = 0.948 ac Runoff Volume = 0.064 af Average Runoff Depth = 0.81"86.29% Pervious = 0.818 ac 13.71% Impervious = 0.130 ac

Type III 24-hr 25-Yr Rainfall=5.55"pc Printed 2/25/2020Prepared by James Engineering, Inc.
Page 32HydroCAD® 10.00-20 s/n 02185 © 2017 HydroCAD Software Solutions LLC
Summary for Subcatchment 1S: cbasin
Runoff = 0.51 cfs @ 12.09 hrs, Volume= 0.038 af, Depth= 1.95"
Runoff by SCS TR-20 method, UH=SCS, Weighted-CN, Time Span= 0.00-30.00 hrs, dt= 0.01 hrsType III 24-hr 25-Yr Rainfall=5.55"
Area (sf) CN Description3,333 98 Paved parking, HSG A
* 160 98 sheds* 100 98 walkways
5,841 39 >75% Grass cover, Good, HSG A* 672 98 roof
10,106 64 Weighted Average5,841 57.80% Pervious Area4,265 42.20% Impervious Area
Tc Length Slope Velocity Capacity Description(min) (feet) (ft/ft) (ft/sec) (cfs)
6.0 Direct Entry, minimum
Subcatchment 1S: cbasin
Runoff
Hydrograph
Time (hours)3029282726252423222120191817161514131211109876543210
Flo
w (
cfs)
0.55
0.5
0.45
0.4
0.35
0.3
0.25
0.2
0.15
0.1
0.05
0
Type III 24-hr25-Yr Rainfall=5.55"
Runoff Area=10,106 sfRunoff Volume=0.038 af
Runoff Depth=1.95"Tc=6.0 min
CN=64
0.51 cfs

Type III 24-hr 25-Yr Rainfall=5.55"pc Printed 2/25/2020Prepared by James Engineering, Inc.
Page 33HydroCAD® 10.00-20 s/n 02185 © 2017 HydroCAD Software Solutions LLC
Summary for Subcatchment 2S: to rte 53
Runoff = 0.07 cfs @ 12.11 hrs, Volume= 0.007 af, Depth= 0.93"
Runoff by SCS TR-20 method, UH=SCS, Weighted-CN, Time Span= 0.00-30.00 hrs, dt= 0.01 hrsType III 24-hr 25-Yr Rainfall=5.55"
Area (sf) CN Description3,203 39 >75% Grass cover, Good, HSG A
725 98 Paved parking, HSG A3,928 50 Weighted Average3,203 81.54% Pervious Area
725 18.46% Impervious Area
Tc Length Slope Velocity Capacity Description(min) (feet) (ft/ft) (ft/sec) (cfs)
6.0 Direct Entry,
Subcatchment 2S: to rte 53
Runoff
Hydrograph
Time (hours)3029282726252423222120191817161514131211109876543210
Flo
w (
cfs)
0.08
0.075
0.07
0.065
0.06
0.055
0.05
0.045
0.04
0.035
0.03
0.025
0.02
0.015
0.01
0.005
0
Type III 24-hr25-Yr Rainfall=5.55"
Runoff Area=3,928 sfRunoff Volume=0.007 af
Runoff Depth=0.93"Tc=6.0 min
CN=50
0.07 cfs

Type III 24-hr 25-Yr Rainfall=5.55"pc Printed 2/25/2020Prepared by James Engineering, Inc.
Page 34HydroCAD® 10.00-20 s/n 02185 © 2017 HydroCAD Software Solutions LLC
Summary for Subcatchment 3S: house 2
Runoff = 0.08 cfs @ 12.08 hrs, Volume= 0.007 af, Depth= 5.31"
Runoff by SCS TR-20 method, UH=SCS, Weighted-CN, Time Span= 0.00-30.00 hrs, dt= 0.01 hrsType III 24-hr 25-Yr Rainfall=5.55"
Area (sf) CN Description672 98 Roofs, HSG A672 100.00% Impervious Area
Tc Length Slope Velocity Capacity Description(min) (feet) (ft/ft) (ft/sec) (cfs)
6.0 Direct Entry, minimum
Subcatchment 3S: house 2
Runoff
Hydrograph
Time (hours)3029282726252423222120191817161514131211109876543210
Flo
w (
cfs)
0.09
0.085
0.08
0.075
0.07
0.065
0.06
0.055
0.05
0.045
0.04
0.035
0.03
0.025
0.02
0.015
0.01
0.005
0
Type III 24-hr25-Yr Rainfall=5.55"Runoff Area=672 sf
Runoff Volume=0.007 afRunoff Depth=5.31"
Tc=6.0 minCN=98
0.08 cfs
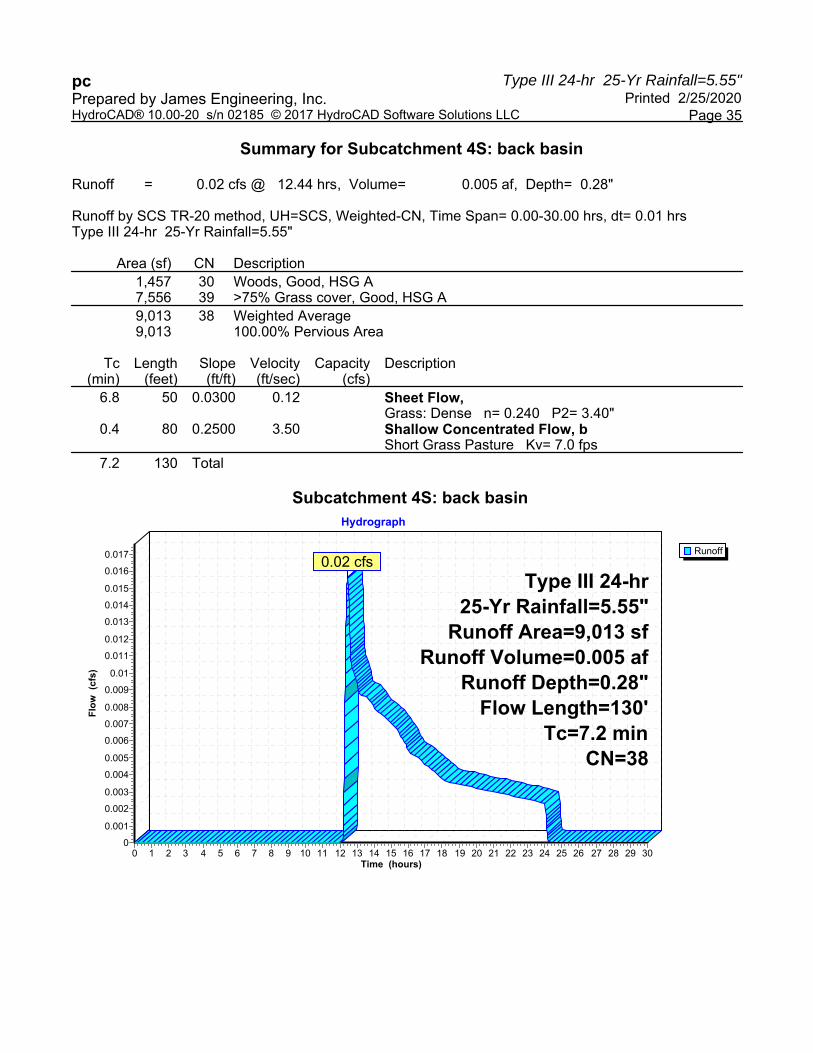
Type III 24-hr 25-Yr Rainfall=5.55"pc Printed 2/25/2020Prepared by James Engineering, Inc.
Page 35HydroCAD® 10.00-20 s/n 02185 © 2017 HydroCAD Software Solutions LLC
Summary for Subcatchment 4S: back basin
Runoff = 0.02 cfs @ 12.44 hrs, Volume= 0.005 af, Depth= 0.28"
Runoff by SCS TR-20 method, UH=SCS, Weighted-CN, Time Span= 0.00-30.00 hrs, dt= 0.01 hrsType III 24-hr 25-Yr Rainfall=5.55"
Area (sf) CN Description1,457 30 Woods, Good, HSG A7,556 39 >75% Grass cover, Good, HSG A9,013 38 Weighted Average9,013 100.00% Pervious Area
Tc Length Slope Velocity Capacity Description(min) (feet) (ft/ft) (ft/sec) (cfs)
6.8 50 0.0300 0.12 Sheet Flow, Grass: Dense n= 0.240 P2= 3.40"
0.4 80 0.2500 3.50 Shallow Concentrated Flow, bShort Grass Pasture Kv= 7.0 fps
7.2 130 Total
Subcatchment 4S: back basin
Runoff
Hydrograph
Time (hours)3029282726252423222120191817161514131211109876543210
Flo
w (
cfs)
0.017
0.016
0.015
0.014
0.013
0.012
0.011
0.01
0.009
0.008
0.007
0.006
0.005
0.004
0.003
0.002
0.001
0
Type III 24-hr25-Yr Rainfall=5.55"
Runoff Area=9,013 sfRunoff Volume=0.005 af
Runoff Depth=0.28"Flow Length=130'
Tc=7.2 minCN=38
0.02 cfs

Type III 24-hr 25-Yr Rainfall=5.55"pc Printed 2/25/2020Prepared by James Engineering, Inc.
Page 36HydroCAD® 10.00-20 s/n 02185 © 2017 HydroCAD Software Solutions LLC
Summary for Subcatchment 5S: front basin
Runoff = 0.02 cfs @ 12.43 hrs, Volume= 0.006 af, Depth= 0.32"
Runoff by SCS TR-20 method, UH=SCS, Weighted-CN, Time Span= 0.00-30.00 hrs, dt= 0.01 hrsType III 24-hr 25-Yr Rainfall=5.55"
Area (sf) CN Description9,364 39 >75% Grass cover, Good, HSG A9,364 100.00% Pervious Area
Tc Length Slope Velocity Capacity Description(min) (feet) (ft/ft) (ft/sec) (cfs)
8.0 50 0.0200 0.10 Sheet Flow, Grass: Dense n= 0.240 P2= 3.40"
0.3 50 0.2000 3.13 Shallow Concentrated Flow, Short Grass Pasture Kv= 7.0 fps
8.3 100 Total
Subcatchment 5S: front basin
Runoff
Hydrograph
Time (hours)3029282726252423222120191817161514131211109876543210
Flo
w (
cfs)
0.0240.0230.0220.021
0.020.0190.0180.0170.0160.0150.0140.0130.0120.011
0.010.0090.0080.0070.0060.0050.0040.0030.0020.001
0
Type III 24-hr25-Yr Rainfall=5.55"
Runoff Area=9,364 sfRunoff Volume=0.006 af
Runoff Depth=0.32"Flow Length=100'
Tc=8.3 minCN=39
0.02 cfs
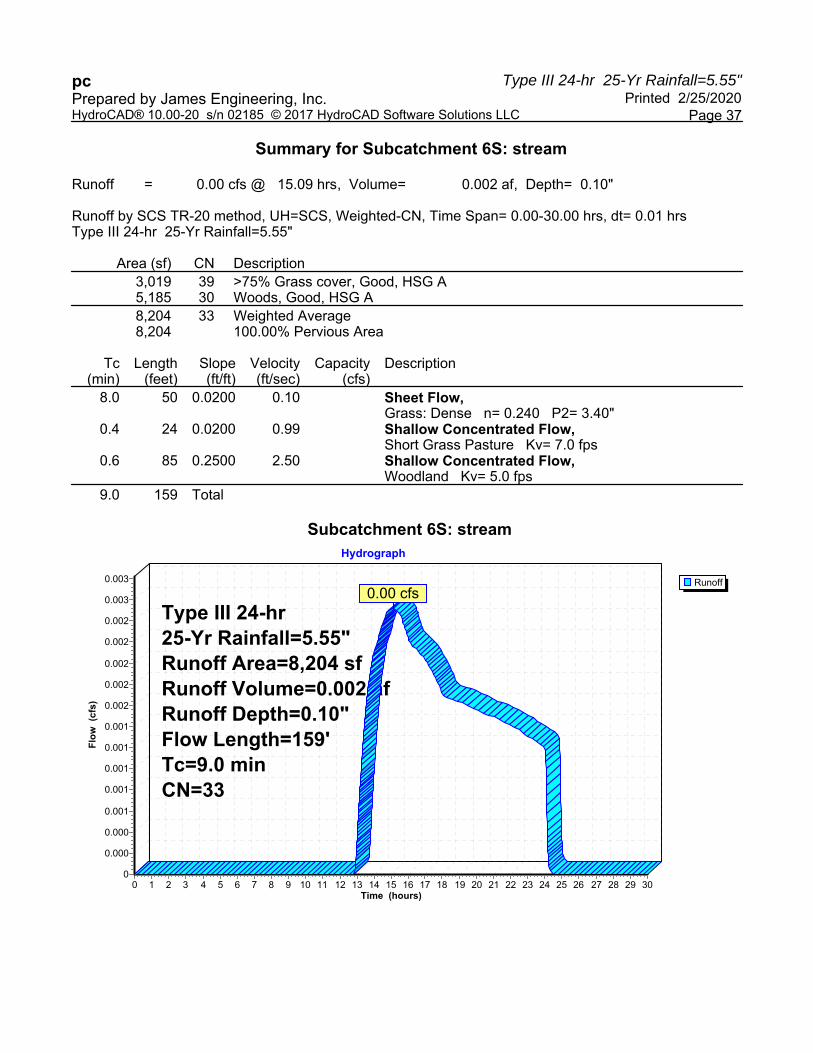
Type III 24-hr 25-Yr Rainfall=5.55"pc Printed 2/25/2020Prepared by James Engineering, Inc.
Page 37HydroCAD® 10.00-20 s/n 02185 © 2017 HydroCAD Software Solutions LLC
Summary for Subcatchment 6S: stream
Runoff = 0.00 cfs @ 15.09 hrs, Volume= 0.002 af, Depth= 0.10"
Runoff by SCS TR-20 method, UH=SCS, Weighted-CN, Time Span= 0.00-30.00 hrs, dt= 0.01 hrsType III 24-hr 25-Yr Rainfall=5.55"
Area (sf) CN Description3,019 39 >75% Grass cover, Good, HSG A5,185 30 Woods, Good, HSG A8,204 33 Weighted Average8,204 100.00% Pervious Area
Tc Length Slope Velocity Capacity Description(min) (feet) (ft/ft) (ft/sec) (cfs)
8.0 50 0.0200 0.10 Sheet Flow, Grass: Dense n= 0.240 P2= 3.40"
0.4 24 0.0200 0.99 Shallow Concentrated Flow, Short Grass Pasture Kv= 7.0 fps
0.6 85 0.2500 2.50 Shallow Concentrated Flow, Woodland Kv= 5.0 fps
9.0 159 Total
Subcatchment 6S: stream
Runoff
Hydrograph
Time (hours)3029282726252423222120191817161514131211109876543210
Flo
w (
cfs)
0.003
0.003
0.002
0.002
0.002
0.002
0.002
0.001
0.001
0.001
0.001
0.001
0.000
0.000
0
Type III 24-hr25-Yr Rainfall=5.55"Runoff Area=8,204 sfRunoff Volume=0.002 afRunoff Depth=0.10"Flow Length=159'Tc=9.0 minCN=33
0.00 cfs
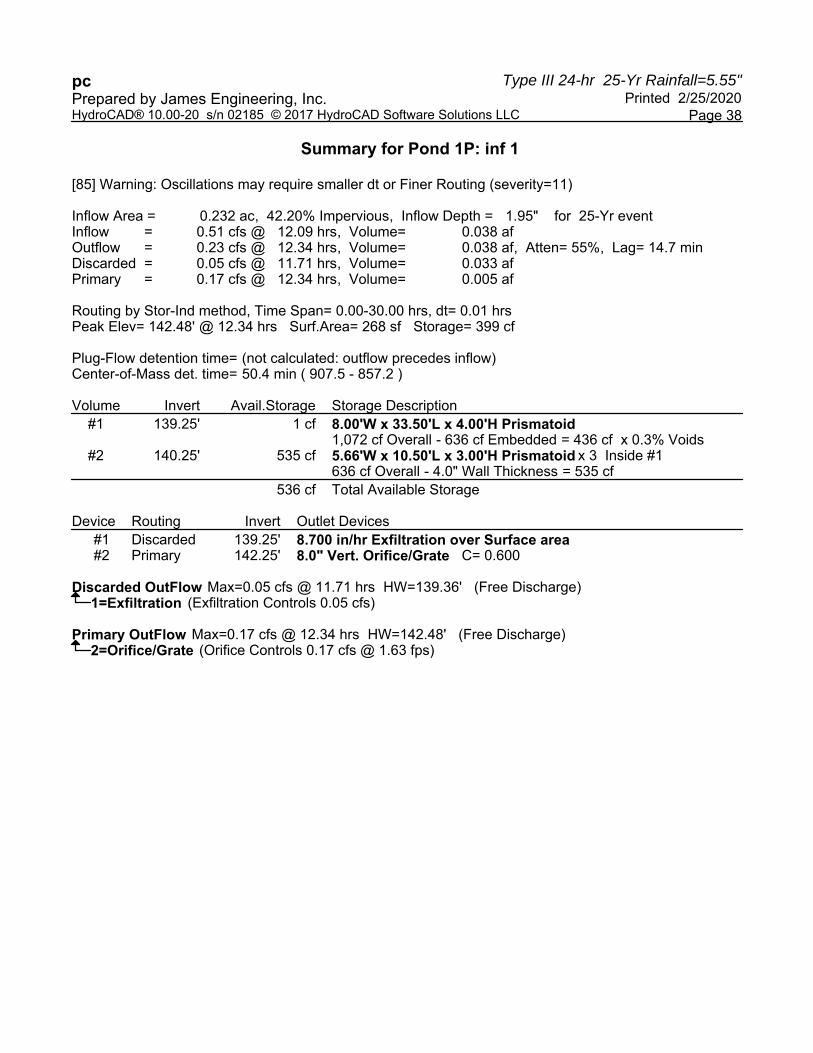
Type III 24-hr 25-Yr Rainfall=5.55"pc Printed 2/25/2020Prepared by James Engineering, Inc.
Page 38HydroCAD® 10.00-20 s/n 02185 © 2017 HydroCAD Software Solutions LLC
Summary for Pond 1P: inf 1
[85] Warning: Oscillations may require smaller dt or Finer Routing (severity=11)
Inflow Area = 0.232 ac, 42.20% Impervious, Inflow Depth = 1.95" for 25-Yr eventInflow = 0.51 cfs @ 12.09 hrs, Volume= 0.038 afOutflow = 0.23 cfs @ 12.34 hrs, Volume= 0.038 af, Atten= 55%, Lag= 14.7 minDiscarded = 0.05 cfs @ 11.71 hrs, Volume= 0.033 afPrimary = 0.17 cfs @ 12.34 hrs, Volume= 0.005 af
Routing by Stor-Ind method, Time Span= 0.00-30.00 hrs, dt= 0.01 hrsPeak Elev= 142.48' @ 12.34 hrs Surf.Area= 268 sf Storage= 399 cf
Plug-Flow detention time= (not calculated: outflow precedes inflow)Center-of-Mass det. time= 50.4 min ( 907.5 - 857.2 )
Volume Invert Avail.Storage Storage Description#1 139.25' 1 cf 8.00'W x 33.50'L x 4.00'H Prismatoid
1,072 cf Overall - 636 cf Embedded = 436 cf x 0.3% Voids#2 140.25' 535 cf 5.66'W x 10.50'L x 3.00'H Prismatoid x 3 Inside #1
636 cf Overall - 4.0" Wall Thickness = 535 cf536 cf Total Available Storage
Device Routing Invert Outlet Devices#1 Discarded 139.25' 8.700 in/hr Exfiltration over Surface area #2 Primary 142.25' 8.0" Vert. Orifice/Grate C= 0.600
Discarded OutFlow Max=0.05 cfs @ 11.71 hrs HW=139.36' (Free Discharge)1=Exfiltration (Exfiltration Controls 0.05 cfs)
Primary OutFlow Max=0.17 cfs @ 12.34 hrs HW=142.48' (Free Discharge)2=Orifice/Grate (Orifice Controls 0.17 cfs @ 1.63 fps)
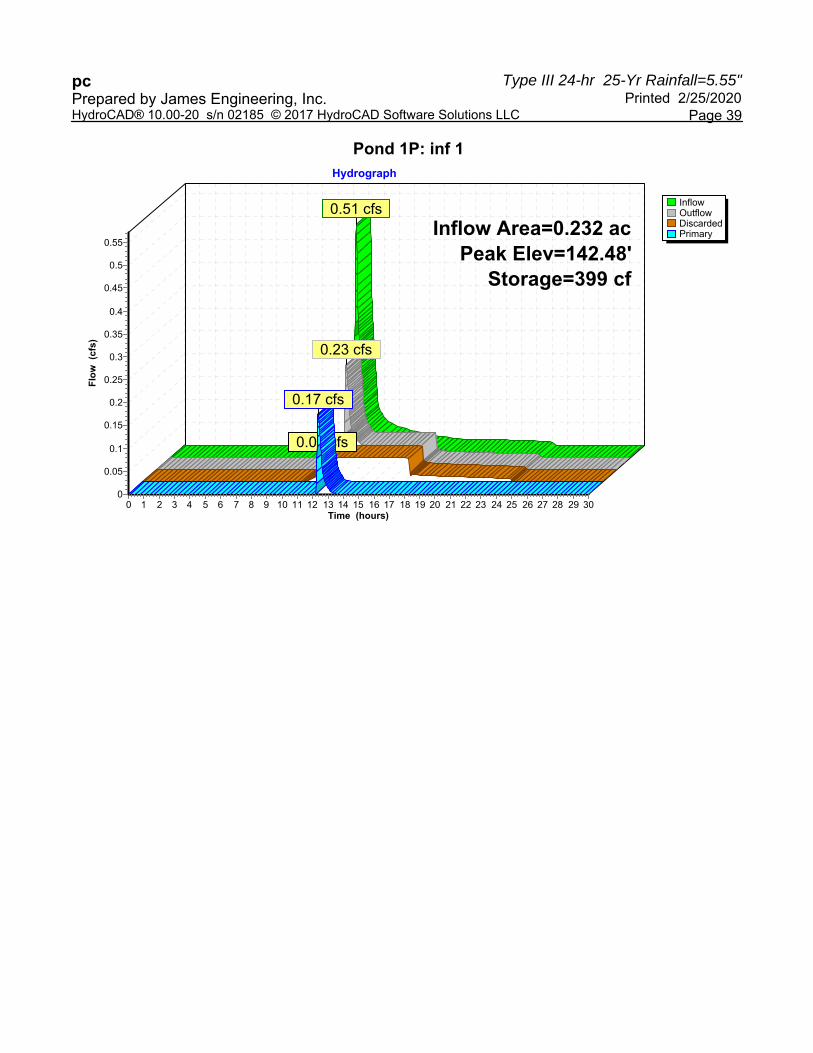
Type III 24-hr 25-Yr Rainfall=5.55"pc Printed 2/25/2020Prepared by James Engineering, Inc.
Page 39HydroCAD® 10.00-20 s/n 02185 © 2017 HydroCAD Software Solutions LLC
Pond 1P: inf 1
InflowOutflowDiscardedPrimary
Hydrograph
Time (hours)3029282726252423222120191817161514131211109876543210
Flo
w (
cfs)
0.55
0.5
0.45
0.4
0.35
0.3
0.25
0.2
0.15
0.1
0.05
0
Inflow Area=0.232 acPeak Elev=142.48'
Storage=399 cf
0.51 cfs
0.23 cfs
0.05 cfs
0.17 cfs
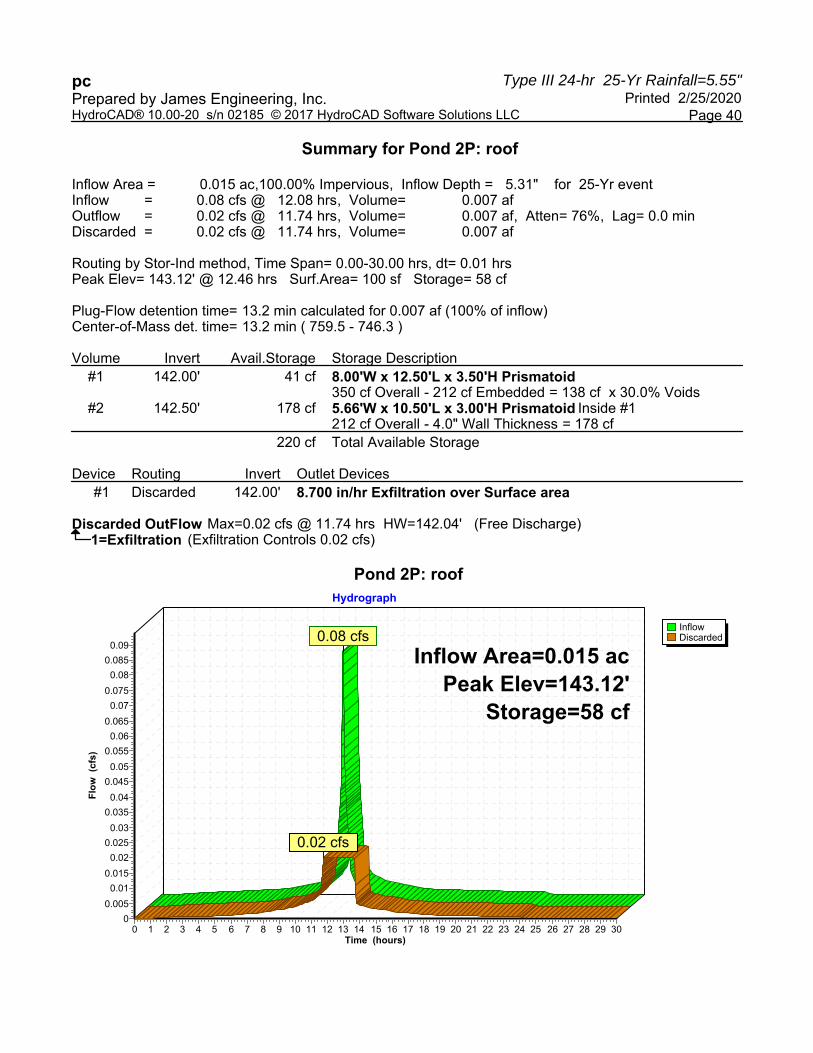
Type III 24-hr 25-Yr Rainfall=5.55"pc Printed 2/25/2020Prepared by James Engineering, Inc.
Page 40HydroCAD® 10.00-20 s/n 02185 © 2017 HydroCAD Software Solutions LLC
Summary for Pond 2P: roof
Inflow Area = 0.015 ac,100.00% Impervious, Inflow Depth = 5.31" for 25-Yr eventInflow = 0.08 cfs @ 12.08 hrs, Volume= 0.007 afOutflow = 0.02 cfs @ 11.74 hrs, Volume= 0.007 af, Atten= 76%, Lag= 0.0 minDiscarded = 0.02 cfs @ 11.74 hrs, Volume= 0.007 af
Routing by Stor-Ind method, Time Span= 0.00-30.00 hrs, dt= 0.01 hrsPeak Elev= 143.12' @ 12.46 hrs Surf.Area= 100 sf Storage= 58 cf
Plug-Flow detention time= 13.2 min calculated for 0.007 af (100% of inflow)Center-of-Mass det. time= 13.2 min ( 759.5 - 746.3 )
Volume Invert Avail.Storage Storage Description#1 142.00' 41 cf 8.00'W x 12.50'L x 3.50'H Prismatoid
350 cf Overall - 212 cf Embedded = 138 cf x 30.0% Voids#2 142.50' 178 cf 5.66'W x 10.50'L x 3.00'H Prismatoid Inside #1
212 cf Overall - 4.0" Wall Thickness = 178 cf220 cf Total Available Storage
Device Routing Invert Outlet Devices#1 Discarded 142.00' 8.700 in/hr Exfiltration over Surface area
Discarded OutFlow Max=0.02 cfs @ 11.74 hrs HW=142.04' (Free Discharge)1=Exfiltration (Exfiltration Controls 0.02 cfs)
Pond 2P: roof
InflowDiscarded
Hydrograph
Time (hours)3029282726252423222120191817161514131211109876543210
Flo
w (
cfs)
0.09
0.085
0.08
0.075
0.07
0.065
0.06
0.055
0.05
0.045
0.04
0.035
0.03
0.025
0.02
0.015
0.01
0.005
0
Inflow Area=0.015 acPeak Elev=143.12'
Storage=58 cf
0.08 cfs
0.02 cfs
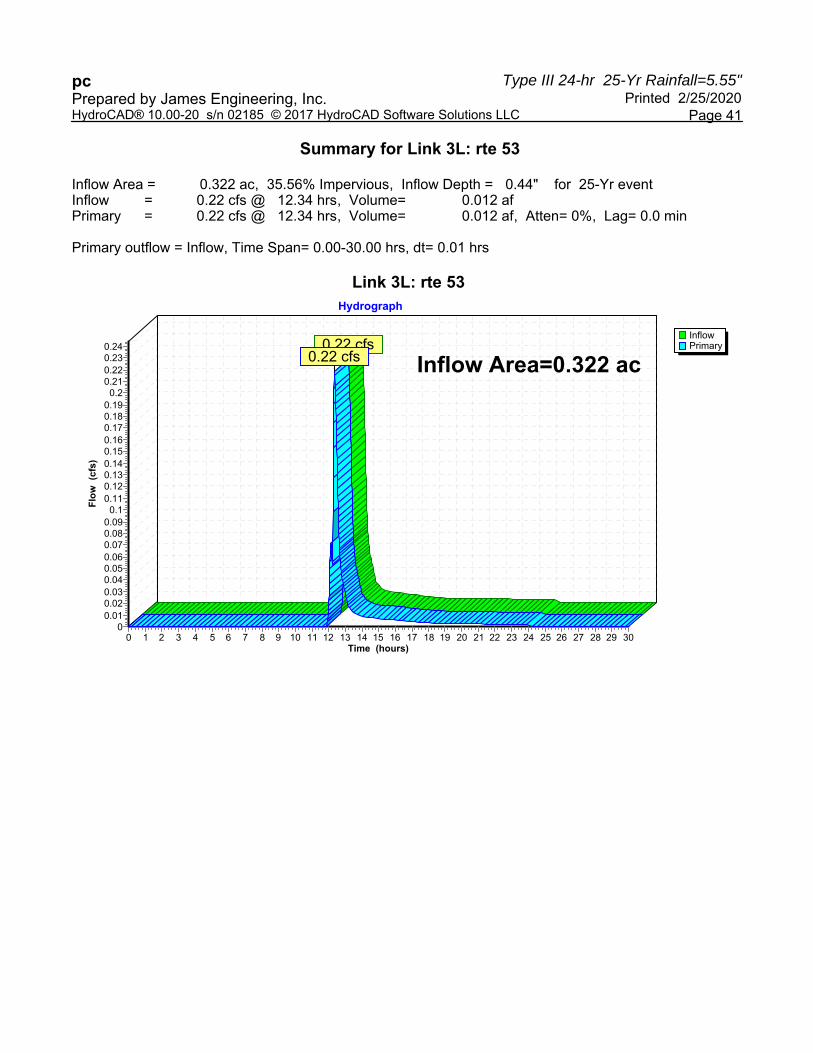
Type III 24-hr 25-Yr Rainfall=5.55"pc Printed 2/25/2020Prepared by James Engineering, Inc.
Page 41HydroCAD® 10.00-20 s/n 02185 © 2017 HydroCAD Software Solutions LLC
Summary for Link 3L: rte 53
Inflow Area = 0.322 ac, 35.56% Impervious, Inflow Depth = 0.44" for 25-Yr eventInflow = 0.22 cfs @ 12.34 hrs, Volume= 0.012 afPrimary = 0.22 cfs @ 12.34 hrs, Volume= 0.012 af, Atten= 0%, Lag= 0.0 min
Primary outflow = Inflow, Time Span= 0.00-30.00 hrs, dt= 0.01 hrs
Link 3L: rte 53
InflowPrimary
Hydrograph
Time (hours)3029282726252423222120191817161514131211109876543210
Flo
w (
cfs)
0.240.230.220.21
0.20.190.180.170.160.150.140.130.120.11
0.10.090.080.070.060.050.040.030.020.01
0
Inflow Area=0.322 ac0.22 cfs
0.22 cfs

Type III 24-hr 25-Yr Rainfall=5.55"pc Printed 2/25/2020Prepared by James Engineering, Inc.
Page 42HydroCAD® 10.00-20 s/n 02185 © 2017 HydroCAD Software Solutions LLC
Summary for Link 4L: site total
Inflow Area = 0.932 ac, 12.29% Impervious, Inflow Depth = 0.31" for 25-Yr eventInflow = 0.25 cfs @ 12.34 hrs, Volume= 0.024 afPrimary = 0.25 cfs @ 12.34 hrs, Volume= 0.024 af, Atten= 0%, Lag= 0.0 min
Primary outflow = Inflow, Time Span= 0.00-30.00 hrs, dt= 0.01 hrs
Link 4L: site total
InflowPrimary
Hydrograph
Time (hours)3029282726252423222120191817161514131211109876543210
Flo
w (
cfs)
0.28
0.26
0.24
0.22
0.2
0.18
0.16
0.14
0.12
0.1
0.08
0.06
0.04
0.02
0
Inflow Area=0.932 ac0.25 cfs
0.25 cfs

Type III 24-hr 25-Yr Rainfall=5.55"pc Printed 2/25/2020Prepared by James Engineering, Inc.
Page 43HydroCAD® 10.00-20 s/n 02185 © 2017 HydroCAD Software Solutions LLC
Summary for Link 5L: derby brook
Inflow Area = 0.422 ac, 0.00% Impervious, Inflow Depth = 0.30" for 25-Yr eventInflow = 0.04 cfs @ 12.44 hrs, Volume= 0.011 afPrimary = 0.04 cfs @ 12.44 hrs, Volume= 0.011 af, Atten= 0%, Lag= 0.0 min
Primary outflow = Inflow, Time Span= 0.00-30.00 hrs, dt= 0.01 hrs
Link 5L: derby brook
InflowPrimary
Hydrograph
Time (hours)3029282726252423222120191817161514131211109876543210
Flo
w (
cfs)
0.042
0.040.038
0.0360.034
0.0320.03
0.0280.026
0.0240.022
0.020.018
0.0160.014
0.0120.01
0.0080.006
0.0040.002
0
Inflow Area=0.422 ac0.04 cfs
0.04 cfs

Type III 24-hr 100-Yr Rainfall=7.00"pc Printed 2/25/2020Prepared by James Engineering, Inc.
Page 44HydroCAD® 10.00-20 s/n 02185 © 2017 HydroCAD Software Solutions LLC
Time span=0.00-30.00 hrs, dt=0.01 hrs, 3001 pointsRunoff by SCS TR-20 method, UH=SCS, Weighted-CN
Reach routing by Stor-Ind+Trans method - Pond routing by Stor-Ind method
Runoff Area=10,106 sf 42.20% Impervious Runoff Depth=3.00"Subcatchment 1S: cbasin Tc=6.0 min CN=64 Runoff=0.81 cfs 0.058 af
Runoff Area=3,928 sf 18.46% Impervious Runoff Depth=1.67"Subcatchment 2S: to rte 53 Tc=6.0 min CN=50 Runoff=0.15 cfs 0.013 af
Runoff Area=672 sf 100.00% Impervious Runoff Depth=6.76"Subcatchment 3S: house 2 Tc=6.0 min CN=98 Runoff=0.11 cfs 0.009 af
Runoff Area=9,013 sf 0.00% Impervious Runoff Depth=0.70"Subcatchment 4S: back basin Flow Length=130' Tc=7.2 min CN=38 Runoff=0.07 cfs 0.012 af
Runoff Area=9,364 sf 0.00% Impervious Runoff Depth=0.77"Subcatchment 5S: front basin Flow Length=100' Tc=8.3 min CN=39 Runoff=0.09 cfs 0.014 af
Runoff Area=8,204 sf 0.00% Impervious Runoff Depth=0.37"Subcatchment 6S: stream Flow Length=159' Tc=9.0 min CN=33 Runoff=0.02 cfs 0.006 af
Peak Elev=142.71' Storage=440 cf Inflow=0.81 cfs 0.058 afPond 1P: inf 1 Discarded=0.05 cfs 0.041 af Primary=0.60 cfs 0.017 af Outflow=0.65 cfs 0.058 af
Peak Elev=143.56' Storage=88 cf Inflow=0.11 cfs 0.009 afPond 2P: roof Outflow=0.02 cfs 0.009 af
Inflow=0.73 cfs 0.030 afLink 3L: rte 53 Primary=0.73 cfs 0.030 af
Inflow=0.88 cfs 0.061 afLink 4L: site total Primary=0.88 cfs 0.061 af
Inflow=0.15 cfs 0.026 afLink 5L: derby brook Primary=0.15 cfs 0.026 af
Total Runoff Area = 0.948 ac Runoff Volume = 0.111 af Average Runoff Depth = 1.40"86.29% Pervious = 0.818 ac 13.71% Impervious = 0.130 ac

Type III 24-hr 100-Yr Rainfall=7.00"pc Printed 2/25/2020Prepared by James Engineering, Inc.
Page 45HydroCAD® 10.00-20 s/n 02185 © 2017 HydroCAD Software Solutions LLC
Summary for Subcatchment 1S: cbasin
Runoff = 0.81 cfs @ 12.09 hrs, Volume= 0.058 af, Depth= 3.00"
Runoff by SCS TR-20 method, UH=SCS, Weighted-CN, Time Span= 0.00-30.00 hrs, dt= 0.01 hrsType III 24-hr 100-Yr Rainfall=7.00"
Area (sf) CN Description3,333 98 Paved parking, HSG A
* 160 98 sheds* 100 98 walkways
5,841 39 >75% Grass cover, Good, HSG A* 672 98 roof
10,106 64 Weighted Average5,841 57.80% Pervious Area4,265 42.20% Impervious Area
Tc Length Slope Velocity Capacity Description(min) (feet) (ft/ft) (ft/sec) (cfs)
6.0 Direct Entry, minimum
Subcatchment 1S: cbasin
Runoff
Hydrograph
Time (hours)3029282726252423222120191817161514131211109876543210
Flo
w (
cfs)
0.9
0.85
0.8
0.75
0.7
0.65
0.6
0.55
0.5
0.45
0.4
0.35
0.3
0.25
0.2
0.15
0.1
0.05
0
Type III 24-hr100-Yr Rainfall=7.00"
Runoff Area=10,106 sfRunoff Volume=0.058 af
Runoff Depth=3.00"Tc=6.0 min
CN=64
0.81 cfs

Type III 24-hr 100-Yr Rainfall=7.00"pc Printed 2/25/2020Prepared by James Engineering, Inc.
Page 46HydroCAD® 10.00-20 s/n 02185 © 2017 HydroCAD Software Solutions LLC
Summary for Subcatchment 2S: to rte 53
Runoff = 0.15 cfs @ 12.10 hrs, Volume= 0.013 af, Depth= 1.67"
Runoff by SCS TR-20 method, UH=SCS, Weighted-CN, Time Span= 0.00-30.00 hrs, dt= 0.01 hrsType III 24-hr 100-Yr Rainfall=7.00"
Area (sf) CN Description3,203 39 >75% Grass cover, Good, HSG A
725 98 Paved parking, HSG A3,928 50 Weighted Average3,203 81.54% Pervious Area
725 18.46% Impervious Area
Tc Length Slope Velocity Capacity Description(min) (feet) (ft/ft) (ft/sec) (cfs)
6.0 Direct Entry,
Subcatchment 2S: to rte 53
Runoff
Hydrograph
Time (hours)3029282726252423222120191817161514131211109876543210
Flo
w (
cfs)
0.17
0.16
0.15
0.14
0.13
0.12
0.11
0.1
0.09
0.08
0.07
0.06
0.05
0.04
0.03
0.02
0.01
0
Type III 24-hr100-Yr Rainfall=7.00"Runoff Area=3,928 sf
Runoff Volume=0.013 afRunoff Depth=1.67"
Tc=6.0 minCN=50
0.15 cfs
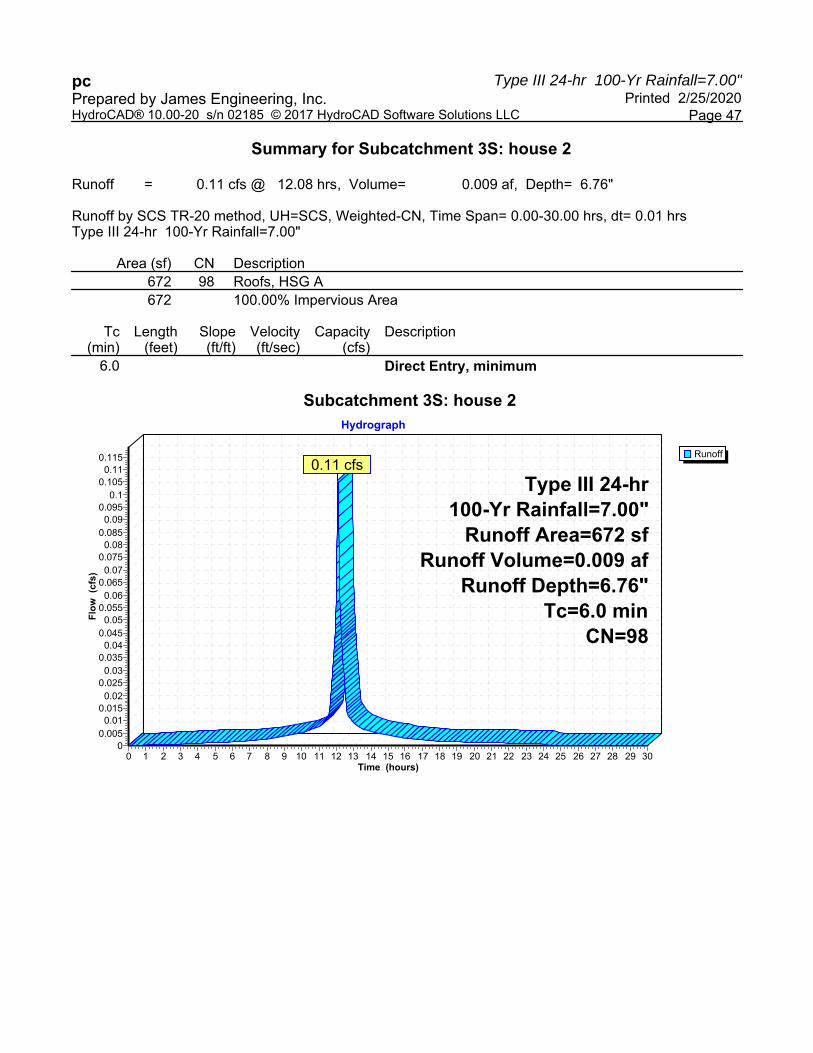
Type III 24-hr 100-Yr Rainfall=7.00"pc Printed 2/25/2020Prepared by James Engineering, Inc.
Page 47HydroCAD® 10.00-20 s/n 02185 © 2017 HydroCAD Software Solutions LLC
Summary for Subcatchment 3S: house 2
Runoff = 0.11 cfs @ 12.08 hrs, Volume= 0.009 af, Depth= 6.76"
Runoff by SCS TR-20 method, UH=SCS, Weighted-CN, Time Span= 0.00-30.00 hrs, dt= 0.01 hrsType III 24-hr 100-Yr Rainfall=7.00"
Area (sf) CN Description672 98 Roofs, HSG A672 100.00% Impervious Area
Tc Length Slope Velocity Capacity Description(min) (feet) (ft/ft) (ft/sec) (cfs)
6.0 Direct Entry, minimum
Subcatchment 3S: house 2
Runoff
Hydrograph
Time (hours)3029282726252423222120191817161514131211109876543210
Flo
w (
cfs)
0.1150.11
0.1050.1
0.0950.09
0.0850.08
0.0750.07
0.0650.06
0.0550.05
0.0450.04
0.0350.03
0.0250.02
0.0150.01
0.0050
Type III 24-hr100-Yr Rainfall=7.00"
Runoff Area=672 sfRunoff Volume=0.009 af
Runoff Depth=6.76"Tc=6.0 min
CN=98
0.11 cfs

Type III 24-hr 100-Yr Rainfall=7.00"pc Printed 2/25/2020Prepared by James Engineering, Inc.
Page 48HydroCAD® 10.00-20 s/n 02185 © 2017 HydroCAD Software Solutions LLC
Summary for Subcatchment 4S: back basin
Runoff = 0.07 cfs @ 12.28 hrs, Volume= 0.012 af, Depth= 0.70"
Runoff by SCS TR-20 method, UH=SCS, Weighted-CN, Time Span= 0.00-30.00 hrs, dt= 0.01 hrsType III 24-hr 100-Yr Rainfall=7.00"
Area (sf) CN Description1,457 30 Woods, Good, HSG A7,556 39 >75% Grass cover, Good, HSG A9,013 38 Weighted Average9,013 100.00% Pervious Area
Tc Length Slope Velocity Capacity Description(min) (feet) (ft/ft) (ft/sec) (cfs)
6.8 50 0.0300 0.12 Sheet Flow, Grass: Dense n= 0.240 P2= 3.40"
0.4 80 0.2500 3.50 Shallow Concentrated Flow, bShort Grass Pasture Kv= 7.0 fps
7.2 130 Total
Subcatchment 4S: back basin
Runoff
Hydrograph
Time (hours)3029282726252423222120191817161514131211109876543210
Flo
w (
cfs)
0.075
0.07
0.065
0.06
0.055
0.05
0.045
0.04
0.035
0.03
0.025
0.02
0.015
0.01
0.005
0
Type III 24-hr100-Yr Rainfall=7.00"Runoff Area=9,013 sf
Runoff Volume=0.012 afRunoff Depth=0.70"
Flow Length=130'Tc=7.2 min
CN=38
0.07 cfs
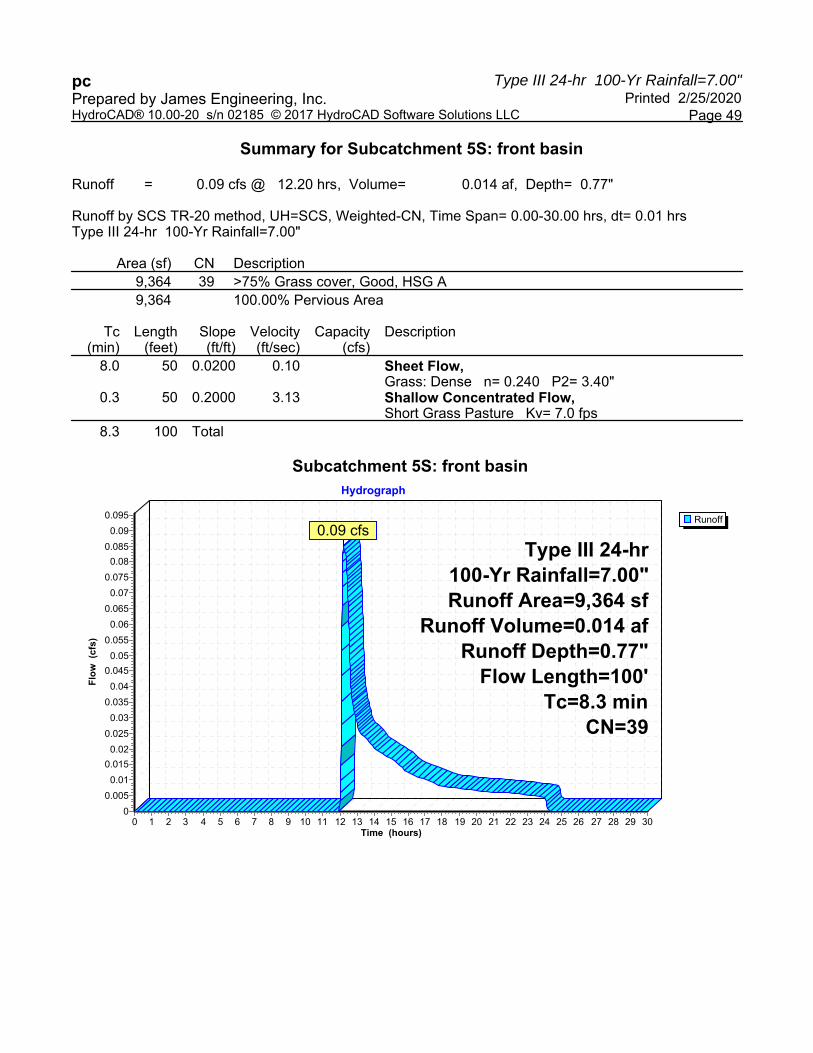
Type III 24-hr 100-Yr Rainfall=7.00"pc Printed 2/25/2020Prepared by James Engineering, Inc.
Page 49HydroCAD® 10.00-20 s/n 02185 © 2017 HydroCAD Software Solutions LLC
Summary for Subcatchment 5S: front basin
Runoff = 0.09 cfs @ 12.20 hrs, Volume= 0.014 af, Depth= 0.77"
Runoff by SCS TR-20 method, UH=SCS, Weighted-CN, Time Span= 0.00-30.00 hrs, dt= 0.01 hrsType III 24-hr 100-Yr Rainfall=7.00"
Area (sf) CN Description9,364 39 >75% Grass cover, Good, HSG A9,364 100.00% Pervious Area
Tc Length Slope Velocity Capacity Description(min) (feet) (ft/ft) (ft/sec) (cfs)
8.0 50 0.0200 0.10 Sheet Flow, Grass: Dense n= 0.240 P2= 3.40"
0.3 50 0.2000 3.13 Shallow Concentrated Flow, Short Grass Pasture Kv= 7.0 fps
8.3 100 Total
Subcatchment 5S: front basin
Runoff
Hydrograph
Time (hours)3029282726252423222120191817161514131211109876543210
Flo
w (
cfs)
0.095
0.09
0.085
0.08
0.075
0.07
0.065
0.06
0.055
0.05
0.045
0.04
0.035
0.03
0.025
0.02
0.015
0.01
0.005
0
Type III 24-hr100-Yr Rainfall=7.00"Runoff Area=9,364 sf
Runoff Volume=0.014 afRunoff Depth=0.77"
Flow Length=100'Tc=8.3 min
CN=39
0.09 cfs
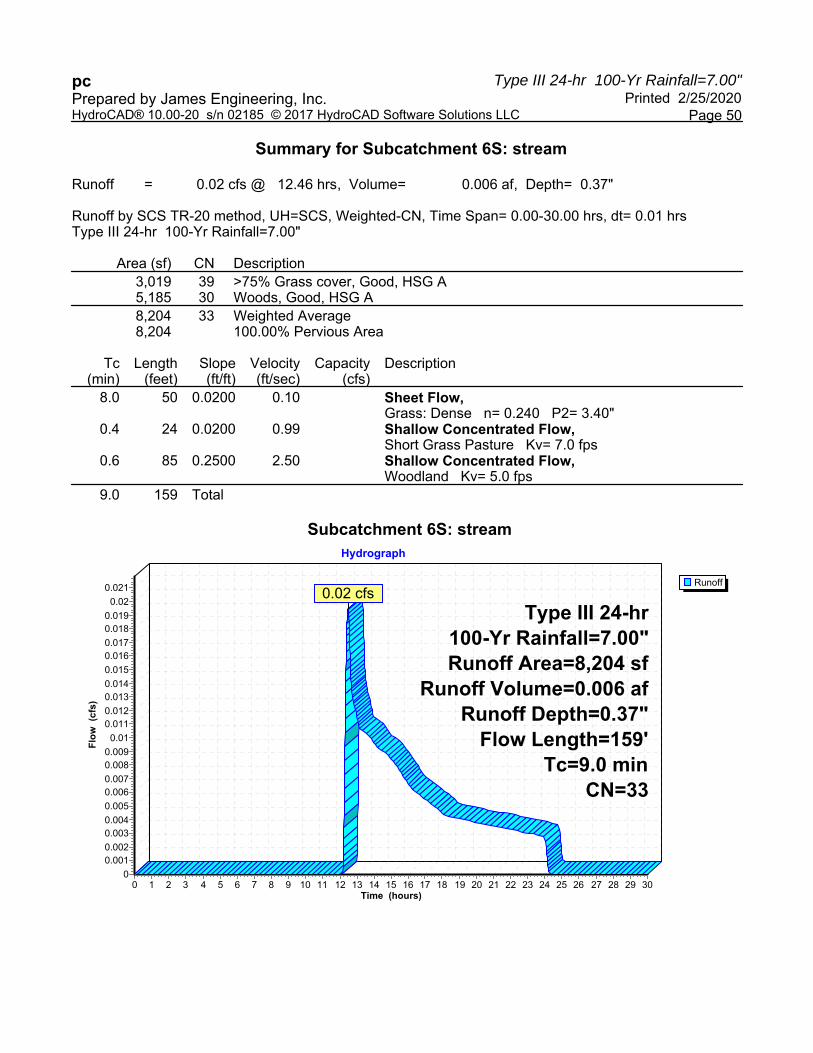
Type III 24-hr 100-Yr Rainfall=7.00"pc Printed 2/25/2020Prepared by James Engineering, Inc.
Page 50HydroCAD® 10.00-20 s/n 02185 © 2017 HydroCAD Software Solutions LLC
Summary for Subcatchment 6S: stream
Runoff = 0.02 cfs @ 12.46 hrs, Volume= 0.006 af, Depth= 0.37"
Runoff by SCS TR-20 method, UH=SCS, Weighted-CN, Time Span= 0.00-30.00 hrs, dt= 0.01 hrsType III 24-hr 100-Yr Rainfall=7.00"
Area (sf) CN Description3,019 39 >75% Grass cover, Good, HSG A5,185 30 Woods, Good, HSG A8,204 33 Weighted Average8,204 100.00% Pervious Area
Tc Length Slope Velocity Capacity Description(min) (feet) (ft/ft) (ft/sec) (cfs)
8.0 50 0.0200 0.10 Sheet Flow, Grass: Dense n= 0.240 P2= 3.40"
0.4 24 0.0200 0.99 Shallow Concentrated Flow, Short Grass Pasture Kv= 7.0 fps
0.6 85 0.2500 2.50 Shallow Concentrated Flow, Woodland Kv= 5.0 fps
9.0 159 Total
Subcatchment 6S: stream
Runoff
Hydrograph
Time (hours)3029282726252423222120191817161514131211109876543210
Flo
w (
cfs)
0.021
0.02
0.0190.018
0.0170.016
0.015
0.0140.013
0.0120.011
0.01
0.0090.008
0.0070.006
0.005
0.0040.003
0.0020.001
0
Type III 24-hr100-Yr Rainfall=7.00"Runoff Area=8,204 sf
Runoff Volume=0.006 afRunoff Depth=0.37"
Flow Length=159'Tc=9.0 min
CN=33
0.02 cfs
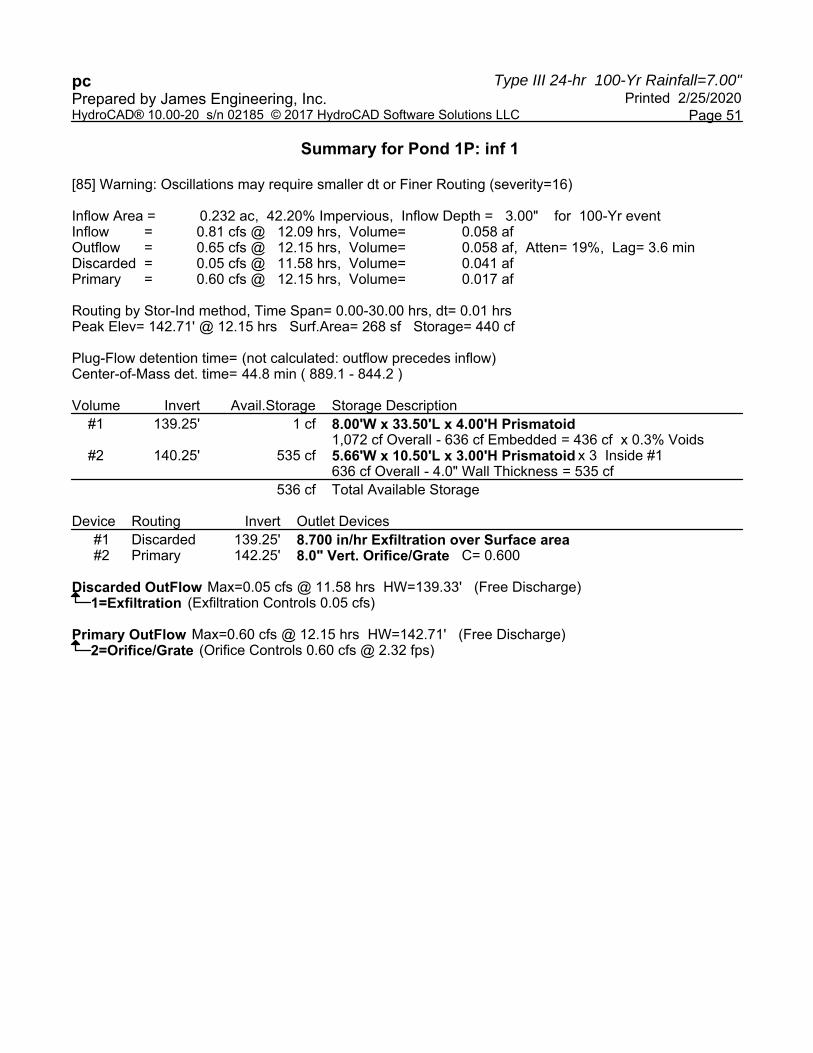
Type III 24-hr 100-Yr Rainfall=7.00"pc Printed 2/25/2020Prepared by James Engineering, Inc.
Page 51HydroCAD® 10.00-20 s/n 02185 © 2017 HydroCAD Software Solutions LLC
Summary for Pond 1P: inf 1
[85] Warning: Oscillations may require smaller dt or Finer Routing (severity=16)
Inflow Area = 0.232 ac, 42.20% Impervious, Inflow Depth = 3.00" for 100-Yr eventInflow = 0.81 cfs @ 12.09 hrs, Volume= 0.058 afOutflow = 0.65 cfs @ 12.15 hrs, Volume= 0.058 af, Atten= 19%, Lag= 3.6 minDiscarded = 0.05 cfs @ 11.58 hrs, Volume= 0.041 afPrimary = 0.60 cfs @ 12.15 hrs, Volume= 0.017 af
Routing by Stor-Ind method, Time Span= 0.00-30.00 hrs, dt= 0.01 hrsPeak Elev= 142.71' @ 12.15 hrs Surf.Area= 268 sf Storage= 440 cf
Plug-Flow detention time= (not calculated: outflow precedes inflow)Center-of-Mass det. time= 44.8 min ( 889.1 - 844.2 )
Volume Invert Avail.Storage Storage Description#1 139.25' 1 cf 8.00'W x 33.50'L x 4.00'H Prismatoid
1,072 cf Overall - 636 cf Embedded = 436 cf x 0.3% Voids#2 140.25' 535 cf 5.66'W x 10.50'L x 3.00'H Prismatoid x 3 Inside #1
636 cf Overall - 4.0" Wall Thickness = 535 cf536 cf Total Available Storage
Device Routing Invert Outlet Devices#1 Discarded 139.25' 8.700 in/hr Exfiltration over Surface area #2 Primary 142.25' 8.0" Vert. Orifice/Grate C= 0.600
Discarded OutFlow Max=0.05 cfs @ 11.58 hrs HW=139.33' (Free Discharge)1=Exfiltration (Exfiltration Controls 0.05 cfs)
Primary OutFlow Max=0.60 cfs @ 12.15 hrs HW=142.71' (Free Discharge)2=Orifice/Grate (Orifice Controls 0.60 cfs @ 2.32 fps)
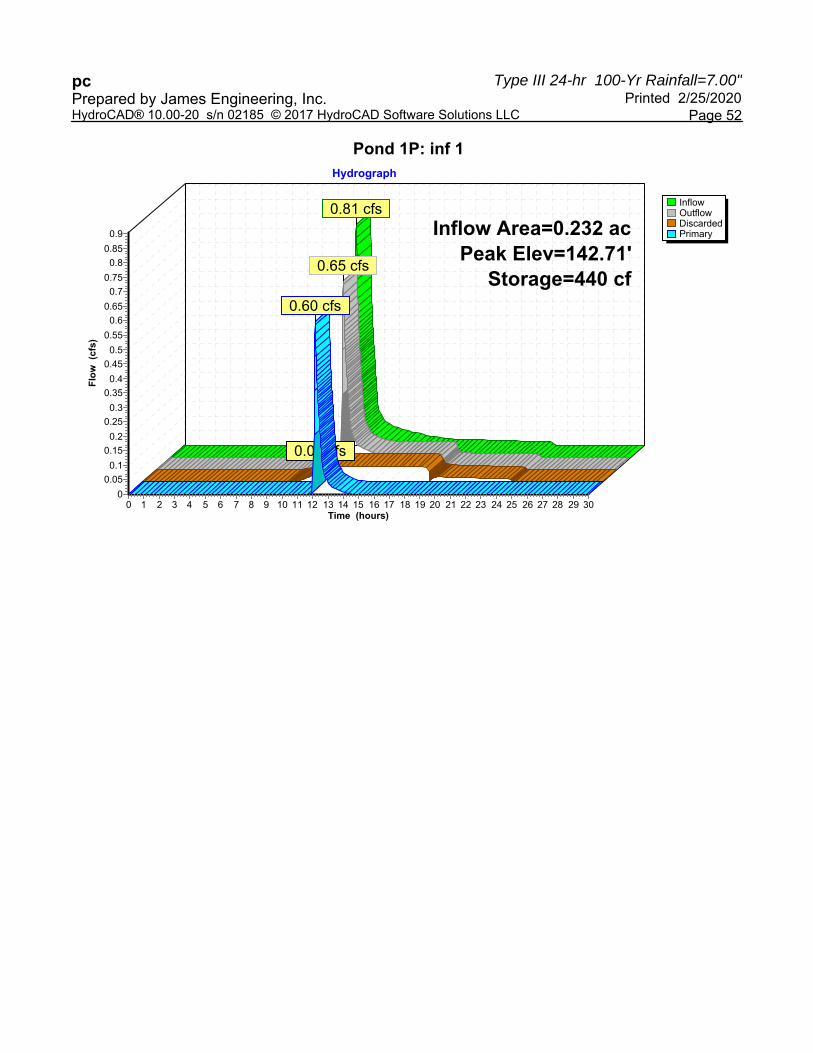
Type III 24-hr 100-Yr Rainfall=7.00"pc Printed 2/25/2020Prepared by James Engineering, Inc.
Page 52HydroCAD® 10.00-20 s/n 02185 © 2017 HydroCAD Software Solutions LLC
Pond 1P: inf 1
InflowOutflowDiscardedPrimary
Hydrograph
Time (hours)3029282726252423222120191817161514131211109876543210
Flo
w (
cfs)
0.9
0.85
0.8
0.75
0.7
0.65
0.6
0.55
0.5
0.45
0.4
0.35
0.3
0.25
0.2
0.15
0.1
0.05
0
Inflow Area=0.232 acPeak Elev=142.71'
Storage=440 cf
0.81 cfs
0.65 cfs
0.05 cfs
0.60 cfs

Type III 24-hr 100-Yr Rainfall=7.00"pc Printed 2/25/2020Prepared by James Engineering, Inc.
Page 53HydroCAD® 10.00-20 s/n 02185 © 2017 HydroCAD Software Solutions LLC
Summary for Pond 2P: roof
Inflow Area = 0.015 ac,100.00% Impervious, Inflow Depth = 6.76" for 100-Yr eventInflow = 0.11 cfs @ 12.08 hrs, Volume= 0.009 afOutflow = 0.02 cfs @ 11.69 hrs, Volume= 0.009 af, Atten= 81%, Lag= 0.0 minDiscarded = 0.02 cfs @ 11.69 hrs, Volume= 0.009 af
Routing by Stor-Ind method, Time Span= 0.00-30.00 hrs, dt= 0.01 hrsPeak Elev= 143.56' @ 12.52 hrs Surf.Area= 100 sf Storage= 88 cf
Plug-Flow detention time= 21.6 min calculated for 0.009 af (100% of inflow)Center-of-Mass det. time= 21.6 min ( 764.5 - 743.0 )
Volume Invert Avail.Storage Storage Description#1 142.00' 41 cf 8.00'W x 12.50'L x 3.50'H Prismatoid
350 cf Overall - 212 cf Embedded = 138 cf x 30.0% Voids#2 142.50' 178 cf 5.66'W x 10.50'L x 3.00'H Prismatoid Inside #1
212 cf Overall - 4.0" Wall Thickness = 178 cf220 cf Total Available Storage
Device Routing Invert Outlet Devices#1 Discarded 142.00' 8.700 in/hr Exfiltration over Surface area
Discarded OutFlow Max=0.02 cfs @ 11.69 hrs HW=142.04' (Free Discharge)1=Exfiltration (Exfiltration Controls 0.02 cfs)
Pond 2P: roof
InflowDiscarded
Hydrograph
Time (hours)3029282726252423222120191817161514131211109876543210
Flo
w (
cfs)
0.1150.11
0.1050.1
0.0950.09
0.0850.08
0.0750.07
0.0650.06
0.0550.05
0.0450.04
0.0350.03
0.0250.02
0.0150.01
0.0050
Inflow Area=0.015 acPeak Elev=143.56'
Storage=88 cf
0.11 cfs
0.02 cfs

Type III 24-hr 100-Yr Rainfall=7.00"pc Printed 2/25/2020Prepared by James Engineering, Inc.
Page 54HydroCAD® 10.00-20 s/n 02185 © 2017 HydroCAD Software Solutions LLC
Summary for Link 3L: rte 53
Inflow Area = 0.322 ac, 35.56% Impervious, Inflow Depth = 1.11" for 100-Yr eventInflow = 0.73 cfs @ 12.15 hrs, Volume= 0.030 afPrimary = 0.73 cfs @ 12.15 hrs, Volume= 0.030 af, Atten= 0%, Lag= 0.0 min
Primary outflow = Inflow, Time Span= 0.00-30.00 hrs, dt= 0.01 hrs
Link 3L: rte 53
InflowPrimary
Hydrograph
Time (hours)3029282726252423222120191817161514131211109876543210
Flo
w (
cfs)
0.8
0.75
0.7
0.65
0.6
0.55
0.5
0.45
0.4
0.35
0.3
0.25
0.2
0.15
0.1
0.05
0
Inflow Area=0.322 ac0.73 cfs
0.73 cfs

Type III 24-hr 100-Yr Rainfall=7.00"pc Printed 2/25/2020Prepared by James Engineering, Inc.
Page 55HydroCAD® 10.00-20 s/n 02185 © 2017 HydroCAD Software Solutions LLC
Summary for Link 4L: site total
Inflow Area = 0.932 ac, 12.29% Impervious, Inflow Depth = 0.79" for 100-Yr eventInflow = 0.88 cfs @ 12.15 hrs, Volume= 0.061 afPrimary = 0.88 cfs @ 12.15 hrs, Volume= 0.061 af, Atten= 0%, Lag= 0.0 min
Primary outflow = Inflow, Time Span= 0.00-30.00 hrs, dt= 0.01 hrs
Link 4L: site total
InflowPrimary
Hydrograph
Time (hours)3029282726252423222120191817161514131211109876543210
Flo
w (
cfs)
0.95
0.9
0.85
0.8
0.75
0.7
0.65
0.6
0.55
0.5
0.45
0.4
0.35
0.3
0.25
0.2
0.15
0.1
0.05
0
Inflow Area=0.932 ac0.88 cfs
0.88 cfs

Type III 24-hr 100-Yr Rainfall=7.00"pc Printed 2/25/2020Prepared by James Engineering, Inc.
Page 56HydroCAD® 10.00-20 s/n 02185 © 2017 HydroCAD Software Solutions LLC
Summary for Link 5L: derby brook
Inflow Area = 0.422 ac, 0.00% Impervious, Inflow Depth = 0.73" for 100-Yr eventInflow = 0.15 cfs @ 12.20 hrs, Volume= 0.026 afPrimary = 0.15 cfs @ 12.20 hrs, Volume= 0.026 af, Atten= 0%, Lag= 0.0 min
Primary outflow = Inflow, Time Span= 0.00-30.00 hrs, dt= 0.01 hrs
Link 5L: derby brook
InflowPrimary
Hydrograph
Time (hours)3029282726252423222120191817161514131211109876543210
Flo
w (
cfs)
0.17
0.16
0.15
0.14
0.13
0.12
0.11
0.1
0.09
0.08
0.07
0.06
0.05
0.04
0.03
0.02
0.01
0
Inflow Area=0.422 ac0.15 cfs
0.15 cfs

James Engineering, Inc. 125 Great Rock Road, Hanover, Ma 02339
15
Watershed Plans
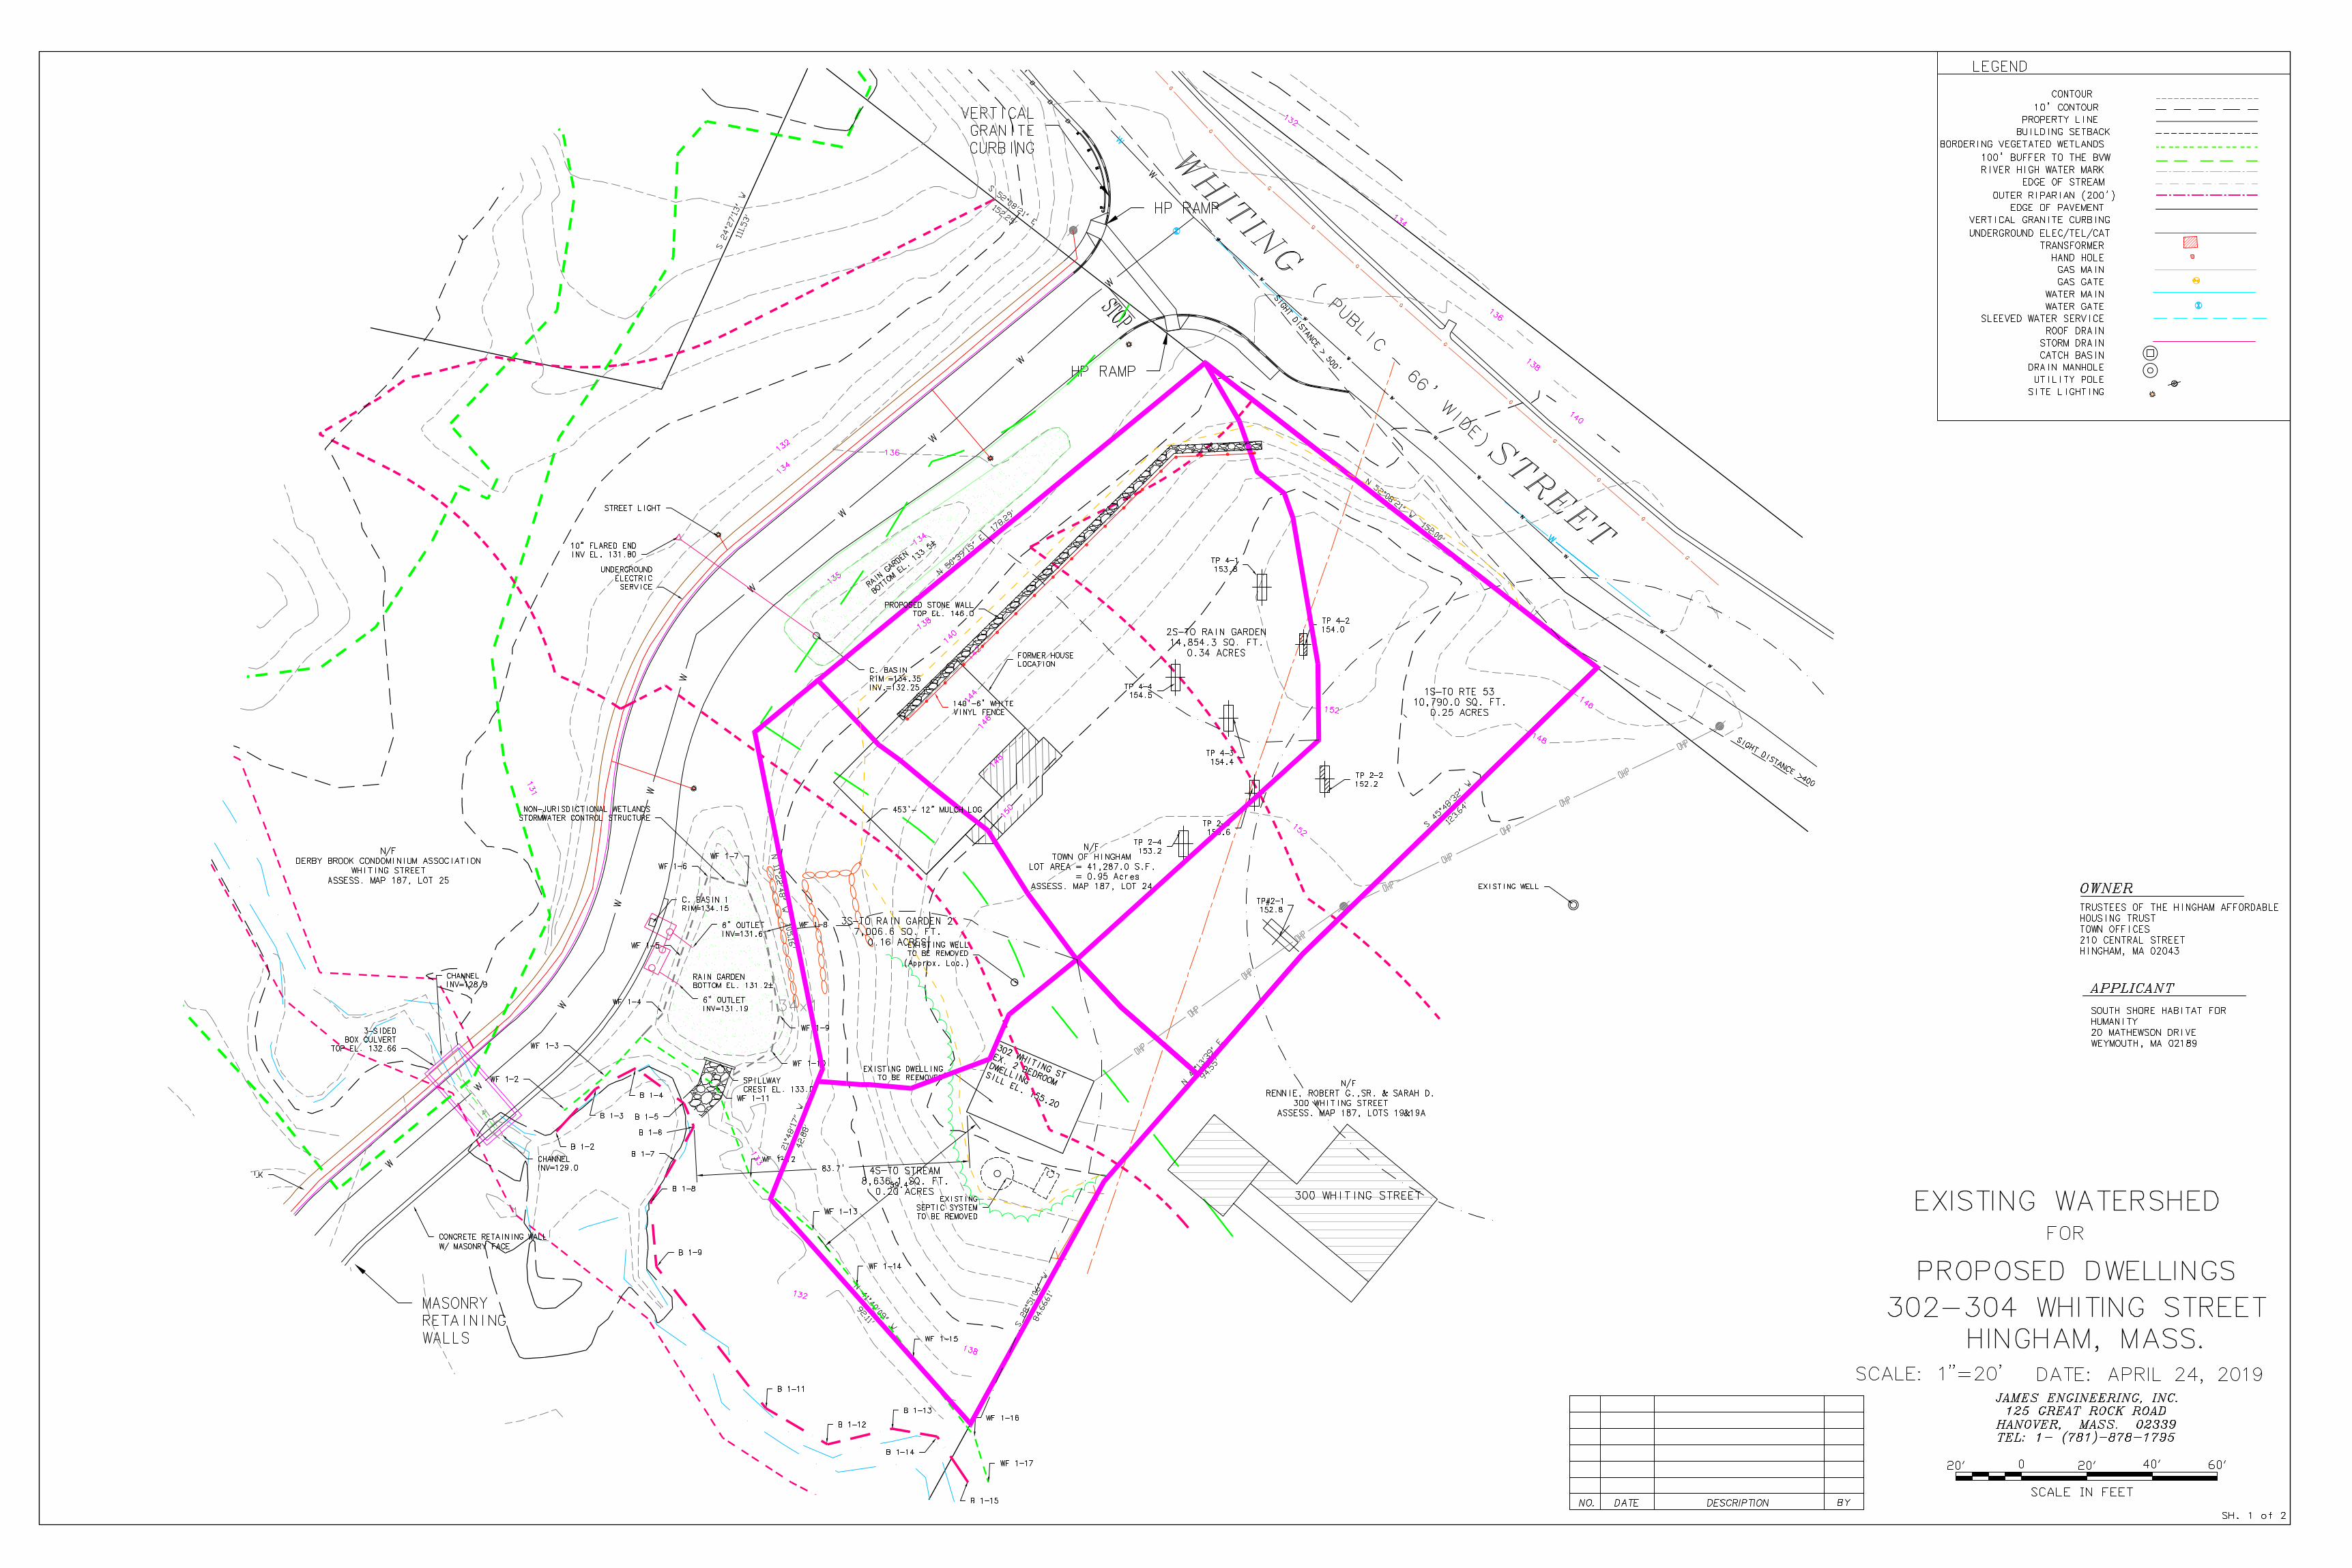
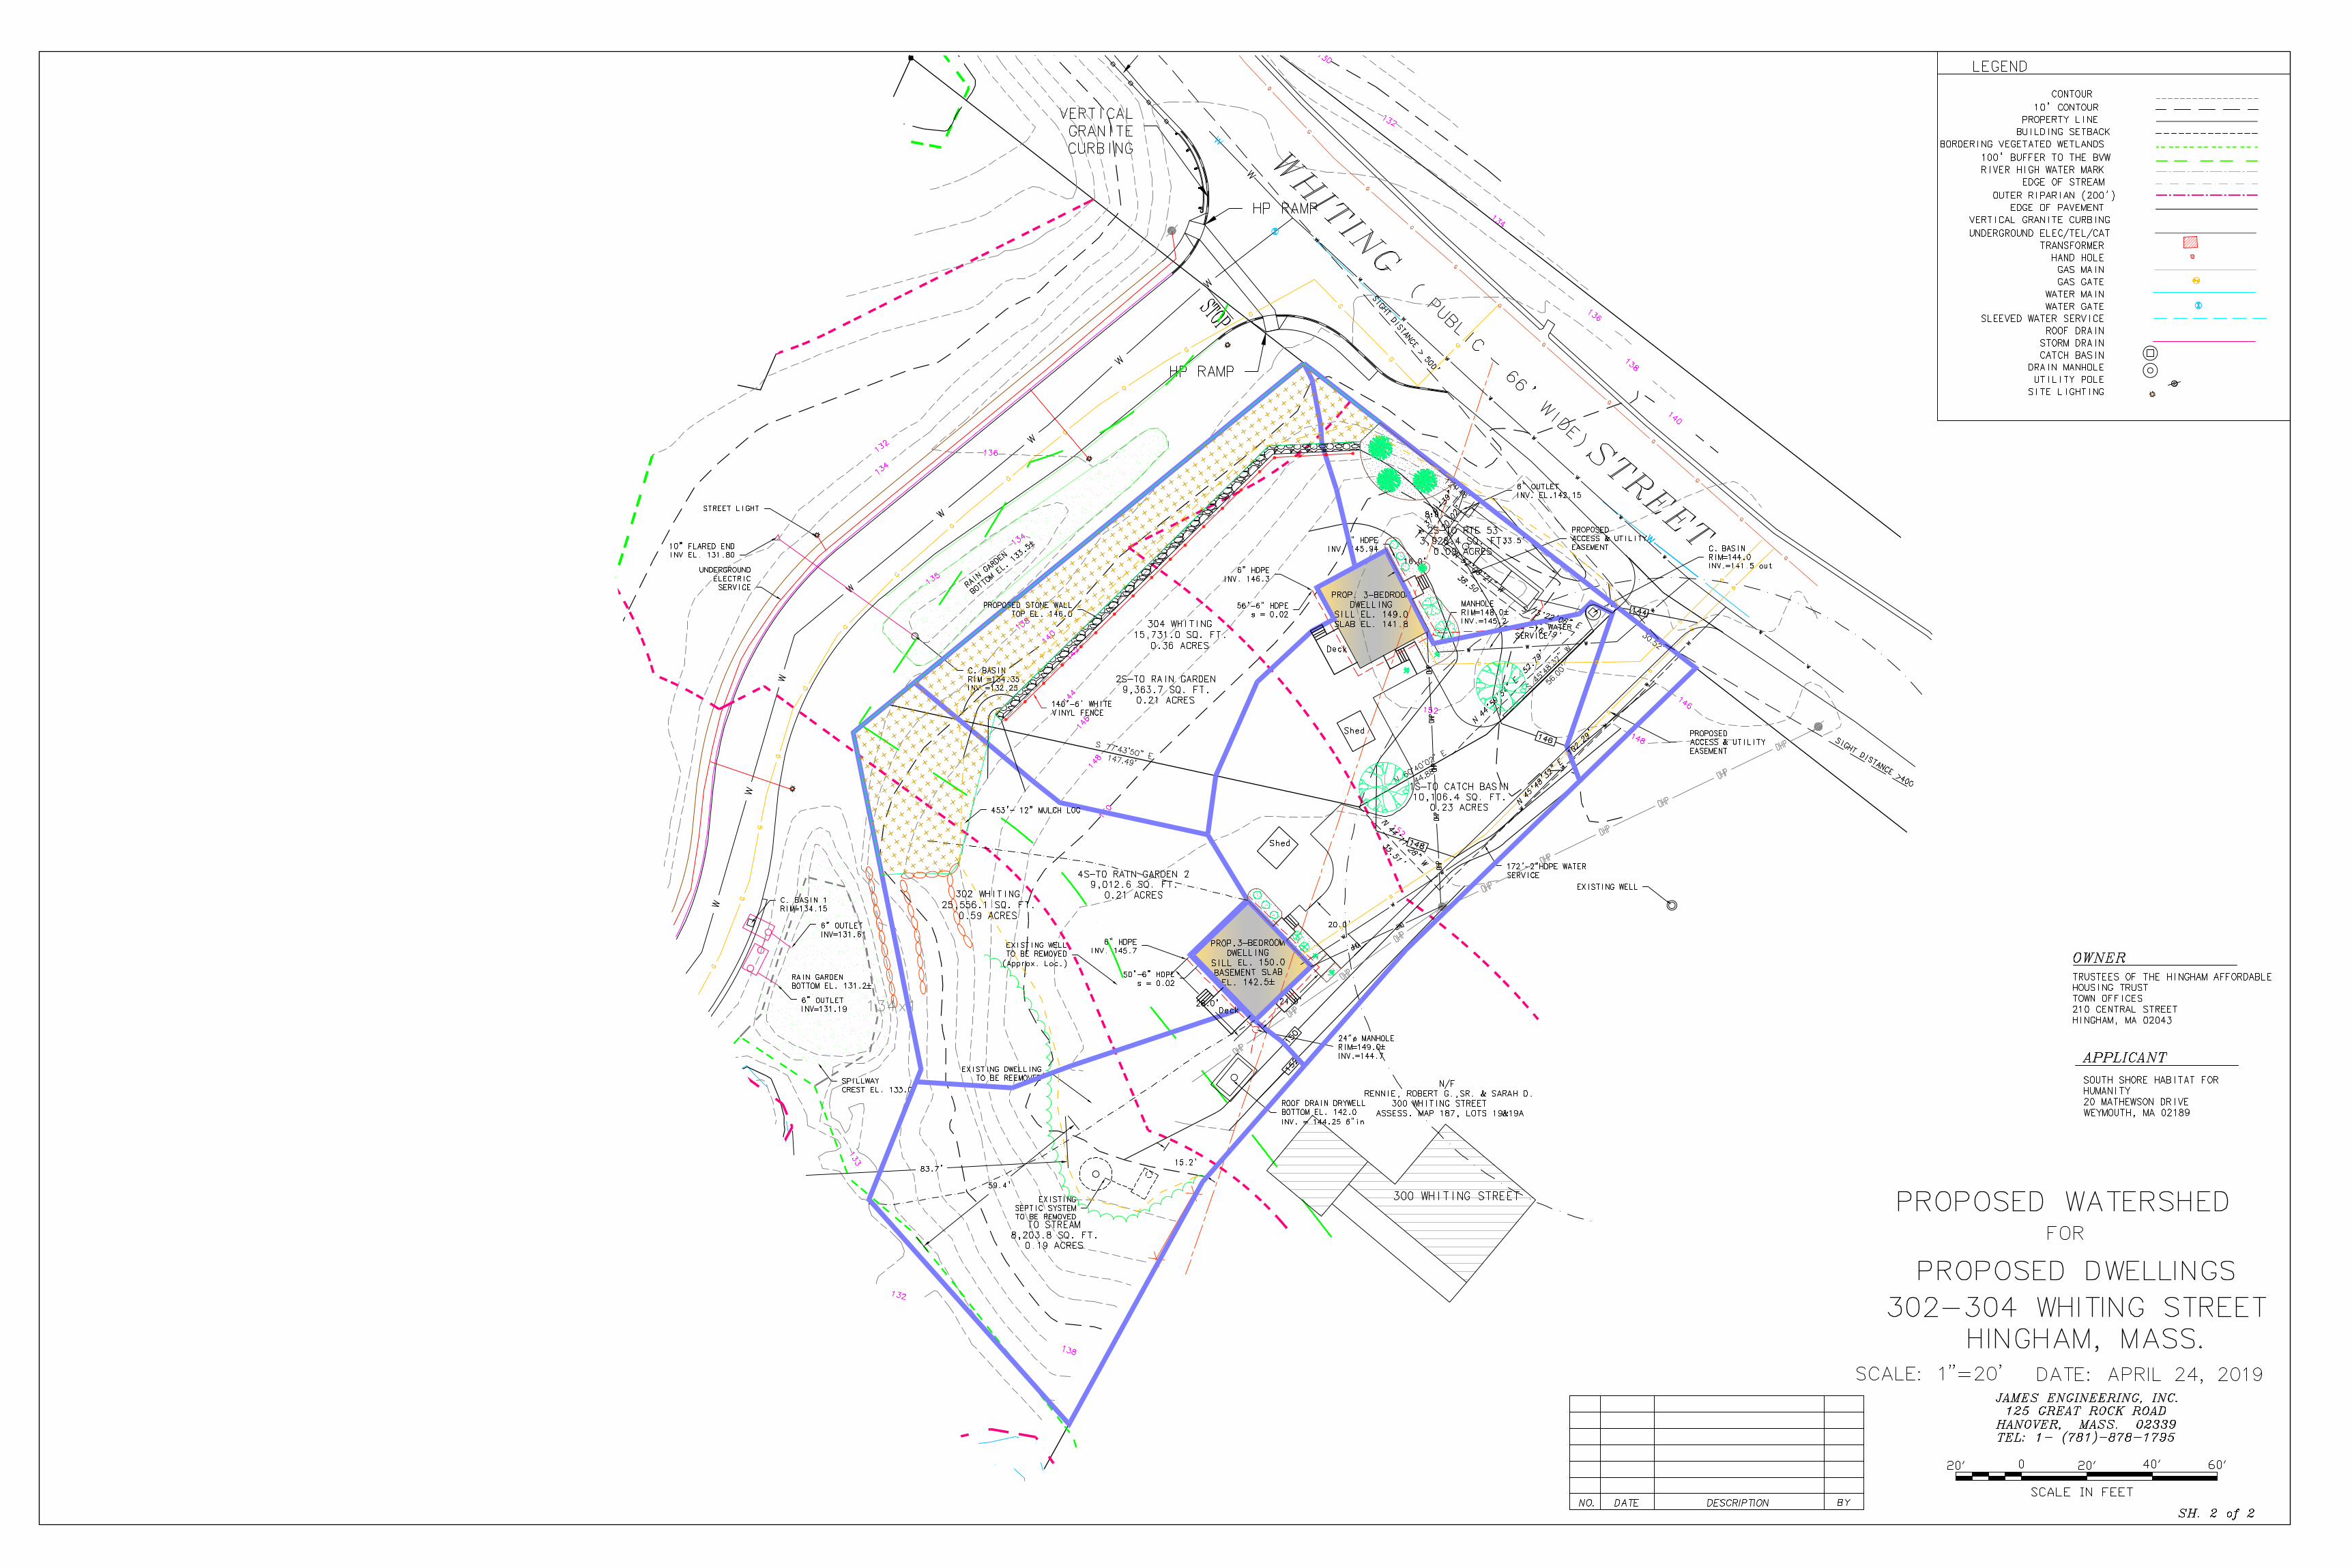

James Engineering, Inc. 125 Great Rock Road, Hanover, Ma 02339
16
Operations & Maintenance

OPERATION AND MAINTENANCE PLAN
for:
302-304 Whiting Street Hingham, MA 02043
Operator:
South Shore Habitat for Humanity 20 Mathewson Drive
Weymouth, MA 02189
O&M Contact:
O&M Plan Preparation Date:
February 22,2020

OPERATION AND MAINTENANCE PLAN
NARRATIVE:
The development is 2, 3‐bedroom single family dwellings on a one‐acre lot. The dwellings are accessed by a paved common driveway off of Whiting Street. Nearly all of the impervious surfaces on site are directed to subsurface structures on the lot. The driveway slopes towards Whiting Street and runoff from this surface is collected by a catch basin located on the right side of the driveway. The catch basin will have a “Fabco” filter insert which will provide the pretreatment necessary to meet stormwater standards for flows into an infiltration system. Runoff that is collected in the basin is piped directly into an infiltration chamber system. This system consists of 3‐precast concrete 1,000‐gallon chambers with 6” of stone around the chambers. The discharge from this system is primarily infiltration but a 6” outlet for excess flows is directed towards Whiting Street. Runoff from the roof of the dwelling at 304 Whiting is also being directed into this system. In addition to this system, the roof runoff from the dwelling at 302 Whiting Street will be collected and directed into drywell that consists of 1 1,000 gallon precast concrete chamber with 12” of stone around the chamber and 6” beneath it. Discharge from this system is 100% infiltration.
STORMWATER MANAGEMENT SYSTEM OWNERS:
The current owner of all of the Stormwater management systems is;
South Shore Habitat for Humanity 20 Mathewson Drive
Weymouth, MA 02189
In the future, the 2 homeowners will be responsible for all of the operation and maintenance on the storm water management system. SCHEDULE FOR IMPLEMENTATION OF ROUTINE AND NON‐ROUTINE MAINTENANCE TASKS: Catch Basin – The catch basin should be visually inspected on a monthly basis to ensure that it is in good condition. It should also be Inspected 24 hours after every significant rainfall event. Any debris or litter present shall be cleaned and removed. Inspect the outlet and clean any debris from the grate. Whenever the sediment depth in the sump exceeds 12” during any inspection, it should be immediately cleaned.
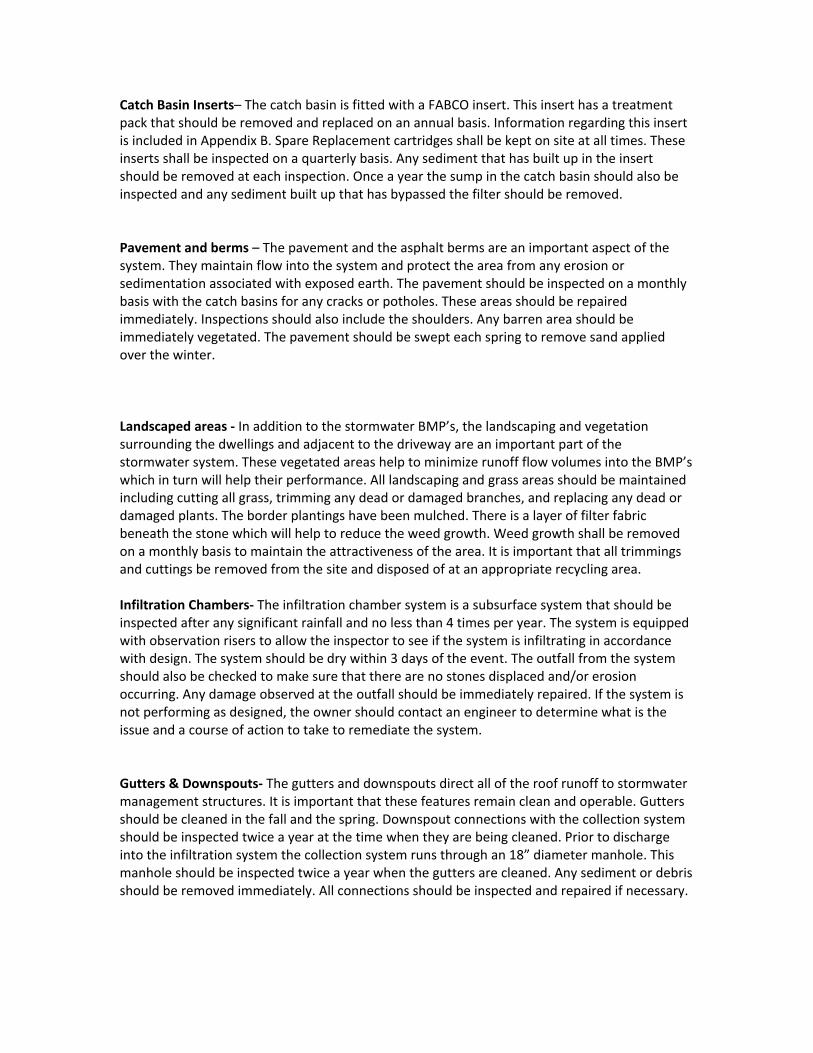
Catch Basin Inserts– The catch basin is fitted with a FABCO insert. This insert has a treatment pack that should be removed and replaced on an annual basis. Information regarding this insert is included in Appendix B. Spare Replacement cartridges shall be kept on site at all times. These inserts shall be inspected on a quarterly basis. Any sediment that has built up in the insert should be removed at each inspection. Once a year the sump in the catch basin should also be inspected and any sediment built up that has bypassed the filter should be removed. Pavement and berms – The pavement and the asphalt berms are an important aspect of the system. They maintain flow into the system and protect the area from any erosion or sedimentation associated with exposed earth. The pavement should be inspected on a monthly basis with the catch basins for any cracks or potholes. These areas should be repaired immediately. Inspections should also include the shoulders. Any barren area should be immediately vegetated. The pavement should be swept each spring to remove sand applied over the winter. Landscaped areas ‐ In addition to the stormwater BMP’s, the landscaping and vegetation surrounding the dwellings and adjacent to the driveway are an important part of the stormwater system. These vegetated areas help to minimize runoff flow volumes into the BMP’s which in turn will help their performance. All landscaping and grass areas should be maintained including cutting all grass, trimming any dead or damaged branches, and replacing any dead or damaged plants. The border plantings have been mulched. There is a layer of filter fabric beneath the stone which will help to reduce the weed growth. Weed growth shall be removed on a monthly basis to maintain the attractiveness of the area. It is important that all trimmings and cuttings be removed from the site and disposed of at an appropriate recycling area. Infiltration Chambers‐ The infiltration chamber system is a subsurface system that should be inspected after any significant rainfall and no less than 4 times per year. The system is equipped with observation risers to allow the inspector to see if the system is infiltrating in accordance with design. The system should be dry within 3 days of the event. The outfall from the system should also be checked to make sure that there are no stones displaced and/or erosion occurring. Any damage observed at the outfall should be immediately repaired. If the system is not performing as designed, the owner should contact an engineer to determine what is the issue and a course of action to take to remediate the system. Gutters & Downspouts‐ The gutters and downspouts direct all of the roof runoff to stormwater management structures. It is important that these features remain clean and operable. Gutters should be cleaned in the fall and the spring. Downspout connections with the collection system should be inspected twice a year at the time when they are being cleaned. Prior to discharge into the infiltration system the collection system runs through an 18” diameter manhole. This manhole should be inspected twice a year when the gutters are cleaned. Any sediment or debris should be removed immediately. All connections should be inspected and repaired if necessary.
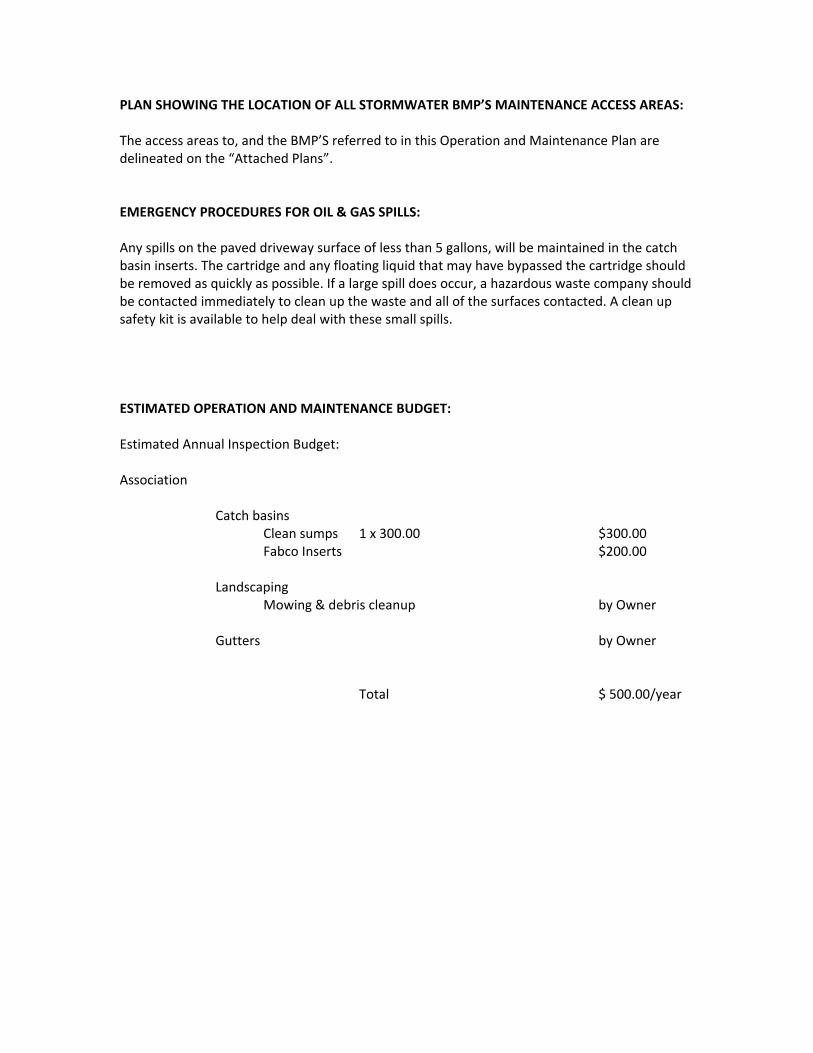
PLAN SHOWING THE LOCATION OF ALL STORMWATER BMP’S MAINTENANCE ACCESS AREAS: The access areas to, and the BMP’S referred to in this Operation and Maintenance Plan are delineated on the “Attached Plans”. EMERGENCY PROCEDURES FOR OIL & GAS SPILLS: Any spills on the paved driveway surface of less than 5 gallons, will be maintained in the catch basin inserts. The cartridge and any floating liquid that may have bypassed the cartridge should be removed as quickly as possible. If a large spill does occur, a hazardous waste company should be contacted immediately to clean up the waste and all of the surfaces contacted. A clean up safety kit is available to help deal with these small spills. ESTIMATED OPERATION AND MAINTENANCE BUDGET: Estimated Annual Inspection Budget: Association Catch basins Clean sumps 1 x 300.00 $300.00 Fabco Inserts $200.00 Landscaping Mowing & debris cleanup by Owner Gutters by Owner
Total $ 500.00/year
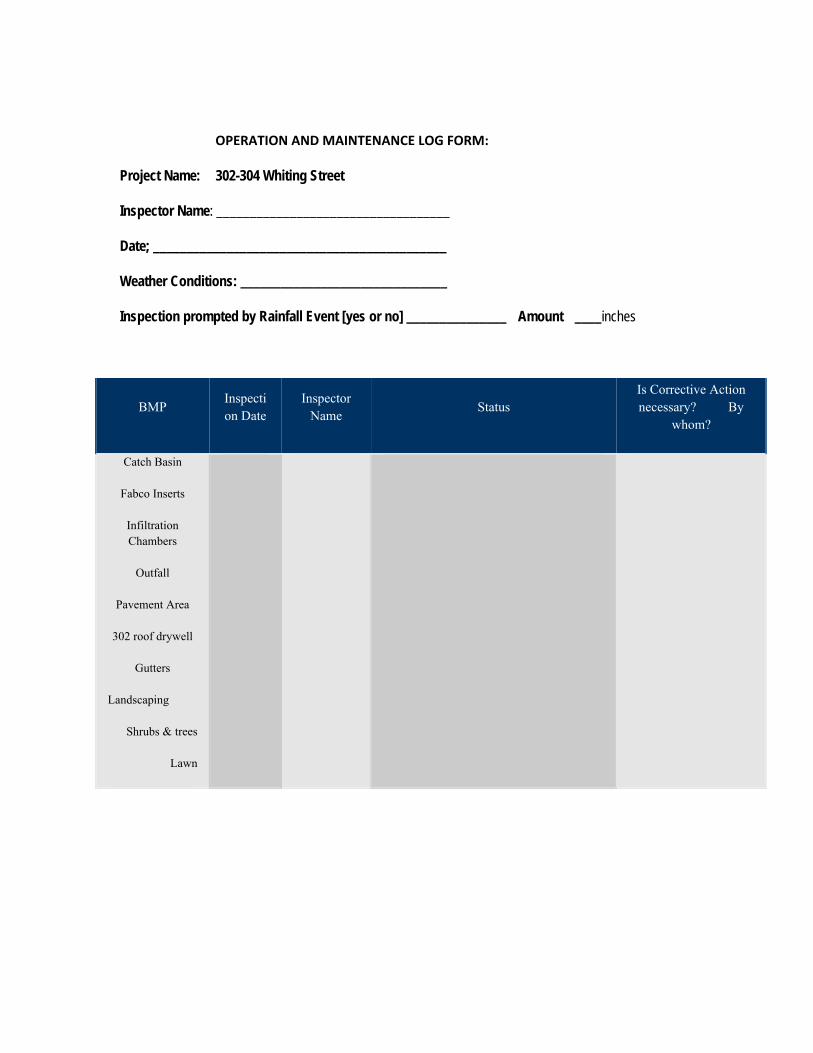
OPERATION AND MAINTENANCE LOG FORM: Project Name: 302-304 Whiting Street
Inspector Name: ___________________________________
Date; ____________________________________________
Weather Conditions: _______________________________
Inspection prompted by Rainfall Event [yes or no] _______________ Amount ____inches
BMP Inspection Date
Inspector Name
Status Is Corrective Action necessary? By
whom?
Catch Basin
Fabco Inserts
Infiltration Chambers
Outfall
Pavement Area
302 roof drywell
Gutters
Landscaping
Shrubs & trees
Lawn

Appendix A
Site Plans

Appendix B
“Fabco” Data

Storm Water Products

Compact water filtering systems that are designed to be installed into existing roadside drains commonly called a catch basin
What are Catch Basin inserts

Catch basin insert
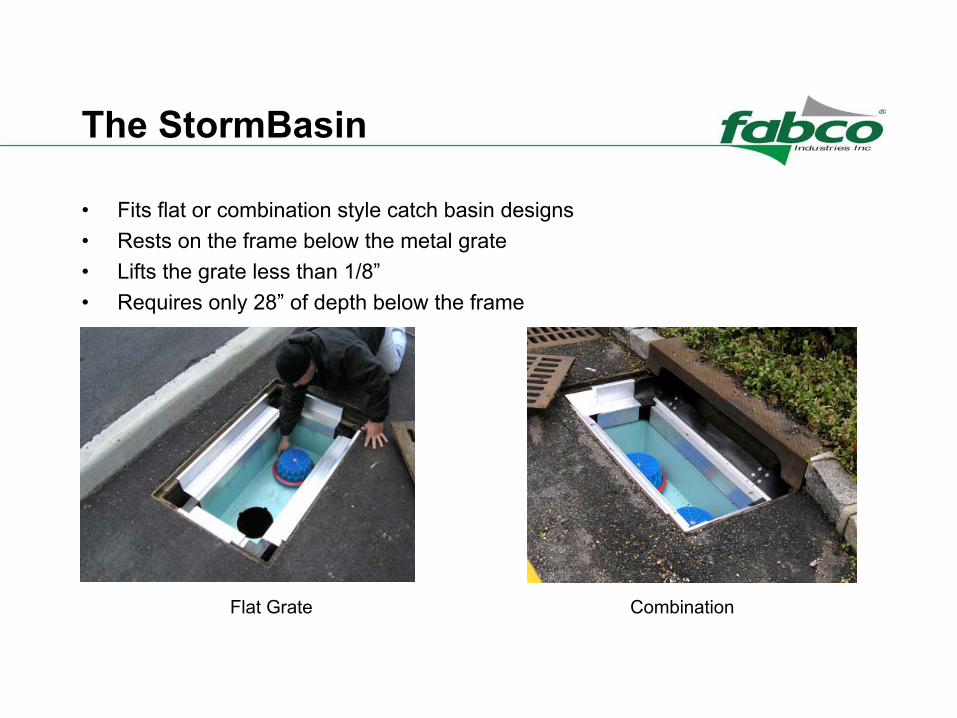
• Fits flat or combination style catch basin designs• Rests on the frame below the metal grate• Lifts the grate less than 1/8”• Requires only 28” of depth below the frame
Flat Grate Combination
The StormBasin
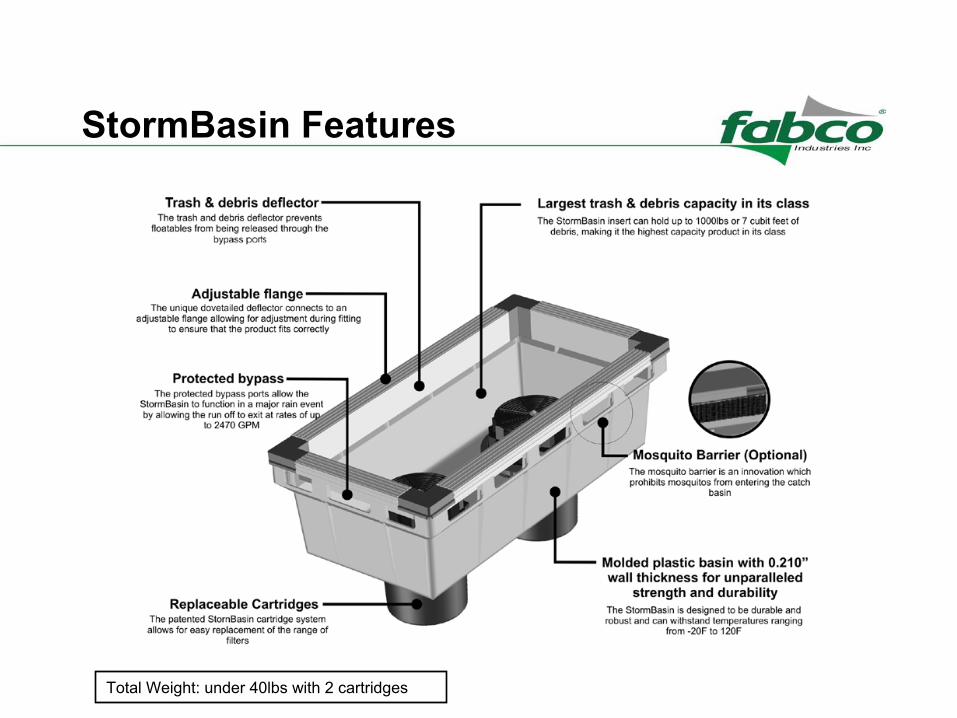
StormBasin Features
Total Weight: under 40lbs with 2 cartridges

Cartridges

Cartridge Design Goals
Capture a wide range of storm water pollutants
• Suspended solids – sediments• Oils, grease, Petroleum
hydrocarbons• Heavy metals; Cadmium, Lead,
Zinc• Insecticides, pesticides• Pathogens/Bacteria
While providing:• High flow rate• Simple & Safe installation• Low cost disposal

StormBasin Cartridge
FABGUARD treated foam pads restrict flow of pathogens and bacteria through the filter and protects cartridge from blinding
FABSORB pad absorbs 10 times its weight in oils/grease
FABMAX, patented media treats, hydrocarbons, pesticides, oil sheen, chlorinated organics
FABGUARD Antimicrobial

Validation

Excellent for trash and debris• The plastic basin provide space
for storage• Covered bypass retains
captured material• Rear rubber flap extends into
rear curb box directing water and debris into the filter box
Sediments & Solids
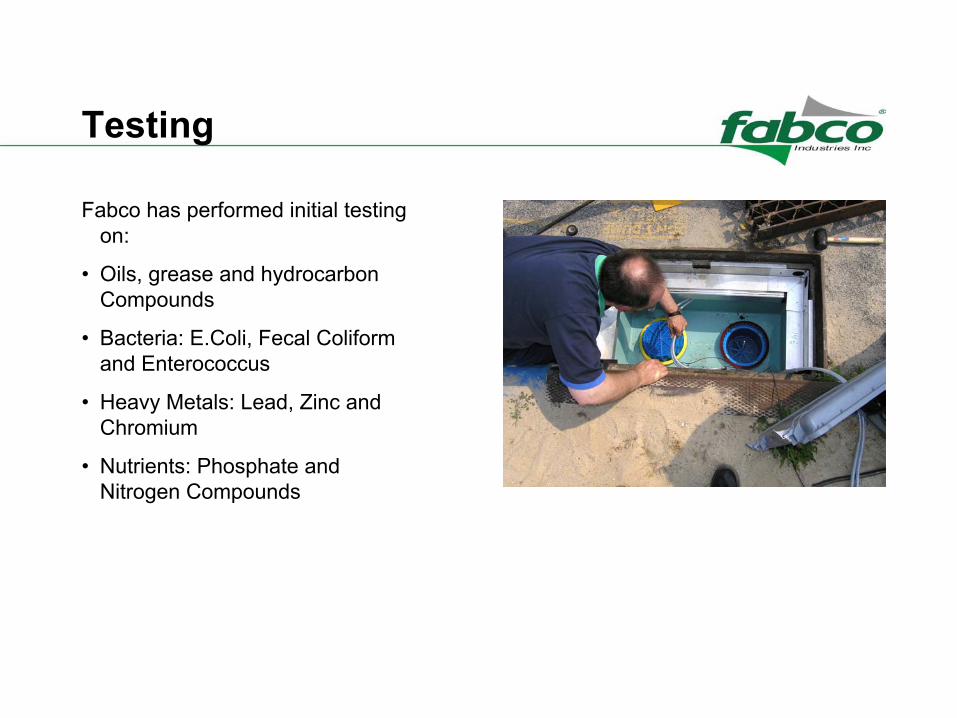
Testing
Fabco has performed initial testing on:
• Oils, grease and hydrocarbon Compounds
• Bacteria: E.Coli, Fecal Coliform and Enterococcus
• Heavy Metals: Lead, Zinc and Chromium
• Nutrients: Phosphate and Nitrogen Compounds
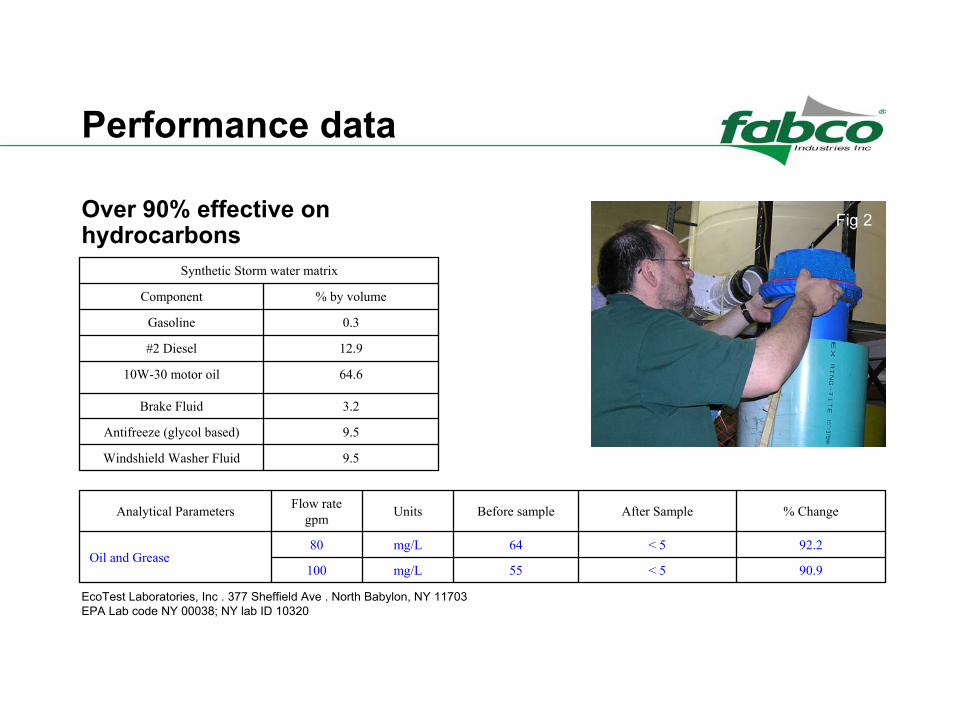
Over 90% effective on hydrocarbons
9.5Windshield Washer Fluid
9.5Antifreeze (glycol based)
3.2Brake Fluid
64.610W-30 motor oil
12.9#2 Diesel
0.3Gasoline
% by volumeComponent
Synthetic Storm water matrix
90.9< 555mg/L100
92.2< 564mg/L80 Oil and Grease
% ChangeAfter SampleBefore sampleUnitsFlow rategpmAnalytical Parameters
EcoTest Laboratories, Inc . 377 Sheffield Ave . North Babylon, NY 11703EPA Lab code NY 00038; NY lab ID 10320
Performance data
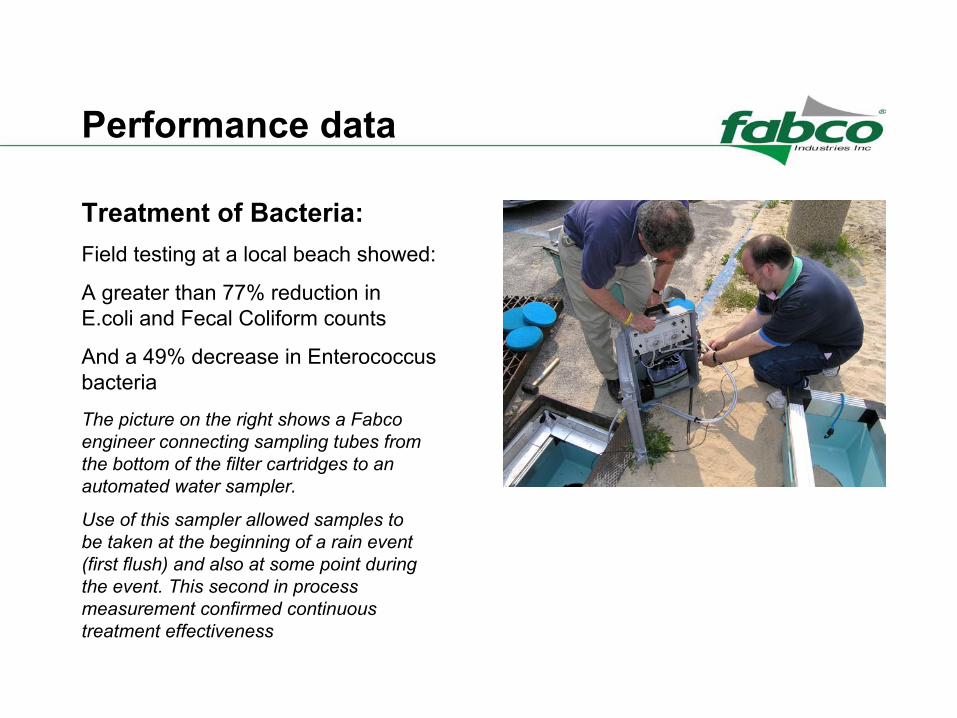
Performance data
Treatment of Bacteria:Field testing at a local beach showed:
A greater than 77% reduction in E.coli and Fecal Coliform counts
And a 49% decrease in Enterococcus bacteria
The picture on the right shows a Fabco engineer connecting sampling tubes from the bottom of the filter cartridges to an automated water sampler.
Use of this sampler allowed samples to be taken at the beginning of a rain event (first flush) and also at some point during the event. This second in process measurement confirmed continuous treatment effectiveness
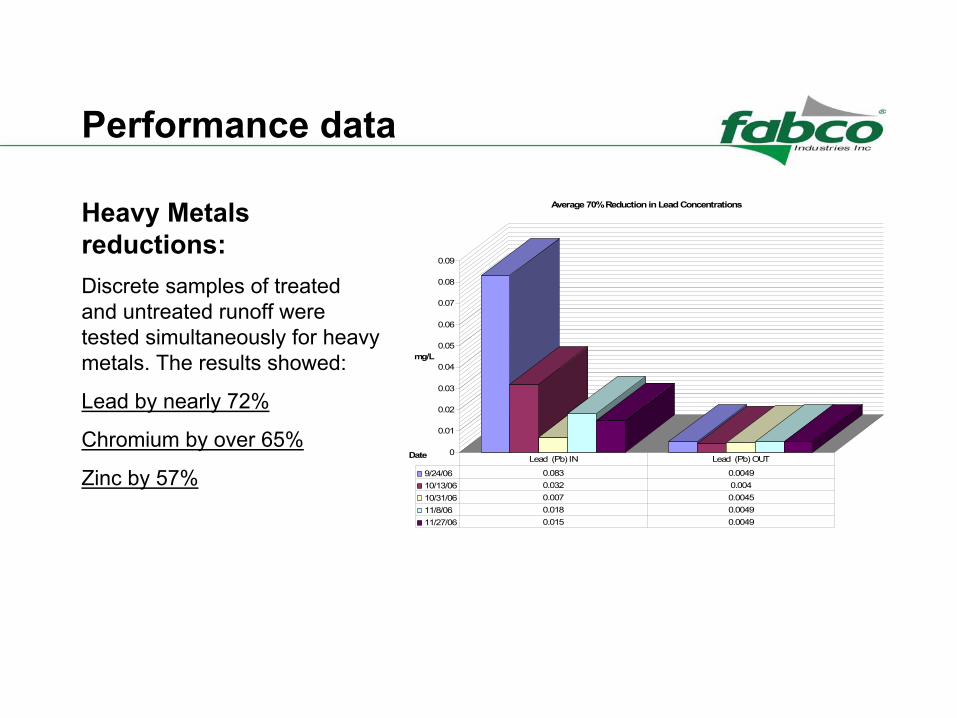
Performance data
Heavy Metals reductions:Discrete samples of treated and untreated runoff were tested simultaneously for heavy metals. The results showed:
Lead by nearly 72%
Chromium by over 65%
Zinc by 57%0
0.01
0.02
0.03
0.04
0.05
0.06
0.07
0.08
0.09
mg/L
Date
Average 70% Reduction in Lead Concentrations
9/24/06 0.083 0.004910/13/06 0.032 0.00410/31/06 0.007 0.004511/8/06 0.018 0.004911/27/06 0.015 0.0049
Lead (Pb) IN Lead (Pb) OUT
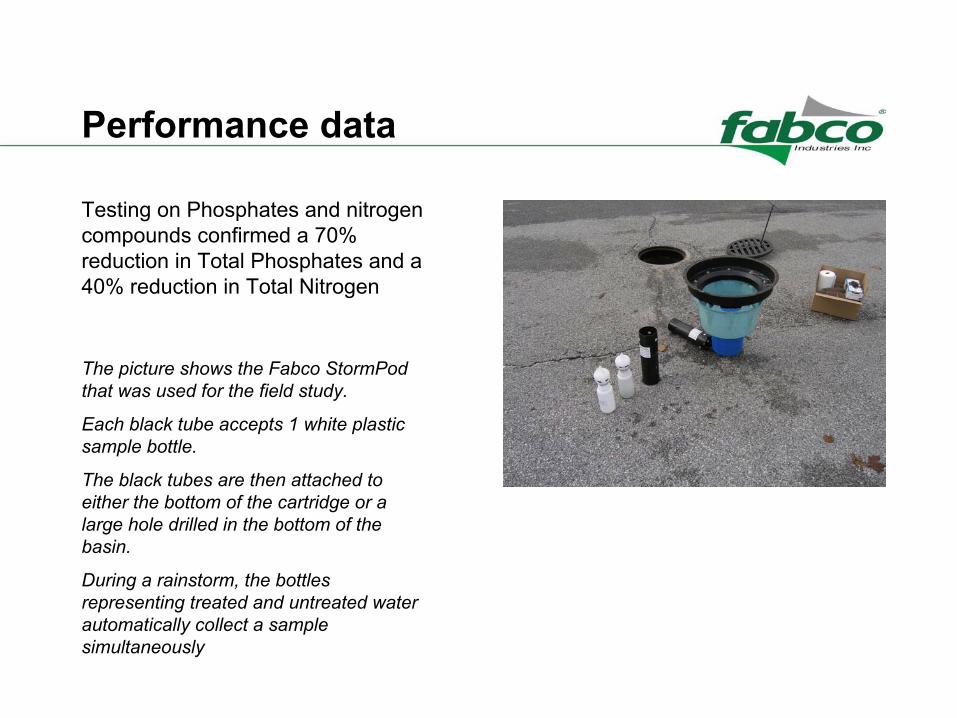
Performance data
Testing on Phosphates and nitrogen compounds confirmed a 70% reduction in Total Phosphates and a 40% reduction in Total Nitrogen
The picture shows the Fabco StormPod that was used for the field study.
Each black tube accepts 1 white plastic sample bottle.
The black tubes are then attached to either the bottom of the cartridge or a large hole drilled in the bottom of the basin.
During a rainstorm, the bottles representing treated and untreated water automatically collect a sample simultaneously
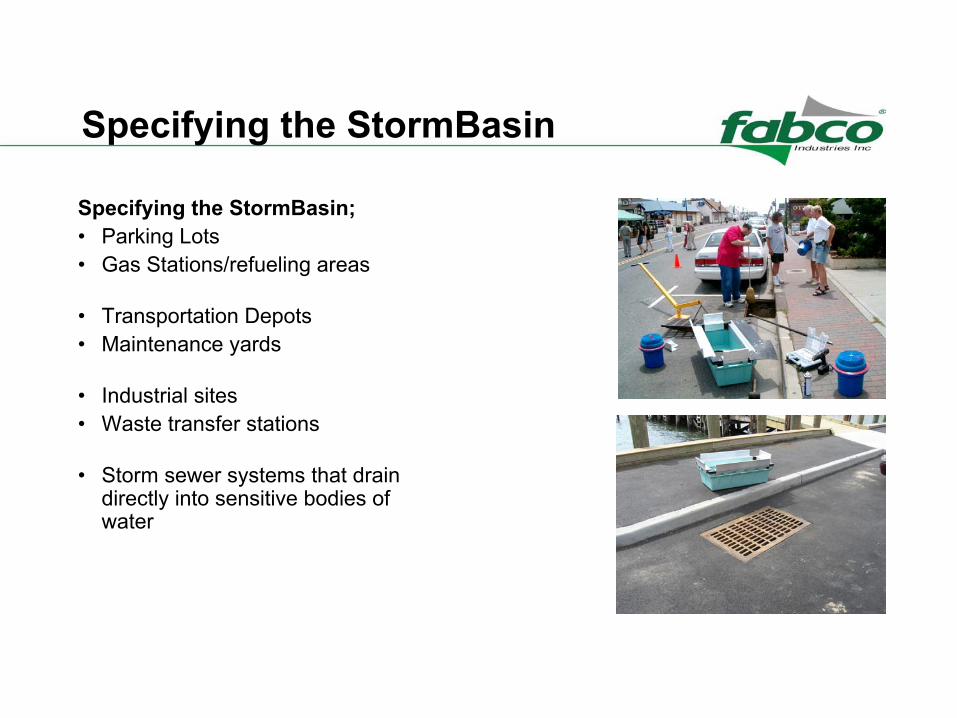
Specifying the StormBasin;• Parking Lots• Gas Stations/refueling areas
• Transportation Depots• Maintenance yards
• Industrial sites• Waste transfer stations
• Storm sewer systems that drain directly into sensitive bodies of water
Specifying the StormBasin
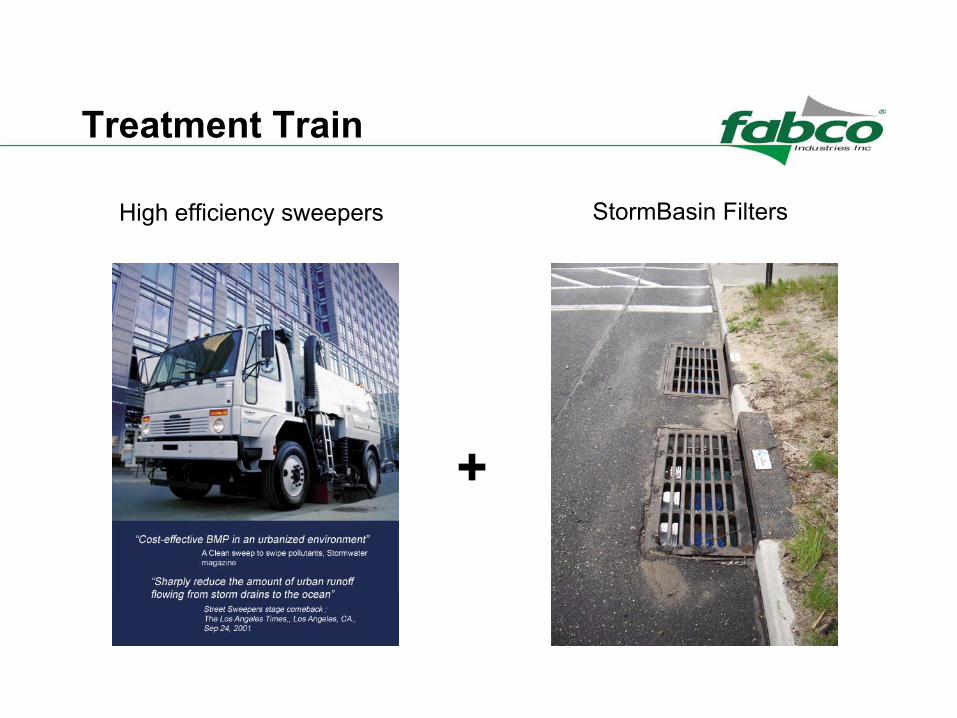
Treatment Train
+
High efficiency sweepers StormBasin Filters
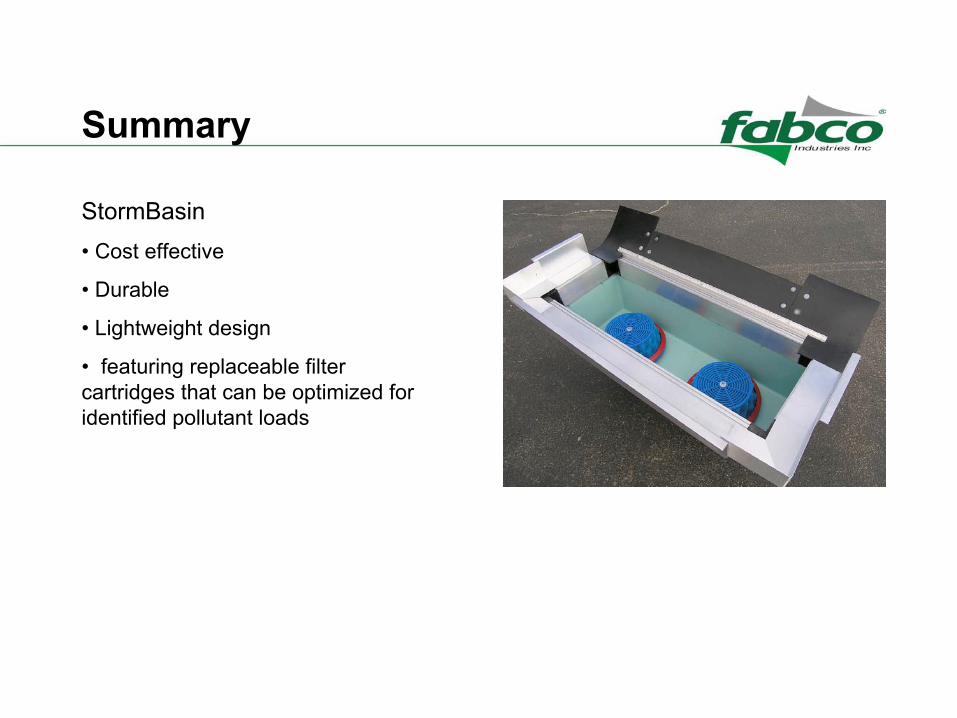
Summary
StormBasin• Cost effective
• Durable
• Lightweight design
• featuring replaceable filter cartridges that can be optimized for identified pollutant loads