dreyfus s&p 500 index fund - welcome to dreyfus return of 23.03%.1 in comparison, the s&p...
TRANSCRIPT

Dreyfus S&P 500 Index Fund
ANNUAL REPORT October 31, 2017

Save time. Save paper. View your next shareholder report onlineas soon as it’s available. Log into www.dreyfus.com and sign upfor Dreyfus eCommunications. It’s simple and only takes a fewminutes.
The views expressed in this report reflect those of the portfolio manager(s) only through the end of the period covered and do notnecessarily represent the views of Dreyfus or any other person in theDreyfus organization. Any such views are subject to change at anytime based upon market or other conditions and Dreyfus disclaims any responsibility to update such views. These views may not berelied on as investment advice and, because investment decisions fora Dreyfus fund are based on numerous factors, may not be relied onas an indication of trading intent on behalf of any Dreyfus fund.
Not FDIC-Insured • Not Bank-Guaranteed • May Lose Value

Contents T H E F U N D
A Letter from the CEO of Dreyfus 2 Discussion of Fund Performance 3 Fund Performance 5 Understanding Your Fund’s Expenses 6 Comparing Your Fund’s Expenses With Those of Other Funds 6 Statement of Investments 7 Statement of Investments in Affiliated Issuers 22 Statement of Futures 23 Statement of Assets and Liabilities 24 Statement of Operations 25 Statement of Changes in Net Assets 26 Financial Highlights 27 Notes to Financial Statements 28 Report of Independent Registered Public Accounting Firm 38 Important Tax Information 39 Board Members Information 40 Officers of the Fund 43
F O R M O R E I N F O R M AT I O N
Back Cover

2
A LETTER FROM THE CEO OF DREYFUS
Dear Shareholder:
We are pleased to present this annual report for Dreyfus S&P 500 Index Fund, covering the 12-month period from November 1, 2016 through October 31, 2017. For information about how the fund performed during the reporting period, as well as general market perspectives, we provide a Discussion of Fund Performance on the pages that follow.
Stocks set a series of new record highs and bonds produced mixed results over the past year in response to changing economic and political conditions. Financial markets at the start of the reporting period were dominated by the election of a new U.S. presidential administration. Equities and corporate-backed bonds surged higher in anticipation of more business-friendly regulatory, tax, and fiscal policies, but high-quality bonds generally lost value due to expectations of rising interest rates and accelerating inflation in a stronger economy. Despite a series of short-term interest-rate hikes, bonds recovered their previous losses over the first 10 months of 2017 when it became clearer that pro-growth legislation would take time and political capital to enact. U.S. and international stocks continued to rally as corporate earnings grew and global economic conditions improved.
The markets’ recent strong performance has been supported by solid underlying fundamentals. While we currently expect these favorable conditions to persist, we remain watchful for economic and political developments that could derail the markets. As always, we encourage you to discuss the risks and opportunities of today’s investment environment with your financial advisor.
Thank you for your continued confidence and support.
Sincerely,
Mark D. Santero Chief Executive Officer The Dreyfus Corporation November 15, 2017
Dreyfus S&P 500 Index Fund The Fund

DISCUSSION OF FUND PERFORMANCE
3
For the period of November 1, 2016 through October 31, 2017, as provided by Thomas J. Durante, CFA, Karen Q. Wong, CFA, and Richard A. Brown, CFA, Portfolio Managers
Market and Fund Performance Overview For the 12-month period ended October 31, 2017, Dreyfus S&P 500 Index Fund produced a total return of 23.03%.1 In comparison, the S&P 500® Index (the “Index”), the fund’s benchmark, returned 23.61% for the same period.2,3
Large-cap stocks gained ground amid better-than-expected corporate earnings, improving global economic prospects, and expectations of more stimulative U.S. government policies. The difference in returns between the fund and the Index was primarily the result of transaction costs and operating expenses that are not reflected in the Index’s results.
The Fund’s Investment Approach The fund seeks to match the performance of the Index by generally fully investing in stocks included in the Index and in futures whose performance is tied to the Index. The fund generally invests in all 500 stocks in the Index in proportion to their weighting in the Index.
The Index is an unmanaged index of 500 common stocks chosen to reflect the industries of the U.S. economy and is often considered a proxy for the stock market in general. S&P weights each company’s stock in the Index by its market capitalization (i.e., the share price times the number of shares outstanding), adjusted by the number of available float shares (i.e., those shares available to public investors). Companies included in the Index generally must have market capitalizations in excess of $5.3 billion, to the extent consistent with market conditions.
Rising Corporate Earnings Drove Markets Higher Equity markets were reenergized in late 2016 when investors began to anticipate more robust economic growth stemming from lower corporate taxes, reduced regulatory constraints on business, and increased infrastructure spending from a new presidential administration. In early 2017, better-than-expected corporate earnings and encouraging global economic developments drove the Index to a series of new highs. While concerns about the new presidential administration’s ability to implement its business-friendly policy proposals slowed the market’s advance in the spring, most broad measures of stock market performance quickly shrugged off those concerns and reached new all-time highs by the reporting period’s end.
The market’s advance was supported throughout the reporting period by measured, well-telegraphed shifts in monetary policy from the Federal Reserve Board (the “Fed”). Although rising interest rates historically have tended to undermine investor sentiment toward stocks, the Fed’s gradual approach to withdrawing economic stimulus—including three short-term interest-rate hikes and the start of balance-sheet reduction—was received calmly by investors, who focused more on rising corporate earnings and improving business conditions.
Technology Stocks Led the Market’s Advance The Index’s robust results over the reporting period were largely driven by impressive earnings growth in the information technology sector. Ongoing trends in favor of cloud computing, e-commerce, digital advertising, and mobile communications helped support revenues and earnings for a variety of large technology companies, most notably industry leaders such as Apple, Amazon.com, Facebook, Microsoft, and Alphabet (the parent of Google). Some of these industry giants moved into new lines of business, disrupting other areas, such as retail sales. Technological

DISCUSSION OF FUND PERFORMANCE (continued)
4
innovations also generated robust demand for semiconductor companies, which further benefited from renewed pricing power in a consolidating industry.
The financials sector also produced impressive results. Higher short-term interest rates helped banks and capital market firms expand their lending margins and revenues from currency trading. Deregulation of the financials sector helped boost profits further, and the previous cost-cutting efforts of many financial institutions positioned them well for the 2017 upturn.
Despite uncertainty surrounding government efforts to repeal and replace the Affordable Care Act, the health care sector posted strong gains over the reporting period. Indeed, Congress’s inability to repeal Obamacare helped support the outlook for a number of hospital operators and insurers. Moreover, concerns waned regarding government intervention to control drug costs, removing an impediment to gains among large biotechnology firms and pharmaceutical developers. Finally, the industry has been successful in obtaining regulatory approval of a record number of new drugs so far in 2017, further bolstering their prospects in the eyes of investors. Very large drug companies with diversified revenue sources fared especially well.
Only the telecommunication services sector posted negative absolute returns over the reporting period. Comprised of just four companies, the Index’s telecommunications components confronted challenges presented by “cord cutting” when more customers disconnected landlines and replaced cable television with Internet-based entertainment services. The energy sector posted a mildly positive return, as low oil prices early in the reporting period, reduced production volumes, and heavy debt burdens weighed on drilling equipment and oil service providers.
Replicating the Performance of the Index Although we do not actively manage the fund’s investments in response to macroeconomic trends, it is worth noting that the U.S. and global economic recoveries appear to have gained momentum, and corporate earnings have continued to exceed many analysts’ expectations. However, the market’s currently constructive conditions could be undermined by unexpected political and economic developments. As always, we have continued to monitor the factors considered by the fund’s investment model in light of current market conditions.
November 15, 2017 1 Total return includes reinvestment of dividends and any capital gains paid. Past performance is no guarantee of future results. Share
price and investment return fluctuate such that upon redemption, fund shares may be worth more or less than their original cost. 2 Source: Lipper Inc. — The S&P 500® Index is widely regarded as the best single gauge of large-cap U.S. equities. The index
includes 500 leading companies and captures approximately 80% coverage of available market capitalization. Investors cannot invest directly in any index.
3 “Standard & Poor’s®,” “S&P®,” “Standard & Poor’s® 500,” and “S&P 500®” are registered trademarks of Standard & Poor’s Financial Services LLC, and have been licensed for use on behalf of the fund. The fund is not sponsored, managed, advised, sold, or promoted by Standard & Poor’s and its affiliates, and Standard & Poor’s and its affiliates make no representation regarding the advisability of investing in the fund.
Equities are subject generally to market, market sector, market liquidity, issuer, and investment style risks, among other factors, to varying degrees, all of which are more fully described in the fund’s prospectus.

FUND PERFORMANCE
5
6,000
9,000
12,000
15,000
18,000
21,000
1716151413121110090807
Years Ended 10/31
Dol
lars
$20,626
$19,710Dreyfus S&P 500 Index Fund
S&P 500® Index†
Comparison of change in value of $10,000 investment in Dreyfus S&P 500 Index Fund shares and the S&P 500® Index (the “Index”) † Source: Lipper Inc. Past performance is not predictive of future performance. The above graph compares a $10,000 investment made in Dreyfus S&P 500 Index Fund on 10/31/07 to a $10,000 investment made in the Index on that date. All dividends and capital gain distributions are reinvested. The fund’s performance shown in the line graph above takes into account all applicable fees and expenses. The Index is widely regarded as the best single gauge of large-cap U.S. equities. The index includes 500 leading companies and captures approximately 80% coverage of available market capitalization. Unlike a mutual fund, the Index is not subject to charges, fees and other expenses. Investors cannot invest directly in any index. Further information relating to fund performance, including expense reimbursements, if applicable, is contained in the Financial Highlights section of the prospectus and elsewhere in this report.
Average Annual Total Returns as of 10/31/17 1 Year 5 Years 10 Years Fund 23.03% 14.61% 7.02%S&P 500® Index 23.61% 15.17% 7.51%
The performance data quoted represents past performance, which is no guarantee of future results. Share price and investment return fluctuate and an investor’s shares may be worth more or less than original cost upon redemption. Current performance may be lower or higher than the performance quoted. Go to Dreyfus.com for the fund’s most recent month-end returns. The fund’s performance shown in the graph and table does not reflect the deduction of taxes that a shareholder would pay on fund distributions or the redemption of fund shares.

UNDERSTANDING YOUR FUND’S EXPENSES (Unaudited)
6
As a mutual fund investor, you pay ongoing expenses, such as management fees and other expenses. Using the information below, you can estimate how these expenses affect your investment and compare them with the expenses of other funds. You also may pay one-time transaction expenses, including sales charges (loads) and redemption fees, which are not shown in this section and would have resulted in higher total expenses. For more information, see your fund’s prospectus or talk to your financial adviser.
Review your fund’s expenses The table below shows the expenses you would have paid on a $1,000 investment in Dreyfus S&P 500 Index Fund from May 1, 2017 to October 31, 2017. It also shows how much a $1,000 investment would be worth at the close of the period, assuming actual returns and expenses.
Expenses and Value of a $1,000 Investment assuming actual returns for the six months ended October 31, 2017 Expenses paid per $1,000† $ 2.63Ending value (after expenses) $ 1,088.40
COMPARING YOUR FUND’S EXPENSES WITH THOSE OF OTHER FUNDS (Unaudited) Using the SEC’s method to compare expenses The Securities and Exchange Commission (“SEC”) has established guidelines to help investors assess fund expenses. Per these guidelines, the table below shows your fund’s expenses based on a $1,000 investment, assuming a hypothetical 5% annualized return. You can use this information to compare the ongoing expenses (but not transaction expenses or total cost) of investing in the fund with those of other funds. All mutual fund shareholder reports will provide this information to help you make this comparison. Please note that you cannot use this information to estimate your actual ending account balance and expenses paid during the period.
Expenses and Value of a $1,000 Investment assuming a hypothetical 5% annualized return for the six months ended October 31, 2017 Expenses paid per $1,000† $ 2.55Ending value (after expenses) $1,022.68† Expenses are equal to the fund’s annualized expense ratio of .50%, multiplied by the average account value over the period,
multiplied by 184/365 (to reflect the one-half year period).

STATEMENT OF INVESTMENTS October 31, 2017
7
Description Shares Value ($)Common Stocks - 99.7%
Automobiles & Components - .7% BorgWarner 23,827 1,256,159Delphi Automotive 32,190 3,199,042Ford Motor 471,871 5,789,857General Motors 158,424 6,809,064Goodyear Tire & Rubber 29,075 889,404Harley-Davidson 21,393 a 1,012,745 18,956,271Banks - 6.5% Bank of America 1,181,909 32,372,488BB&T 98,162 4,833,497Citigroup 328,141 24,118,363Citizens Financial Group 61,266 2,328,721Comerica 20,279 1,593,321Fifth Third Bancorp 88,991 2,571,840Huntington Bancshares 134,670 1,858,446JPMorgan Chase & Co. 423,689 42,627,350KeyCorp 131,332 2,396,809M&T Bank 18,770 3,130,273People's United Financial 40,424 754,312PNC Financial Services Group 57,749 7,899,486Regions Financial 142,461 2,205,296SunTrust Banks 59,027 3,554,016U.S. Bancorp 190,441 10,356,182Wells Fargo & Co. 537,637 30,182,941Zions Bancorporation 23,407 1,087,489 173,870,830Capital Goods - 7.3% 3M 71,807 16,529,253A.O. Smith 17,706 1,048,195Acuity Brands 5,412 a 904,886Allegion 12,246 1,021,194AMETEK 27,455 1,852,938Arconic 47,056 1,182,047Boeing 66,906 17,260,410Caterpillar 70,751 9,607,986Cummins 18,794 3,324,283Deere & Co. 38,099 5,062,595Dover 18,599 1,776,019Eaton 53,627 4,291,233Emerson Electric 77,403 4,989,397Fastenal 35,297 1,657,900

STATEMENT OF INVESTMENTS (continued)
8
Description Shares Value ($)Common Stocks - 99.7% (continued)
Capital Goods - 7.3% (continued) Flowserve 15,885 700,052Fluor 16,443 708,529Fortive 36,888 2,665,527Fortune Brands Home & Security 19,081 1,260,491General Dynamics 33,547 6,809,370General Electric 1,041,906 21,004,825Honeywell International 91,601 13,205,200Illinois Tool Works 37,183 5,819,883Ingersoll-Rand 30,700 2,720,020Jacobs Engineering Group 14,914 868,144Johnson Controls International 112,879 4,672,062L3 Technologies 9,649 1,806,100Lockheed Martin 30,107 9,277,773Masco 39,239 1,562,497Northrop Grumman 20,812 6,150,570PACCAR 41,977 3,011,010Parker-Hannifin 15,985 2,919,021Pentair 20,907 1,473,107Quanta Services 17,396 b 656,351Raytheon 34,939 6,296,008Rockwell Automation 15,420 3,096,644Rockwell Collins 19,463 2,639,183Roper Technologies 12,319 3,180,396Snap-on 7,116 1,122,762Stanley Black & Decker 18,393 2,971,389Textron 32,307 1,703,871TransDigm Group 5,785 1,605,338United Rentals 10,160 b 1,437,437United Technologies 89,650 10,736,484W.W. Grainger 6,506 a 1,286,236Xylem 20,797 1,383,624 195,258,240Commercial & Professional Services - .6% Cintas 10,029 1,494,722Equifax 14,607 1,585,298IHS Markit 43,063 b 1,834,914Nielsen Holdings 40,147 a 1,488,249Republic Services 28,039 1,824,498Robert Half International 15,847 820,399Stericycle 10,155 b 719,482Verisk Analytics 18,891 b 1,606,680Waste Management 48,079 3,950,651 15,324,893

9
Description Shares Value ($)Common Stocks - 99.7% (continued)
Consumer Durables & Apparel - 1.1% D.R. Horton 42,037 1,858,456Garmin 13,508 a 764,688Hanesbrands 45,250 a 1,018,125Hasbro 13,329 1,234,132Leggett & Platt 16,944 800,773Lennar, Cl. A 24,483 1,362,969Mattel 40,988 a 578,751Michael Kors Holdings 18,304 b 893,418Mohawk Industries 7,779 b 2,036,231Newell Brands 57,916 2,361,814NIKE, Cl. B 158,423 8,711,681PulteGroup 33,502 1,012,765PVH 9,792 1,241,724Ralph Lauren 7,266 649,798Tapestry 33,954 1,390,416Under Armour, Cl. A 21,794 a,b 272,861Under Armour, Cl. C 21,958 a,b 253,176VF 39,127 2,725,196Whirlpool 9,085 1,489,304 30,656,278Consumer Services - 1.9% Carnival 49,171 3,264,463Chipotle Mexican Grill 3,036 a,b 825,488Darden Restaurants 14,419 1,186,251H&R Block 24,988 618,203Hilton Worldwide Holdings 24,638 1,780,835Marriott International, Cl. A 37,409 4,469,627McDonald's 97,495 16,272,890MGM Resorts International 61,801 1,937,461Norwegian Cruise Line Holdings 21,400 b 1,193,050Royal Caribbean Cruises 20,268 2,508,570Starbucks 174,318 9,559,599Wyndham Worldwide 12,673 1,354,110Wynn Resorts 9,430 1,390,831Yum! Brands 41,299 3,074,711 49,436,089Diversified Financials - 5.4% Affiliated Managers Group 6,623 1,235,190American Express 88,465 8,450,177Ameriprise Financial 18,111 2,835,096Bank of New York Mellon 123,774 6,368,172Berkshire Hathaway, Cl. B 231,116 b 43,204,825BlackRock 14,883 7,007,363

STATEMENT OF INVESTMENTS (continued)
10
Description Shares Value ($)Common Stocks - 99.7% (continued)
Diversified Financials - 5.4% (continued) Capital One Financial 57,265 5,278,688Cboe Global Markets 13,232 1,496,010Charles Schwab 143,737 6,445,167CME Group 40,875 5,606,824Discover Financial Services 45,766 3,044,812E*TRADE Financial 34,617 b 1,508,955Franklin Resources 41,380 1,743,339Goldman Sachs Group 43,379 10,518,540Intercontinental Exchange 70,958 4,690,324Invesco 48,607 1,739,645Leucadia National 40,672 1,029,002Moody's 20,274 2,887,220Morgan Stanley 171,742 8,587,100Nasdaq 13,785 1,001,480Navient 32,330 402,832Northern Trust 25,444 2,379,523Raymond James Financial 14,542 1,232,871S&P Global 30,760 4,813,017State Street 44,729 4,115,068Synchrony Financial 90,306 2,945,782T. Rowe Price Group 29,855 2,773,530 143,340,552Energy - 5.9% Anadarko Petroleum 66,531 3,284,635Andeavor 18,147 1,927,937Apache 44,920 1,858,340Baker Hughes 51,348 1,613,868Cabot Oil & Gas 56,390 1,562,003Chesapeake Energy 89,988 a,b 350,953Chevron 227,694 26,387,458Cimarex Energy 11,803 1,380,125Concho Resources 17,566 b 2,357,533ConocoPhillips 147,648 7,552,195Devon Energy 62,829 2,318,390EOG Resources 68,861 6,877,148EQT 21,390 a 1,337,731Exxon Mobil 509,474 42,464,658Halliburton 103,341 4,416,794Helmerich & Payne 12,689 a 689,140Hess 32,637 1,441,250Kinder Morgan 232,053 4,202,480Marathon Oil 103,904 1,477,515Marathon Petroleum 61,054 3,647,366

11
Description Shares Value ($)Common Stocks - 99.7% (continued)
Energy - 5.9% (continued) National Oilwell Varco 45,408 a 1,552,500Newfield Exploration 24,429 b 752,169Noble Energy 58,066 1,618,299Occidental Petroleum 91,178 5,887,363ONEOK 45,673 2,478,674Phillips 66 52,558 4,786,983Pioneer Natural Resources 20,435 3,058,506Range Resources 26,235 475,116Schlumberger 166,846 10,678,144TechnipFMC 53,171 1,456,354Valero Energy 53,673 4,234,263Williams Cos. 99,904 2,847,264 156,973,154Food & Staples Retailing - 1.7% Costco Wholesale 52,461 8,450,418CVS Health 122,683 8,407,466Kroger 110,084 2,278,739Sysco 58,618 3,260,333Walgreens Boots Alliance 110,073 7,294,538Wal-Mart Stores 176,249 15,388,300 45,079,794Food, Beverage & Tobacco - 4.5% Altria Group 230,932 14,830,453Archer-Daniels-Midland 67,843 2,772,743Brown-Forman, Cl. B 23,112 1,317,846Campbell Soup 24,159 1,144,412Coca-Cola 462,893 21,283,820Conagra Brands 50,523 1,725,866Constellation Brands, Cl. A 20,661 4,526,618Dr Pepper Snapple Group 21,944 1,879,723General Mills 69,060 3,585,595Hershey 16,457 1,747,404Hormel Foods 33,377 a 1,040,027J.M. Smucker 13,851 1,468,899Kellogg 29,836 a 1,865,645Kraft Heinz 72,107 5,576,034McCormick & Co. 14,197 1,413,027Molson Coors Brewing, Cl. B 22,233 1,797,983Mondelez International, Cl. A 182,477 7,560,022Monster Beverage 48,526 b 2,811,111PepsiCo 171,675 18,923,735Philip Morris International 186,653 19,531,370
STATEMENT OF INVESTMENTS (continued)
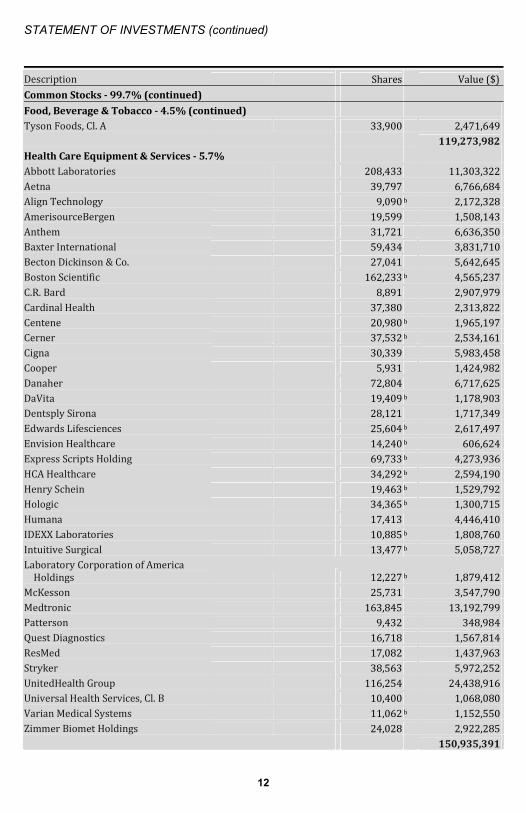
12
Description Shares Value ($)Common Stocks - 99.7% (continued)
Food, Beverage & Tobacco - 4.5% (continued) Tyson Foods, Cl. A 33,900 2,471,649 119,273,982Health Care Equipment & Services - 5.7% Abbott Laboratories 208,433 11,303,322Aetna 39,797 6,766,684Align Technology 9,090 b 2,172,328AmerisourceBergen 19,599 1,508,143Anthem 31,721 6,636,350Baxter International 59,434 3,831,710Becton Dickinson & Co. 27,041 5,642,645Boston Scientific 162,233 b 4,565,237C.R. Bard 8,891 2,907,979Cardinal Health 37,380 2,313,822Centene 20,980 b 1,965,197Cerner 37,532 b 2,534,161Cigna 30,339 5,983,458Cooper 5,931 1,424,982Danaher 72,804 6,717,625DaVita 19,409 b 1,178,903Dentsply Sirona 28,121 1,717,349Edwards Lifesciences 25,604 b 2,617,497Envision Healthcare 14,240 b 606,624Express Scripts Holding 69,733 b 4,273,936HCA Healthcare 34,292 b 2,594,190Henry Schein 19,463 b 1,529,792Hologic 34,365 b 1,300,715Humana 17,413 4,446,410IDEXX Laboratories 10,885 b 1,808,760Intuitive Surgical 13,477 b 5,058,727Laboratory Corporation of America Holdings 12,227 b 1,879,412McKesson 25,731 3,547,790Medtronic 163,845 13,192,799Patterson 9,432 348,984Quest Diagnostics 16,718 1,567,814ResMed 17,082 1,437,963Stryker 38,563 5,972,252UnitedHealth Group 116,254 24,438,916Universal Health Services, Cl. B 10,400 1,068,080Varian Medical Systems 11,062 b 1,152,550Zimmer Biomet Holdings 24,028 2,922,285 150,935,391

13
Description Shares Value ($)Common Stocks - 99.7% (continued)
Household & Personal Products - 1.7% Church & Dwight 29,796 1,345,885Clorox 15,353 1,942,615Colgate-Palmolive 105,470 7,430,361Coty, Cl. A 57,480 885,192Estee Lauder, Cl. A 26,411 2,953,014Kimberly-Clark 42,441 4,775,037Procter & Gamble 307,423 26,542,902 45,875,006Insurance - 2.8% Aflac 47,756 4,006,251Allstate 43,425 4,075,870American International Group 108,321 6,998,620Aon 30,656 4,396,990Arthur J. Gallagher & Co. 21,901 1,386,990Assurant 7,042 708,777Brighthouse Financial 11,813 734,532Chubb 56,312 8,492,976Cincinnati Financial 18,061 1,267,340Everest Re Group 4,939 1,172,766Hartford Financial Services Group 44,253 2,436,128Lincoln National 27,547 2,087,512Loews 33,046 1,636,107Marsh & McLennan Cos. 61,350 4,965,055MetLife 128,046 6,860,705Principal Financial Group 32,732 2,155,402Progressive 69,214 3,367,261Prudential Financial 51,873 5,729,892Torchmark 13,198 1,110,348Travelers 33,298 4,410,320Unum Group 27,425 1,427,197Willis Towers Watson 16,064 2,587,589XL Group 31,798 1,286,865 73,301,493Materials - 3.0% Air Products & Chemicals 26,091 4,159,688Albemarle 13,349 1,880,741Avery Dennison 11,194 1,188,467Ball 43,300 1,858,869CF Industries Holdings 29,364 1,115,245DowDuPont 279,094 20,181,287Eastman Chemical 17,334 1,574,101Ecolab 31,581 4,126,373FMC 15,643 1,452,609

STATEMENT OF INVESTMENTS (continued)
14
Description Shares Value ($)Common Stocks - 99.7% (continued)
Materials - 3.0% (continued) Freeport-McMoRan 160,768 b 2,247,537International Flavors & Fragrances 9,183 1,353,758International Paper 49,205 2,817,970LyondellBasell Industries, Cl. A 39,150 4,053,199Martin Marietta Materials 7,623 1,653,048Monsanto 52,315 6,335,346Mosaic 43,566 973,264Newmont Mining 65,266 2,360,019Nucor 38,246 2,211,766Packaging Corporation of America 11,342 1,318,734PPG Industries 31,407 3,650,750Praxair 33,922 4,956,683Sealed Air 22,733 1,005,481Sherwin-Williams 9,860 3,896,179Vulcan Materials 15,834 1,927,790WestRock 30,213 1,852,963 80,151,867Media - 2.7% CBS, Cl. B 43,956 2,466,811Charter Communications, Cl. A 24,274 b 8,111,643Comcast, Cl. A 566,145 20,398,204Discovery Communications, Cl. A 19,678 a,b 371,521Discovery Communications, Cl. C 24,548 b 437,200DISH Network, Cl. A 27,461 b 1,332,957Interpublic Group of Companies 48,888 941,094News Corp., Cl. A 46,732 638,359News Corp., Cl. B 12,486 173,555Omnicom Group 28,279 1,900,066Scripps Networks Interactive, Cl. A 11,094 923,908Time Warner 93,455 9,185,692Twenty-First Century Fox, Cl. A 128,010 3,347,462Twenty-First Century Fox, Cl. B 53,521 1,362,109Viacom, Cl. B 40,954 984,125Walt Disney 184,979 18,092,796 70,667,502Pharmaceuticals, Biotechnology & Life Sciences - 8.3% AbbVie 191,649 17,296,322Agilent Technologies 38,042 2,587,997Alexion Pharmaceuticals 26,684 b 3,193,007Allergan 40,076 7,102,669Amgen 88,165 15,448,271Biogen 25,468 b 7,937,357Bristol-Myers Squibb 198,321 12,228,473

15
Description Shares Value ($)Common Stocks - 99.7% (continued)
Pharmaceuticals, Biotechnology & Life Sciences - 8.3% (continued) Celgene 93,800 b 9,470,986Eli Lilly & Co. 116,094 9,512,742Gilead Sciences 156,314 11,717,297Illumina 17,336 b 3,557,174Incyte 20,519 b 2,323,777Johnson & Johnson 322,986 45,027,478Merck & Co. 328,897 18,118,936Mettler-Toledo International 3,101 b 2,116,836Mylan 63,379 b 2,263,264PerkinElmer 14,154 1,023,617Perrigo 16,053 a 1,300,132Pfizer 717,104 25,141,666Quintiles IMS Holdings 18,036 b 1,949,692Regeneron Pharmaceuticals 9,083 b 3,656,997Thermo Fisher Scientific 47,974 9,298,800Vertex Pharmaceuticals 30,069 b 4,396,990Waters 9,357 b 1,834,440Zoetis 59,327 3,786,249 222,291,169
Real Estate - 2.9% Alexandria Real Estate Equities 11,092 c 1,374,964American Tower 51,458 c 7,392,971Apartment Investment & Management, Cl. A 17,797 c 782,712AvalonBay Communities 16,736 c 3,034,739Boston Properties 18,216 c 2,207,415CBRE Group, Cl. A 35,189 b,c 1,383,631Crown Castle International 48,390 c 5,181,601Digital Realty Trust 24,022 c 2,845,166Duke Realty 42,761 c 1,217,833Equinix 9,452 c 4,381,002Equity Residential 44,200 c 2,972,892Essex Property Trust 8,051 c 2,112,824Extra Space Storage 15,118 c 1,233,478Federal Realty Investment Trust 8,491 c 1,023,335GGP 71,314 c 1,387,770HCP 54,892 c 1,418,409Host Hotels & Resorts 87,848 c 1,718,307Iron Mountain 29,679 c 1,187,160Kimco Realty 51,937 c 943,176Macerich 13,199 a,c 720,665Mid-America Apartment Communities 13,812 c 1,413,658

STATEMENT OF INVESTMENTS (continued)
16
Description Shares Value ($)Common Stocks - 99.7% (continued)
Real Estate - 2.9% (continued) Prologis 62,879 c 4,060,726Public Storage 17,981 c 3,726,562Realty Income 31,798 c 1,706,599Regency Centers 17,699 c 1,089,373SBA Communications 14,574 b,c 2,290,741Simon Property Group 37,612 c 5,842,272SL Green Realty 12,154 c 1,162,895UDR 32,056 c 1,243,452Ventas 42,185 c 2,647,109Vornado Realty Trust 20,793 c 1,556,564Welltower 44,180 c 2,958,293Weyerhaeuser 89,679 c 3,220,373 77,438,667Retailing - 5.5% Advance Auto Parts 9,080 742,199Amazon.com 47,933 b 52,979,386AutoZone 3,373 b 1,988,384Best Buy 32,397 1,813,584CarMax 22,553 b 1,693,730Dollar General 31,025 2,508,061Dollar Tree 28,703 b 2,619,149Expedia 14,970 1,866,160Foot Locker 15,366 462,209Gap 25,199 654,922Genuine Parts 17,985 1,586,817Home Depot 142,010 23,542,418Kohl's 20,809 a 868,984L Brands 28,655 a 1,233,311LKQ 37,811 b 1,425,097Lowe's 101,742 8,134,273Macy's 38,470 721,697Netflix 51,879 b 10,190,592Nordstrom 13,673 a 542,134O'Reilly Automotive 10,865 b 2,291,972Priceline Group 5,881 b 11,244,237Ross Stores 46,949 2,980,792Signet Jewelers 7,324 a 480,235Target 66,177 3,907,090The TJX Companies 77,503 5,409,709Tiffany & Co. 12,382 1,159,203Tractor Supply 16,134 972,235TripAdvisor 14,316 a,b 536,850

17
Description Shares Value ($)Common Stocks - 99.7% (continued)
Retailing - 5.5% (continued) Ulta Beauty 6,993 b 1,411,117 145,966,547Semiconductors & Semiconductor Equipment - 4.0% Advanced Micro Devices 95,471 a,b 1,048,749Analog Devices 43,970 4,014,461Applied Materials 128,774 7,266,717Broadcom 48,805 12,880,128Intel 566,397 25,765,400KLA-Tencor 19,259 2,097,113Lam Research 19,908 4,152,212Microchip Technology 27,505 a 2,607,474Micron Technology 133,090 b 5,897,218NVIDIA 72,101 14,911,208Qorvo 16,041 a,b 1,216,068QUALCOMM 176,603 9,008,519Skyworks Solutions 22,082 2,514,257Texas Instruments 119,555 11,559,773Xilinx 30,151 2,221,827 107,161,124Software & Services - 14.5% Accenture, Cl. A 74,439 10,597,136Activision Blizzard 90,030 5,896,064Adobe Systems 59,220 b 10,372,975Akamai Technologies 20,517 b 1,072,013Alliance Data Systems 5,876 1,314,637Alphabet, Cl. A 35,767 b 36,948,742Alphabet, Cl. C 36,264 b 36,867,433ANSYS 10,282 b 1,405,652Autodesk 26,013 b 3,250,584Automatic Data Processing 53,547 6,225,374CA 38,098 1,233,613Cadence Design Systems 33,706 b 1,454,751Citrix Systems 17,342 b 1,432,623Cognizant Technology Solutions, Cl. A 70,992 5,371,965CSRA 19,142 612,353DXC Technology 34,410 3,149,203eBay 120,396 b 4,531,705Electronic Arts 37,398 b 4,472,801Facebook, Cl. A 285,042 b 51,324,663Fidelity National Information Services 39,883 3,699,547Fiserv 25,441 b 3,292,829Gartner 10,945 b 1,371,518Global Payments 17,768 1,846,984

STATEMENT OF INVESTMENTS (continued)
18
Description Shares Value ($)Common Stocks - 99.7% (continued)
Software & Services - 14.5% (continued) International Business Machines 104,098 16,037,338Intuit 29,491 4,453,731MasterCard, Cl. A 112,770 16,776,793Microsoft 926,707 77,083,488Oracle 363,008 18,477,107Paychex 37,680 2,403,607PayPal Holdings 135,748 b 9,849,875Red Hat 21,349 b 2,579,600salesforce.com 81,928 b 8,384,512Symantec 73,418 2,386,085Synopsys 18,132 b 1,568,781Total System Services 19,042 1,371,976VeriSign 10,837 a,b 1,165,194Visa, Cl. A 220,301 a 24,228,704Western Union 58,479 1,161,393 385,673,349Technology Hardware & Equipment - 5.9% Amphenol, Cl. A 36,399 3,166,713Apple 621,548 105,066,474Cisco Systems 599,786 20,482,692Corning 109,074 3,415,107F5 Networks 7,700 b 933,779FLIR Systems 16,913 791,867Harris 14,472 2,016,239Hewlett Packard Enterprise 200,650 2,793,048HP 201,383 4,339,804Juniper Networks 47,463 1,178,506Motorola Solutions 19,310 1,748,327NetApp 32,526 1,444,805Seagate Technology 34,555 a 1,277,498TE Connectivity 42,800 3,893,516Western Digital 34,898 3,115,344Xerox 26,896 815,218 156,478,937Telecommunication Services - 1.9% AT&T 738,916 24,864,523CenturyLink 117,753 a 2,236,129Verizon Communications 490,277 23,469,560 50,570,212Transportation - 2.1% Alaska Air Group 15,259 1,007,552American Airlines Group 52,817 2,472,892C.H. Robinson Worldwide 17,299 a 1,358,490

19
Description Shares Value ($)Common Stocks - 99.7% (continued)
Transportation - 2.1% (continued) CSX 110,506 5,572,818Delta Air Lines 80,890 4,046,927Expeditors International of Washington 21,254 1,240,809FedEx 29,641 6,693,234J.B. Hunt Transport Services 10,211 1,086,348Kansas City Southern 12,934 1,347,981Norfolk Southern 34,585 4,545,161Southwest Airlines 66,895 3,602,965Union Pacific 96,384 11,160,303United Continental Holdings 31,373 b 1,834,693United Parcel Service, Cl. B 82,378 9,681,886 55,652,059Utilities - 3.1% AES 75,560 803,203Alliant Energy 28,162 1,218,288Ameren 30,088 1,865,155American Electric Power 59,144 4,400,905American Water Works 22,069 1,936,775CenterPoint Energy 50,234 1,485,922CMS Energy 34,182 1,653,383Consolidated Edison 37,143 3,196,155Dominion Energy 77,037 6,250,782DTE Energy 21,213 2,343,188Duke Energy 84,154 7,431,640Edison International 39,085 3,124,846Entergy 21,496 1,854,245Eversource Energy 38,061 2,384,141Exelon 115,008 4,624,472FirstEnergy 51,592 1,699,956NextEra Energy 55,836 8,658,489NiSource 40,468 1,067,141NRG Energy 35,685 892,125PG&E 60,671 3,504,964Pinnacle West Capital 12,885 1,130,143PPL 83,135 3,122,551Public Service Enterprise Group 61,525 3,027,030SCANA 17,713 764,139Sempra Energy 30,034 3,528,995

STATEMENT OF INVESTMENTS (continued)
20
Description Shares Value ($)Common Stocks - 99.7% (continued)
Utilities - 3.1% (continued) Southern 119,488 6,237,274WEC Energy Group 37,336 2,516,073Xcel Energy 60,012 2,971,794 83,693,774Total Common Stocks (cost $816,396,804) 2,654,027,180
Principal Amount ($)Short-Term Investments - .0%
U.S. Treasury Bills 1.02%, 12/7/17 (cost $724,263) 725,000 d 724,290 Other Investment - .5%
Registered Investment Company; Dreyfus Institutional Preferred Government Plus Money Market Fund(cost $12,605,928) 12,605,928 e 12,605,928 Investment of Cash Collateral for Securities Loaned - .5%
Registered Investment Company; Dreyfus Institutional Preferred Government Money Market Fund, Institutional Shares (cost $11,760,856) 11,760,856 e 11,760,856
Total Investments (cost $841,487,851) 100.7% 2,679,118,254Liabilities, Less Cash and Receivables (.7%) (17,836,569)Net Assets 100.0% 2,661,281,685
a Security, or portion thereof, on loan. At October 31, 2017, the value of the fund’s securities on loan was $53,283,232 and the value
of the collateral held by the fund was $54,581,317, consisting of cash collateral of $11,760,856 and U.S. Government & Agency securities valued at $42,820,461.
b Non-income producing security. c Investment in real estate investment trust. d Held by a counterparty for open futures contracts. e Investment in affiliated money market mutual fund.

21
Portfolio Summary (Unaudited) † Value (%)Software & Services 14.5Pharmaceuticals, Biotechnology & Life Sciences 8.3Capital Goods 7.3Banks 6.5Energy 5.9Technology Hardware & Equipment 5.9Health Care Equipment & Services 5.7Retailing 5.5Diversified Financials 5.4Food, Beverage & Tobacco 4.5Semiconductors & Semiconductor Equipment 4.0Utilities 3.1Materials 3.0Real Estate 2.9Insurance 2.8Media 2.7Transportation 2.1Telecommunication Services 1.9Consumer Services 1.9Household & Personal Products 1.7Food & Staples Retailing 1.7Consumer Durables & Apparel 1.1Short-Term/Money Market Investments 1.0Automobiles & Components .7Commercial & Professional Services .6 100.7
† Based on net assets. See notes to financial statements.

STATEMENT OF INVESTMENTS IN AFFILIATED ISSUERS
22
Registered Investment Companies Value 10/31/16 ($) Purchases ($) Sales ($) Value 10/31/17 ($) NetAssets (%) Dividends/ Distributions ($) Dreyfus Institutional Preferred Government Money Market Fund, Institutional Shares 7,299,157 202,704,407 198,242,708 11,760,856 .5 – Dreyfus Institutional Preferred Government Plus Money Market Fund 29,140,371 345,225,209 361,759,652 12,605,928 .5 108,076 Total 36,439,528 547,929,616 560,002,360 24,366,784 1.0 108,076 See notes to financial statements.

STATEMENT OF FUTURES October 31, 2017
23
Description Number ofContracts Expiration Notional Value ($) Value ($) Unrealized Appreciation ($)Futures Long Standard & Poor's 500 E-mini 114 12/2017 14,567,233 14,664,390 97,157Gross Unrealized Appreciation 97,157
See notes to financial statements.

STATEMENT OF ASSETS AND LIABILITIES October 31, 2017
24
Cost Value
Assets ($): Investments in securities—See Statement of Investments (including securities on loan, valued at $53,283,232)—Note 1(b): Unaffiliated issuers 817,121,067 2,654,751,470 Affiliated issuers 24,366,784 24,366,784 Cash 533,870 Dividends and securities lending income receivable 2,247,755 Receivable for shares of Common Stock subscribed 159,731 Receivable for futures variation margin—Note 4 28,778 Other assets 55,450 2,682,143,838 Liabilities ($): Due to The Dreyfus Corporation and affiliates—Note 3(b) 1,116,413 Liability for securities on loan—Note 1(b) 11,760,856 Payable for shares of Common Stock redeemed 7,978,664 Interest payable—Note 2 220 Accrued expenses 6,000 20,862,153 Net Assets ($) 2,661,281,685 Composition of Net Assets ($): Paid-in capital 637,895,833 Accumulated undistributed investment income—net 31,980,484 Accumulated net realized gain (loss) on investments 153,677,808 Accumulated net unrealized appreciation (depreciation) on investments (including $97,157 net unrealized appreciation on futures) 1,837,727,560 Net Assets ($) 2,661,281,685 Shares Outstanding (200 million shares of $.001 par value Common Stock authorized) 46,968,646 Net Asset Value Per Share ($) 56.66 See notes to financial statements.

STATEMENT OF OPERATIONS Year Ended October 31, 2017
25
Investment Income ($): Income: Cash dividends: Unaffiliated issuers 53,078,789 Affiliated issuers 108,076 Income from securities lending—Note 1(b) 107,161 Interest 7,861 Total Income 53,301,887 Expenses: Management fee—Note 3(a) 6,584,888 Shareholder servicing costs—Note 3(b) 6,584,888 Directors’ fees—Note 3(a,c) 214,237 Loan commitment fees—Note 2 58,800 Interest expense—Note 2 1,161 Total Expenses 13,443,974 Less—Directors’ fees reimbursed by Dreyfus—Note 3(a) (214,237) Net Expenses 13,229,737 Investment Income—Net 40,072,150 Realized and Unrealized Gain (Loss) on Investments—Note 4 ($): Net realized gain (loss) on investments 187,996,432 Net realized gain (loss) on futures 4,186,545 Net Realized Gain (Loss) 192,182,977 Net unrealized appreciation (depreciation) on investments 309,127,782 Net unrealized appreciation (depreciation) on futures 474,192 Net Unrealized Appreciation (Depreciation) 309,601,974 Net Realized and Unrealized Gain (Loss) on Investments 501,784,951 Net Increase in Net Assets Resulting from Operations 541,857,101 See notes to financial statements.

STATEMENT OF CHANGES IN NET ASSETS
26
Year Ended October 31, 2017 2016
Operations ($): Investment income—net 40,072,150 43,471,415 Net realized gain (loss) on investments 192,182,977 216,335,827 Net unrealized appreciation (depreciation) on investments 309,601,974 (160,662,819) Net Increase (Decrease) in Net Assets Resulting from Operations 541,857,101 99,144,423 Distributions to Shareholders from ($): Investment income—net (43,501,163) (44,703,136) Net realized gain on investments (211,029,813) (150,090,899) Total Distributions (254,530,976) (194,794,035) Capital Stock Transactions ($): Net proceeds from shares sold 414,809,180 484,041,087 Distributions reinvested 249,887,372 191,696,924 Cost of shares redeemed (769,466,150) (872,598,053) Increase (Decrease) in Net Assets from Capital Stock Transactions (104,769,598) (196,860,042) Total Increase (Decrease) in Net Assets 182,556,527 (292,509,654) Net Assets ($): Beginning of Period 2,478,725,158 2,771,234,812 End of Period 2,661,281,685 2,478,725,158 Undistributed investment income—net 31,980,484 34,422,230 Capital Share Transactions (Shares): Shares sold 7,917,756 9,761,306 Shares issued for distributions reinvested 5,108,846 3,891,683 Shares redeemed (14,622,407) (17,490,556) Net Increase (Decrease) in Shares Outstanding (1,595,805) (3,837,567) See notes to financial statements.

FINANCIAL HIGHLIGHTS
27
The following table describes the performance for the fiscal periods indicated. Total return shows how much your investment in the fund would have increased (or decreased) during each period, assuming you had reinvested all dividends and distributions. These figures have been derived from the fund’s financial statements.
Year Ended October 31, 2017 2016 2015 2014 2013 Per Share Data ($): Net asset value, beginning of period 51.04 52.88 54.00 47.94 39.13 Investment Operations: Investment income—neta .80 .84 .83 .77 .75 Net realized and unrealized gain (loss) on investments 10.12 1.11 1.68 7.05 9.32 Total from Investment Operations 10.92 1.95 2.51 7.82 10.07 Distributions: Dividends from investment income—net (.91) (.87) (.83) (.74) (.71)Dividends from net realized gain on investments (4.39) (2.92) (2.80) (1.02) (.55)Total Distributions (5.30) (3.79) (3.63) (1.76) (1.26)Net asset value, end of period 56.66 51.04 52.88 54.00 47.94 Total Return (%) 23.03 3.95 4.70 16.71 26.56 Ratios/Supplemental Data (%): Ratio of total expenses to average net assets .51 .51 .51 .51 .51 Ratio of net expenses to average net assets .50 .50 .50 .50 .50 Ratio of net investment income to average net assets 1.52 1.68 1.59 1.54 1.75 Portfolio Turnover Rate 2.88 4.25 3.72 3.56 2.92 Net Assets, end of period ($ x 1,000) 2,661,282 2,478,725 2,771,235 2,894,071 2,755,400
a Based on average shares outstanding. See notes to financial statements.

NOTES TO FINANCIAL STATEMENTS
28
NOTE 1—Significant Accounting Policies:
Dreyfus S&P 500 Index Fund (the “fund”) is a separate non-diversified series of Dreyfus Index Funds, Inc. (the “Company”), which is registered under the Investment Company Act of 1940, as amended (the “Act”), as an open-end management investment company and operates as a series company currently offering three series, including the fund. The fund’s investment objective is to seek to match the performance of the S&P 500® Composite Stock Price Index. The Dreyfus Corporation (the “Manager” or “Dreyfus”), a wholly-owned subsidiary of The Bank of New York Mellon Corporation (“BNY Mellon”), serves as the fund’s investment adviser. MBSC Securities Corporation (the “Distributor”), a wholly-owned subsidiary of Dreyfus, is the distributor of the fund’s shares, which are sold to the public without a sales charge.
The Company accounts separately for the assets, liabilities and operations of each series. Expenses directly attributable to each series are charged to that series’ operations; expenses which are applicable to all series are allocated among them on a pro rata basis.
The Financial Accounting Standards Board (“FASB”) Accounting Standards Codification is the exclusive reference of authoritative U.S. generally accepted accounting principles (“GAAP”) recognized by the FASB to be applied by nongovernmental entities. Rules and interpretive releases of the Securities and Exchange Commission (“SEC”) under authority of federal laws are also sources of authoritative GAAP for SEC registrants. The fund’s financial statements are prepared in accordance with GAAP, which may require the use of management estimates and assumptions. Actual results could differ from those estimates.
The Company enters into contracts that contain a variety of indemnifications. The fund’s maximum exposure under these arrangements is unknown. The fund does not anticipate recognizing any loss related to these arrangements.
(a) Portfolio valuation: The fair value of a financial instrument is the amount that would be received to sell an asset or paid to transfer a liability in an orderly transaction between market participants at the measurement date (i.e., the exit price). GAAP establishes a fair value hierarchy that prioritizes the inputs of valuation techniques used to measure fair value. This hierarchy gives the highest priority to unadjusted quoted prices in active markets for identical assets or liabilities (Level 1 measurements) and the lowest priority to unobservable inputs (Level 3 measurements).

29
Additionally, GAAP provides guidance on determining whether the volume and activity in a market has decreased significantly and whether such a decrease in activity results in transactions that are not orderly. GAAP requires enhanced disclosures around valuation inputs and techniques used during annual and interim periods.
Various inputs are used in determining the value of the fund’s investments relating to fair value measurements. These inputs are summarized in the three broad levels listed below:
Level 1—unadjusted quoted prices in active markets for identical investments.
Level 2—other significant observable inputs (including quoted prices for similar investments, interest rates, prepayment speeds, credit risk, etc.).
Level 3—significant unobservable inputs (including the fund’s own assumptions in determining the fair value of investments).
The inputs or methodology used for valuing securities are not necessarily an indication of the risk associated with investing in those securities.
Changes in valuation techniques may result in transfers in or out of an assigned level within the disclosure hierarchy. Valuation techniques used to value the fund’s investments are as follows:
Investments in securities are valued at the last sales price on the securities exchange or national securities market on which such securities are primarily traded. Securities listed on the National Market System for which market quotations are available are valued at the official closing price or, if there is no official closing price that day, at the last sales price. For open short positions, asked prices are used for valuation purposes. Bid price is used when no asked price is available. Registered investment companies that are not traded on an exchange are valued at their net asset value. All of the preceding securities are generally categorized within Level 1 of the fair value hierarchy.
Securities not listed on an exchange or the national securities market, or securities for which there were no transactions, are valued at the average of the most recent bid and asked prices. U.S. Treasury Bills are valued at the mean price between quoted bid prices and asked prices by an independent pricing service (the “Service”) approved by the Company’s Board of Directors (the “Board”). These securities are generally categorized within Level 2 of the fair value hierarchy.
The Service is engaged under the general supervision of the Board.

NOTES TO FINANCIAL STATEMENTS (continued)
30
Fair valuing of securities may be determined with the assistance of a pricing service using calculations based on indices of domestic securities and other appropriate indicators, such as prices of relevant American Depository Receipts and futures. Utilizing these techniques may result in transfers between Level 1 and Level 2 of the fair value hierarchy.
When market quotations or official closing prices are not readily available, or are determined to not accurately reflect fair value, such as when the value of a security has been significantly affected by events after the close of the exchange or market on which the security is principally traded (for example, a foreign exchange or market), but before the fund calculates its net asset value, the fund may value these investments at fair value as determined in accordance with the procedures approved by the Board. Certain factors may be considered when fair valuing investments such as: fundamental analytical data, the nature and duration of restrictions on disposition, an evaluation of the forces that influence the market in which the securities are purchased and sold, and public trading in similar securities of the issuer or comparable issuers. These securities are either categorized within Level 2 or 3 of the fair value hierarchy depending on the relevant inputs used.
For restricted securities where observable inputs are limited, assumptions about market activity and risk are used and are generally categorized within Level 3 of the fair value hierarchy.
Futures, which are traded on an exchange, are valued at the last sales price on the securities exchange on which such securities are primarily traded or at the last sales price on the national securities market on each business day and are generally categorized within Level 1 of the fair value hierarchy.
The following is a summary of the inputs used as of October 31, 2017 in valuing the fund’s investments:
Level 1 -Unadjusted Quoted PricesLevel 2 - Other Significant Observable Inputs
Level 3 -Significant Unobservable Inputs TotalAssets ($) Investments in Securities: Equity Securities—Domestic Common Stocks† 2,633,894,542 - - 2,633,894,542

31
Level 1 -Unadjusted Quoted PricesLevel 2 - Other Significant Observable Inputs
Level 3 -Significant Unobservable Inputs TotalAssets ($) (continued) Equity Securities—Foreign Common Stocks† 20,132,638 - - 20,132,638Registered Investment Companies 24,366,784 - - 24,366,784U.S. Treasury - 724,290 - 724,290Other Financial Instruments: Futures†† 97,157 - - 97,157† See Statement of Investments for additional detailed categorizations. †† Amount shown represents unrealized appreciation at period end.
At October 31, 2017, there were no transfers between levels of the fair value hierarchy. It is the fund’s policy to recognize transfers between levels at the end of the reporting period.
(b) Securities transactions and investment income: Securities transactions are recorded on a trade date basis. Realized gains and losses from securities transactions are recorded on the identified cost basis. Dividend income is recognized on the ex-dividend date and interest income, including, where applicable, accretion of discount and amortization of premium on investments, is recognized on the accrual basis.
Pursuant to a securities lending agreement with The Bank of New York Mellon, a subsidiary of BNY Mellon and an affiliate of Dreyfus, the fund may lend securities to qualified institutions. It is the fund’s policy that, at origination, all loans are secured by collateral of at least 102% of the value of U.S. securities loaned and 105% of the value of foreign securities loaned. Collateral equivalent to at least 100% of the market value of securities on loan is maintained at all times. Collateral is either in the form of cash, which can be invested in certain money market mutual funds managed by Dreyfus, or U.S. Government and Agency securities. The fund is entitled to receive all dividends, interest and distributions on securities loaned, in addition to income earned as a result of the lending transaction. Should a borrower fail to return the securities in a timely manner, The Bank of New York Mellon is required to replace the securities for the benefit of the fund or credit the fund with the market value of the

NOTES TO FINANCIAL STATEMENTS (continued)
32
unreturned securities and is subrogated to the fund’s rights against the borrower and the collateral. Additionally, the contractual maturity of security lending transactions are on an overnight and continuous basis. During the period ended October 31, 2017, The Bank of New York Mellon earned $21,101 from lending portfolio securities, pursuant to the securities lending agreement.
(c) Affiliated issuers: Investments in other investment companies advised by Dreyfus are defined as “affiliated” under the Act.
(d) Dividends and distributions to shareholders: Dividends and distributions are recorded on the ex-dividend date. Dividends from investment income-net and dividends from net realized capital gains, if any, are normally declared and paid annually, but the fund may make distributions on a more frequent basis to comply with the distribution requirements of the Internal Revenue Code of 1986, as amended (the “Code”). To the extent that net realized capital gains can be offset by capital loss carryovers, it is the policy of the fund not to distribute such gains. Income and capital gain distributions are determined in accordance with income tax regulations, which may differ from GAAP.
(e) Federal income taxes: It is the policy of the fund to continue to qualify as a regulated investment company, if such qualification is in the best interests of its shareholders, by complying with the applicable provisions of the Code, and to make distributions of taxable income sufficient to relieve it from substantially all federal income and excise taxes.
As of and during the period ended October 31, 2017, the fund did not have any liabilities for any uncertain tax positions. The fund recognizes interest and penalties, if any, related to uncertain tax positions as income tax expense in the Statement of Operations. During the period ended October 31, 2017, the fund did not incur any interest or penalties.
Each tax year in the four-year period ended October 31, 2017 remains subject to examination by the Internal Revenue Service and state taxing authorities.
At October 31, 2017, the components of accumulated earnings on a tax basis were as follows: undistributed ordinary income $34,755,397, undistributed capital gains $186,873,405 and unrealized appreciation $1,801,757,050.
The tax character of distributions paid to shareholders during the fiscal periods ended October 31, 2017 and October 31, 2016 were as follows: ordinary income $45,178,724 and $47,619,236, and long-term capital gains $209,352,252 and $147,174,799, respectively.

33
During the period ended October 31, 2017, as a result of permanent book to tax differences, primarily due to prior year corporate actions, the fund increased accumulated undistributed investment income-net by $987,267 and decreased accumulated net realized gain (loss) on investments by the same amount. Net assets and net asset value per share were not affected by this reclassification.
NOTE 2—Bank Lines of Credit:
The fund participates with other Dreyfus-managed funds in an $830 million unsecured credit facility led by Citibank, N.A. and a $300 million unsecured credit facility provided by The Bank of New York Mellon (each, a “Facility”), each to be utilized primarily for temporary or emergency purposes, including the financing of redemptions. Prior to October 4, 2017, the unsecured credit facility with Citibank, N.A. was $810 million. In connection therewith, the fund has agreed to pay its pro rata portion of commitment fees for each Facility. Interest is charged to the fund based on rates determined pursuant to the terms of the respective Facility at the time of borrowing.
The average amount of borrowings outstanding under the Facilities during the period ended October 31, 2017 was approximately $58,900 with a related weighted average annualized interest rate of 1.97%.
NOTE 3—Management Fee and Other Transactions with Affiliates:
(a) Pursuant to a management agreement (the “Agreement”) with Dreyfus, the management fee is computed at the annual rate of .25% of the value of the fund’s average daily net assets and is payable monthly. Out of its fee, Dreyfus pays all of the expenses of the fund except management fees, Shareholder Services Plan fees, brokerage fees and commissions, taxes, interest expense, commitment fees on borrowings, fees and expenses of interested Directors (including counsel fees) and extraordinary expenses. In addition, Dreyfus is required to reduce its fee in an amount equal to the fund’s allocable portion of fees and expenses of the non-interested Directors (including counsel fees). During the period ended October 31, 2017, fees reimbursed by Dreyfus amounted to $214,237.
(b) Under the Shareholder Services Plan, the fund pays the Distributor for the provision of certain services, at an annual rate of .25% of the value of the fund’s average daily net assets. The services provided may include personal services relating to shareholder accounts, such as answering shareholder inquiries regarding the fund and providing reports and other information, and services related to the maintenance of shareholder accounts such as recordkeeping and sub-accounting services. The

NOTES TO FINANCIAL STATEMENTS (continued)
34
Distributor may make payments to Service Agents (securities dealers, financial institutions or other industry professionals) with respect to these services. The Distributor determines the amounts to be paid to Service Agents. During the period ended October 31, 2017, the fund was charged $6,584,888 pursuant to the Shareholder Services Plan. The components of “Due to The Dreyfus Corporation and affiliates” in the Statement of Assets and Liabilities consist of: management fees $566,672 and Shareholder Services Plan fees $566,672, which are offset against an expense reimbursement currently in effect in the amount of $16,931.
(c) Each Board member also serves as a Board member of other funds within the Dreyfus complex. Annual retainer fees and attendance fees are allocated to each fund based on net assets.
NOTE 4—Securities Transactions:
The aggregate amount of purchases and sales of investment securities, excluding short-term securities and futures, during the period ended October 31, 2017, amounted to $74,861,206 and $362,876,477, respectively.
Derivatives: A derivative is a financial instrument whose performance is derived from the performance of another asset. Each type of derivative instrument that was held by the fund during the period ended October 31, 2017 is discussed below.
Futures: In the normal course of pursuing its investment objective, the fund is exposed to market risk, including equity price risk, as a result of changes in value of underlying financial instruments. The fund invests in futures in order to manage its exposure to or protect against changes in the market. A futures contract represents a commitment for the future purchase or a sale of an asset at a specified date. Upon entering into such contracts, these investments require initial margin deposits with a counterparty, which consist of cash or cash equivalents. The amount of these deposits is determined by the exchange or Board of Trade on which the contract is traded and is subject to change. Accordingly, variation margin payments are received or made to reflect daily unrealized gains or losses which are recorded in the Statement of Operations. When the contracts are closed, the fund recognizes a realized gain or loss which is reflected in the Statement of Operations. There is minimal counterparty credit risk to the fund with futures since they are exchange traded, and the exchange guarantees the futures against default. Futures open at October 31, 2017 are set forth in the Statement of Futures.

35
The following summarizes the average market value of derivatives outstanding during the period ended October 31, 2017: Average Market Value ($)Equity futures 24,885,923
At October 31, 2017, the cost of investments for federal income tax purposes was $877,361,204; accordingly, accumulated net unrealized appreciation on investments was $1,801,757,050, consisting of $1,858,474,668 gross unrealized appreciation and $56,717,618 gross unrealized depreciation.
NOTE 5—Pending Legal Matters:
The fund and many other entities have been named as defendants in numerous pending litigations as a result of their participation in the leveraged buyout transaction (“LBO”) of the Tribune Company (“Tribune”). The cases allege that Tribune took on billions of dollars of debt in the LBO to purchase its own stock from shareholders at $34 per share. The LBO was executed in a two-step transaction: shares were repurchased by Tribune in a tender offer in June 2007 and then in a go-private merger in December 2007. In 2008, approximately one year after the LBO was concluded, Tribune filed for bankruptcy protection under Chapter 11. Thereafter, in approximately June 2011, certain Tribune creditors filed dozens of complaints in various courts throughout the country alleging that the payments made to shareholders in the LBO were “fraudulent conveyances” under state and/or federal law, and that the shareholders must return the payments they received for their shares to satisfy the plaintiffs’ unpaid claims. These cases were consolidated for coordinated pre-trial proceedings in a multi-district litigation in the United States District Court for the Southern District of New York titled In re Tribune Company Fraudulent Conveyance Litigation (S.D.N.Y. Nos. 11-md-2296 and 12-mc-2296 (RJS) (“Tribune MDL”)).
In addition, there was a case pending in United States Bankruptcy Court for the District of Delaware brought by the Unsecured Creditors Committee of the Tribune Company that has since been transferred to the Tribune MDL (formerly The Official Committee of Unsecured Creditors of Tribune Co. v. FitzSimons, et al., Bankr. D. Del. Adv. Pro. No. 10-54010 (KJC)) (“FitzSimons case”). The case was originally filed on November 1, 2010. In a Fourth Amended Complaint filed in November 2012, among other claims, the Creditors Committee sought recovery under the Bankruptcy Code for alleged “fraudulent conveyances” from more than 5,000 Tribune shareholders (“Shareholder Defendants”), including the fund, and a

NOTES TO FINANCIAL STATEMENTS (continued)
36
defendants’ class of all shareholders who tendered their Tribune stock in the LBO and received cash in exchange. There were 35 other counts in the Fourth Amended Complaint that did not relate to claims against Shareholder Defendants, but instead were brought against parties directly involved in approval or execution of the leveraged buyout. On January 10, 2013, pursuant to the Tribune bankruptcy plan, Mark S. Kirchner, as Litigation Trustee for the Tribune Litigation Trust, became the successor plaintiff to the Creditors Committee in this case. The case is now proceeding as: Mark S. Kirchner, as Litigation Trustee for the Tribune Litigation Trust v. FitzSimons, et al., S.D.N.Y. No. 12-cv-2652 (RJS). On August 1, 2013, the plaintiff filed a Fifth Amended Complaint with the Court. The Fifth Amended Complaint contains more detailed allegations regarding the steps Tribune took in consideration and execution of the LBO, but did not change the legal basis for the claim previously alleged against the Shareholder Defendants.
On November 6, 2012, a motion to dismiss was filed in the Tribune MDL that applied to most, but not all, of the cases in the Tribune MDL. On September 23, 2013 Judge Sullivan granted the motion to dismiss on standing grounds, after rejecting defendants’ preemption arguments. By granting the motion, Judge Sullivan dismissed nearly 50 cases in the Tribune MDL. The fund was a defendant in at least one of the dismissed cases. The motion had no effect on the FitzSimons case, which had been stayed.
On September 30, 2013, plaintiffs appealed the motion to dismiss decision to the U.S. Court of Appeals for the Second Circuit. On October 28, 2013, certain defendants cross-appealed from Judge Sullivan’s decision, seeking review of the arguments that Judge Sullivan rejected in his decision. On March 29, 2016, the Second Circuit issued its decision on the appeal and cross-appeal. A panel of three judges unanimously affirmed the dismissal on the ground that the plaintiffs’ claims were preempted by section 546(e) of the Bankruptcy Code. On April 12, 2016, the plaintiffs/appellants filed a petition with the Second Circuit requesting rehearing of the appeal by the same panel of judges and/or rehearing en banc by all judges on the Second Circuit. On July 22, 2016, the Second Circuit denied both requests for rehearing. On September 9, 2016, Plaintiffs filed a petition for certiorari with the U.S. Supreme Court. A brief in opposition to the petition was filed on behalf of defendants on October 24, 2016. Plaintiffs filed a reply brief on November 4, 2016. As of December 6, 2017, the Supreme Court had not ruled on the petition.
In the FitzSimons case, a “global” motion to dismiss the fraudulent transfer claim asserted against the Shareholder Defendants, which applies equally to

37
all Shareholder Defendants including the fund, was filed on May 23, 2014 and briefing was completed in July 2014. On January 9, 2017, Judge Sullivan entered an order granting the “global” motion and dismissing the claim against all the Shareholder Defendants. On February 2, 2017, the plaintiff filed a request to seek leave to appeal with the court. On February 23, 2017, the Court entered an order stating that it would permit the Plaintiff to make an interlocutory appeal of the dismissal of the claim, but only after the Court decided other pending motions to dismiss that do not involve the Shareholder Defendants. As of December 6, 2017, the Court had not decided those other motions.
At this stage in the proceedings, it is not possible to assess with any reasonable certainty the probable outcomes of the pending litigations. Consequently, at this time, management is unable to estimate the possible loss that may result.

REPORT OF INDEPENDENT REGISTERED PUBLIC ACCOUNTING FIRM
38
Shareholders and Board of Directors Dreyfus S&P 500 Index Fund
We have audited the accompanying statement of assets and liabilities, including the statements of investments, investments in affiliated issuers and futures, of Dreyfus S&P 500 Index Fund (one of the series comprising Dreyfus Index Funds, Inc.) (the Fund) as of October 31, 2017, and the related statement of operations for the year then ended, the statement of changes in net assets for each of the two years in the period then ended, and the financial highlights for each of the five years in the period then ended. These financial statements and financial highlights are the responsibility of the Fund’s management. Our responsibility is to express an opinion on these financial statements and financial highlights based on our audits.
We conducted our audits in accordance with the standards of the Public Company Accounting Oversight Board (United States). Those standards require that we plan and perform the audit to obtain reasonable assurance about whether the financial statements and financial highlights are free of material misstatement. We were not engaged to perform an audit of the Fund’s internal control over financial reporting. Our audits included consideration of internal control over financial reporting as a basis for designing audit procedures that are appropriate in the circumstances, but not for the purpose of expressing an opinion on the effectiveness of the Fund’s internal control over financial reporting. Accordingly, we express no such opinion. An audit also includes examining, on a test basis, evidence supporting the amounts and disclosures in the financial statements and financial highlights, assessing the accounting principles used and significant estimates made by management, and evaluating the overall financial statement presentation. Our procedures included confirmation of securities owned as of October 31, 2017 by correspondence with the custodian and others or by other appropriate auditing procedures where replies were not received. We believe that our audits provide a reasonable basis for our opinion.
In our opinion, the financial statements and financial highlights referred to above present fairly, in all material respects, the financial position of Dreyfus S&P 500 Index Fund at October 31, 2017, the results of its operations for the year then ended, the changes in its net assets for each of the two years in the period then ended, and the financial highlights for each of the five years in the period then ended in conformity with U.S. generally accepted accounting principles.
New York, New York December 28, 2017

IMPORTANT TAX INFORMATION (Unaudited)
39
For federal tax purposes, the fund hereby reports 100% of the ordinary dividends paid during the fiscal year ended October 31, 2017 as qualifying for the corporate dividends received deduction. Also, certain dividends paid by the fund may be subject to a maximum tax rate of 15%, as provided for by the Jobs and Growth Tax Relief Reconciliation Act of 2003. Of the distributions paid during the fiscal year, $45,178,724 represents the maximum amount that may be considered qualified dividend income. Shareholders will receive notification in early 2018 of the percentage applicable to the preparation of their 2017 income tax returns. The fund also hereby reports $.0062 per share as a long-term capital gain distribution paid on March 21, 2017 and also $.0349 per share as a short-term capital gain distribution and $4.3487 per share as a long-term capital gain distribution paid on December 28, 2016.

BOARD MEMBERS INFORMATION (Unaudited) INDEPENDENT BOARD MEMBERS
40
Joseph S. DiMartino (74) Chairman of the Board (1995) Principal Occupation During Past 5 Years: • Corporate Director and Trustee (1995-present)
Other Public Company Board Memberships During Past 5 Years: • CBIZ (formerly, Century Business Services, Inc.), a provider of outsourcing functions for small and
medium size companies, Director (1997-present)
No. of Portfolios for which Board Member Serves: 126 ———————
Peggy C. Davis (74) Board Member (2006) Principal Occupation During Past 5 Years: • Shad Professor of Law, New York University School of Law (1983-present)
No. of Portfolios for which Board Member Serves: 45 ———————
David P. Feldman (77) Board Member (1989) Principal Occupation During Past 5 Years: • Corporate Director and Trustee (1985-present)
Other Public Company Board Memberships During Past 5 Years: • BBH Mutual Funds Group (5 registered mutual funds), Director (1992-2014)
No. of Portfolios for which Board Member Serves: 31 ———————
Joan Gulley (70) Board Member (2017) Principal Occupation During Past 5 Years: • PNC Financial Services Group, Inc.(1993-2014) • Executive Vice President and Chief Human Resources Officer and Executive Committee Member
(2008-2014)
No. of Portfolios for which Board Member Serves: 52 ———————

41
Ehud Houminer (77) Board Member (1996) Principal Occupation During Past 5 Years: • Board of Overseers at the Columbia Business School, Columbia University (1992-present) • Trustee, Ben Gurion University
Other Public Company Board Memberships During Past 5 Years: • Avnet, Inc., an electronics distributor, Director (1993-2012)
No. of Portfolios for which Board Member Serves: 52 ———————
Lynn Martin (77) Board Member (2012) Principal Occupation During Past 5 Years: • President of The Martin Hall Group LLC, a human resources consulting firm (2005-2012)
Other Public Company Board Memberships During Past 5 Years: • AT&T, Inc., a telecommunications company, Director (1999-2012) • Ryder System, Inc., a supply chain and transportation management company, Director (1993-2012)
No. of Portfolios for which Board Member Serves: 31 ———————
Robin A. Melvin (54) Board Member (2012) Principal Occupation During Past 5 Years: • Co-chairman, Illinois Mentoring Partnership, non-profit organization dedicated to increasing the
quantity and quality of mentoring services in Illinois; (2014-present; board member since 2013) • Director, Boisi Family Foundation, a private family foundation that supports youth-serving
organizations that promote the self sufficiency of youth from disadvantaged circumstances (1995-2012)
No. of Portfolios for which Board Member Serves: 98 ———————

BOARD MEMBERS INFORMATION (Unaudited) (continued) INDEPENDENT BOARD MEMBERS (continued)
42
Dr. Martin Peretz (78) Board Member (2006) Principal Occupation During Past 5 Years: • Editor-in-Chief Emeritus of The New Republic Magazine (2011-2012) (previously,
Editor-in-Chief, 1974-2011) • Lecturer at Harvard University (1969-2012)
No. of Portfolios for which Board Member Serves: 31 ———————
Once elected all Board Members serve for an indefinite term, but achieve Emeritus status upon reaching age 80. The address of the Board Members and Officers is c/o The Dreyfus Corporation, 200 Park Avenue, New York, New York 10166. Additional information about the Board Members is available in the fund’s Statement of Additional Information which can be obtained from Dreyfus free of charge by calling this toll free number: 1-800-DREYFUS.
James F. Henry, Emeritus Board Member Philip L. Toia, Emeritus Board Member

OFFICERS OF THE FUND (Unaudited)
43
BRADLEY J. SKAPYAK, President since January 2010.
Chief Operating Officer and a director of the Manager since June 2009, Chairman of Dreyfus Transfer, Inc., an affiliate of the Manager and the transfer agent of the funds, since May 2011 and Chief Executive Officer of MBSC Securities Corporation since August 2016. He is an officer of 62 investment companies (comprised of 126 portfolios) managed by the Manager. He is 58 years old and has been an employee of the Manager since February 1988.
BENNETT A. MACDOUGALL, Chief Legal Officer since October 2015.
Chief Legal Officer of the Manager and Associate General Counsel and Managing Director of BNY Mellon since June 2015; from June 2005 to June 2015, he served in various capacities with Deutsche Bank – Asset & Wealth Management Division, including as Director and Associate General Counsel, and Chief Legal Officer of Deutsche Investment Management Americas Inc. from June 2012 to May 2015. He is an officer of 63 investment companies (comprised of 151 portfolios) managed by the Manager. He is 46 years old and has been an employee of the Manager since June 2015.
JANETTE E. FARRAGHER, Vice President and Secretary since December 2011.
Associate General Counsel of BNY Mellon, and an officer of 63 investment companies (comprised of 151 portfolios) managed by the Manager. She is 54 years old and has been an employee of the Manager since February 1984.
JAMES BITETTO, Vice President and Assistant Secretary since August 2005.
Managing Counsel of BNY Mellon and Secretary of the Manager, and an officer of 63 investment companies (comprised of 151 portfolios) managed by the Manager. He is 51 years old and has been an employee of the Manager since December 1996.
JOSEPH M. CHIOFFI, Vice President and Assistant Secretary since August 2005.
Managing Counsel of BNY Mellon, and an officer of 63 investment companies (comprised of 151 portfolios) managed by the Manager. He is 55 years old and has been an employee of the Manager since June 2000.
MAUREEN E. KANE, Vice President and Assistant Secretary since April 2015.
Managing Counsel of BNY Mellon since July 2014; from October 2004 until July 2014, General Counsel, and from May 2009 until July 2014, Chief Compliance Officer of Century Capital Management. She is an officer of 63 investment companies (comprised of 151 portfolios) managed by the Manager. She is 55 years old and has been an employee of the Manager since July 2014.
SARAH S. KELLEHER, Vice President and Assistant Secretary since April 2014.
Senior Counsel of BNY Mellon since March 2013, from August 2005 to March 2013, Associate General Counsel of Third Avenue Management. She is an officer of 63 investment companies (comprised of 151 portfolios) managed by the Manager. She is 42 years old and has been an employee of the Manager since March 2013.
JEFF PRUSNOFSKY, Vice President and Assistant Secretary since August 2005.
Senior Managing Counsel of BNY Mellon, and an officer of 63 investment companies (comprised of 151 portfolios) managed by the Manager. He is 52 years old and has been an employee of the Manager since October 1990.
NATALYA ZELENSKY, Vice President and Assistant Secretary since March 2017.
Counsel and Vice President of BNY Mellon since May 2016; Attorney at Wildermuth Endowment Strategy Fund/Wildermuth Advisory, LLC from November 2015 until May 2016; Assistant General Counsel at RCS Advisory Services from July 2014 until November 2015; Associate at Sutherland, Asbill & Brennan from January 2013 until January 2014; Associate at K&L Gates from October 2011 until January 2013. She is an officer of 63 investment companies (comprised of 151 portfolios) managed by Dreyfus. She is 32 years old and has been an employee of the Manager since May 2016.
JAMES WINDELS, Treasurer since November 2001.
Director – Mutual Fund Accounting of the Manager, and an officer of 63 investment companies (comprised of 151 portfolios) managed by the Manager. He is 59 years old and has been an employee of the Manager since April 1985.

OFFICERS OF THE FUND (Unaudited) (continued)
44
RICHARD CASSARO, Assistant Treasurer since January 2008.
Senior Accounting Manager – Money Market and Municipal Bond Funds of the Manager, and an officer of 63 investment companies (comprised of 151 portfolios) managed by the Manager. He is 58 years old and has been an employee of the Manager since September 1982.
GAVIN C. REILLY, Assistant Treasurer since December 2005.
Tax Manager of the Investment Accounting and Support Department of the Manager, and an officer of 63 investment companies (comprised of 151 portfolios) managed by the Manager. He is 49 years old and has been an employee of the Manager since April 1991.
ROBERT S. ROBOL, Assistant Treasurer since August 2005.
Senior Accounting Manager – Dreyfus Financial Reporting of the Manager, and an officer of 63 investment companies (comprised of 151 portfolios) managed by the Manager. He is 53 years old and has been an employee of the Manager since October 1988.
ROBERT SALVIOLO, Assistant Treasurer since July 2007.
Senior Accounting Manager – Equity Funds of the Manager, and an officer of 63 investment companies (comprised of 151 portfolios) managed by the Manager. He is 50 years old and has been an employee of the Manager since June 1989.
ROBERT SVAGNA, Assistant Treasurer since December 2002.
Senior Accounting Manager – Fixed Income and Equity Funds of the Manager, and an officer of 63 investment companies (comprised of 151 portfolios) managed by the Manager. He is 50 years old and has been an employee of the Manager since November 1990.
JOSEPH W. CONNOLLY, Chief Compliance Officer since October 2004.
Chief Compliance Officer of the Manager and The Dreyfus Family of Funds (63 investment companies, comprised of 151 portfolios). He is 60 years old and has served in various capacities with the Manager since 1980, including manager of the firm’s Fund Accounting Department from 1997 through October 2001.
CARIDAD M. CAROSELLA, Anti-Money Laundering Compliance Officer since January 2016.
Anti-Money Laundering Compliance Officer of the Dreyfus Family of Funds and BNY Mellon Funds Trust since January 2016; from May 2015 to December 2015, Interim Anti-Money Laundering Compliance Officer of the Dreyfus Family of Funds and BNY Mellon Funds Trust and the Distributor; from January 2012 to May 2015, AML Surveillance Officer of the Distributor and from 2007 to December 2011, Financial Processing Manager of the Distributor. She is an officer of 57 investment companies (comprised of 145 portfolios) managed by the Manager. She is 49 years old and has been an employee of the Distributor since 1997.

NOTES
45

For More Information
Dreyfus S&P 500 Index Fund 200 Park Avenue New York, NY 10166 Manager The Dreyfus Corporation 200 Park Avenue New York, NY 10166 Custodian The Bank of New York Mellon 225 Liberty Street New York, NY 10286
Transfer Agent & Dividend Disbursing Agent Dreyfus Transfer, Inc. 200 Park Avenue New York, NY 10166 Distributor MBSC Securities Corporation 200 Park Avenue New York, NY 10166
Ticker Symbol: PEOPX
Telephone Call your financial representative or 1-800-DREYFUS
Mail The Dreyfus Family of Funds, 144 Glenn Curtiss Boulevard, Uniondale, NY 11556-0144
E-mail Send your request to [email protected]
Internet Information can be viewed online or downloaded at www.dreyfus.com
The fund files its complete schedule of portfolio holdings with the Securities and Exchange Commission (“SEC”) for the first and third quarters of each fiscal year on Form N-Q. The fund’s Forms N-Q are available on the SEC’s website at www.sec.gov and may be reviewed and copied at the SEC’s Public Reference Room in Washington, D.C. (phone 1-800-SEC-0330 for information).
A description of the policies and procedures that the fund uses to determine how to vote proxies relating to portfolio securities and information regarding how the fund voted these proxies for the most recent 12-month period ended June 30 is available at www.dreyfus.com and on the SEC’s website at www.sec.gov and without charge, upon request, by calling 1-800-DREYFUS.
© 2017 MBSC Securities Corporation 0078AR1017