drill down the most underestimate oracle feature - database resource manager
TRANSCRIPT

DATABASE RESOURCE MANAGERDrill-down the most underestimate Oracle feature

Me • Name: Luís Marques
http://lcmarques.com / @drune / [email protected]
Luís Marques - @drune - http://lcmarques.com

Agenda
What we are going to talk?
Luís Marques - @drune - http://lcmarques.com
About Database Resource Manager with a lot of
questions, charts, arrows, screenshots and a Python
script
Luís Marques - @drune - http://lcmarques.com

Hand Raising
Is there a simple picture that summarize Resource Manager CPU scheduling?
Luís Marques - @drune - http://lcmarques.com

OS
OS
Before Database Resource Manager
Luís Marques - @drune - http://lcmarques.com
CPU #1
CPU #2
P#n
P#n
P#n
P#n
P#n
OS
PMON
OSOS
OS
P#n
P#n
OS run-queue
• quantum defined by OS
• Priority can be changed by OS
• All Oracle user sessions have the same priority to be selected for CPU
LGWR
SMON
DBWR
OS
OS
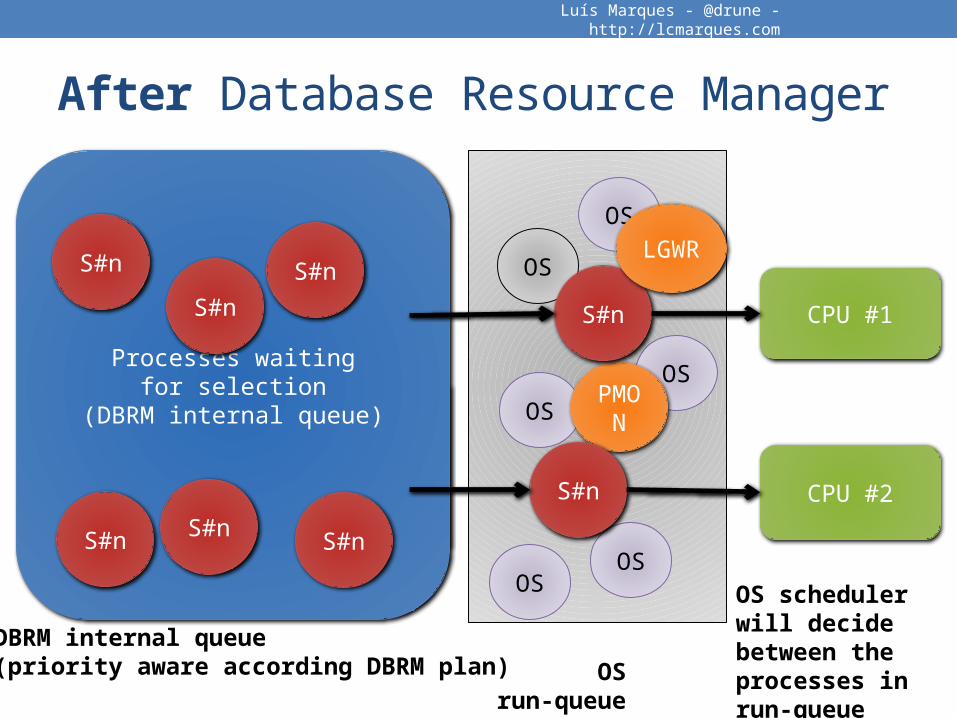
After Database Resource Manager
Luís Marques - @drune - http://lcmarques.com
Processes waiting for selection
(DBRM internal queue)
CPU #1
CPU #2
S#n
S#n
S#n
S#n
S#n
S#n
DBRM internal queue(priority aware according DBRM plan)
OS
PMON
OS
OS
OS
S#n
S#n
OS run-queue
OS scheduler will decide between the processes in run-queue
LGWR

More about DBRM scheduler…• DBRM Scheduler is not Database Workload Agnostic
• Priority based round robin algorithm
• Fixed quantum time slice of 100ms given to each process (_dbrm_quantum)
• More intelligent scheduling:• Aware of Oracle internal structures (eg: mutex, latching) • Has code to avoid problems like priority inversion.• No CPU starvation from critical background processes
• 2 Background Processes: VKRM and DBRM
Luís Marques - @drune - http://lcmarques.com

Hand Raising
Interesting! How do you prove that you have internal queues and how the
processes there go chosen to be on CPU?
Luís Marques - @drune - http://lcmarques.com
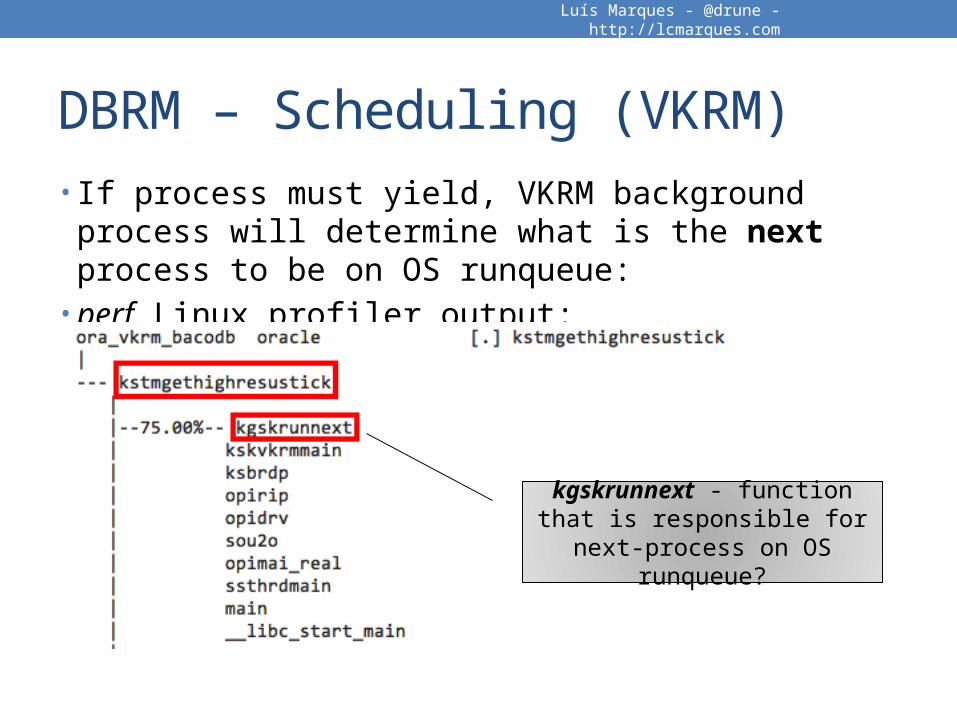
DBRM – Scheduling (VKRM)• If process must yield, VKRM background process will determine what is the next process to be on OS runqueue:• perf Linux profiler output:
Luís Marques - @drune - http://lcmarques.com
kgskrunnext - function that is responsible for next-process on OS runqueue?

DBRM – Scheduling (VKRM)• Suspending VKRM will place all your session eternally
waiting for CPU.
• SQL> ORADEBUG SETOSPID 16568Oracle pid: 10, Unix process pid: 16568, image: oracle@baco (VKRM)• SQL> ORADEBUG SUSPEND
Luís Marques - @drune - http://lcmarques.com
ORADEBUGSUSPEND
ORADEBUGRESUME
100% resmgr: cpu quantum

DBRM – Scheduling (CPU run-queue)
Luís Marques - @drune - http://lcmarques.com
• vmstat data with DBRM disabled:• OS run-queue does increase while increasing session
number: 41 sessions at end for 2 CPUs
As soon as sessions increase,
OS run queue increases
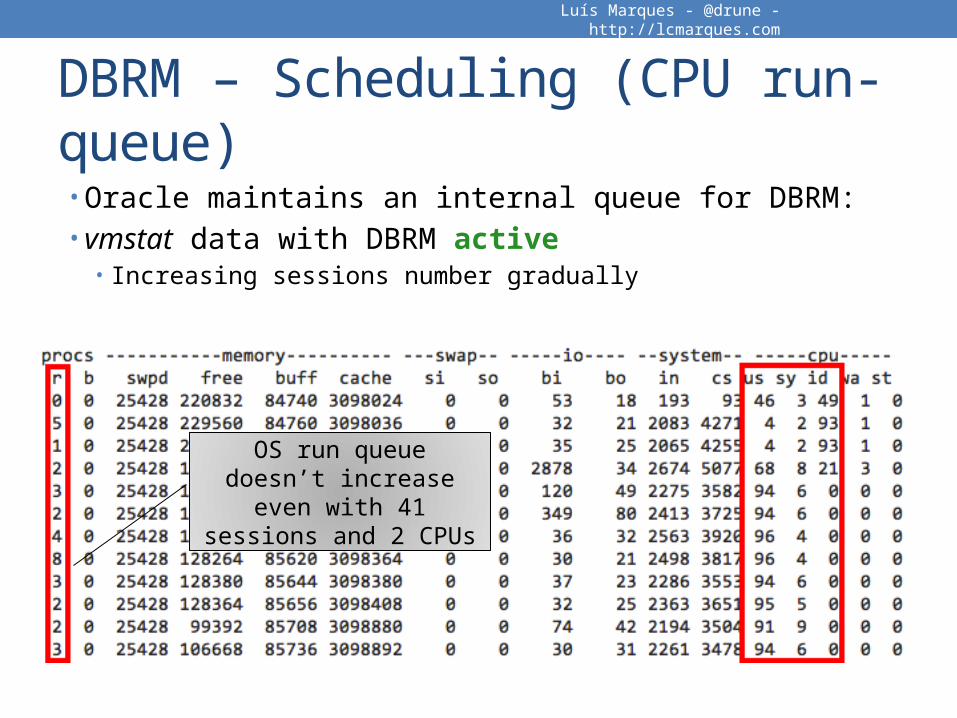
DBRM – Scheduling (CPU run-queue)• Oracle maintains an internal queue for DBRM:• vmstat data with DBRM active• Increasing sessions number gradually
Luís Marques - @drune - http://lcmarques.com
OS run queue doesn’t increase even with 41 sessions and 2 CPUs

Hand Raising
Nice theory but… I have a database with several schemas
with different priorities.
How I handle Resource Management?
Luís Marques - @drune - http://lcmarques.com

presman – DBRM monitor script• DBRM Monitoring Tool written in Python 2.x and cx_Oracle• Runs on Windows, Linux and OSX
• Usage ./presman.py -m measure -o filename –c column_id -p• Available measures: CPU, SESSION_IO, PARALLEL, EMPHASIS
• Download: http://lcmarques.com/presman-dbrm-monitor/• Available on github: https://github.com/lcmarques/presman
Luís Marques - @drune - http://lcmarques.com
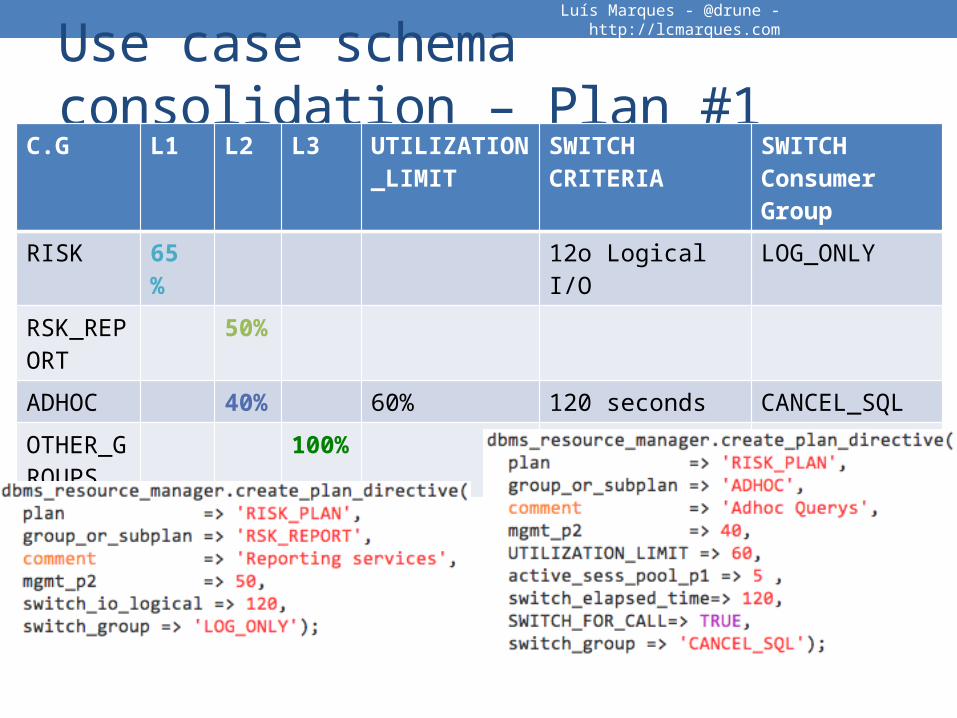
Use case schema consolidation – Plan #1
Luís Marques - @drune - http://lcmarques.com
C.G L1 L2 L3 UTILIZATION_LIMIT
SWITCH CRITERIA
SWITCH Consumer Group
RISK 65 %
12o Logical I/O LOG_ONLY
RSK_REPORT
50%
ADHOC 40%
60% 120 seconds CANCEL_SQL
OTHER_GROUPS
100%

Hand Raising
Hmm..but the sum of all allocation on all levels is way over 100%?
How I know the the minimum CPU allocated per consumer group?
Luís Marques - @drune - http://lcmarques.com

Emphasis - The Minimum CPU formula
Luís Marques - @drune - http://lcmarques.com
• Minimum CPU for the all DBRM managed sessions, not host minimum CPU allocation
• Minimum CPU :
Minimum % of CPU for Consumer Group
“n”
The value specified in plan directive
mgmt_pn
Product of a sequencek = mgmt_p1n = mgmt_pn
The sum of mgmt_p (n-1)
level

Emphasis - The Minimum CPU formula
Luís Marques - @drune - http://lcmarques.com
Consumer Group
mgmt_p1
mgmt_p2 mgmt_p3
Maximum CPU
RISK 100%
RSK_REPORT 100%
ADHOC 60%
OTHER_GROUPS 100%
65%
17,5%
14%
3,5%

Hand Raising
Great stuff! Let’s go test the Resource Manager plan ok?
Luís Marques - @drune - http://lcmarques.com

Test #1 – UTILIZATION_LIMIT• ADHOC Consumer group with UTILIZATION_LIMIT = 60%• CPU burner: burn_cpu_adhoc.sql• UTILIZATION_LIMIT is not a host CPU limit!• UTILIZATION_LIMIT is for Oracle user sessions managed by DBRM
Luís Marques - @drune - http://lcmarques.com
Us ~66%
Sys ~7%

Hand Raising
Hey, hey, so how I measure it easily?
Luís Marques - @drune - http://lcmarques.com

Test #1 – UTILIZATION_LIMIT• v$rsrcmgrmetric and v$osstat and do some math:(cpu_consumed_time_sec / (60 * CPU_count)) * 100
• $ presman.py –m cpu -o oracle_cpu.csv –c 7 -p
Luís Marques - @drune - http://lcmarques.com
Oracle CPU in % by Consumer Group

Hand Raising
That is easy! How do I test my plan CPU allocation ?
Luís Marques - @drune - http://lcmarques.com
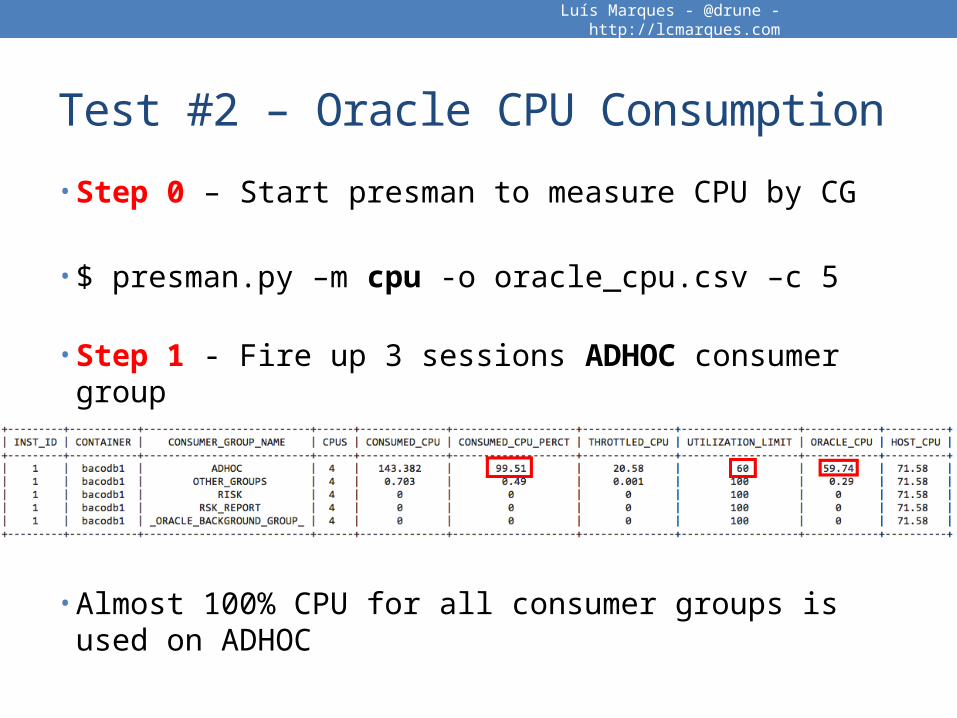
Test #2 – Oracle CPU Consumption
• Step 0 – Start presman to measure CPU by CG
• $ presman.py –m cpu -o oracle_cpu.csv –c 5
• Step 1 - Fire up 3 sessions ADHOC consumer group
• Almost 100% CPU for all consumer groups is used on ADHOC
Luís Marques - @drune - http://lcmarques.com
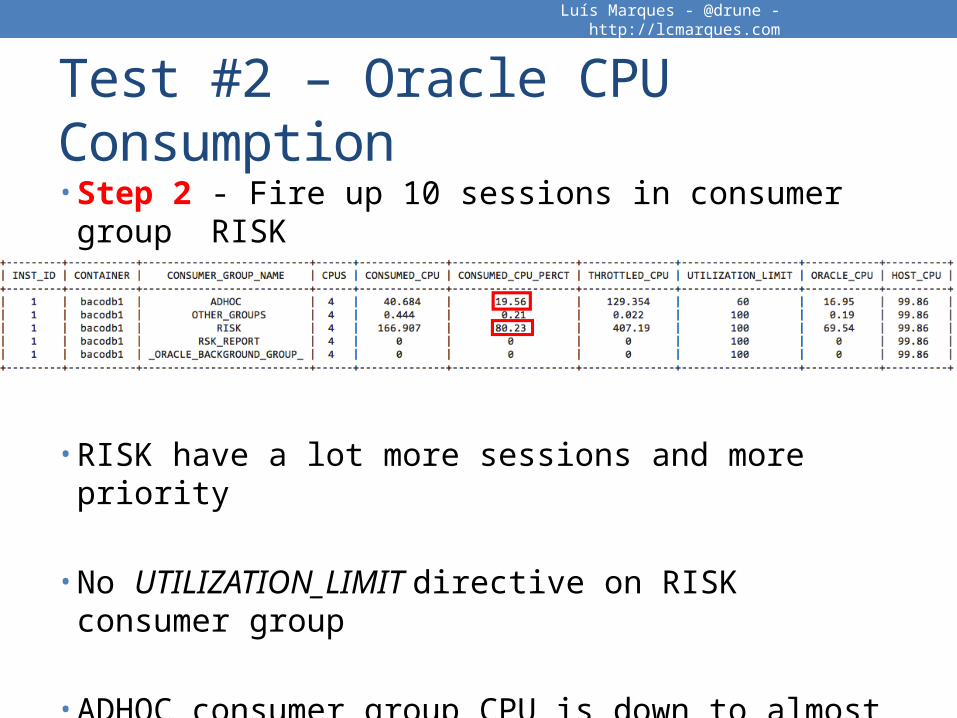
Test #2 – Oracle CPU Consumption• Step 2 - Fire up 10 sessions in consumer group RISK
• RISK have a lot more sessions and more priority
• No UTILIZATION_LIMIT directive on RISK consumer group
• ADHOC consumer group CPU is down to almost 20% of all consumer group CPU activity
Luís Marques - @drune - http://lcmarques.com
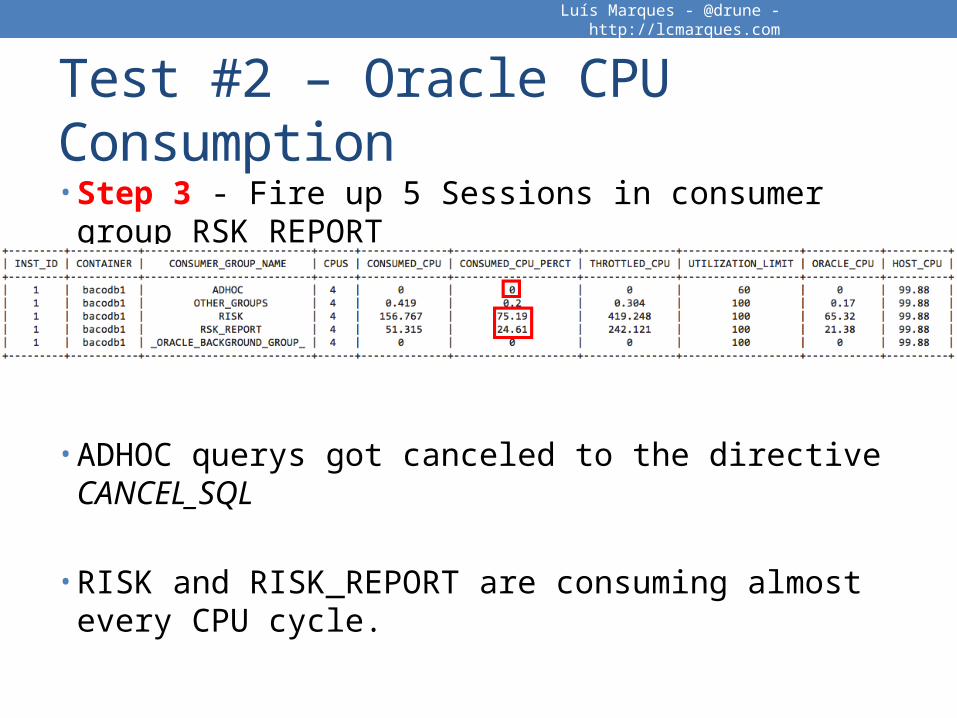
Test #2 – Oracle CPU Consumption• Step 3 - Fire up 5 Sessions in consumer group RSK_REPORT
• ADHOC querys got canceled to the directive CANCEL_SQL
• RISK and RISK_REPORT are consuming almost every CPU cycle.
Luís Marques - @drune - http://lcmarques.com

Test #2 – Oracle CPU Consumption• Step 4 - Fire up 3 Sessions in consumer group ADHOC
• Real world test vs Plan Directives CPU allocation
Luís Marques - @drune - http://lcmarques.com
Consumer Group
Minimum CPU
Test Minimum CPU
Sessions
RISK 65% 66,74% 10
RSK_REPORT 17,5% 18,23% 5
ADHOC 14% 14,81% 3 + 3
OTHERS_GROUP
3,5% 0,22% No sessions

Test #2 – Oracle CPU Consumption• presman historical CSV data file output_cpu.csv
Luís Marques - @drune - http://lcmarques.com

Hand Raising
Clarified!With so many sessions for a 4 CPU
database! You surely have throttling right?
Luís Marques - @drune - http://lcmarques.com
My hand
hurts…
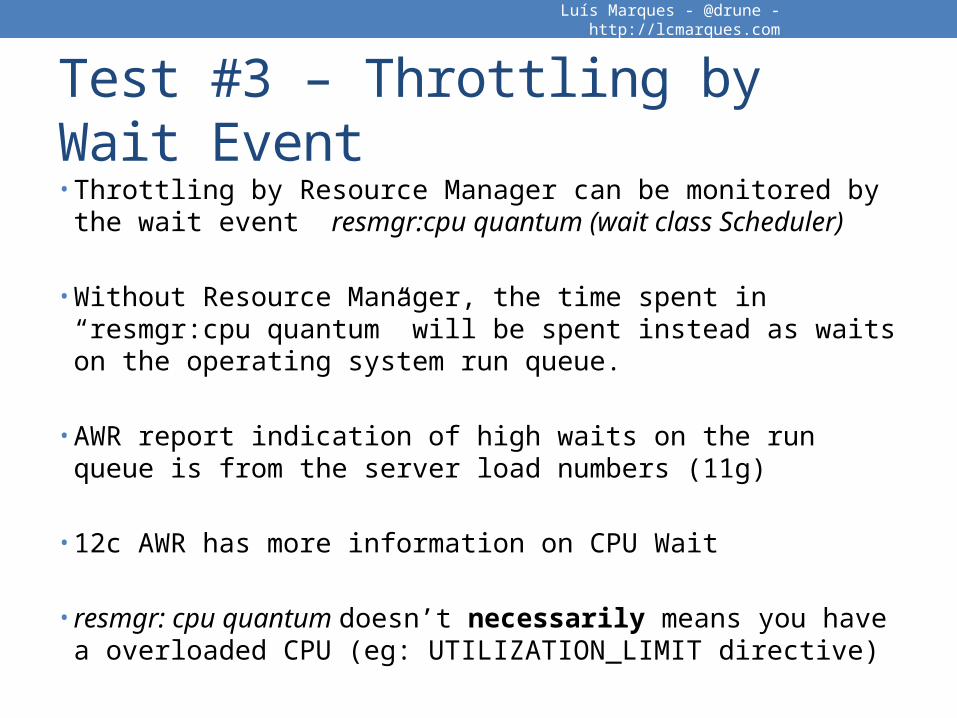
Test #3 – Throttling by Wait Event• Throttling by Resource Manager can be monitored by the
wait event resmgr:cpu quantum (wait class Scheduler)
• Without Resource Manager, the time spent in “resmgr:cpu quantum” will be spent instead as waits on the operating system run queue.
• AWR report indication of high waits on the run queue is from the server load numbers (11g)
• 12c AWR has more information on CPU Wait
• resmgr: cpu quantum doesn’t necessarily means you have a overloaded CPU (eg: UTILIZATION_LIMIT directive)
Luís Marques - @drune - http://lcmarques.com
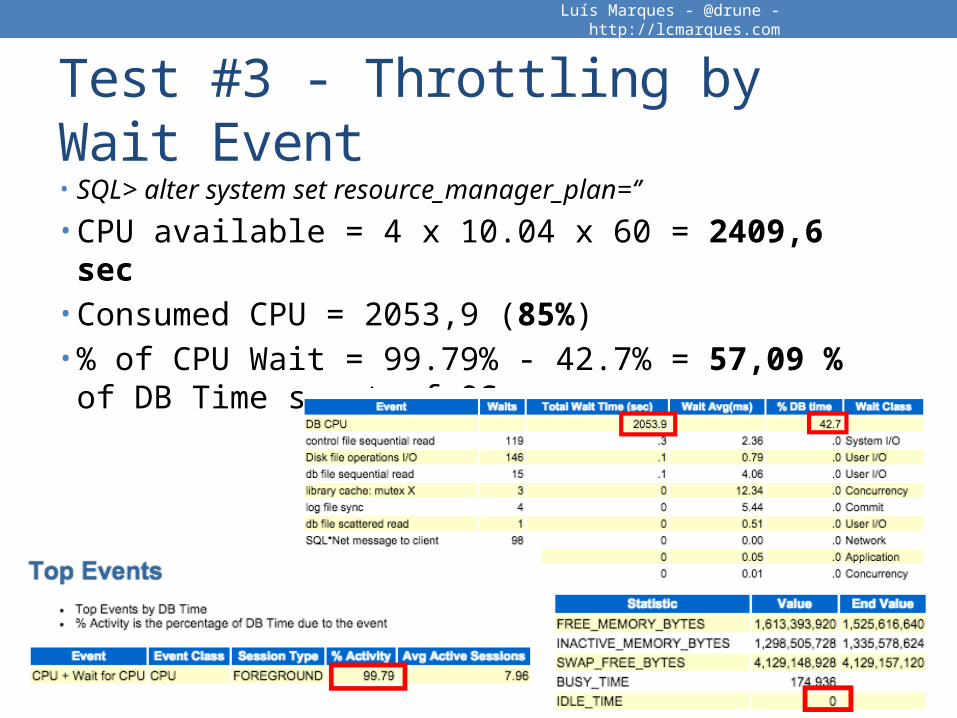
Test #3 - Throttling by Wait Event• SQL> alter system set resource_manager_plan=‘’
• CPU available = 4 x 10.04 x 60 = 2409,6 sec• Consumed CPU = 2053,9 (85%) • % of CPU Wait = 99.79% - 42.7% = 57,09 % of DB Time spent of OS run queue
Luís Marques - @drune - http://lcmarques.com

Test #3 - Throttling by Wait Event• alter system set resource_manager_plan=‘DBRM_PLAN’• CPU available = 4 x 9,03 x 60 = 2167,2• Consumed CPU = 1820,9 (84%) • 63% of DB Time is spent on waiting in Resource Manager
internal queue• % of CPU Wait = 36,64% - 28,1 % = Only 8,54 % of DB
Time spent of OS run queue
Luís Marques - @drune - http://lcmarques.com
Hand Raising
Good! I’ve read that we can handle parallel execution.
Handling all the parallel servers seems to be hard for me!
Luís Marques - @drune - http://lcmarques.com
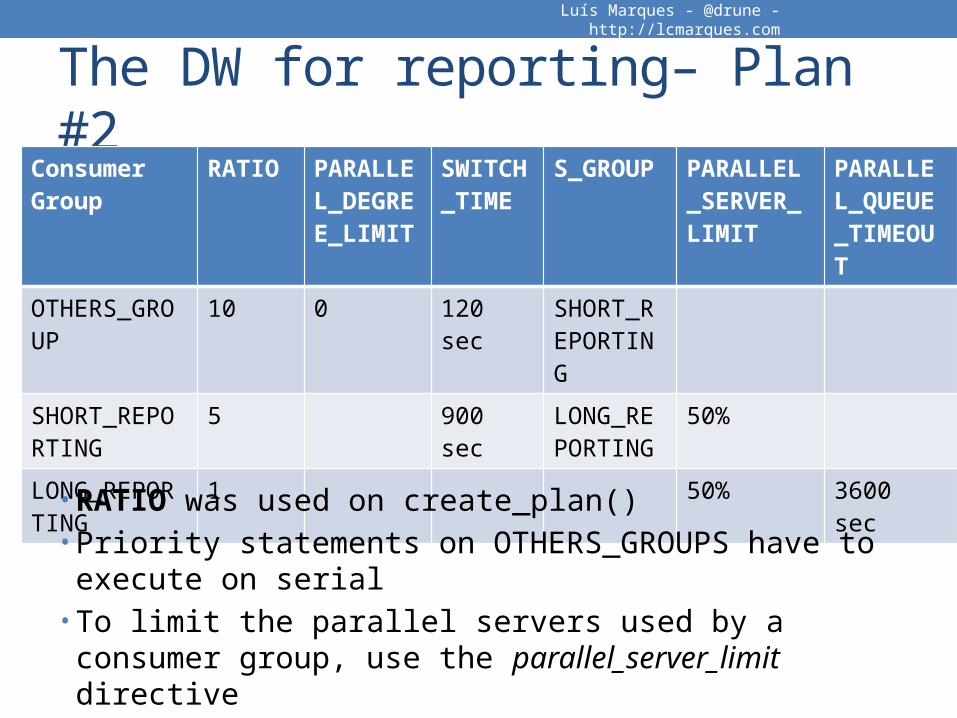
The DW for reporting– Plan #2Consumer Group
RATIO PARALLEL_DEGREE_LIMIT
SWITCH_TIME
S_GROUP
PARALLEL_SERVER_LIMIT
PARALLEL_QUEUE_TIMEOUT
OTHERS_GROUP
10 0 120 sec SHORT_REPORTING
SHORT_REPORTING
5 900 sec LONG_REPORTING
50%
LONG_REPORTING
1 50% 3600 sec
Luís Marques - @drune - http://lcmarques.com
• RATIO was used on create_plan() • Priority statements on OTHERS_GROUPS have to execute on serial• To limit the parallel servers used by a consumer group, use the parallel_server_limit directive

Hand Raising
Hey hey... WAIT! Now you used plan directives with a thing called RATIO or
SHARE! What is that?
Luís Marques - @drune - http://lcmarques.com

Ratio - The Minimum CPU formula
Luís Marques - @drune - http://lcmarques.com
Minimum % of CPU for Consumer Group
“n”
The value specified in plan directive
mgmt_pnSum of all ratios
Consumer Group Mgmt_p1 Ratio
Ratio as Emphasis
OTHERS_GROUP 10 10 / 16 = 62,5 %
SHORT_REPORTING 5 5 / 16 = 31,25 %
LONG_REPORTING 1 1 / 16 = 6,25%

Hand Raising
Can you go forward with the plan testing. I’m interested on parallel details!
Luís Marques - @drune - http://lcmarques.com
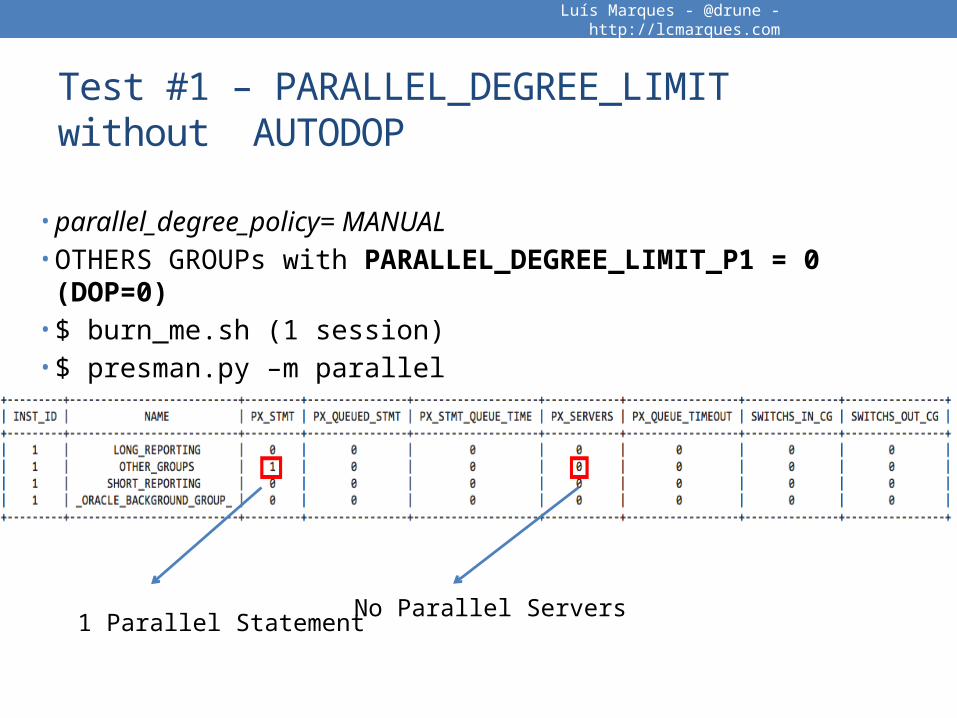
Test #1 – PARALLEL_DEGREE_LIMIT without AUTODOP
• parallel_degree_policy= MANUAL• OTHERS GROUPs with PARALLEL_DEGREE_LIMIT_P1 = 0 (DOP=0)
• $ burn_me.sh (1 session)• $ presman.py –m parallel
Luís Marques - @drune - http://lcmarques.com
1 Parallel StatementNo Parallel Servers
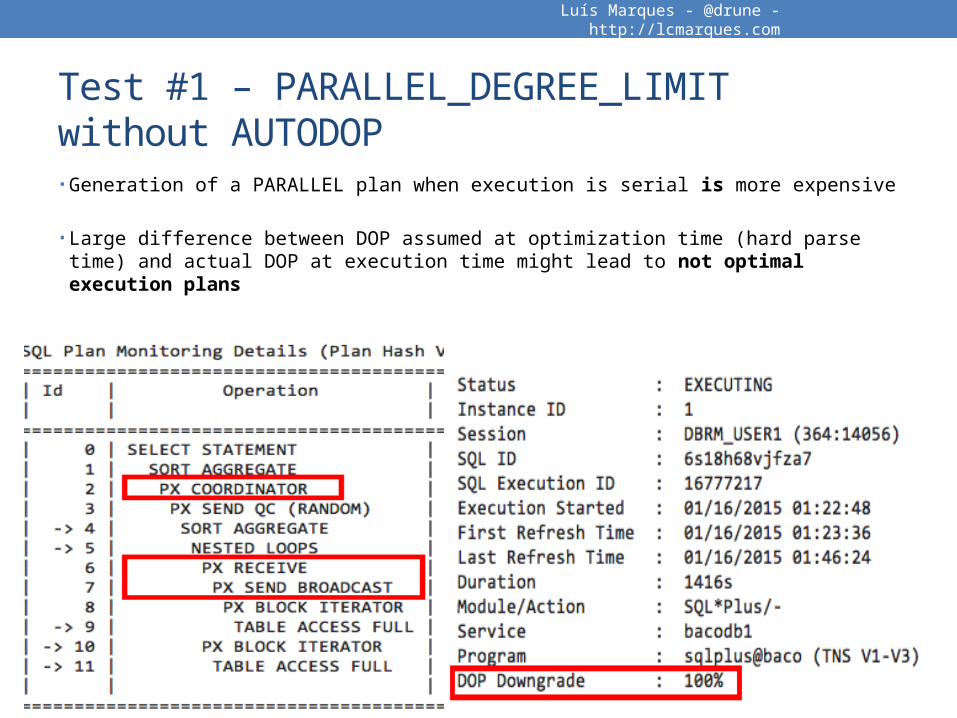
Test #1 – PARALLEL_DEGREE_LIMIT without AUTODOP• Generation of a PARALLEL plan when execution is serial is more expensive
• Large difference between DOP assumed at optimization time (hard parse time) and actual DOP at execution time might lead to not optimal execution plans
Luís Marques - @drune - http://lcmarques.com
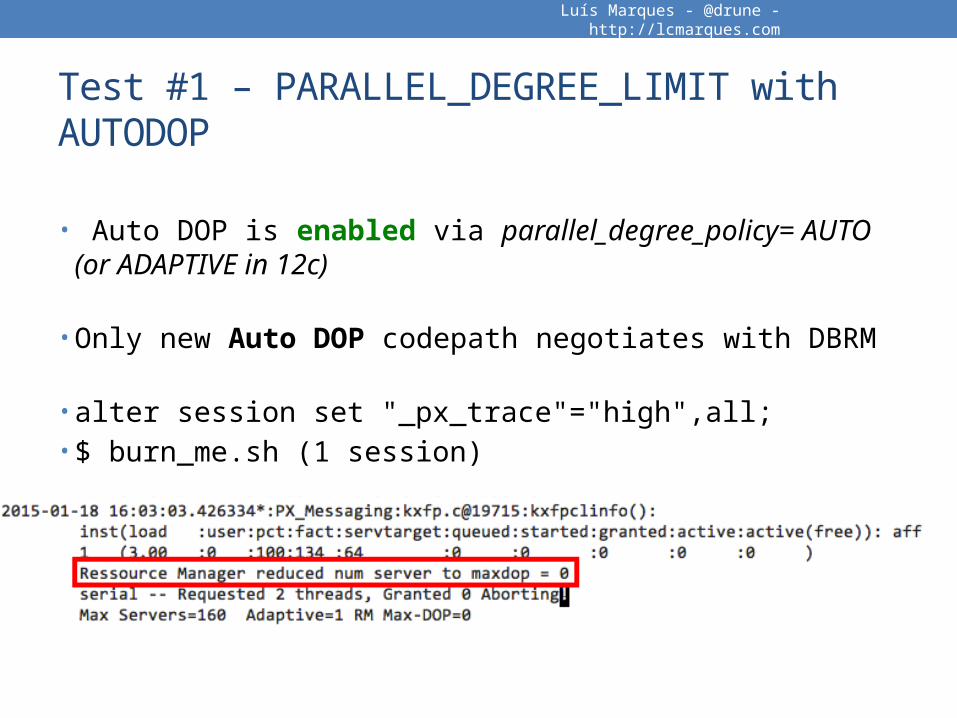
Test #1 – PARALLEL_DEGREE_LIMIT with AUTODOP
• Auto DOP is enabled via parallel_degree_policy= AUTO (or ADAPTIVE in 12c)
• Only new Auto DOP codepath negotiates with DBRM
• alter session set "_px_trace"="high",all;• $ burn_me.sh (1 session)
Luís Marques - @drune - http://lcmarques.com
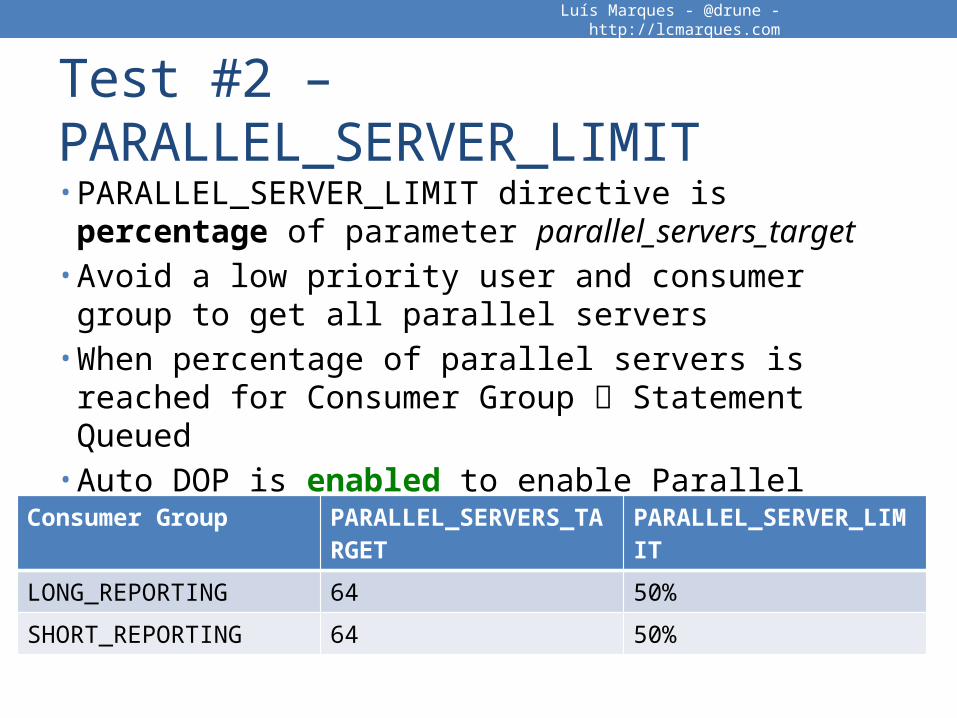
Test #2 – PARALLEL_SERVER_LIMIT• PARALLEL_SERVER_LIMIT directive is percentage of parameter parallel_servers_target• Avoid a low priority user and consumer group to get all parallel servers• When percentage of parallel servers is reached for Consumer Group Statement Queued• Auto DOP is enabled to enable Parallel Statement Queueing
Luís Marques - @drune - http://lcmarques.com
Consumer Group PARALLEL_SERVERS_TARGET
PARALLEL_SERVER_LIMIT
LONG_REPORTING 64 50%
SHORT_REPORTING 64 50%

Test #2 – PARALLEL_SERVER_LIMIT
• $ burn_me.sql (19 sessions) to LONG_REPORTING
• SQL> alter system set parallel_servers_target = 64
• $ presman.py –m parallel
Luís Marques - @drune - http://lcmarques.com
16 statements running3 statements queued 32 Parallel Servers = 50%
of parallel_servers_target

Hand Raising
Clear! What about having give more or less priority to my parallel statements when
they are queued?
Luís Marques - @drune - http://lcmarques.com
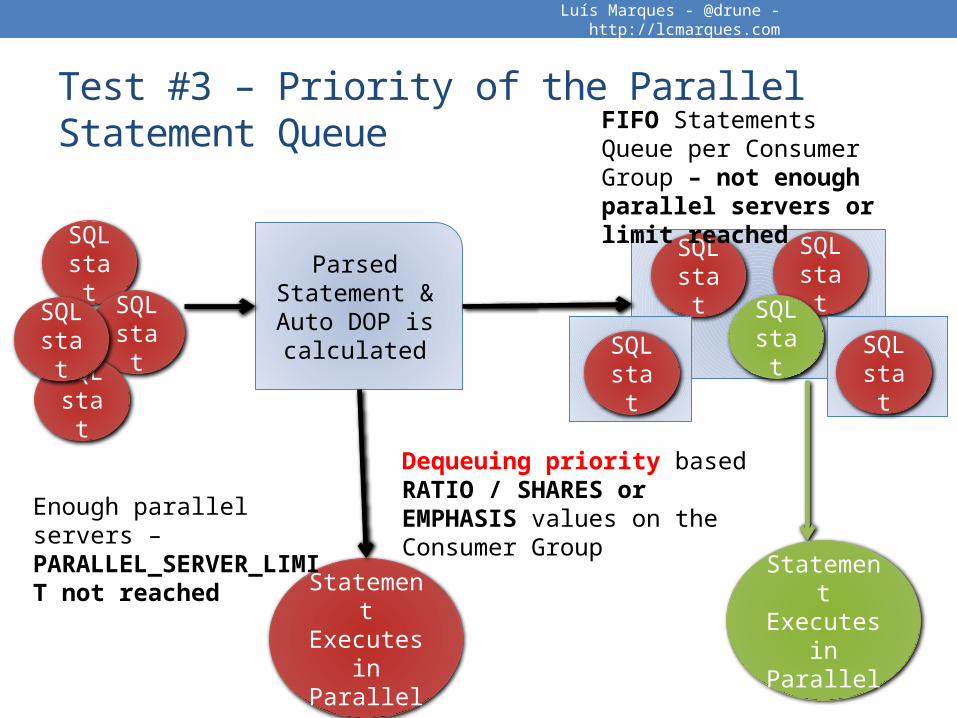
Test #3 – Priority of the Parallel Statement Queue
Luís Marques - @drune - http://lcmarques.com
Parsed Statement & Auto DOP is calculated
SQL stat
SQL stat
SQL stat
Statement
Executes in Parallel
SQL stat
SQL stat
SQL stat
SQL stat
FIFO Statements Queue per Consumer Group – not enough parallel servers or limit reached
Enough parallel servers – PARALLEL_SERVER_LIMIT not reached
Statement
Executes in Parallel
Dequeuing priority based RATIO / SHARES or EMPHASIS values on the Consumer Group
SQL stat
SQL stat

Test #3 – Priority of the Parallel Statement Queue• 35 sessions for SHORT and LONG Reporting Consumer Group.• $ burn_me_all_same_time.sh
• $ presman.py –m parallel –o queue_time.csv –c 4• Step 1 - 16 Statements running and 19 queued for each Consumer Group
Luís Marques - @drune - http://lcmarques.com

Test #3 – Priority of the Parallel Statement Queue• Step 2 - Dequeue of parallel statements started
• Step 3 – Dequeuing continues as soon as some statements finish
• Step 4 - Almost every statement done. No queued statements
Luís Marques - @drune - http://lcmarques.com
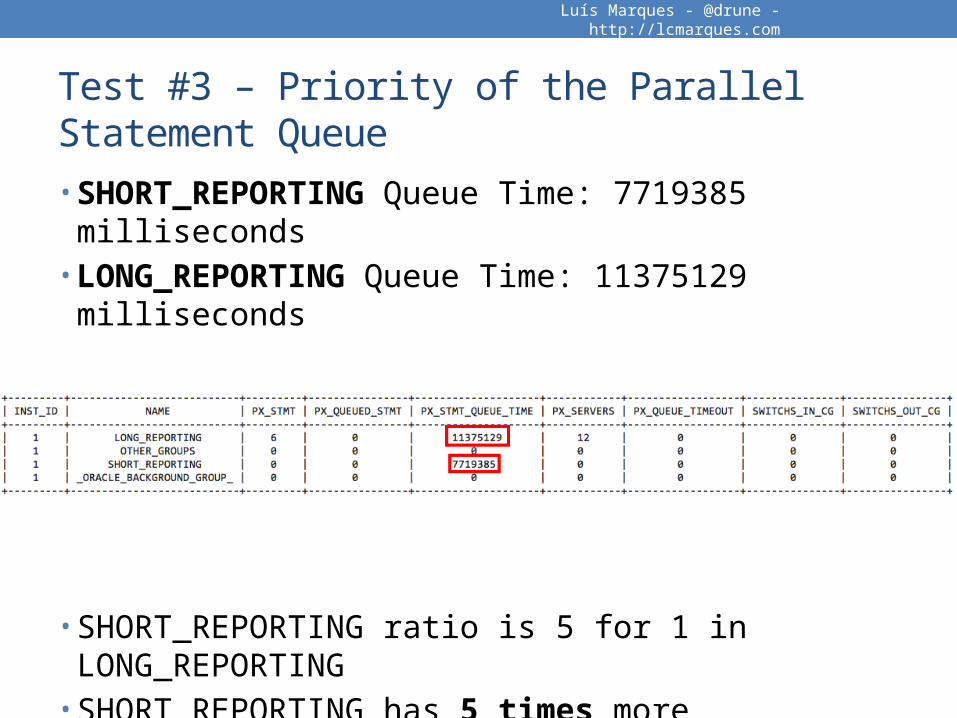
Test #3 – Priority of the Parallel Statement Queue• SHORT_REPORTING Queue Time: 7719385 milliseconds• LONG_REPORTING Queue Time: 11375129 milliseconds
67,8% less queue time for SHORT_REPORTING
• SHORT_REPORTING ratio is 5 for 1 in LONG_REPORTING• SHORT_REPORTING has 5 times more probability to get one statement dequeded than LONG_REPORTING.
Luís Marques - @drune - http://lcmarques.com

Hand Raising
What if I have some critical reports that need to bypass the queue because they are
critical?
Luís Marques - @drune - http://lcmarques.com

Critical Parallel Statement Queues• Oracle 12c introduced parallel_stmt_critical on plan directives• Allows one value: BYPASS_QUEUE• Sessions will start immediately and not wait in the queue.• parallel_max_servers init parameter is the hard threshold and critical statements can run with lower number of PX servers
dbms_resource_manager.create_plan_directive( plan => 'REPORTS_PLAN',group_or_subplan => 'CRITICAL_REPORT', comment => 'CRITICAL Reporting Querys', parallel_stmt_critical => 'BYPASS_QUEUE');
Luís Marques - @drune - http://lcmarques.com

Q & A
Luís Marques - @drune - http://lcmarques.com
I bet we don’t have time for it

Want to know more?• Dump the state of DBRM with:
• SQL> oradebug setmypid • SQL> oradebug dump DBSCHEDULER 1
• Trace wait events with 12c interface:
• SQL> alter session set events 'wait_event["resmgr:cpu quantum"] trace("%s\n", shortstack())';
• SQL> exec DBMS_MONITOR.SESSION_TRACE_ENABLE(waits => true, binds => false, plan_stat => 'NEVER');
Luís Marques - @drune - http://lcmarques.com