driving factors behind the price of a decentralised
TRANSCRIPT

Driving Factors Behind the Price of aDecentralised Cryptocurrency- An Internal Look at Network Factors Influencing the Price ofBitcoin
FEK345 Bachelor’s Thesis
Author: Anders Wikstrom
School of Business, Economics and Law
University of Gothenburg
Gothenburg, June 8, 2021

Abstract
This paper researches internal influences on the price of Bitcoin. By looking at Satoshi
Nakamoto’s original whitepaper, as well as employing economic theories such as the Law
of Diminishing Marginal Utility, Commodity Theory, and network valuation theory Met-
calfe’s Law, variables are chosen and run through a multiple regression analysis to de-
termine the variables influence on the price of Bitcoin. This paper uses monthly data
spanning 6 years from 2015 to 2020. Regression analysis shows that the variables Number
of Active Addresses, Difficulty Rate and Hash Rate all are positively correlated to the
price of Bitcoin, whilst the Relative Availability is negatively correlated to the price of
Bitcoin.
Keywords:
Bitcoin, Commodity Theory, Law of Diminishing Marginal Utility, Metcalfe’s Law.
i
CONTENTS CONTENTS
Contents
1 Introduction 1
2 Background 2
3 Problem analysis 4
3.1 Research Question . . . . . . . . . . . . . . . . . . . . . . . . . . . . . . . 4
3.2 Limitations . . . . . . . . . . . . . . . . . . . . . . . . . . . . . . . . . . . 5
4 Purpose 6
5 Theory 7
5.1 The Double–Spending Problem . . . . . . . . . . . . . . . . . . . . . . . . 7
5.2 The Bitcoin Network . . . . . . . . . . . . . . . . . . . . . . . . . . . . . . 7
5.2.1 Hash Function . . . . . . . . . . . . . . . . . . . . . . . . . . . . . . 7
5.2.2 Digital Signatures . . . . . . . . . . . . . . . . . . . . . . . . . . . . 7
5.2.3 Timestamp Server . . . . . . . . . . . . . . . . . . . . . . . . . . . 8
5.2.4 Proof–of–Work . . . . . . . . . . . . . . . . . . . . . . . . . . . . . 8
5.2.5 Miners . . . . . . . . . . . . . . . . . . . . . . . . . . . . . . . . . . 8
5.2.6 Nodes . . . . . . . . . . . . . . . . . . . . . . . . . . . . . . . . . . 8
5.2.7 Network . . . . . . . . . . . . . . . . . . . . . . . . . . . . . . . . . 9
5.2.8 Difficulty Target . . . . . . . . . . . . . . . . . . . . . . . . . . . . 9
5.2.9 Halving . . . . . . . . . . . . . . . . . . . . . . . . . . . . . . . . . 9
5.3 Law of Diminishing Marginal Utility . . . . . . . . . . . . . . . . . . . . . 9
5.4 Commodity Theory . . . . . . . . . . . . . . . . . . . . . . . . . . . . . . . 10
5.5 Metcalfe’s Law . . . . . . . . . . . . . . . . . . . . . . . . . . . . . . . . . 10
6 Methodology 11
6.1 Current Data Collection . . . . . . . . . . . . . . . . . . . . . . . . . . . . 11
6.2 Variables . . . . . . . . . . . . . . . . . . . . . . . . . . . . . . . . . . . . . 11
6.3 Assumptions and Hypotheses . . . . . . . . . . . . . . . . . . . . . . . . . 11
6.4 Multiple Regression Analysis . . . . . . . . . . . . . . . . . . . . . . . . . . 13
7 Literature Survey 14
7.1 Literature on Cryptocurrencies Value as a Currency . . . . . . . . . . . . . 14
7.2 Literature on Influencing Factors . . . . . . . . . . . . . . . . . . . . . . . 16
8 Results & Analysis 18
8.1 Data . . . . . . . . . . . . . . . . . . . . . . . . . . . . . . . . . . . . . . . 18
8.1.1 Bitcoin Price in USD . . . . . . . . . . . . . . . . . . . . . . . . . . 18
ii

CONTENTS CONTENTS
8.1.2 Number of Active Addresses . . . . . . . . . . . . . . . . . . . . . . 19
8.1.3 Level of Difficulty & Hash Rate . . . . . . . . . . . . . . . . . . . . 20
8.1.4 Circulating Supply of Bitcoin . . . . . . . . . . . . . . . . . . . . . 22
8.1.5 Block Size . . . . . . . . . . . . . . . . . . . . . . . . . . . . . . . . 23
8.1.6 Block Size . . . . . . . . . . . . . . . . . . . . . . . . . . . . . . . . 23
8.2 Multiple Regression Analysis . . . . . . . . . . . . . . . . . . . . . . . . . . 24
8.2.1 Model 1A . . . . . . . . . . . . . . . . . . . . . . . . . . . . . . . . 24
8.2.2 Model 1B . . . . . . . . . . . . . . . . . . . . . . . . . . . . . . . . 25
8.2.3 Model 2A . . . . . . . . . . . . . . . . . . . . . . . . . . . . . . . . 27
8.2.4 Model 2B . . . . . . . . . . . . . . . . . . . . . . . . . . . . . . . . 28
8.2.5 Model Metcalfe . . . . . . . . . . . . . . . . . . . . . . . . . . . . . 29
9 Conclusion 31
9.1 Answer to Research Questions . . . . . . . . . . . . . . . . . . . . . . . . . 31
9.2 Further Suggested Study . . . . . . . . . . . . . . . . . . . . . . . . . . . . 32
References 33
iii
1 INTRODUCTION
1 Introduction
This paper will take a look at the value of a decentralised cryptocurrency and try find
what factors influence and determine its value. This paper will take a primary focus
on Bitcoin as it has provided the basis for a multiple of cryptocurrencies that have been
created after its introduction, most of which have made use of Satoshi Nakamoto’s original
paper that describes the theory behind a decentralised digital currency.
By looking at Satoshi Nakamoto’s original paper we are able learn and locate what internal
factors and processes make up Bitcoin and the network and test these against the price
of Bitcoin over a period of six years to determine what factors are influencing the value
of Bitcoin. With the use of economic theories such as the Law of Diminishing Marginal
Utility, Commodity Theory, as well as network valuation theory Metcalfe’s Law, this study
is able to locate possible influencing factors and determine their influence through the use
of a multiple regression analysis.
1
2 BACKGROUND
2 Background
Cryptocurrencies are a digital based assets which are created completely digitally and
are secured by cryptography. Cryptocurrencies are often built on decentralised networks
based on an open source code.
Decentralised cryptocurrencies have emerged as a fast growing market ever since its in-
ception in 2009. Created by ”Satoshi Nakamoto”(assumed to be a pseudonym), ”Bitcoin”
is the first decentralised cryptocurrency ever created (Bitcoin.org, 2021). Since then there
have been many iterations based off of the original Bitcoin source code, these are known
as ”altcoins”. Other cryptocurrencies have also emerged out of the success of Bitcoin
on the market, examples of these include ”Litecoin” and ”Ethereum”. Transactions in
Bitcoin occur completely online on decentralised networks that use a shared ledger sys-
tem technology known as the ”Blockchain”. The blockchain is used as a solution to the
double spending problem. It is made up of a ”peer–to–peer” network that works to verify
transactions hashing them into a chain of ”proof–of–work” that cannot be altered. This
network works without any central authority or administrator making it thus completely
decentralised. Each transaction is secured by a digital signature corresponding to the
sending address (Bitcoin.org, 2021).
New Bitcoins are created through a process know as ”mining”. In order to keep the
network running, secure the system and process transactions it requires computing power.
”Miners” give up CPU power in order to process and confirm transactions, creating new
blocks on the blockchain. Miners use ”Mining software” and specialised hardware in order
to perform these necessary tasks, and in return they receive Bitcoin (Bitcoin.org, 2021).
”Mining” therefore serves as a type of reward system for individuals giving up computing
power in order to keep the network running. New Bitcoins are however created at a
fixed rate making it a very competitive business for miners, especially as it becomes more
popular and more miners enter the market.
New ”coins” are being created at a decreasing and completely predictable rate. The
number of new Bitcoin created is automatically halved over time. Bitcoin is also designed
to stop creating new Bitcoin once it reaches 21 million Bitcoins (Bitcoin.org, 2021).
Many other of the altcoins share similar properties as Bitcoin being based off of the same
source code, making changes to particular variables to suit their preferences.
Bitcoin and other altcoins are not only being traded on the currency exchange and over–
the–counter markets, but are also emerging on the derivatives market.
Bitcoin currently has a market capitalization of approximately $750 billion, more than
2

2 BACKGROUND
twice that of the second placed Ethereum at approximately $327 billion (Coinmarket-
cap.com, 2021).
This paper will focus on looking at the value of Bitcoin by looking at what factors exert
influence on its pricing. With the aim to develop a further understanding of what lays
behind Bitcoin, as well as other decentralised cryptocurrencies, and understand what
effects the price.
This becomes more relevant as cryptocurrencies move further towards the mainstream
for companies and individual investors. This is especially relevant as major corporations
begin to invest in as well as offer cryptocurrencies such as Bitcoin as methods for payment.
3

3 PROBLEM ANALYSIS
3 Problem analysis
With the popularisation of cryptocurrencies ever increasing, as well as large sums being
invested into them, it is becoming ever more relevant and important to understand what
gives cryptocurrencies value, as well as what factors are effecting price changes in the
value of cryptocurrencies. As presented in the previous section [2], cryptocurrencies are
created completely digitally, meaning they are not a physical or tangible asset as most
other assets. However they do fulfill a functional value in the same way money does,
and cover the necessary characteristics to fulfill that role. They also carry with them a
production cost in the creation of ”new coins”, as discussed briefly in the previous section
[2].
The problem with valuing such assets as cryptocurrencies has lead to the two major
apposing viewpoints:
• That cryptocurrencies are currently in a bubble with no real tangible assets that
will inescapably burst.
• That cryptocurrencies provide a major opportunity for all people to invest and
participate in a financial network potentially worth trillions of dollars.
The price volatility of cryptocurrencies has also been a major issue that has many split on
whether cryptocurrencies can be used in commerce or as a store of value. This volatility
has however been on a decline since 2015, see [7]. It is therefor important to develop an
understanding behind what is effecting price changes and the value of such cryptocurren-
cies.
The aim of this paper will be to look at the internal functions and processes behind
decentralised cryptocurrencies and find what factors may influence its pricing. This study
will put a primary focus on Bitcoin as it has provided the basis for the following altcoins
and stands out as the dominating leader in the cryptocurrency market. In order to
research possible factors influencing the price of Bitcoin this study will take a close look
at the functions and processes involved behind the creation and processing of Bitcoin
and transactions, and see to which degree they exert influence on price by performing a
multiple regression analysis including the various possible influencing factors as variables.
3.1 Research Question
The aim of this paper will be to provide a better understanding of the inner working of
cryptocurrencies, Bitcoin in particular, and provide an answer to the following question:
• What internal factors built into Bitcoin exert influence on its value?
4

3.2 Limitations 3 PROBLEM ANALYSIS
3.2 Limitations
When studying the effect that certain variables may exert on the price of Bitcoin this
study will focus primarily on Bitcoin’s internal influencing variables. Such as the internal
processes and functions behind Bitcoin that make up and maintain the Bitcoin network.
Thus this study will exclude external influencing factors and variables such as external
market influences and manipulations on the price of Bitcoin. This study will also be
looking at the effects over a long–term period spanning 6 years, therefor this will not
attempt to provide an explanation for short–term price fluctuations.
5

4 PURPOSE
4 Purpose
Given that a digital currency is not a tangible assets, this has lead to a problem of how you
put a value on such an asset. This problem has divided the opinions of many experts, with
many believing that cryptocurrencies are in a price bubble with no tangible value that is
bound to burst, and others believing that cryptocurrencies provide a major opportunity
for a new type of currency to arise that brings with it advantages that is can be equally
benefiting to all.
This paper will take a prime look at Bitcoin to determine what value it holds by taking
a look at what factors may influence that value. Performing analysis of Bitcoin and its
inner workings should provide a better understanding for the current state of Bitcoin and
other cryptocurrencies as well as how it may fair further along in the future. Bitcoin like
most cryptocurrencies have experienced large fluctuations in their price over the years.
However these fluctuations may be short–term, and with the price trending upwards it is
important to understand what internal factors are driving the price of cryptocurrencies
and why investors and industries may be moving towards cryptocurrencies.
6

5 THEORY
5 Theory
Presented in this section are the theories and inner workings behind Bitcoin that make
up the network. Also presented here are theories behind what influences the value of an
asset. Such theories will provide a further understanding for the factors that influence
price, and aid in the choice of variables for analysis.
5.1 The Double–Spending Problem
The Double–Spending problem is the problem that regards the potential risk that a digital
currency gets spent twice. This is a major problem for digital currencies as the file for
a digital ”coin” can be duplicated and thereby falsified. A centralised solution to this
problem has been the use of trusted third–party financial institutions that can verify
whether a digital coin has been previously spent. Whereas the centralised solution is a
system based on trust, a decentralised solution to this problem relies instead on a system
based on cryptography for proof (Nakamoto, 2008).
5.2 The Bitcoin Network
Satoshi Nakamoto’s original paper ”Bitcoin: A Peer–to–Peer Electronic Cash System”
was the paper that first introduced Bitcoin from which subsequent cryptocurrencies have
emerged. This paper will provide a basis for understanding the internal workings of
Bitcoin, the processes behind transactions and verification’s as well as the decentralised
nature of it all.
5.2.1 Hash Function
A hash function converts and compresses data of any arbitrary size into a bit array of
fixed size called the ”hash” or the ”hash value”. The hash value is a deterministic random
number, meaning if the same data is inputted into the hash function it will produce the
same hash value. The hash cannot be determined prior and the hash function also cannot
be reversed (Carter and Wegman, 1979). Bitcoin uses a SHA-256 Hash Algorithm.
5.2.2 Digital Signatures
A digital ”coin” can be defined as a chain of digital signatures. Each owner in a transaction
will have two ”keys”, a ”signing key” and a ”verification key”. The verification key is
public and the signing key is private. In a transaction the sender inputs the hash and their
private key into a encryption algorithm, this produces a digital signature. The receiver
can verify the transaction by inputting the digital signature and the senders public key
into a decryption algorithm which then produces the hash, if no altercations have been
7
5.2 The Bitcoin Network 5 THEORY
made then both hash will be the same. Using digital signatures the chain of ownership
can thereby be verified (Nakamoto, 2008), however the problem remains that the receiver
cannot verify that a owner hasn’t double–spent a coin.
5.2.3 Timestamp Server
As part of the solution to the double–spending problem, the timestamp server is intro-
duced. The timestamp server takes a hash of a block of items, this is timestamped and
then widely distributed. The timestamp proves that the data in the block existed at a
point in time. Each timestamp includes the previous in the hash, this forms a chain with
each timestamp in the series reinforcing its predecessors (Nakamoto, 2008).
5.2.4 Proof–of–Work
With the timestamp server distributed over the peer–to–peer network, a proof–of–work
system is implemented. Computers solve a computational puzzle by adjusting the ”nonce”
(arbitrary number used only once in cryptography) in a block until it gives the required
zero bits to the block, this is conducted by a ”node” (computer participating in the
network). This process requires CPU power, meaning for each block it will require a
certain amount of CPU power in order to satisfy the required proof–of–work (Nakamoto,
2008). After the proof–of–work is satisfied, altercations cannot be made to a block without
redoing the work for all the subsequent blocks that follow.
5.2.5 Miners
”Miners” are the ones who create new blocks on the peer–to–peer network. Miners use
specialised hardware and software to create new blocks by performing the proof–of–work
required for a block of transactions [5.2.4]. Once the proof–of–work is satisfied, the new
block is distributed to the network where nodes either validate or reject the block. Miners
are rewarded Bitcoin in return for creating the new block.
5.2.6 Nodes
”Nodes” work to verify the blocks on the blockchain, and thereby set the rules for the
network. If majority of the CPU power is run by honest nodes the honest chain will grow
the fastest outpacing potential forks (deviations) in the chain (Nakamoto, 2008). The
implementation of the proof–of–work system is what makes the system decentralised,
where anyone in the world can run their own node supporting the network. Each node
can independently verify the transactions included in a block and check it against its own
copy of the ledger, false transactions are the rejected and potentially boot off the network.
There are ”full nodes” and there are ”light nodes”. Full nodes keep a full copy of the
8
5.3 Law of Diminishing Marginal Utility 5 THEORY
blockchain ledger, and light nodes keep a smaller version of the ledger. Full nodes can
also be mining nodes that create new blocks [5.2.5].
5.2.7 Network
The network works thus that transactions are distributed over the peer–to–peer network
to all the nodes, the transactions are timestamped, miners perform the proof–of–work
required and the block is advertised to the network where the nodes either validate or
reject the block insuring that transactions have not been double–spent. Once accepted,
miners can begin working on the next block using the hash of the previous block.
5.2.8 Difficulty Target
The difficulty level is a measure of how difficult it is to mine a new block. The difficulty
target is a number that is greater than the hash of the block. In order to create a new
block in the chain the miner hashes the header of the block and this hash must be less than
the difficulty target. The difficulty target is adjusted every 2016 blocks (approximately
every 2 weeks) to maintain an average of ten minutes between each block in the chain
(Blockchain, 2021). The lower the difficulty target the harder it is to produce a hash
less than the target. The hash is a random number so the miners must rehash over and
over till they find a hash that fits the constraints. It serves as a greater than less than
operator, as a comparison in order to control the mining speed.
5.2.9 Halving
The supply cap for Bitcoin is fixed at 21 Million. New coins are released gradually to
the market through the process of mining [5.2.5]. Miners receive Bitcoin in exchange
for creating new blocks and this reward decreases after every 210,000 blocks mined, this
occurs roughly every 4 years. The Bitcoin reward started off in 2009 at 50 BTC per block
when Satoshi Nakamoto mined the first block, this reward was then halved after 210,000
blocks to 25 BTC. After the latest halving that occurred in May 2020 the current block
reward stands at 6.25 BTC per block (Coinmarketcap.com, 2021).
5.3 Law of Diminishing Marginal Utility
The Law of Diminishing Marginal Utility states that for each unit of a product or good
consumed by an individual, the value and incremental benefit derived from the consump-
tion decreases (Doyle, 2016). Effectively the more available an item is as well as the rate
of which it is available will lower the value of that item. The higher the rate of availability
the lower the price.
9
5.4 Commodity Theory 5 THEORY
5.4 Commodity Theory
T.C. Brock’s Commodity Theory continues off of the Law of Diminishing Marginal Utility
[5.3] by explaining the psychological effect that scarcity has on peoples perception of
value. The theory states that as the scarcity of an object enhances the objects value or
desirability for the owner. This may be a product or any other type of commodity that is
transferable between persons (Lynn, 1991). With a high demand and scarce supply, this
effect causes a incongruity between the supply and demand equilibrium.
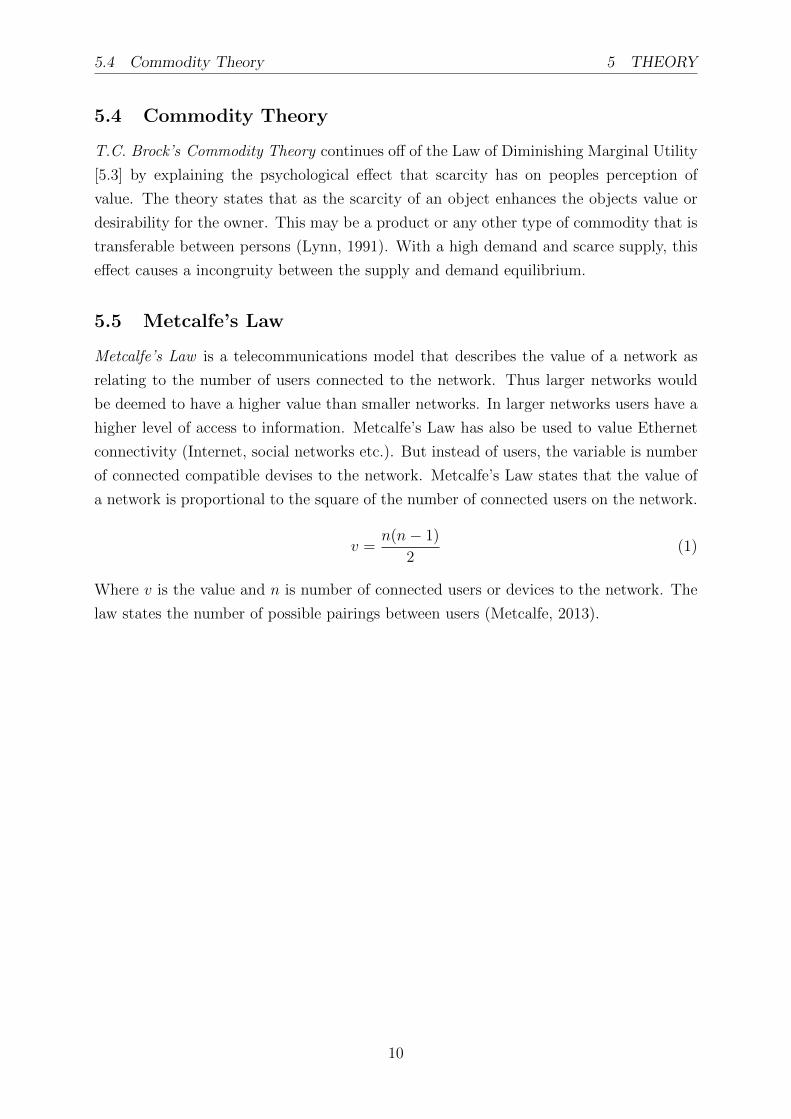
5.5 Metcalfe’s Law
Metcalfe’s Law is a telecommunications model that describes the value of a network as
relating to the number of users connected to the network. Thus larger networks would
be deemed to have a higher value than smaller networks. In larger networks users have a
higher level of access to information. Metcalfe’s Law has also be used to value Ethernet
connectivity (Internet, social networks etc.). But instead of users, the variable is number
of connected compatible devises to the network. Metcalfe’s Law states that the value of
a network is proportional to the square of the number of connected users on the network.
v =n(n− 1)
2(1)
Where v is the value and n is number of connected users or devices to the network. The
law states the number of possible pairings between users (Metcalfe, 2013).
10

6 METHODOLOGY
6 Methodology
For this study a quantitative approach was taken, collecting and analysing raw data
on the price of Bitcoin and variables effect on the price change. Variables are chosen
based on established theories as well as the processes and theories behind Bitcoin and the
blockchain.
6.1 Current Data Collection
Data on the price of Bitcoin and possible variables was collected from publicly available
online resources within the time–period from the 1st of January 2015 to the 31st of
December 2020 spanning over the 6 years. The Data points were collected over monthly
intervals, totaling in 72 data points per variable.
Data on the closing price for Bitcoin was gathered from Yahoo Finance (Yahoo Finance,
2021). For data on possible internal influencing variables for analysis was gathered from
Glassnode.com (Glassnode, 2021) as well as Blockchain.com (Blockchain, 2021). These
sources have been used in multiple of studies researching price variations and influences
[7].
6.2 Variables
The choice of variables was based on established economic theories as well as for their
relevancy for testing hypotheses. The variables considered for this study were:
• Bitcoin closing price in USD
• Number of Active Addresses
• Circulating Supply of Bitcoin, or the Relative Availability of Bitcoin
• Difficulty Rate
• Hash Rate
• Block Size
6.3 Assumptions and Hypotheses
According to the previously mentioned network valuation theory [5.5] the number of users
on a network determine and thereby effect the value of the whole network. Therefore the
number of users, or for this case the number of active users (or addresses) was included
as a variable that effects the pricing of Bitcoin. In order to research the effect of active
11

6.3 Assumptions and Hypotheses 6 METHODOLOGY
addresses on the price of Bitcoin, ”number of active addresses” was added as a variable.
As the network is positively effected by the number of users on the network, the number
of active addresses on the network is expected to have a positive effect on the price of
Bitcoin.
Hypothesis 1: The number of active addresses on the network is positively correlated to
the price of Bitcoin
As the mining difficulty increases this is comparable to an increased CPU power required
to mine coins. As the mining difficulty increases, miners have to make the call on whether
it is worth the cost of CPU power in order to continue mining. In order for them to do
so it would have to be deemed profitable, the marginal profit would have to exceed the
marginal cost. Therefor the difficulty would be expected to have a positive effect on the
price of Bitcoin.
Hypothesis 2: The level of mining difficulty is positively correlated to the price of Bitcoin
The hash–rate would also be expected to have a similar effect on the price of Bitcoin, as
the difficulty level is dependent on the hash function.
Hypothesis 3: The hash–rate is positively correlated to the price of Bitcoin
As the theory also suggests [5.3 & 5.4], the availability or scarcity of an asset will be
reflected in the price of said asset. In order to research the the influence of the availability
or scarcity of Bitcoin on the price, the ”Relative Availability” is added as a variable. For
this variable one takes the current circulating supply of Bitcoin and the total supply of
Bitcoin that will ever be available to determine the relative availability. As the supply
of Bitcoin increases this would be expected to have a negative influence on the price of
Bitcoin according to the theory.
Hypothesis 4: The relative availability of Bitcoin is negatively correlated to the price of
Bitcoin
The blocks on the blockchain contain the transactions of Bitcoin over the Bitcoin network.
As discussed previously [5.2], as the blockchain grows this essentially extends the ”ledger”
system further securing Bitcoin on the network increasing it’s legitimacy. As blocks are
created on average every ten minutes, this variable acts as a variable that also represents
Bitcoins time in existence. As demand for Bitcoin increases over time, as well as Bitcoin
becoming more secure for every block created, it is expected that as the block size increases
so may the price of Bitcoin.
Hypothesis 5: The block size is positively correlated to the price of Bitcoin
12
6.4 Multiple Regression Analysis 6 METHODOLOGY
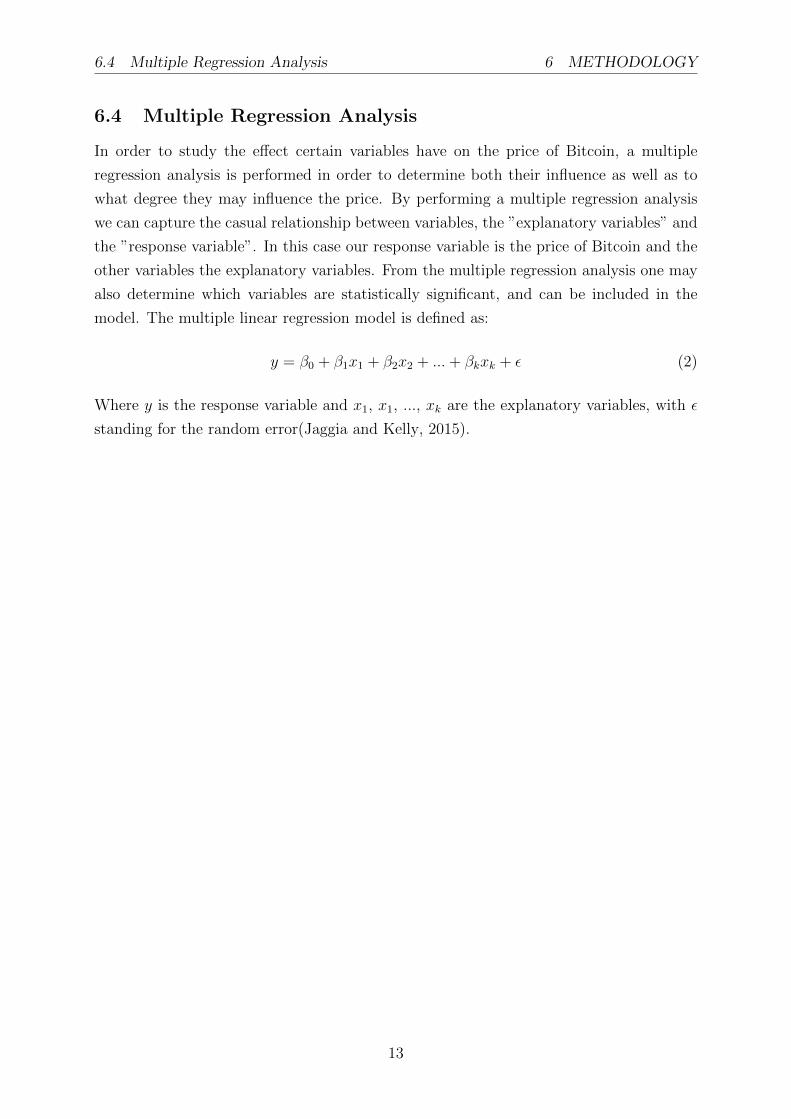
6.4 Multiple Regression Analysis
In order to study the effect certain variables have on the price of Bitcoin, a multiple
regression analysis is performed in order to determine both their influence as well as to
what degree they may influence the price. By performing a multiple regression analysis
we can capture the casual relationship between variables, the ”explanatory variables” and
the ”response variable”. In this case our response variable is the price of Bitcoin and the
other variables the explanatory variables. From the multiple regression analysis one may
also determine which variables are statistically significant, and can be included in the
model. The multiple linear regression model is defined as:
y = β0 + β1x1 + β2x2 + ...+ βkxk + ε (2)
Where y is the response variable and x1, x1, ..., xk are the explanatory variables, with ε
standing for the random error(Jaggia and Kelly, 2015).
13
7 LITERATURE SURVEY
7 Literature Survey
The study of cryptocurrencies is a relatively new field of research. There are however a
few interesting studies surrounding the issue of valuing cryptocurrencies. Studies range
from studying the value of cryptocurrencies as a form of money, some studies focusing
around the problem of volatility that cryptocurrencies have and factors influencing price
changes. A few of these studies will be presented below.
7.1 Literature on Cryptocurrencies Value as a Currency
Studies looking at the value Bitcoin has as a currency will tend to vary in their conclusions,
but one conclusion tends to remain fairly constant, and that is that volatility presents a
barrier for Bitcoin to be used as a mainstream currency.
In studying Bitcoin as a form of currency, Yermack claimed that Bitcoin as a currency
was too volatile and showed more signs of behaving like a speculative investment rather
than a currency (Yermack, 2015). Yermack also highlighted that a problem for Bitcoin
was its unusual decimal pricing (Yermack, 2015), claiming it was too confusing to be able
to use for the purchase of household products and services. On top of that Yermack also
added that Bitcoin, as well as most other decentralised cryptocurrencies, required a high
level of computer knowledge creating a high barrier for entry for potential adopters, and
therefore could not break into the mainstream as a proper currency (Yermack, 2015).
Yermack clearly highlights one side of the major viewpoints mentioned previously [3].
In a piece by Francois R. Velde for the Chicago Fed Letter, Velde studies Bitcoin in
comparison to the already existing currency in order to determine if it could stand to serve
as a replacement. Velde determines that while Bitcoin provides interesting features that
combat the double–spending problem, it does so at the cost of users anonymity (Velde,
2013). While a user may possess multiple ”wallets” in order to increase their anonymity,
this is thought to require an extra effort that can be construed as costly for the user.
Another cost for the user is the transaction speed, taking approximately 10 minutes for a
transaction to be included into the blockchain, with larger amounts requiring more time
(Velde, 2013). Velde also argues that while it may generally be thought that creating forks
that make up over half of the network is deemed too expensive, the potential growth in
value for Bitcoin may be cause for malicious behaviour (Velde, 2013).
In a study by Kubat Max, he studies how Bitcoin may fit in with the established definitions
of money, as well as how it fits with current legal definitions. Kubat finds that Bitcoin does
not settle with most of the current established definitions out there, with some definitions
acting to broadly to take into consideration, as well as most legal definitions relying on a
14
7.1 Literature on Cryptocurrencies Value as a Currency 7 LITERATURE SURVEY
central financial institutions that distribute and verify currency and transactions for their
definitions, into which a digital currency like Bitcoin by its making goes against (Kubat,
2015). Kubat finds that Bitcoin from its users may intuitively be considered money,
however lacking any legal status Bitcoin cannot explicitly be considered as money. When
looking at Bitcoin as a store of value, Kubat compares Bitcoin’s volatility to gold, the Euro
and the Polish Zloty, with both fiat currencies coming out with the lowest volatility’s and
Bitcoin with the highest volatility (Kubat, 2015). Kubat determines thereby that Bitcoin
incurs too high a risk to be considered a safe store of value.
Presenting in part the other side of the argument (Woo et al., 2013) highlights various
advantages to Bitcoin as a currency. In their paper it explains Bitcoin as having major
potential for use in e–commerce to even rival fiat currency, highlighting that Bitcoin
lowers transaction cost as it does not require financial institutions serving as middlemen,
but instead using a peer–to–peer network to verify transactions. In the study, they do
however agree in part with Kubat and Yermack’s studies in that Bitcoin suffers from high
volatility, making it the prime hindrance from it being used for general commerce and
gaining mainstream use (Woo et al., 2013).
In an article by Parker Lewis, Lewis claims that Bitcoin is not a backed by nothing, but
is in fact backed by the credibility of its own monetary properties. Monetary goods will
possess certain properties that make them valuable as a means of exchange. Properties
such as scarcity, fungibility, divisibility and durability etc. New monetary goods will
emerge fulfilling these properties and improving upon its predecessor and making the
predecessor obsolete (Lewis, 2019). Lewis lays out the factors that support his claim
by laying out how Bitcoin compares in these monetary properties against gold and fiat
currency.
For the property of scarcity, Lewis highlights that Bitcoin has absolute scarcity built in
with a limit of 21 Million Bitcoin that will ever be in existence. Regarding divisibility,
Bitcoin is divisible to 1 one-hundred millionth. And regarding Bitcoin’s fungibility, value
can be transferred between parties without use of trusted third party (Lewis, 2019).
For the Dollar its scarcity comes from the size of the debt relative to the amount of dollars
in circulation, meaning debt creates the demand for dollars. The amount of dollars is also
not fixed, but is manipulated by the Federal Reserve. For Bitcoin’s supply to exceed the
21 Million, the vast majority of users would have to agree to debase their own assets
(Lewis, 2019).
When compared to gold as a store of value, Lewis hightlights that golds primary value
lays in it being relatively scarce and fungible, however it is hard to transport and has
become relatively centralised. Bitcoin in comparison improves upon golds flaws in that
15
7.2 Literature on Influencing Factors 7 LITERATURE SURVEY
being a digital asset it is highly portable as well as decentralised (Lewis, 2019).
7.2 Literature on Influencing Factors
Studies looking at various factors that influence the prices of cryptocurrencies can be quite
broad in what variables they choose to take into account. Again here volatility presents
itself as a major culprit effecting prices negatively.
Studying primarily the price volatility of Bitcoin, Bouoiyour and Selmi looked at the
price volatility of Bitcoin between 2010 to 2014 as well as 2015 to 2016. The results of the
study was that volatility effected prices negatively overall, however they also found that
volatility was in a general decline since 2015 (Bouoiyour and Selmi, 2016). The study also
looked at the effect of positive news (positive shocks in prices) and bad news (negative
shocks) on price changes, and found that price changes were more responsive to bad news
rather than good (Bouoiyour and Selmi, 2016).
When looking at popularity and in a sense the effect of the internet on Bitcoin price,
Kristoufek studied the relationship between the price of Bitcoin and search frequency on
Bitcoin from Google and Wikipedia. In the study it was believed that due to the de-
centralised nature of Bitcoin, the price was driven primarily by short–term investors and
speculators following the trends. Similarly in a study by Garcia et al., it was also thought
that the price was primarily driven by social factors accumulated in the interactions be-
tween actors in the market (Garcia et al., 2014). Using the search frequencies, Kristoufek
as well as Garcia et al. were able to quantify the interest in Bitcoin and map that against
the price. The findings were that the weekly trends on Google and the daily trends on
Wikipedia corresponded with the price of Bitcoin(Kristoufek, 2013). As interest in Bit-
coin increased on these search–engines as did the Bitcoin price. Another finding was that
as the Bitcoin price rose above the tend, the increase in interest pushed the price further
up. As was the effect on the opposite when the price fell below the trend, interest would
drive the price further below (Kristoufek, 2013). In the study by Garcia et al. they also
found that this effect was far more prevalent when the price fell (Garcia et al., 2014).
Studying the multiple factors that influence the prices of cryptocurrencies, Sovebetov
studied a set of common cryptocurrencies, Bitcoin, Ethereum, Dash, Litcoin, as well as
Monero. Sovebetov tested various factors effecting the crypto–market in an attempt to
find determining factors of price change. By putting together a ”Crypto 50 index”, sam-
pling the top 50 ”coins” Sovebetov studied possible explanatory factors that correspond
to price movements. Sovebetov also studies these influencing factors over a short–run
and long–run period. Using historic price data, statistics from various sources as well
as Google search data, they were able to derive determining factors (Sovebetov, 2018).
16

7.2 Literature on Influencing Factors 7 LITERATURE SURVEY
Results of this study showed that trading volume positively effected price change in all
cryptocurrencies studied, especially in the long–run. Volatility effected prices negatively
in both the long–run and short–run, this effect was more severe in the short–run. The
”attractiveness” of cryptocurrencies effected all but Dash. This effect was positive but
was only statistically significant in the long–run (Sovebetov, 2018).
17

8 RESULTS & ANALYSIS
8 Results & Analysis
8.1 Data
8.1.1 Bitcoin Price in USD
Figure 1: Adjusted Closing Price for Bitcoin (Yahoo Finance, 2021)
In order to study the price of Bitcoin over a long–term period, the adjusted closing
price of Bitcoin [fig:1] is transformed into the log–normal values [fig:2]. This is standard
practice when studying currency returns over longer periods of time. This helps mitigate
heteroskedasticity, where the variance can vary quite comprehensively. This will help
when performing the regression analysis of the data.
Figure 2: Log–normal Adjusted Closing Price
18
8.1 Data 8 RESULTS & ANALYSIS
8.1.2 Number of Active Addresses
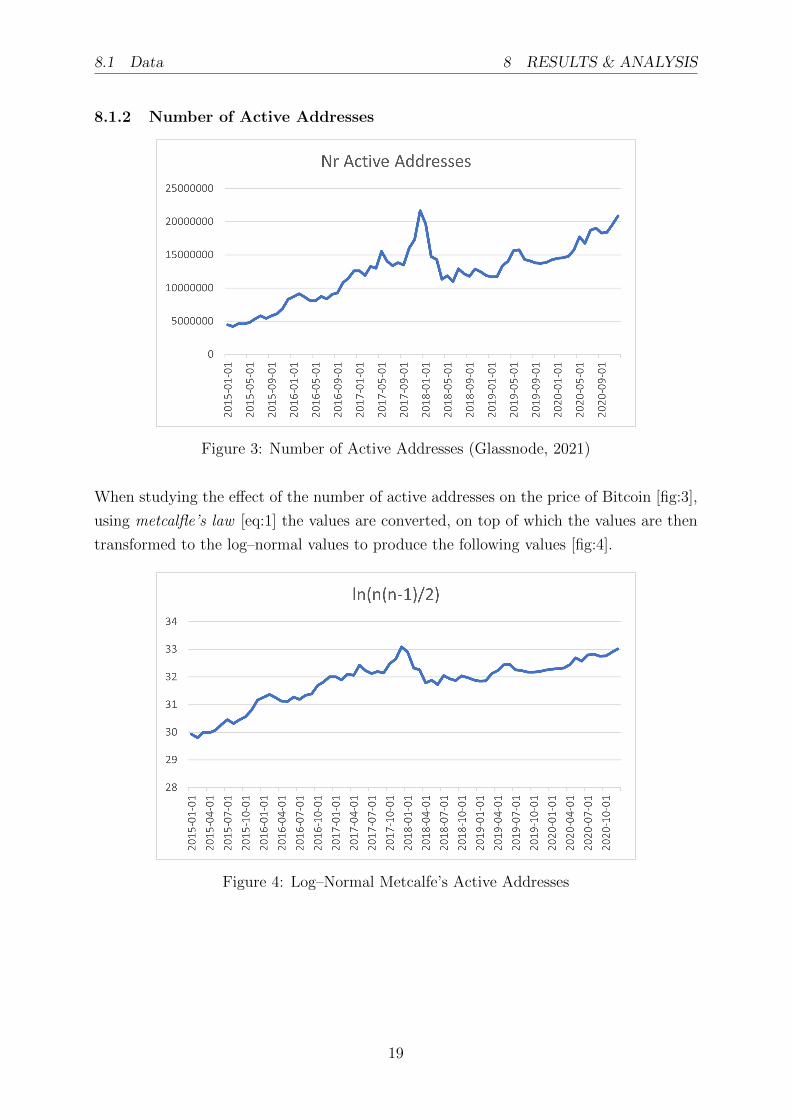
Figure 3: Number of Active Addresses (Glassnode, 2021)
When studying the effect of the number of active addresses on the price of Bitcoin [fig:3],
using metcalfle’s law [eq:1] the values are converted, on top of which the values are then
transformed to the log–normal values to produce the following values [fig:4].
Figure 4: Log–Normal Metcalfe’s Active Addresses
19

8.1 Data 8 RESULTS & ANALYSIS
8.1.3 Level of Difficulty & Hash Rate
Figure 5: Difficulty (Blockchain, 2021)
Figure 6: Hash Rate (Blockchain, 2021)
As the level of difficulty and hash rate are both dependent on the other [see 5.2.8], this
could present a problem of multicollinearity in the regression analysis. With a correlation
of Corr = 0.9981 this is a strong indication of multicollinearity. Therefor when performing
the regression analysis only one of these variables will be used at a time. For each of the
variables the values were transformed to the log–normal values, producing the following
[fig:7] & [fig:8].
20

8.1 Data 8 RESULTS & ANALYSIS
Figure 7: Log–Normal Difficulty
Figure 8: Log–Normal Hash Rate
21

8.1 Data 8 RESULTS & ANALYSIS
8.1.4 Circulating Supply of Bitcoin
Figure 9: Circulating Supply (Glassnode, 2021)
The circulating supply of Bitcoin values [fig:9] are transformed to a relative variable by
taking the values and dividing them by the total supply of Bitcoin that will ever be, 21
million. The following Relative Availability variable is produced [fig:10].
Figure 10: Relative Availability
22
8.1 Data 8 RESULTS & ANALYSIS
8.1.5 Block Size
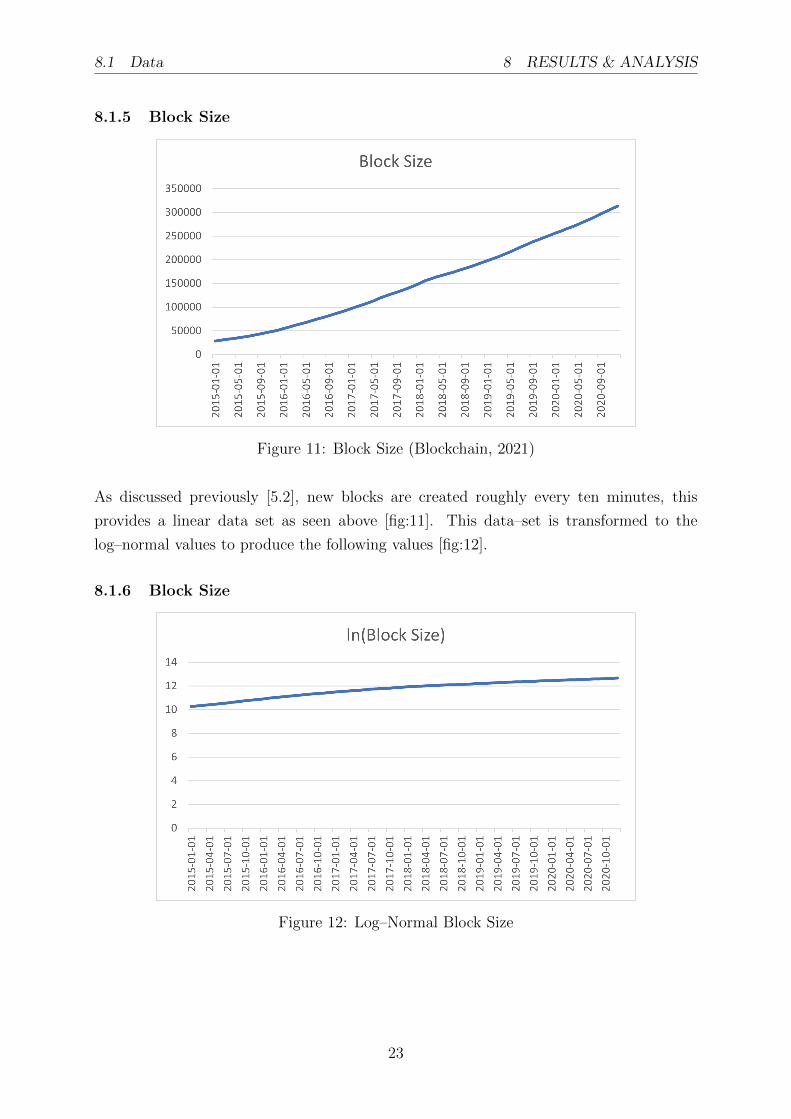
Figure 11: Block Size (Blockchain, 2021)
As discussed previously [5.2], new blocks are created roughly every ten minutes, this
provides a linear data set as seen above [fig:11]. This data–set is transformed to the
log–normal values to produce the following values [fig:12].
8.1.6 Block Size
Figure 12: Log–Normal Block Size
23

8.2 Multiple Regression Analysis 8 RESULTS & ANALYSIS
8.2 Multiple Regression Analysis
Using the above data [8.1] a least–squares (OLS) mutiple regression was performed over
the 72 data–points per variable in order to determine what variables influence change in
the response variable, Bitcoin price. All regressions run on the various data–sets were
performed using a 95% confidence level.
8.2.1 Model 1A
For the first model to be studied the following model was used:
ln(Price) = β0 + β1ln(n(n− 1)
2) + β2ln(Difficulty)
+ β3(Relative Availability) + β4ln(Block Size)
(3)
After running the regression it resulted in the following regression line:
ln(Price) = −40.307 + 1.039 × ln(n(n− 1)
2) + 0.987 × ln(Difficulty)
− 39.152 × (Relative Availability) + 1.591 × ln(Block Size)
(4)
This model produced an R2 = 0.9632 and an adjusted R2 = 0.961. With an R2 that
high it indicates that over 96% of the variation in Bitcoin´s price can be explained by the
variables in this model [eq:3].
When comparing the outcome of this regression with the original hypotheses [6.3] the
following is confirmed:
• Hypothesis 1 is confirmed, with a coefficient of 1.039 indicating that the number of
active addresses on the network is positively correlated to the price of Bitcoin.
• Hypothesis 2 is confirmed, with a coefficient of 0.987 indicating that the level of
difficulty in the mining process is positively correlated to the price of Bitcoin.
• Hypothesis 4 is confirmed, with a coefficient of −39.152 strongly indicating the
relative availability of Bitcoin is negatively correlated to the price of Bitcoin.
• Hypothesis 5 is also confirmed, with a coefficient of 1.591 indicating that the block
size is positively correlated to the price of Bitcoin.
However the P–Value for the coefficient for ln(Block Size) comes in at 0.079847, above
the required 0.05 to be deemed statistically significant. The remainder of the variables
coefficients come in with P–Values under 0.05.
24

8.2 Multiple Regression Analysis 8 RESULTS & ANALYSIS
8.2.2 Model 1B
Given that the P–Value for the coefficient for ln(Block Size) comes in at 0.079847 > 0.05,
a new regression is performed with this variable cancelled out.
For this regression the following model was used,
ln(Price) = β0 + β1ln(n(n− 1)
2) + β2ln(Difficulty) + β3(Relative Availability) (5)
After running the regression it resulted in the following regression line:
ln(Price) = −40.382 + 1.249 × ln(n(n− 1)
2) + 1.159 × ln(Difficulty)
− 29.963 × (Relative Availability)
(6)
This model produced an R2 = 0.9614 and an adjusted R2 = 0.9597. With an R2 that
high it indicates that roughly 96% of the variation in Bitcoin´s price can be explained by
the variables in this model [eq:5]. All P–Values in this model are under 0.05 making all
the variables in this analysis statistically significant.
When comparing the outcome of this regression with the original hypotheses [6.3], Hy-
pothesis 1, Hypothesis 2, and Hypothesis 4 are all confirmed with relevant coefficients
indicating how they correlate to the price of Bitcoin.
A closer look at the line fit plots show that the predicted values in this model are fitting in
line with the actual values from the data set [fig:13]. A closer look at the residual plots for
this model show that the variance in the data is maintained relatively well across values
[fig:14]. Reaching the higher values there may be a few outliers in the mix, but otherwise
fairly consistent.
25

8.2 Multiple Regression Analysis 8 RESULTS & ANALYSIS
Figure 13: Line Fit Plots Model 1B
Figure 14: Residual Plots Model 1B
26
8.2 Multiple Regression Analysis 8 RESULTS & ANALYSIS
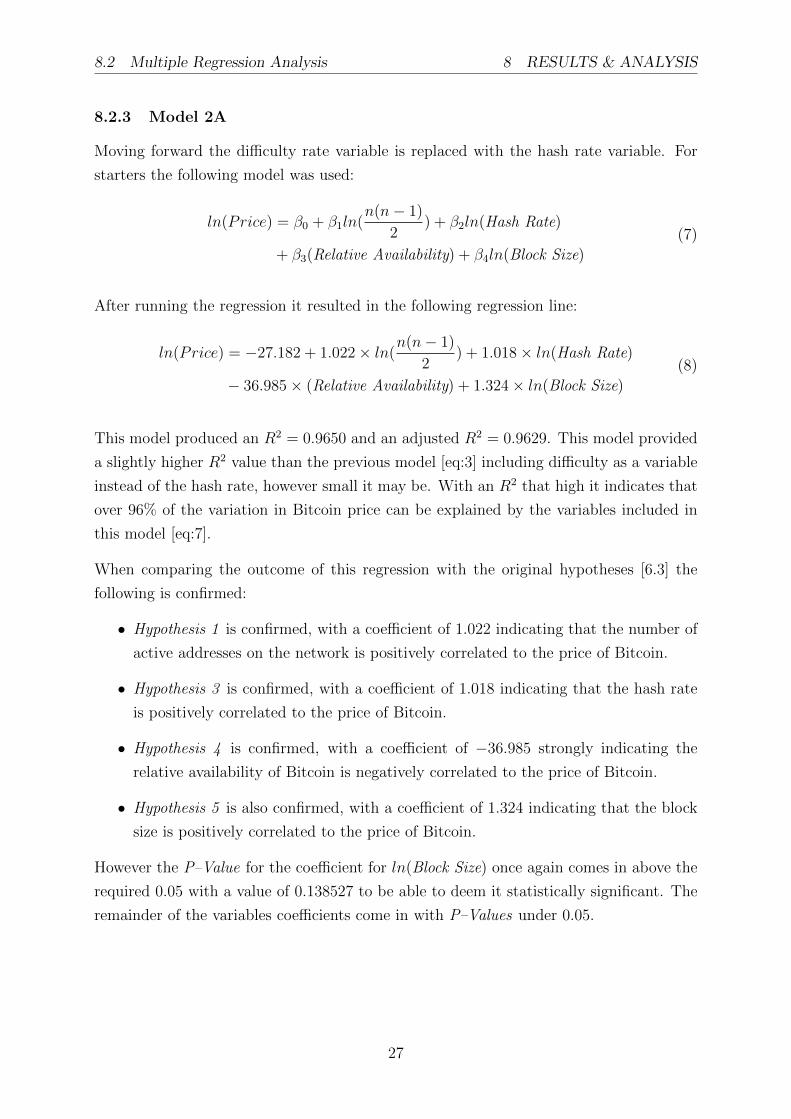
8.2.3 Model 2A
Moving forward the difficulty rate variable is replaced with the hash rate variable. For
starters the following model was used:
ln(Price) = β0 + β1ln(n(n− 1)
2) + β2ln(Hash Rate)
+ β3(Relative Availability) + β4ln(Block Size)
(7)
After running the regression it resulted in the following regression line:
ln(Price) = −27.182 + 1.022 × ln(n(n− 1)
2) + 1.018 × ln(Hash Rate)
− 36.985 × (Relative Availability) + 1.324 × ln(Block Size)
(8)
This model produced an R2 = 0.9650 and an adjusted R2 = 0.9629. This model provided
a slightly higher R2 value than the previous model [eq:3] including difficulty as a variable
instead of the hash rate, however small it may be. With an R2 that high it indicates that
over 96% of the variation in Bitcoin price can be explained by the variables included in
this model [eq:7].
When comparing the outcome of this regression with the original hypotheses [6.3] the
following is confirmed:
• Hypothesis 1 is confirmed, with a coefficient of 1.022 indicating that the number of
active addresses on the network is positively correlated to the price of Bitcoin.
• Hypothesis 3 is confirmed, with a coefficient of 1.018 indicating that the hash rate
is positively correlated to the price of Bitcoin.
• Hypothesis 4 is confirmed, with a coefficient of −36.985 strongly indicating the
relative availability of Bitcoin is negatively correlated to the price of Bitcoin.
• Hypothesis 5 is also confirmed, with a coefficient of 1.324 indicating that the block
size is positively correlated to the price of Bitcoin.
However the P–Value for the coefficient for ln(Block Size) once again comes in above the
required 0.05 with a value of 0.138527 to be able to deem it statistically significant. The
remainder of the variables coefficients come in with P–Values under 0.05.
27
8.2 Multiple Regression Analysis 8 RESULTS & ANALYSIS
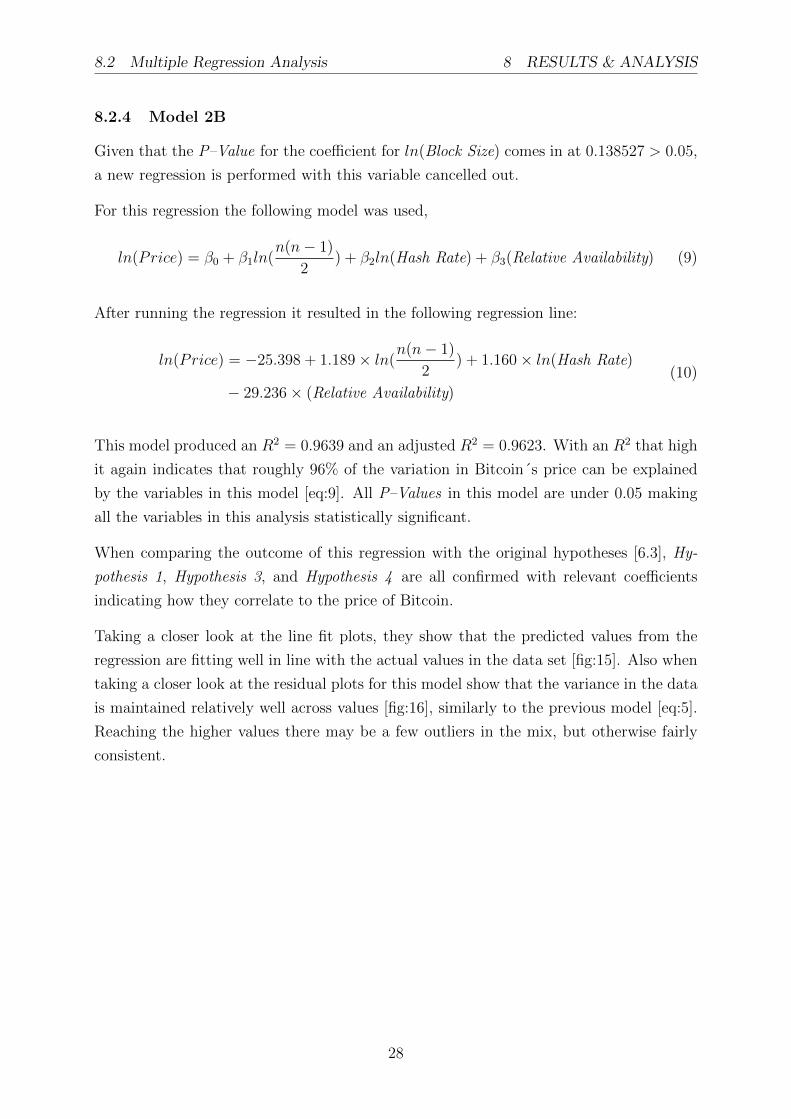
8.2.4 Model 2B
Given that the P–Value for the coefficient for ln(Block Size) comes in at 0.138527 > 0.05,
a new regression is performed with this variable cancelled out.
For this regression the following model was used,
ln(Price) = β0 + β1ln(n(n− 1)
2) + β2ln(Hash Rate) + β3(Relative Availability) (9)
After running the regression it resulted in the following regression line:
ln(Price) = −25.398 + 1.189 × ln(n(n− 1)
2) + 1.160 × ln(Hash Rate)
− 29.236 × (Relative Availability)
(10)
This model produced an R2 = 0.9639 and an adjusted R2 = 0.9623. With an R2 that high
it again indicates that roughly 96% of the variation in Bitcoin´s price can be explained
by the variables in this model [eq:9]. All P–Values in this model are under 0.05 making
all the variables in this analysis statistically significant.
When comparing the outcome of this regression with the original hypotheses [6.3], Hy-
pothesis 1, Hypothesis 3, and Hypothesis 4 are all confirmed with relevant coefficients
indicating how they correlate to the price of Bitcoin.
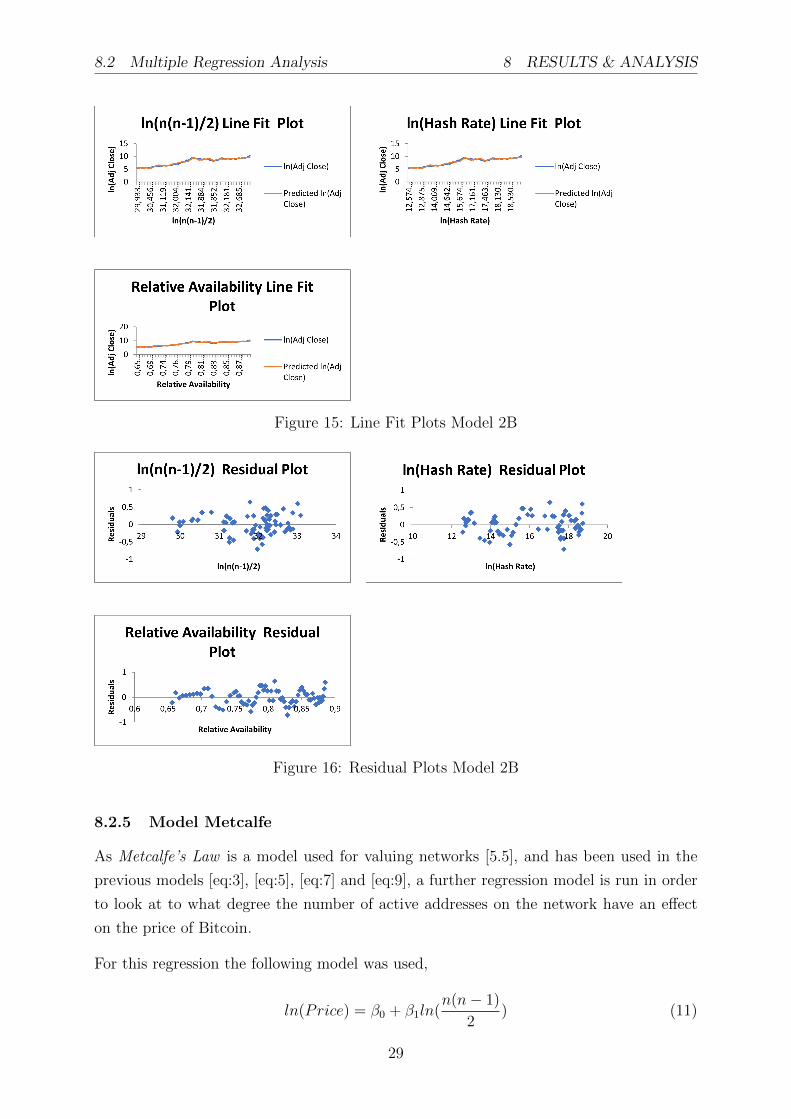
Taking a closer look at the line fit plots, they show that the predicted values from the
regression are fitting well in line with the actual values in the data set [fig:15]. Also when
taking a closer look at the residual plots for this model show that the variance in the data
is maintained relatively well across values [fig:16], similarly to the previous model [eq:5].
Reaching the higher values there may be a few outliers in the mix, but otherwise fairly
consistent.
28
8.2 Multiple Regression Analysis 8 RESULTS & ANALYSIS
Figure 15: Line Fit Plots Model 2B
Figure 16: Residual Plots Model 2B
8.2.5 Model Metcalfe
As Metcalfe’s Law is a model used for valuing networks [5.5], and has been used in the
previous models [eq:3], [eq:5], [eq:7] and [eq:9], a further regression model is run in order
to look at to what degree the number of active addresses on the network have an effect
on the price of Bitcoin.
For this regression the following model was used,
ln(Price) = β0 + β1ln(n(n− 1)
2) (11)
29
8.2 Multiple Regression Analysis 8 RESULTS & ANALYSIS
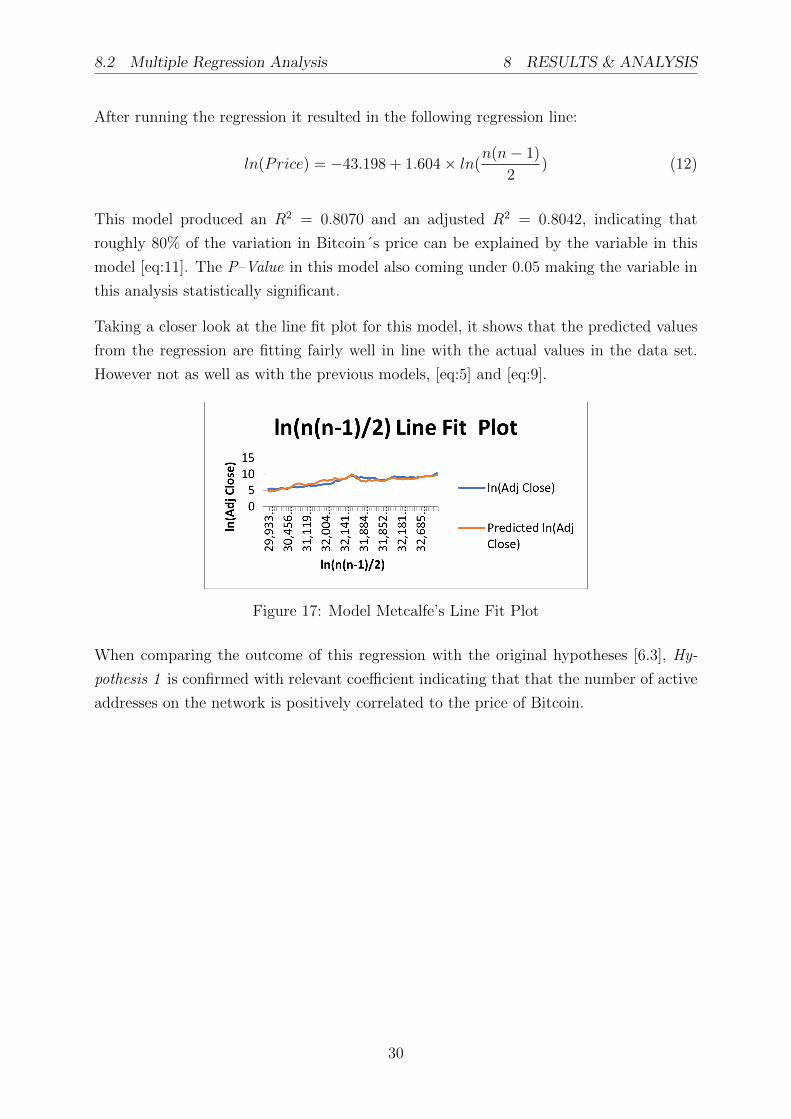
After running the regression it resulted in the following regression line:
ln(Price) = −43.198 + 1.604 × ln(n(n− 1)
2) (12)
This model produced an R2 = 0.8070 and an adjusted R2 = 0.8042, indicating that
roughly 80% of the variation in Bitcoin´s price can be explained by the variable in this
model [eq:11]. The P–Value in this model also coming under 0.05 making the variable in
this analysis statistically significant.
Taking a closer look at the line fit plot for this model, it shows that the predicted values
from the regression are fitting fairly well in line with the actual values in the data set.
However not as well as with the previous models, [eq:5] and [eq:9].
Figure 17: Model Metcalfe’s Line Fit Plot
When comparing the outcome of this regression with the original hypotheses [6.3], Hy-
pothesis 1 is confirmed with relevant coefficient indicating that that the number of active
addresses on the network is positively correlated to the price of Bitcoin.
30

9 CONCLUSION
9 Conclusion
The regressions models researched in this paper were able to determine approximately
96% of the variation in the price of Bitcoin from the chosen variables. This 96% comes
across in models: [eq:3], [eq:5], [eq:7] and [eq:9], after performing a multiple regression
analysis using up to four explanatory variables to predict the response variable Bitcoin’s
price.
The use of Metcalfe’s Law in this study has produced a variable for use in all the models,
performing consistently in all regressions, producing coefficients ranging between 1.022
and 1.249, always producing P–Values in under 0.05 making the variable in this analysis
statistically significant. Furthermore when looking primarily at the number of active
addresses on the network, based around Metcalfe’s Law, the regression produced a model
able to determine approximately 80% of the variation in the price of Bitcoin [eq:11]. These
findings both confirm the original hypothesis and remain consistent with the Metcalfe’s
Law in valuing networks. However using the number of active addresses alone in valuing
the network would be lacking, but instead requires further variables to produce a reliable
model to estimate the price.
When looking at the mining difficulty and the hash–rate, these variables could be used
interchangeably, both producing necessary P–Values to be deemed statistically significant.
Modeling the price change using the hash–rate as a variable produced a slightly better
model in this study. The use of both the difficulty level as well as the hash–rate both
produced models that confirmed the original hypothesis, stating that as the difficulty or
hash–rate increases, miners would have to deem it profitable in order to continue mining
and would therefor be positively correlated to the price of Bitcoin.
When looking from the perspective of the Law of Diminishing Marginal Utility [5.3], as
well as Commodity Theory [5.4], the researched models did indeed find that the relative
availability of Bitcoin has a great effect on its price, with coefficients for the variable
in the models ranging from approximately −29 to approximately −40. As the relative
availability increases this has a great negative effect on the price of Bitcoin, which both
confirms the original hypothesis and remains consistent with the presented theories.
9.1 Answer to Research Questions
When looking at Bitcoin’s inner workings this study was able to find certain factors that
make up Bitcoin and its network that were influential on the value of Bitcoin. These
factors included the number of active addresses, hash–rate, difficulty level, the relative
availability and the block size. All these factors apart from the block size were statistically
31
9.2 Further Suggested Study 9 CONCLUSION
significant in the models for this study. This study is therefor able to determine that the
following factors that make up Bitcoin and its network are driving factors for the value
of Bitcoin:
• Number of Active Addresses
• Hash–Rate
• Difficulty Level
• Relative Availability
With most of the models producing R2 values over 96% it is interesting that despite all
the volatility that Bitcoin experiences in short–term price fluctuations, Bitcoin can still
in the long–run base its value off of its own internal functions and processes which are
fairly basic in nature and fairly predictable, also highly available to all users to observe.
A fault that may exist in the data that is worth of noting is that one cannot know exactly
the amount of Bitcoin in circulation. For example people have lost their personal keys,
people may have died without transferring their keys etc.
9.2 Further Suggested Study
Further study on this topic may be to focus on external market influences on the price
of cryptocurrencies, both long–term and short–term. Especially in the short–term as
Bitcoin as well as the other cryptocurrencies do experience large fluctuations in price
quite regularly.
With more influential actors entering the market of cryptocurrencies, it would also be
worth looking at the effect they have on the price of Bitcoin. A question worth researching
would be ”how decentralised can a cryptocurrency be with highly influential investors
influencing its price?”.
32
REFERENCES REFERENCES
References
Bitcoin.org. (2021). Https://bitcoin.org/en/.
Blockchain. (2021). Https://www.blockchain.com/.
Bouoiyour, J., & Selmi, R. (2016). Bitcoin: A beginning of a new phase? Economics
Bulletin, 36 (3).
Carter, J., & Wegman, M. (1979). Universal classes of hash functions. Journal of Computer
and System Sciences, 18 (2), 143–154.
Coinmarketcap.com. (2021). Https://coinmarketcap.com/.
Doyle, C. (2016). A dictionary of marketing (4 ed). Oxford University Press.
Garcia, D., Tessone, C. J., Mavrodiev, P., & Perony, N. (2014). The digital traces of
bubbles: Feedback cycles between socio-economic signals in the bitcoin economy.
J. R. Soc. Interface, 11 (99).
Glassnode. (2021). Https://glassnode.com/.
Jaggia, S., & Kelly, A. (2015). Business statistics: Communicating with numbers (2 ed).
McGraw–Hill Education.
Kristoufek, L. (2013). Bitcoin meets google trends and wikipedia: Quantifying the rela-
tionship between phenomena of the internet era. Scientific Reports, 3 (3415).
Kubat, M. (2015). Virtual currency bitcoin in the scope of money definition and store of
value. Procedia Economics and Finance, 30, 409–416.
Lewis, P. (2019). Bitcoin is not backed by nothing.
Lynn, M. (1991). Scarcity effects on value: A quantitative review of the commodity theory
literature. Psychology & Marketing, 8 (1), 43–57.
Metcalfe, B. (2013). Metcalfe’s law after 40 years of ethernet. Computer, 46 (12), 26–31.
Nakamoto, S. (2008). Bitcoin: A peer-to-peer electronic cash system.
Sovebetov, Y. (2018). Factors influencing cryptocurrency prices: Evidence from bitcoin,
ethereum, dash, litcoin, and monero. Journal of Economics and Financial Analysis,
2 (2), 1–27.
Velde, F. R. (2013). Bitcoin: A primer. Chicago Fed Letter, (317).
Woo, D., Gordon, I., & Iaralov, V. (2013). Bitcoin: A first assessment. FX and Rates.
33

REFERENCES REFERENCES
Yahoo Finance. (2021). Https://finance.yahoo.com/quote/btc-usd/.
Yermack, D. (2015). Is bitcoin a real currency? an economic appraisal. Handbook of Digital
Currency, 31–44.
34