drug shortages, pricing, and regulatory activity · 2016-12-07 · drug shortages, pricing, and...
TRANSCRIPT
NBER WORKING PAPER SERIES
DRUG SHORTAGES, PRICING, AND REGULATORY ACTIVITY
Christopher Stomberg
Working Paper 22912http://www.nber.org/papers/w22912
NATIONAL BUREAU OF ECONOMIC RESEARCH1050 Massachusetts Avenue
Cambridge, MA 02138December 2016
I would like to thank David Kreling, Ernie Berndt, Rena Conti, Neeraj Sood, and other participants in the NBER-CRIW workshop (October, 2013) for their helpful comments on an earlier draft of this paper. I would also like to thank Erin Fox at the University of Utah Drug Information Service for kindly offering me data on shortages. Finally I would like to thank Eric Barrette for his research assistance on aspects of this paper. The views expressed herein are those of the author and do not necessarily reflect the views of the National Bureau of Economic Research.
NBER working papers are circulated for discussion and comment purposes. They have not been peer-reviewed or been subject to the review by the NBER Board of Directors that accompanies official NBER publications.
© 2016 by Christopher Stomberg. All rights reserved. Short sections of text, not to exceed two paragraphs, may be quoted without explicit permission provided that full credit, including © notice, is given to the source.

Drug Shortages, Pricing, and Regulatory ActivityChristopher StombergNBER Working Paper No. 22912December 2016JEL No. I11,L11,L5
ABSTRACT
This study examines the patterns and causes of shortages in generic non-injectable drugs (e.g., tablets and topicals) in the United States. While shortages for injectable drugs have garnered more attention, shortages of other forms of prescription drugs have also been on the increase. In fact, they follow a strikingly similar trend with a number of important tablet drugs having recently been affected by shortage. This poses important questions about the root causes of these trends since most explanations found in the literature are specific to generic injectable drugs. Using a simple heuristic framework, three contributing factors are explored: regulatory oversight, potential market failures in pricing/reimbursement, and competition. This paper features an empirical examination of the contribution of changes in regulatory oversight to drug shortages. A pooled dynamic regression model using FDA data on inspections and citations reveals a statistically significant relationship between FDA regulatory activity (inspections and citations) and drug shortage rates. This result cuts across both injectable and non-injectable drugs, and could reveal a transition in equilibrium quality that should be transitory in nature, but it should also be interpreted with care given the other factors likely affecting shortage rates.
Christopher StombergBates White Economic [email protected]
DRUG SHORTAGES, PRICING, AND REGULATORY ACTIVITY
CHRISTOPHER STOMBERG, PH.D.
Abstract. This study examines the patterns and causes of shortages in generic
non-injectable drugs (e.g., tablets and topicals) in the United States. While
shortages for injectable drugs have garnered more attention, shortages of other
forms of prescription drugs have also been on the increase. In fact, they fol-
low a strikingly similar trend with a number of important tablet drugs having
recently been affected by shortage. This poses important questions about the
root causes of these trends since most explanations found in the literature
are specific to generic injectable drugs. Using a simple heuristic framework,
three contributing factors are explored: regulatory oversight, potential market
failures in pricing/reimbursement, and competition. This paper features an
empirical examination of the contribution of changes in regulatory oversight
to drug shortages. A pooled dynamic regression model using FDA data on in-
spections and citations reveals a statistically significant relationship between
FDA regulatory activity (inspections and citations) and drug shortage rates.
This result cuts across both injectable and non-injectable drugs, and could re-
veal a transition in equilibrium quality that should be transitory in nature, but
it should also be interpreted with care given the other factors likely affecting
shortage rates.
1. Introduction
Researchers and policy-makers have devoted considerable attention in recent
years to the increasing frequency and longevity of drug shortages in the United
States. Many high-profile shortages have involved generic injectable drugs that are
the front line treatments in important areas such as cancer where lack of availability
Date: 5/2014 .
I would like to thank David Kreling, Ernie Berndt, Rena Conti, Neeraj Sood, and other
participants in the NBER-CRIW workshop (October, 2013) for their helpful comments on an
earlier draft of this paper. I would also like to thank Erin Fox at the University of Utah Drug
Information Service for kindly offering me data on shortages. Finally I would like to thank Eric
Barrette for his research assistance on aspects of this paper.
1

2 CHRISTOPHER STOMBERG, PH.D.
is literally a life-or-death issue for patients. Much of the research on the causes of
these shortages has reasonably focused on contributing factors specific to these
high-profile shortages, such as the micro structure of the generic injectable drug
industry and Medicare reimbursement (see e.g. Conti & Berndt [2]; Yurukoglu [15];
Woodcock & Wosinska [14]).
As noted in Conti & Berndt, however, shortages do occur for other types of drugs.
While these shortages are less frequent and have generally received less attention
in the press and academic research, they have also followed a similar trend. In
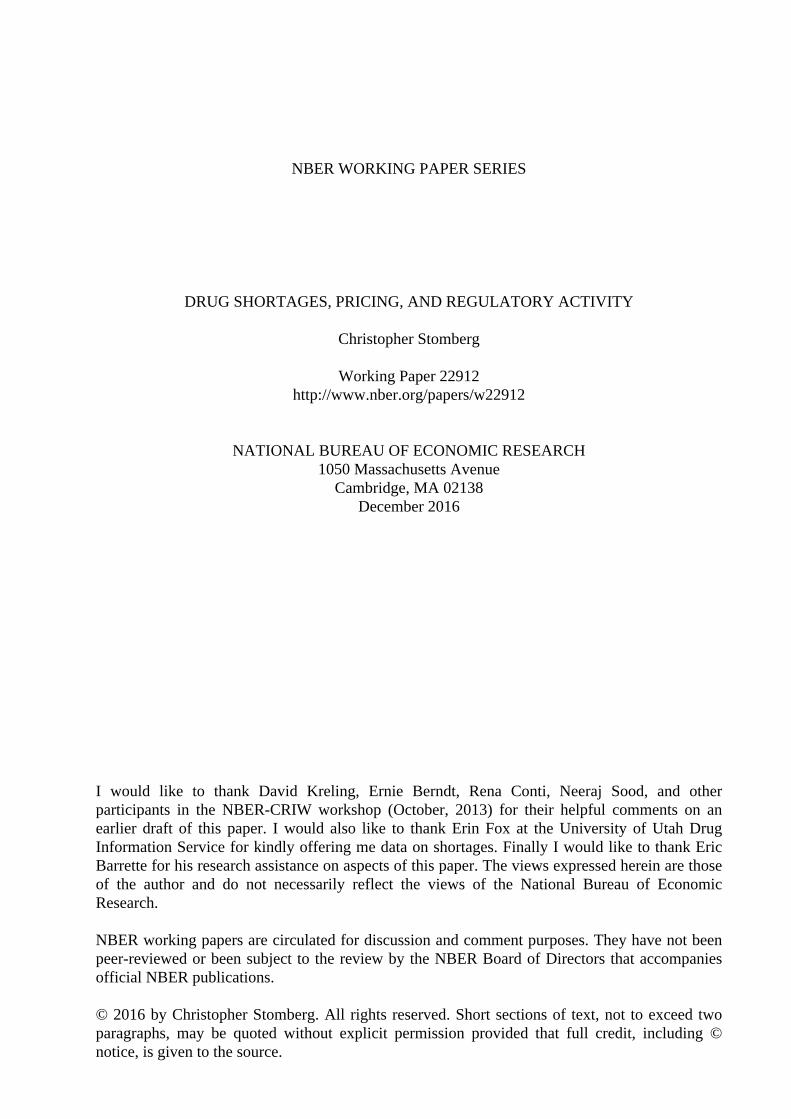
fact, as illustrated in Figure 1 using data obtained from the University of Utah
Drug Information Service (UUDIS), the pattern of ongoing shortages is strikingly
similar for both types of drug.1 Although a clear level difference can be read off
the y-axes of this graph, the correlation between the number of ongoing injectable
and non-injectable shortages is 0.94. Of concern, of course is the nearly four-fold
increase in the number of ongoing shortages between 2007 and 2013.
There are also distinctive, and again very similar, patterns in the average length
of ongoing drug shortages over time for both injectable and non-injectable drugs
(see Figure 2). The correlation in these series is 0.89. Although the timing of the
increase in average shortage length is more recent (beginning in 2008), this measure
has nearly doubled in recent years.
The similarities demonstrated in Figures 1 and 2 are not simply an artifact of
tracking the stock of drugs in shortage.2 In fact, as shown in Figure 3, the number
of new shortages reported for both injectable and non-injectable drugs on a monthly
basis also follows a strikingly similar pattern.3 Although the correlation between
raw new shortage starts for injectable drugs and non-injectable drugs is lower, at
around 0.48, there is also considerable noise in these data. Smoothing the series
using a quarterly moving average (as depicted in Figure 3) reveals a clear coherence
in the patterns of shortage.
1The UUDIS which track reported shortages are described in greater detail in Section 3.1.2Since the previous charts measure stock variables (number of shortages in progress), there is a
likelihood that high correlations could be induced by the summing process inherent in computing
stocks.3Also note that the rate of new shortages in early years does not exhibit the steep ramp up
over time exhibited in the two stock variables. This pattern is consistent with the way the stock
variables are being calculated.
DRUG SHORTAGES, PRICING, AND REGULATORY ACTIVITY 3
Figure 1. Pattern of unresolved shortages
Correlation: 0.937
020
4060
8010
0U
nres
olve
d sh
orta
ges
050
100
150
200
Unr
esol
ved
shor
tage
s
2001 2002 2003 2004 2005 2006 2007 2008 2009 2010 2011 2012 2013
Parenteral Non−parenteral
Non
−pa
rent
eral
Par
ente
ral
Source: University of Utah Drug Information Service (UUDIS). Vertical axis measures
the number of drugs (typically molecule-form combinations) reported to be in ongoing
shortage during that month. Note that early-period data are truncated on the left, and
thus do not accurately reflect the actual number of shortages in progress at the time the
database was initially constructed.
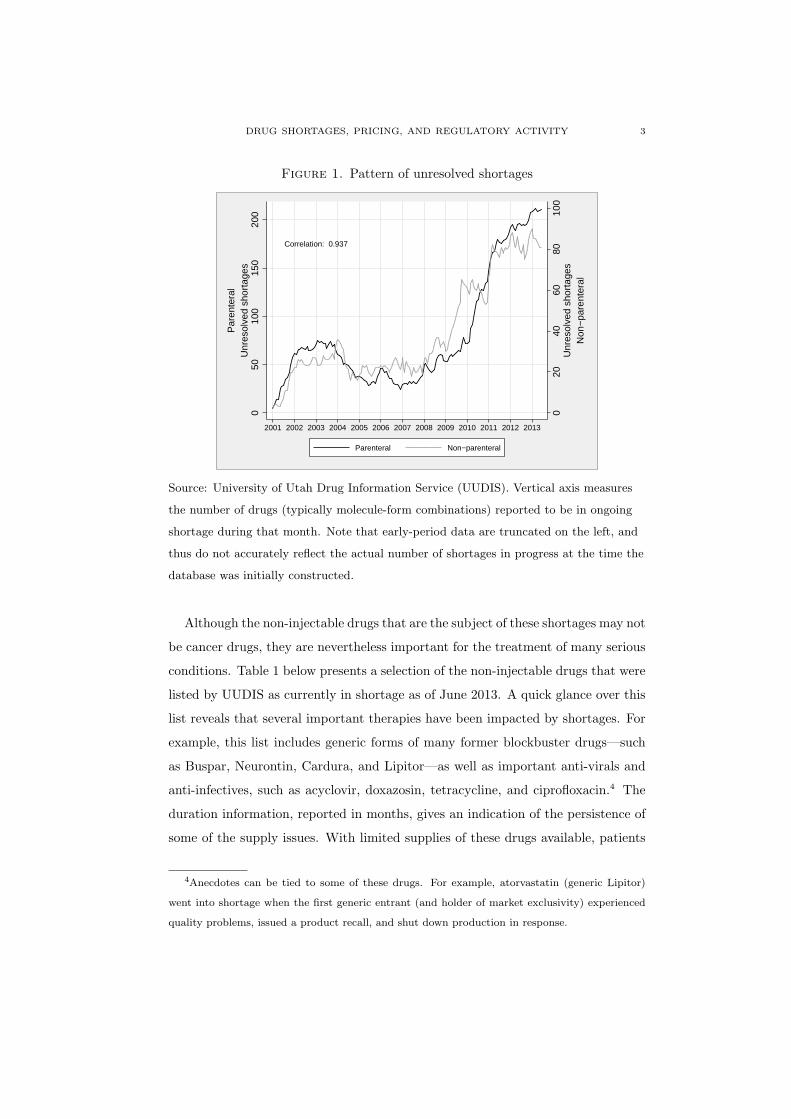
Although the non-injectable drugs that are the subject of these shortages may not
be cancer drugs, they are nevertheless important for the treatment of many serious
conditions. Table 1 below presents a selection of the non-injectable drugs that were
listed by UUDIS as currently in shortage as of June 2013. A quick glance over this
list reveals that several important therapies have been impacted by shortages. For
example, this list includes generic forms of many former blockbuster drugs—such
as Buspar, Neurontin, Cardura, and Lipitor—as well as important anti-virals and
anti-infectives, such as acyclovir, doxazosin, tetracycline, and ciprofloxacin.4 The
duration information, reported in months, gives an indication of the persistence of
some of the supply issues. With limited supplies of these drugs available, patients
4Anecdotes can be tied to some of these drugs. For example, atorvastatin (generic Lipitor)
went into shortage when the first generic entrant (and holder of market exclusivity) experienced
quality problems, issued a product recall, and shut down production in response.

4 CHRISTOPHER STOMBERG, PH.D.
Figure 2. Average age of unresolved shortages
Correlation: 0.885
05
1015
Ave
rage
age
(in
mon
ths)
to d
ate
05
1015
2025
Ave
rage
age
(in
mon
ths)
to d
ate
2001 2002 2003 2004 2005 2006 2007 2008 2009 2010 2011 2012 2013
Parenteral Non−parenteral
Non
−pa
rent
eral
Par
ente
ral
Source: University of Utah Drug Information Service (UUDIS). Vertical axis measures
the average age (in months) of drugs reported to be in ongoing shortage during that
month. Note that early-period data are truncated on the left, and thus do not accurately
reflect the actual length of shortages in progress at the time the database was initially
constructed.
have likely faced delays, interruptions, or substitutions in their therapies - with
potentially adverse effects.
These trends in non-injectable drug shortages are highly relevant to an over-
all understanding of the causes of shortages — not just for non-injectable drugs.
Whatever factors explain these trends over time, they clearly apply equally and
with the same rough timing in both markets. Theories that rely on Medicare reim-
bursement policies — such as ASP-based Medicare Part-B reimbursement — may
serve to explain level differences in shortage rates, but simply don’t apply to non-
injectable drugs and aren’t likely to explain the consistent pattern of change over
time. Similarly, theories that rely on the specifics of generic injectable production
don’t apply to non-injectables. Although there may exist analogues to those stories
in the tablet manufacturing sector, the market-wide nature of these trends seems
to lend greater weight to theories suggesting broader causes such as changes in

DRUG SHORTAGES, PRICING, AND REGULATORY ACTIVITY 5
Figure 3. Drug shortage starts
Correlation: 0.484
05
1015
New
sho
rtag
es (
1 qt
r sm
ooth
ing)
05
1015
New
sho
rtag
es (
1 qt
r sm
ooth
ing)
2001 2002 2003 2004 2005 2006 2007 2008 2009 2010 2011 2012 2013
Parenteral Non−parenteral
Non
−pa
rent
eral
Par
ente
ral
Source: University of Utah Drug Information Service (UUDIS). Vertical axis measures
the monthly number of newly reported drugs in shortage smoothed using a quarterly
moving average (current month plus previous two months). Reported correlation is
based on non-smoothed data.
competition, market structure, and quality monitoring — effects that might be felt
across both markets.
This study explores some of the alternative explanations that potentially have
common influence on both markets. Section 2 presents a review of current literature
on drug shortages, along with a heuristic framework for understanding and predict-
ing the potential effects of alternative influences on supply, demand, and ultimately
shortage conditions. Section 3 explores (using econometric models) whether changes
in quality monitoring by the FDA (e.g. more frequent inspections and citations of
manufacturers) can be connected with shortages. Although this is an explanation
that could potentially apply across both markets, and has been advanced by recent
studies and position papers (e.g., GAO [11]; Committee Staff Report [13]), it has
not been given rigorous empirical treatment in the past. Section 4 closes with a
discussion of the empirical results of this paper in a broader context.
Ultimately, although there may be no single “cause” of drug shortages, one thing
is certain: the overwhelming majority of shortages affect generic drugs. The key

6 CHRISTOPHER STOMBERG, PH.D.
Table 1. Selected non-injectable drugs in shortage (UUDIS June, 2013)
drug name Duration (mos.) Notified date
CARBAMAZEPINE XR TABS 0 04jun2013
GABAPENTIN ENCARBIL 2 16apr2013
CORTISONE TABLETS 3 29mar2013
ACYCLOVIR SUSPENSION 5 29jan2013
ATORVASTATIN 7 26nov2012
DOXYCYCLINE ORAL 7 26nov2012
PANTOPRAZOLE TABLETS 7 29nov2012
RESERPINE 9 26sep2012
DOXAZOSIN TABLETS 9 12sep2012
BUSPIRONE 9 21sep2012
ESTRADIOL TABLETS 9 18sep2012
METHOTREXATE TABLETS 10 20aug2012
BUPRENORPHINE SL TABS 18 29dec2011
NALTREXONE TABLETS 18 15dec2011
TETRACYCLINE CAPSULES 27 04apr2011
ACYCLOVIR TABLETS 44 23oct2009
CIPROFLOXACIN 500 MG TABLETS 45 14oct2009
difference between brand and generic drugs is the low margin available on generic
drugs — particularly for those drugs that have been on the market for some time.
With such low margins available, it is perhaps inevitable that shortages would result
in a market where manufacturers may face weaker incentives to make investments
in order to avoid supply disruptions. The United States may simply be a victim
of its own success at creating an extremely competitive and price-sensitive market
for generic drugs. The policy question, therefore, is whether (and how) the market
could be shifted to an equilibrium that endogenously provides a desired level of
quality and supply reliability without disruption.

DRUG SHORTAGES, PRICING, AND REGULATORY ACTIVITY 7
2. Background
This section presents a sketch of some theoretical considerations underpinning
the empirical work undertaken in this study.
2.1. Market incentives for generic manufacturers. It is important to recog-
nize the role that the institutional structure of the U.S. generic market plays in
creating conditions that are ripe for shortages. In particular, the notion of near-
perfect substitutability of AB-rated generic drugs is built into the entire system.
Many pharmacies and patients are compelled by payers to substitute the use of a
generic product in lieu of the branded drug if one is available. And, by extension,
generics are almost universally treated as perfect substitutes by the market. Phar-
macy purchasing agents are free to select among competing manufacturers’ products
in order to meet their pharmacists’ needs to fill prescriptions for a particular drug,
so long as they are all approved AB-rated alternatives. Patients at a pharmacy
generally only become aware of the manufacturer of their generic pills once they
receive the bottle at the counter. They may receive the same manufacturer’s prod-
uct at the next refill, or they might not, depending on where the pharmacy (or
its wholesaler) is sourcing its product at that time. There is very little either the
patient, the doctor, or the pharmacist behind the counter can do to exert supplier
preferences among generic drugs under the current market structure.5
This institutionalization of near perfect substitutability is, in fact, quite a rare
phenomenon in markets. Even so-called commodities like wheat, corn, or oil have
grading systems. This is not the case for generic pharmaceuticals.
Both quality/purity of product and reliability of supply are costly attributes for
the manufacturer to provide, and they are generally invisible to buyers. Without
FDA inspections and the occasional supply disruption, these characteristics are
generally obscure to the market. Nevertheless, it is reasonable to assume that
these are characteristics that enter into demand, and would affect prices if they
were routinely observable and could be traded upon. In many markets where these
attributes are observable, a premium is paid for them. However, as Woodcock
5Of course there are exceptions to this stylized story, for example in the case of narrow ther-
apeutic index drugs where slight differences in bio-activity levels in different products are known
to adversely affect patients switching among products.
8 CHRISTOPHER STOMBERG, PH.D.
and Wosinska [14] point out, these attributes are not readily observable for generic
pharmaceuticals, so it is difficult to pay a premium for them.6
One of the key consequences of this institutionalized substitutability is the “near
Bertrand” price competition among manufacturers participating in these markets.7
In a market where suppliers are often asked to meet or beat the price of the compe-
tition to win a supply contract, price is set almost auction-style. Wholesalers can
switch suppliers and reduce prices with a few phone calls.
These markets have delivered billions of units of thousands of products at prices
often in the low single-digit pennies per pill range, so much of this story is one of
great success for consumers.
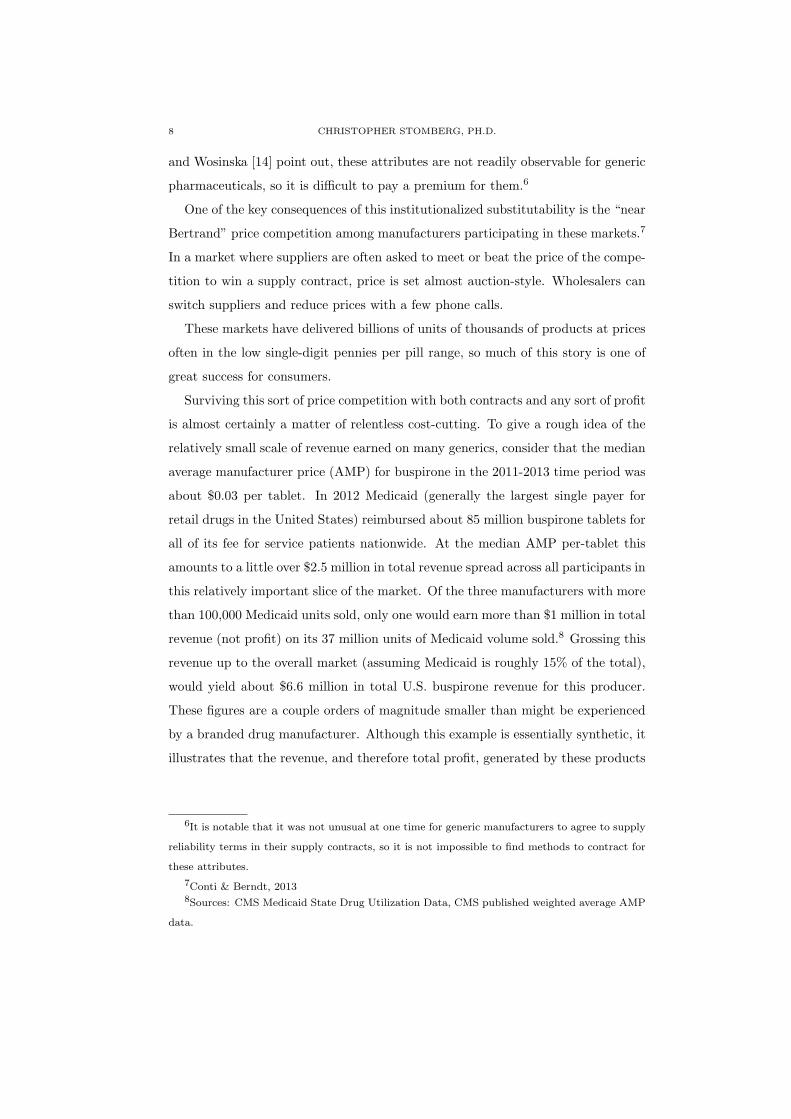
Surviving this sort of price competition with both contracts and any sort of profit
is almost certainly a matter of relentless cost-cutting. To give a rough idea of the
relatively small scale of revenue earned on many generics, consider that the median
average manufacturer price (AMP) for buspirone in the 2011-2013 time period was
about $0.03 per tablet. In 2012 Medicaid (generally the largest single payer for
retail drugs in the United States) reimbursed about 85 million buspirone tablets for
all of its fee for service patients nationwide. At the median AMP per-tablet this
amounts to a little over $2.5 million in total revenue spread across all participants in
this relatively important slice of the market. Of the three manufacturers with more
than 100,000 Medicaid units sold, only one would earn more than $1 million in total
revenue (not profit) on its 37 million units of Medicaid volume sold.8 Grossing this
revenue up to the overall market (assuming Medicaid is roughly 15% of the total),
would yield about $6.6 million in total U.S. buspirone revenue for this producer.
These figures are a couple orders of magnitude smaller than might be experienced
by a branded drug manufacturer. Although this example is essentially synthetic, it
illustrates that the revenue, and therefore total profit, generated by these products
6It is notable that it was not unusual at one time for generic manufacturers to agree to supply
reliability terms in their supply contracts, so it is not impossible to find methods to contract for
these attributes.
7Conti & Berndt, 20138Sources: CMS Medicaid State Drug Utilization Data, CMS published weighted average AMP
data.
DRUG SHORTAGES, PRICING, AND REGULATORY ACTIVITY 9
can be quite limited. Staying profitable on the margin at these levels clearly presents
a challenge.
Another thing that has to be recognized is that the typical modern generic
manufacturer has literally hundreds of products on the market at any one time.
Unlike brand manufacturers that may have a few key products on the market that
are responsible for a significant fraction of their total revenue and profit, a generic
manufacturer’s revenues are frequently spread across a diffuse array of products.
Their greatest profits are generally earned early in the evolution of the market post-
patent expiration. Once price competition has had its relentless effect on prices for
more mature generic products, revenues and profits for individual products may not
make a large contribution to the bottom line of the company. They may continue
selling these products if marginal costs are low, or if there are economies of scope
associated with producing or selling a broad array of products.
It should therefore be little surprise, however, that when generic manufacturers
are faced with supply disruptions of any magnitude on older low-margin products,
they might not find it worthwhile to address them quickly, or at all.9 For exam-
ple, it is not hard to imagine a production situation where some manufacturers’
cost-cutting efforts could lead to a reduction in maintenance or product quality
investments. Even if this ultimately results in a stoppage due to production-line
failures, or regulatory interventions, this behavior may be optimal from the man-
ufacturer’s standpoint. This is a classic “race to the bottom” in both price and
quality. If the current costs of plant maintenance and product quality investment
exceeds the discounted expected value of lost profits due to a shutdown, then they
are not worth undertaking. An option-value approach such as presented by Yu-
rukoglu [15] would offer a refinement to this logic, but perhaps not a fundamentally
different result. Once faced with the realization of a negative supply shock (such as
product withdrawal or production line failure), the manufacturer may easily find
9The investment under uncertainty approach explored by Yurukoglu (2012 [15]) is potentially
quite relevant in this context.

10 CHRISTOPHER STOMBERG, PH.D.
higher returns to investment in, e.g., bringing a new Abbreviated New Drug Appli-
cation (ANDA) product to market than attempting to resuscitate an older product
for which prices may be limited.10
In short, there are several reasons to expect that generic supply could be in-
herently riskier than branded drug supply — particularly for low-priced “mature”
products. As the first waves of blockbuster generics fade into the distant past, and
the ranks of mature products on the production lists of manufacturers swell, it is
not far-fetched to believe that the trend in observed shortages could be partly a
result of this trend. These are also trends that would generally affect both markets
for injectable and non-injectable drugs.
2.2. Regulatory activity—quality/purity concerns. Regulatory involvement
may also have a role to play in drug shortages. Of particular interest are changes
in policy, and time-inconsistent policies. In a market where product quality is not
generally observable, but the actions of the regulator are, these actions may play
an important role in setting expectations of both buyers and sellers in the market.
Suppose that the regulator, in this case the FDA, advertises that only a certain
level of quality is permissible, and products below that threshold will not be allowed
onto the market. If monitoring is perfect, then the presence of the product on
the market is a clear signal that its quality is above the advertised regulatory
threshold. Differentiation of quality above that threshold may not be worthwhile
because additional investments in quality by the seller would be lost on buyers
that only observe market presence as opposed to quality. The profit-maximizing
decision of producers in this situation may be to undertake only those expenses
required to pass the regulator’s threshold and no more — leading to a generally
consistent level of quality. This highlights the important role of the regulator in
setting quality levels in markets where quality is otherwise unobservable. Were
product quality an observable attribute, manufacturers might find it optimal to
differentiate by optimizing around different levels of observable quality.11
10Prescription generic drug manufacturers must receive FDA approval via an ANDA before
marketing each product.11In this way, manufacturers might face a downward sloping demand for their product similar
to the situation explored in Dorfman & Steiner [3].

DRUG SHORTAGES, PRICING, AND REGULATORY ACTIVITY 11
In reality, the FDA does not have perfect oversight. Instead, it might inspect
facilities at a known rate of probability. The manufacturer facing this uncertainty
may well pick a level of quality that is below the advertised threshold if the probabil-
ity of future inspection is less than one. In the limit, if the probability of inspection
is zero, then investments in quality might only rise to a level such that manufactur-
ing does not generate observable defects (like malformed pills, broken packaging,
etc.) that could lead to consumer-led actions against the company. Whatever the
probability of inspection, so long as it is the same for all manufacturers, and all
manufacturers believe it to be the same, then all will target roughly the same level
of quality and buyers will experience a consistent level of quality possibly some-
what below the advertised threshold. This intuition serves to explain the tendency
of regulators such as the FDA and local health authorities to set relatively stringent
goals.
As a hypothetical matter, manufacturers may assign different probabilities to
the possibility of detection, and/or may be risk averse to varying degrees, which
could lead them to pick heterogeneous levels of quality. For example, risk averse
companies that believe in a high probability of inspection may feel compelled to
make greater investments in quality, while those companies with less aversion to
risk, or having a low assessment of the risk of inspection might be tempted to spend
less on quality. To the extent that such heterogeneity in cost structures exists —
particularly if it translates to differences in marginal cost — an adverse selection
problem could arise. If competition is Bertrand-like, then the producers most likely
to survive in the market are those that are most willing to take a risk with low
spending on quality giving them a low marginal cost and an advantage in price
competition.
Even if the relatively risk-loving low-cost firms were eventually inspected and
shut down, the consequences could be substantial in this scenario if they have
already edged out higher quality competition, and there is no alternative higher-
quality supply available.
Setting clear expectations and time-consistent quality monitoring policies are
key ingredients in this framework. If the regulator sets expectations both about
the probability of inspection and the quality threshold in one period, but then

12 CHRISTOPHER STOMBERG, PH.D.
changes one or the other of these subsequently, it could potentially cause either
disruption or time-inconsistency issues. Suppose, for example, that the regulator
raises the probability of inspection in a period subsequent to the period when man-
ufacturers set their quality investment decisions. Caught off-guard with inadequate
quality more frequently than expected, manufacturing would be subject to excess
disruptions — i.e. shortages might occur. Now suppose the regulator in this cir-
cumstance alters its threshold downward to prevent excess disruptions. In this case
the regulator has set up a time-inconsistency problem. Manufacturers, now know-
ing that the regulator’s threat regarding attaining the threshold quality level is not
credible, will likely take that into account in their future investments.
In short, absent observable quality, the FDA has an important role to play in set-
ting equilibrium quality. To the extent that it may seek to raise equilibrium quality
by raising either standards or (possibly more likely) the probability of inspection
and detection of quality lapses, then a certain level of disruption is to be expected
if some manufacturers are optimized around a different expectation of quality. To
the extent that the Bertrand-like competition model is right, and some manufac-
turers moreover feel they face weak incentives to address supply issues with older
low-cost drugs, then these disruptions could well be persistent. On the other hand,
manufacturers may choose to address the issues that arise and re-enter the market.
To the extent this raises costs, it would only be supportable under an expectation
of higher future prices to support that cost structure.
Altered inspection rates, to the extent that they reflect exogenous regime changes,
are thus a plausible factor that could contribute to increased shortage rates (at least
in the short run), and this would be an effect likely to cut across both injectable
and tablet drug markets.12
One example of a clearly articulated regime-change is the recent implementation
of the Generic Drug User Fee Act (GDUFA). This act, which set a new structure
12Alternatively, one can imagine that unchanging inspection rates and rules could result in
an endogenous indicator of the evolving quality decisions of manufacturers if these patterns take
time to play out. For example, as price competition lowers spending on quality unobservables,
more firms would trip the wire when they are inspected. This might predict changes in the rate
of enforcement action given an inspection, but it is less clear whether this would predict a trend
in inspections.

DRUG SHORTAGES, PRICING, AND REGULATORY ACTIVITY 13
of fees for the review of generic drug ANDAs, was intended in part to provide
additional resources to the FDA for inspections. In fact, according to the FDA’s
Generic Drug User Fee Act Program Performance Goals and Procedures, “FDA
will conduct risk-adjusted biennial CGMP surveillance inspections of generic API
and generic finished dosage form (FDF) manufacturers, with the goal of achieving
parity of inspection frequency between foreign and domestic firms in FY 2017.”13
There two important aspects of this program goal: (1) the apparent recognition by
FDA that inspection rates have not been at parity, and (2) the pre-announcement
of the new inspection goals. The former suggests a real change in inspection regime
for foreign manufacturers, while the latter should inform industry expectations and
possibly smooth the transition.
2.3. Prices and shortages. Traditional economic explanations for shortages gen-
erally rest on price inflexibility as a key element of the story. In a standard neo-
classical setting, “shortage” is a very short-run disequilibrium phenomenon caused
by supply or demand shocks that are quickly corrected by upward price movements
that serve to re-equilibrate supply and demand. Real shortages, where demand ex-
ceeds supply at going prices for extended periods of time, are generally considered
to be a product of market failure: typically related to upward price inflexibility —
“sticky” prices.
ASPE’s 2011 Issue Brief [8] points to some of the basic supply and demand con-
ditions that apply pharmaceutical markets. In particular, both demand and supply
are price inelastic (particularly in the short-run). For suppliers, these inelasticities
generally stem from institutionally-driven requirements for approval of new manu-
facturing facilities and production lines as well as technological obstacles to adding
capacity. For patients, the combination of medical necessity for these products and
the fact that neither they, nor their doctors generally pay market prices for these
products would generally argue for low responsiveness of demand to changes in
price.14
13See: http://www.fda.gov/downloads/ForIndustry/UserFees/GenericDrugUserFees/UCM282505.pdf14Third-party payers generally attempt to induce some price responsiveness in patients through
utilization management tools like tiered copayments or prior authorization. Although these are
effective at steering patients from more expensive brands to cheaper therapeutic alternatives, they
are also a blunt tool. For example, a patient’s copayment for a generic drug is generally lower

14 CHRISTOPHER STOMBERG, PH.D.
Taken together, these conditions would potentially be a recipe for very large
price increases in response to adverse supply shocks.15
But, there may be some contravening institutional factors. One might, for exam-
ple, look at contracts as a standard explanation for why prices might move slowly
upward in the presence of a supply shock. One of the most important types of con-
tracts on this market are those governing how pharmacies are paid (reimbursement)
for drugs by third party payers. A theory that has been expressed in popular press
ties changes in Medicare reimbursement policies to increased shortage rates. Under
that theory, Medicare’s 2005 transition from Average Wholesale Price (AWP)-based
reimbursement to Average Sales Price (ASP)-based reimbursement lowered both av-
erage margins and the upward responsiveness of Medicare reimbursements in the
presence of adverse supply shocks. Yurukoglu (2012 [15]) examines this idea using
a Nash equilibrium model of investment under uncertainty to capture capacity in-
vestment dynamics. This model predicts more frequent shortages in the presence
of the ASP-based reimbursement that Medicare adopted in 2005. Yurukoglu’s em-
pirical results also suggest a lower frequency of shortages in the presence of higher
(i.e. AWP-based) Medicare reimbursement.
This particular explanation does not appear on the surface to offer an explana-
tion for the increased frequency of shortages in the market for non-parenteral drugs
(which are not reimbursed under Medicare Part-B). However, there could be a pri-
vate market analogue to the Medicare Part-B based reimbursement explanation
for non-parenteral drugs. Much of the reimbursement for these types of drugs are
governed by administrative rules that might not reflect market conditions. Partic-
ularly as they apply to generic drugs, these rules are not generally known publicly.
For example, many generics are reimbursed on the basis of a maximum allowable
cost (MAC) that is determined in a manner that is not generally transparent. To
the extent that these payment methods are not flexible in the presence of supply
than for a similar brand, but is generally the same regardless of the underlying cost of the generic
drug15Here it needs to be reinforced that we are speaking in terms of market demand and market
supply. Assuming a relatively competitive market, the demand curve facing the individual manu-
facturer is likely to be very price elastic, with a correspondingly elastic supply faced by individual
buyers (for whom alternative supply is often just a phone call away).

DRUG SHORTAGES, PRICING, AND REGULATORY ACTIVITY 15
shocks, these contracts could introduce inflexibility in prices at a point in the sup-
ply chain that would place limits on the extent of price change that pharmacies
can tolerate before losing money on sales — thus possibly disconnecting price and
quantity in the market. This would also presume, however, that the institutions
setting reimbursement rules have weak incentives to allow flexibility in them. This
might not be true if there is competitive pressure to retain plan contracts. The
complaints of beneficiaries unable to obtain their prescriptions due to a payor’s
inflexible reimbursement rules could be a source of such pressure.
There is a certain consumer appeal to upward price inflexibility for pharmaceu-
ticals. Especially if demand elasticity is low, shortages could cause very substantial
increases in price. Anecdotal evidence suggests that some drugs in shortage have
been subject to “price gouging”, which is a popular pejorative that often raises
public concern.16 But, it is precisely elevated prices that are usually the equilibrat-
ing mechanism that simultaneously reduces demand (for example causing people
to identify substitutes), and creates an incentive for new supply to get on the mar-
ket quickly. Absent price responsiveness in the market, endogenous incentives for
manufacturers to address supply issues are likely to be attenuated.
Although it is beyond the scope of this paper, merging aspects of the Yurukoglu
investment model with the regulatory framework outlined above could yield more
refined insights. In particular, the regulatory framework provides a richer model
for the supply shock distribution built into the Yurukoglu model.
3. Empirical effects of regulatory activity
This section investigates the empirical linkages between FDA inspection and
detection rates on shortage rates. As discussed above, change in regulatory activity
is one of the variables expected to have an impact on shortage rates, at least in
the short run as manufacturers adjust to a new equilibrium. Although increased
FDA vigilance is sometimes directly blamed for the increases in drug shortages,
there has not been rigorous analysis behind these statements. Moreover, to the
extent that these connections are being made, they have been primarily focused on
injectable drug shortages. The statistical models presented in this section suggest
16To the extent that some of these reports reflect concerns about grey market imports that
potentially circumvent FDA rules, or are outright counterfeits, this concern could be well-justified.

16 CHRISTOPHER STOMBERG, PH.D.
a connection between FDA inspection and citation rates and drug shortages that
cuts across both parenteral and non-parenteral drugs.
3.1. Shortage data. The shortage data used in this study were provided by the
University of Utah Drug Information Service (UUDIS), which also provides the in-
formation reported on the American Society of Health-System Pharmacists (ASHP)
website.17 The UUDIS shortage data have become a standard resource for re-
searchers investigating shortages due both to its comprehensiveness and to its ex-
tensive time coverage. The Government Accountability Office (GAO) has issued
two reports on shortages (GAO 2011 [11], and GAO 2014 [12]), both of which rely
primarily upon the data gathered by UUDIS.18 As discussed in more detail below,
the events tracked by UUDIS range in severity from temporary supply disruptions
to full-blown shortages.
The FDA also provides online access to information on current and past drug
shortages.19 There are two main distinguishing features between the FDA data
on shortages and the UUDIS database. The first is that the FDA only publishes
information on a shortage when the affected drug is considered medically necessary,
i.e., if it is “used to treat or prevent a serious disease or medical condition, and
there is no other available source of that product or alternative drug that is judged
by medical staff to be an adequate substitute.”20 This definition potentially omits
reports of shortages that are of economic significance, or relevance to consumers,
but nevertheless fall below FDA’s medical necessity threshold. The most significant
limitation of the FDA data for analytical purposes, however, is the lack of historical
information that is made publicly available — only a few years of data on resolved
17These data first became available in 2001: “In 2001, ASHP entered into an agreement with
the University of Utah Drug Information Service (UUDIS) to use bulletins developed by UUDIS
to address pharmacists questions about shortages. Also in 2001, ASHP published guidelines on
managing drug product shortages and launched a Drug Product Shortages Management Resource
Center on its Web site.” (ASHP 2002 [9])
18The data for this study is very similar to the data used by the GAO in its 2014 report.19See http://www.fda.gov/Drugs/DrugSafety/DrugShortages/default.htm for more informa-
tion on this source. UUDIS and FDA also share information.
20See ASHP [5] for discussion.

DRUG SHORTAGES, PRICING, AND REGULATORY ACTIVITY 17
shortages are available on the FDA website. Based on these considerations, the
FDA shortage information was not used in this study.21
The supply disruptions tracked by UUDIS are voluntarily reported via several
channels (e.g., the ASHP website shortage reporting feature.)22 Upon receiving a
report, availability is researched among all manufacturers, along with reasons for
the disruption and information about the potential for its resolution; it is then
tracked. The ASHP website publishes data on shortages tracked by UUDIS, but
only for drugs that meet its definition of shortage: “a supply issue that affects how
the pharmacy prepares or dispenses a drug product or influences patient care when
prescribers must use an alternative agent.”23 Not all supply disruptions that are
reported to UUDIS meet these formal shortage criteria, but are nevertheless tracked
internally by UUDIS. According to UUDIS, if the disruption becomes significant
enough to meet the ASHP shortage criterion, it will be listed on ASHP’s public
website where extensive information on availability from all current manufacturers
is provided along with other information, such as reasons for shortage.24 As a result
of this process, the data that UUDIS makes available to researchers tracks more
supply disruptions than are reported on the ASHP website.25 Among the reasons
given for this dichotomy is the desire to avoid worsening disruptions by prematurely
disseminating information from early reports.26 One clear advantage of the UUDIS
data beyond their time coverage, therefore, is that they also appear to be a more
21In its 2011 report [11], the GAO cited similar reasons for using the UUDIS data instead of
FDA data in its retrospective analysis.22See the ASHP website ”Frequently Asked Questions” [10] for more information on what
the reported data consist of, and how it compares to, e.g., the FDA shortage reports. See also
Fox’s 2011 presentation ([6]) for more background on the UUDIS reporting process and summary
statistics generated from their data.
23ASHP 2009 [5], p. 1400.
24Telephone interview, May 2104.25Information on the shortages tracked by the ASHP website are currently only available back
to mid-2010 (earliest date observed on resolved shortage list as of 5/2014.) As a result, it is
not possible to comprehensively identify which of the UUDIS-tracked disruptions were, in fact,
reported on the ASHP website. Anecdotally, the number of disruptions identified in the UUDIS
data may exceed those listed on the ASHP website by 50%.26ASHP 2009 [5] notes, for example, the potential for disruptions being exacerbated by pur-
chasers hoarding product based on rumors of shortage.

18 CHRISTOPHER STOMBERG, PH.D.
sensitive measure of supply disruption than the online ASHP shortage reports.27
In subsequent discussion, the events recorded in the UUDIS data will be referred
to as shortages with the understanding that many of these events could be best
described as disruptions rather than full-blown shortages.
The database received from UUDIS for this study contains information on 1,686
separate shortage events reported in the United States between January 2001 and
June 2013. Each record contains information for one shortage event, including:
drug name, date of first reported shortage, whether the shortage remains active,
the ending date of the shortage if it is no longer active, reason for shortage, type of
drug (parenteral vs. non-parenteral), American Hospital Formulary Service (AHFS)
drug classification, and DEA schedule if the drug is a controlled substance. Certain
drugs may appear multiple times in the data if they have experienced more than
one shortage event over time. UUDIS also tracks a number of products that are
beyond the scope of this study and consequently omitted from analysis, including:
devices, vaccines, and vitamin therapies.28 A small number of additional products
were eliminated from the data due to being listed as resolved, but having no end
date. Omitting these products removes 137 events from the data, leaving 1,549 for
further analysis.
Each year, an average of about 45% of the new events reported in the UUDIS
data relate to non-parenteral drugs. The median length of resolved shortages is rel-
atively similar for parenteral and non-parenteral drugs (5 months versus 4 months,
respectively), but differences in average length are somewhat more pronounced (9.8
months versus 6.6 months, respectively. Focusing on events starting after 2003 re-
duces the average length of parenteral and non-parenteral shortages to 7.7 months
27It must be noted, however, that even when ASHP reports a shortage on its website, individual
buyers may anecdotally be unaffected by the identified disruption. See Bhat, et al [1] for an
example of this phenomenon.28The following AHFS categories were eliminated from the UUDIS data: (16.) Blood Deriva-
tives, (20.) Blood Formation, Coagulation, and Thrombosis Agents & drug name contains “FAC-
TOR” (blood factor products), (80.) Serums, Toxoids, and Vaccines, (88.) Vitamins, (94.) De-
vices, (96.) Pharmaceutical aids.

DRUG SHORTAGES, PRICING, AND REGULATORY ACTIVITY 19
and 6.0 months, respectively.29 Taken together, the higher average length of par-
enteral shortages, and their higher frequency both contribute to the larger number
of ongoing parenteral drug shortages noted in Chart 1.
For the statistical analysis, the UUDIS data were summarized into 150 monthly
counts (2001-2013) of ongoing shortages (ongoing), and new shortage reports (starts)
for parenteral and non-parenteral drugs. Though the number of ongoing shortages
is clearly a variable of policy interest, it is also a stock variable, which likely induces
autocorrelation in this series. There are sound reasons to expect that FDA regula-
tory activity would affect this stock both by potentially affecting the rate at which
new shortages are started and by potentially altering the length of time that it takes
to clear up supply issues resulting from FDA inspection. It turns out, however, that
the stock of ongoing shortages does indeed turn out to be highly autocorrelated,
with first-order autocorrelation coefficients in excess of 0.97. Dickey-Fuller (DF)
statistics computed for these series (ongoing parenteral and non-parenteral short-
ages) are small and the corresponding DF-tests cannot reject the null hypothesis
that unit roots are present in the data (p-values of 0.993 and 0.807, respectively).
This suggests either that these data should be differenced before performing re-
gression analysis, or that the rate data (new shortage starts) be used instead. The
shortage start data are indeed less autocorrelated with first-order autocorrelations
of 0.57 and 0.49 for the parenteral and non-parenteral series, respectively. The
Dickey-Fuller test soundly rejects the hypothesis of unit roots in these series (p-
value < 0.0000). For modeling purposes, the count of new shortage starts will be
treated as the dependent variable.
3.2. FDA inspection/citation data. The information on FDA regulatory activ-
ity used in this study come from two separate publicly down-loadable databases
made available by the FDA on its website: one that focuses on the inspections
performed by each of its centers and another that provides details on the citations
(alleged CFR violations) that are noted during inspections. Each dataset has non-
overlapping information, thus both alternatives are used separately in the regression
29The coefficient of variation on the length of shortages is quite high—on the order of 1.3.

20 CHRISTOPHER STOMBERG, PH.D.
analysis. The main limitation in these data is that they only include those events
that have progressed to a point where the FDA is at liberty to disclose details.30
The monthly CDER drug inspection data are derived from a large database
documenting all FDA inspections from October 1, 2008 to March 31, 2013.31 These
data cover inspections made by all centers within the FDA, e.g., CBER, CDER, and
CDRH. Each inspection record lists the name of the firm inspected, its location, the
date the inspection ended, the FDA center performing the inspection, the project
area (focus of inspection), and the “district decision”. The district decision records
in summary form the outcome of the inspection. It is broken into three possible
outcomes: NAI (No Action Indicated), VAI (Voluntary Action Indicated), and OAI
(Official Action Indicated).32
The inspections database in this study contains information on 102,160 FDA
inspections across all parts of the organization. The Center for Drug Evaluation
and Research (CDER) accounts for 11,410 of these inspections, and the Center for
Biologics Evaluation and Research (CBER) accounts for another 9,353 inspections.
The majority of inspections (about 55%) are associated with the activities of Center
for Food Safety and Applied Nutrition (CFSAN), which monitors the food supply.
Since the focus of this study is primarily on pharmaceuticals, the inspections of
interest are those performed by CDER. The project area variable further breaks
inspections down into categories. The majority of CDER’s inspections (8,348, 73%
30Particularly in months close to the end of the reporting period, the counts of included
inspections and citations drops off significantly.31These data are updated quarterly and can be downloaded at
http://www.fda.gov/iceci/enforcementactions/ucm222557.htm. The version used in this
study was downloaded in October 2013.32The FDA website gives further detail on the meaning of these terms: “An OAI inspec-
tion classification occurs when significant objectionable conditions or practices were found and
regulatory action is warranted to address the establishment’s lack of compliance with statute(s)
or regulation(s). A VAI inspection classification occurs when objectionable conditions or prac-
tices were found that do not meet the threshold of regulatory significance. Inspections clas-
sified with VAI violations are typically more technical violations of the FDCA. An NAI in-
spection classification occurs when no objectionable conditions or practices were found dur-
ing the inspection or the significance of the documented objectionable conditions found does
not justify further actions.” See: http://www.fda.gov/AboutFDA/Transparency /PublicDisclo-
sure/DraftProposalbyTopicArea/ucm211861.htm, accessed May, 2014)
DRUG SHORTAGES, PRICING, AND REGULATORY ACTIVITY 21
of the 11,410 total) are listed in the “Drug Quality Assurance” (DQA) project area.
The next most prevalent project area is “Bioresearch Monitoring”, which accounts
for about 21% of CDER’s inspections. The type of inspection most relevant to this
study are the subset listed in the DQA project area.
Within CDER’s DQA inspections it is worth noting that over 50% result in some
kind of regulatory action. Although only 4.8% (401) of these inspections result in
an “Official Action Indicated” outcome, another 48% (4,011) result in “Voluntary
Action Indicated” — suggesting some kind of corrective action is needed, according
to the FDA. Most of CDER’s DQA inspections occur in the United States (74%),
as one would expect. Of the remaining foreign inspections, the largest fraction
occur in India (18 %), and China (11%), with the remainder spread among OECD
countries.
Ideally, one would want to connect inspections mentioned in the FDA data (via
company ownership and location) to the shortage events mentioned in the UUDIS
data. However, it is typically difficult or impossible to make these direct con-
nections given just the name and address information found in the FDA data.33
Nevertheless, FDA inspection data do provide insight into the overall intensity of
FDA’s activities, their regional focus, and outcomes. For the empirical exercise in
this study, these data were processed into 60 monthly counts of overall inspections
by region (US/EXUS) and district decision (NAI/VAI/OAI).
In addition to the detailed inspection data, the FDA separately makes available
a database of citations listed for each of its inspections. This data set covers a
longer period than the inspection data (from October 2005 to September 2012).
These data only list inspections for which a citation was generated, so it does not
33For example, many firms in the pharmaceutical industry own and operate a complex web
manufacturing locations, most of which are multi-product facilities. Information about which
products are produced at particular facilities is generally not made available to the public, so even
knowing that a particular firm was inspected at a particular location may only allow inferential
conclusions about the drugs affected. This problem is exacerbated by the fact that the UUDIS
data only provide drug name information, so historical data on which manufacturers produced
a particular drug at the point of time of the inspection would be needed even for an inferential
analysis. Also, since many of the inspected facilities, e.g. active pharmaceutical ingredient (API)
plants in India and China, produce inputs for other manufacturers, the ultimate downstream
impacts stemming from an inspection at one of these plants cannot be derived from public data.
22 CHRISTOPHER STOMBERG, PH.D.
replace the inspections database as a source of information about the total number
of inspections performed. Citations are recorded in the data as a specific reference
to the portion of the Code of Federal Regulations (CFR) implicated, along with
a text description of the specific violation. For each inspection with a citation,
multiple records with different CFR references may be recorded in this database.
Overall, FDA’s citation data contain 157,301 individual citation records across all of
FDA’s centers; 22,791 are related specifically to CDER inspection activities. Unlike
the inspection data, the citation data are not further sub-dividable into project
area, e.g., DQA activities versus Bioresearch Monitoring. However, it is possible to
distinguish citations related to 21 CFR Part 211: “Current Good Manufacturing
Practice for Finished Pharmaceuticals” (CGMP) from others. CGMP citations are
a dominant fraction (97.25%) of the total citations. The relatively small number
of remaining citations are dominated (93%) by Part 314 references: “Applications
for FDA Approval to Market a New Drug”. Keeping only citations related to Part
211, leaves 22,164 total citations over the covered time period.
The 22,164 CDER CGMP citations identified in the FDA citation database are
linked to 3,478 unique inspection events (month, manufacturer, country combina-
tions), meaning that approximately 6.4 citations are given out per (citation gen-
erating) inspection.34 Review of the particular citations involved with each of the
CGMP inspections in this database reveals 236 different CFR references. The five
most frequently cited are: 21 CFR 211.192 (1401 times), 21 CFR 211.22(d) (969
times), 21 CFR 211.100(a) (909 times), 21 CFR 211.25(a) (905 times), and 21
CFR 211.110(a) (701 times). No attempt was made to classify the CFR references
qualitatively.35 For each CFR reference a number of different text descriptions can
show up. For example, for citations referencing 21 CFR 211.192 there are 36 differ-
ent associated text descriptions, each alleging a specific form of quality assurance
lapse. A large majority of the inspections and citations in this database occur at
US locations (97% in each case).
34In a handful of instances (less than 20) an inspection occurred at more than one location for
a particular manufacturer within a country and month. Many of these occur on the same or very
proximate dates in geographically close locations, so are treated here as a single event.35Although qualitative distinctions clearly exist, making such judgments would involve
challenges.

DRUG SHORTAGES, PRICING, AND REGULATORY ACTIVITY 23
Both the number of citations and the number of unique inspections leading to a
citation (firm/date combinations) were processed into 84 monthly summary counts
by region (US/EXUS). Comparing the inspection and citation data for the years
where the two datasets overlap reveals that in the US, the number of inspections
with citations in the citation dataset tracks the number of inspections listed with
a district decision of “VAI” or “OAI” in the inspection dataset reasonably well.
There is less correspondence between these series for inspections occurring outside
the US.36
The patterns of correlation among the various measures of FDA activity suggest
caution when attempting to use these measures in conjunction with one other on
the right hand side of a regression equation. For example, there is a relatively
high degree of correlation between the count of inspections with citations and total
inspections (0.86 and 0.82 correlation, US/Ex-US respectively). As expected, there
is also a high degree of correlation between the number inspections with VAI/OAI
district decisions and inspections with citations (0.91). Factor analysis of these data
confirm that two factors can account for almost all of the variation in the 6 different
FDA activity measures (excluding totals which are perfect linear combinations of
other variables). Inspection of the factor loadings suggests a strong distinction
between measures of US and Ex-US activity, whether it be overall inspections or
inspections with citations.
For modeling purposes, only six measures of FDA activity were thus retained:
US/Ex-US inspections (2008-2013) and US/Ex-US citations (2005-2012) along with
their totals. As with the measure of new shortage starts, the FDA citation and in-
spection data exhibit modest autocorrelation (first-order autocorrelation generally
below 0.5). Dickey-Fuller tests soundly reject a null hypothesis of unit roots in these
data. Figure 4 illustrates the pattern over time for the FDA variables. Note that
both of the US series (inspections and citations) have apparent seasonal patterns
with a discernible dip near the end of each year.
These data were then combined with the parenteral and non-parenteral shortage
data, then pooled (stacked) into a dataset with 300 total observations (fewer for
36In particular, there appear to be considerably fewer (often months with zero) inspections
with citations compared to “VAI”/“OAI” events in the inspection data, although the correlation
is still reasonably high (0.81).

24 CHRISTOPHER STOMBERG, PH.D.
Figure 4. FDA inspection and citation data
025
5075
100
125
150
FD
A/C
DE
R c
itatio
ns
025
5075
100
125
150
FD
A/C
DE
R in
spec
tions
2004 2005 2006 2007 2008 2009 2010 2011 2012 2013 2014
Inspections: US Inspections: Ex−US
Citations: US Citations: Ex−US
Source: FDA.
Table 2. Summary statistics for variables used in statistical analysis
Variable Obs Mean Std. Dev. Min Median Max
pflag 300.00 0.50 0.50 0.00 0.50 1.00
starts 300.00 5.16 3.79 0.00 5.00 22.00
cites 168.00 41.40 13.23 16.00 40.50 84.00
cites US 168.00 40.01 12.29 15.00 39.50 73.00
ites EXUS 168.00 1.39 2.57 0.00 0.00 15.00
insp 114.00 143.40 35.36 66.00 144.00 239.00
insp US 114.00 105.05 27.50 55.00 108.00 160.00
insp EXUS 114.00 38.35 19.41 7.00 34.00 126.00
the shorter FDA inspection data). Table 3.2 provides summary statistics for the
variables used in the statistical analysis.

DRUG SHORTAGES, PRICING, AND REGULATORY ACTIVITY 25
Figure 5. Drug shortage rates, FDA inspections, FDA citations
025
5075
100
125
150
175
200
FD
A/C
DE
R d
rug
qual
ity a
ctiv
ities
05
1015
New
ly r
epor
ted
shor
tage
s −
non
pare
nter
al
2004 2005 2006 2007 2008 2009 2010 2011 2012 2013 2014
Newly reported shortages FDA/CDER citations
FDA/CDER inspections
Sources: UUDIS, FDA.
3.3. Modeling and analysis. Figure 5 plots the total number (US/Ex-US) of
monthly FDA inspections and citations against the number of newly reported short-
ages for non-injectable drugs.37
These charts suggest the potential for lagged effects and other dynamics in the
relationship between FDA activity and drug shortages. Panel time-series regression
models were estimated to investigate these relationships. These models are designed
to be predictive in nature, and are used to determine if current and past FDA
activity has an effect on new drug shortage reports. These models do not represent
a reduced-form estimation of any particular underlying structural model, but can
potentially be useful for identifying causation in the sense of Granger.38 The general
37The data in this figure have been smoothed with a one-quarter moving average to improve
readability. These same charts appear similar for parenteral drug shortages, and have been omitted
for the sake of brevity.38Taking a more traditional approach using IV estimation presents the typical problem of
identifying an appropriate instrument, in this case for FDA regulatory activity. Fully exogenous
changes, such as turnover in FDA leadership driven by political changes or (possibly) implemen-
tation of the GDUFA could serve as exogenous sources of variation. The FDA inspection and
citation data provide relatively little data spanning such regimes, however.

26 CHRISTOPHER STOMBERG, PH.D.
form of these models is the following:
(3.1) yit = α+ β0 ·Xt + β1 ·Xt−1 + ...+ βl ·Xt−l + γ · pflag+ ϵit
Where yit is the number of new shortages reported for drug type i (injectable,
non-injectable) in time t. The variable Xt−l is the measure of regulatory activity
(citations or inspections) for time t lagged by l periods. The variable pflag is an
indicator equal to one for injectable (parenteral) drugs and zero otherwise.
Focusing first on the citation data, which provides a longer time series for es-
timation, Table 3 reports the results of six models of drug shortage where the
independent variables are counts of FDA citations and the dependent variable is
the count of drug shortages reported by UUDIS described above. Three of the
models are estimated using OLS and three are estimated using Negative Binomial
Regression (NBR), a more flexible form of Poisson model that treats the dependent
variable as a count. Model (1) contains contemporaneous total citations along with
a three-month distributed lag of citations. No interaction effects between pflag
and the citation variables were included in this baseline model. Only one of the
parameters in this model is statistically significant at the 5% level (2nd lag). A
Wald test for the joint significance of the FDA citation parameters has a p-value of
0.0010, which suggests an overall statistically significant relationship between these
variables and drug shortage rates.
Model (2) adds lags of up to six months to the model. In this model, several of
the individual coefficients on the FDA citation counts are statistically significant
beyond the 5% level. The Wald test for their joint significance has a p-value less
than 0.0001, which again suggests an overall statistically significant relationship
between overall FDA inspections with citations and shortages. The Wald test for
the joint significance of the added lag terms has a p-value of 0.0162 and there is a
notable increase in the adjusted R2 when these lags are added.
Noting the discrepancies between citations and inspections with actions indicated
in the Ex-US data, Model (3) uses only citations at US-based facilities on the right
hand side. The results of this regression are broadly similar to model (2).
Models (4)-(6) examine the same relationships using NBR estimation as an al-
ternative to OLS. These results follow a very similar qualitative pattern compared

DRUG SHORTAGES, PRICING, AND REGULATORY ACTIVITY 27
to the OLS models, both in terms of the overall significance of the parameters as-
sociated with lagged citations as well as the pattern of significance of some of the
individual coefficients.
First-order residual autocorrelation for both the OLS and NBR models is rela-
tively low for the non-parenteral data (0.22 or less), but is somewhat higher (up
to 0.55) for the parenteral data. An alternative model including interaction effects
between pflag and the citation variables was run to check whether these differences
in autocorrelation were driven by the estimation of a common lag structure for
both parenteral and non-parenteral citations. For these interacted models (not re-
ported in the table), the common effects remain jointly significant at the 5% level
for the OLS model and less than 1% for the NBR model. The interaction effects
are jointly insignificant in both cases — suggesting both a common lag pattern
and that other factors may be contributing to the higher autocorrelation in the
parenteral residuals.
Table 4 reports the results of six additional models of drug shortage based on the
shorter inspection data series. As with the citation data, Model (1) is estimated
via OLS and contains contemporaneous total inspections (insp) and a three-month
distributed lag of total inspections. In this case, only one of the individual coef-
ficients on total inspections is significant at the 5% level (2nd lag). A Wald test
for the joint significance of the FDA inspection parameters has a p-value of 0.0115,
which suggests the presence of an overall statistically significant relationship be-
tween lagged inspection rates and drug shortage rates. Model (2) adds lags of up
to six months to the model. In this model, none of the individual coefficients on
the FDA inspection counts is statistically significant, and the Wald test for joint
significance of the inspections is also insignificant. The Wald test for the added
lags shows their parameters to be jointly insignificant. The results of model (3)
(US inspection rates) are broadly similar. The NBR models (4)-(6) follow a similar
qualitative pattern, but with stronger p-values attached to the tests of the joint
significance for the lagged inspection variables.
Residual autocorrelations in these data are generally smaller than in the models
with citations as regressors. As with the models of citations, additional models

28 CHRISTOPHER STOMBERG, PH.D.
Table 3. Regression results - FDA Citations
(1) (2) (3) (4) (5) (6)
OLS (Total) OLS (Total) OLS (US) NBR (Total) NBR (Total) NBR (US)
main
pflag 0.889 0.833 0.833 0.133 0.122 0.117
(0.148) (0.176) (0.175) (0.146) (0.167) (0.180)
cites 0.0440 0.0409 0.0474 0.00659 0.00630 0.00726
(0.147) (0.205) (0.152) (0.146) (0.169) (0.119)
l 1 cites 0.00351 -0.00335 0.00102 0.000992 0.000269 0.000980
(0.897) (0.910) (0.973) (0.798) (0.948) (0.822)
l 2 cites 0.0751 0.0628 0.0617 0.0107 0.00866 0.00860
(0.007) (0.032) (0.052) (0.005) (0.023) (0.038)
l 3 cites -0.0192 -0.0548 -0.0503 -0.00285 -0.00858 -0.00801
(0.499) (0.065) (0.100) (0.534) (0.055) (0.079)
l 4 cites 0.00695 0.00264 0.000761 0.000145
(0.818) (0.931) (0.851) (0.972)
l 5 cites 0.0261 0.0364 0.00467 0.00627
(0.344) (0.205) (0.179) (0.082)
l 6 cites 0.0613 0.0642 0.00921 0.00967
(0.048) (0.042) (0.023) (0.018)
cons 1.775 0.459 -0.294 1.145 0.927 0.808
(0.122) (0.681) (0.810) (0.000) (0.000) (0.000)
lnalpha -1.738 -1.913 -1.931
(0.000) (0.000) (0.000)
N 162 156 156 162 156 156
R2 0.110 0.158 0.162
R2adj. 0.082 0.112 0.116
Wald (cites) 4.89 5.19 5.18 20.45* 41.13* 41.26*
(0.0010) (0.0000) (0.0000) (0.0004) (0.0000) (0.0000)
Wald (added lags) 3.54 4.15 12.11* 14.16*
(0.0162) (0.0074) (0.0070) (0.0027)
p-values in parentheses, *denotes chi-square statistic.
using interaction effects to allow more flexibility were also fitted. In both cases
(OLS and NBR), the added interactions were jointly insignificant.
4. Discussion
The key insight introduced at the beginning of this paper is that generic drug
shortages are not a phenomenon isolated to parenteral drugs. Indeed, the overall
similarity between the time pattern of shortages in parenteral and non-parenteral
drugs is striking, and indicates that some of the causes are likely shared. Three
possibilities are offered as potentially cross-cutting explanations: market structure,

DRUG SHORTAGES, PRICING, AND REGULATORY ACTIVITY 29
Table 4. Regression results - FDA Inspections
(1) (2) (3) (4) (5) (6)
OLS (Total) OLS (Total) OLS (US) NBR (Total) NBR (Total) NBR (US)
main
pflag 0.704 0.686 0.686 0.0798 0.0780 0.0653
(0.345) (0.387) (0.369) (0.371) (0.396) (0.458)
insp 0.0145 0.0103 0.0305 0.00183 0.00131 0.00349
(0.299) (0.504) (0.151) (0.274) (0.471) (0.155)
l 1 insp 0.0107 0.00835 0.00701 0.00145 0.00106 0.000913
(0.408) (0.589) (0.739) (0.343) (0.540) (0.696)
l 2 insp 0.0253 0.0268 0.0380 0.00302 0.00301 0.00441
(0.045) (0.124) (0.102) (0.028) (0.094) (0.082)
l 3 insp -0.0124 -0.0163 -0.0148 -0.00137 -0.00194 -0.00164
(0.374) (0.339) (0.496) (0.440) (0.361) (0.509)
l 4 insp 0.00447 0.0106 0.000754 0.00149
(0.785) (0.674) (0.676) (0.595)
l 5 insp -0.00109 -0.00349 0.0000844 -0.000138
(0.942) (0.865) (0.961) (0.951)
l 6 insp 0.0113 0.00716 0.00131 0.000760
(0.414) (0.714) (0.402) (0.715)
cons 2.112 1.290 -0.388 1.313 1.219 1.034
(0.203) (0.565) (0.854) (0.000) (0.000) (0.000)
lnalpha
cons -2.521 -2.482 -2.689
(0.000) (0.000) (0.000)
N 108 102 102 108 102 102
R2 0.097 0.089 0.155
R2adj. 0.0533 0.010 0.082
Wald (insp) 3.42 1.60 2.33 14.94* 11.82* 18.81*
(0.0115) (0.1446) (0.0312) (0.0048) (0.1066) (0.0088)
Wald (added lags) 0.37 0.18 1.39* 0.82*
(0.7742) (0.9072) (0.7085) (0.8459)
p-values in parentheses, *denotes chi-square statistic.
regulatory activity, and pricing. One of these, regulatory activity, is explored em-
pirically.
The regression models presented in this paper identified a consistent and sta-
tistically significant predictive relationship between FDA regulatory activity in the
drug market (i.e. drug quality inspections and citations) and the incidence of new
drug shortages. The models tested indicate that the pattern of this relationship
is generally shared across both parenteral and non-parenteral drugs. This result

30 CHRISTOPHER STOMBERG, PH.D.
suggests that changes in regulatory activity may be one of the cross-cutting factors
contributing to the ongoing wave of drug shortages.
It is important not to over-interpret this result, however. The OLS models, for
example, exhibit relatively modest R2 statistics. This indicates that, although these
models are predictive, a substantial amount of variation in new shortage starts re-
mains unexplained by this single factor. This should not come as a surprise given
the discussion on other likely factors contributing to drug shortages; regulatory ac-
tivity is only one of those factors. And, because other factors that may be important
are not accounted for in these models, caution is advisable when interpreting the
results presented here (particularly with respect to individual coefficient estimates).
It is also important to recognize the economic and regulatory context of this
result. Apparent changes in FDA oversight activity may signal attempts to re-
establish quality thresholds that may have eroded or that have been applied un-
evenly as the industry has evolved. The program goals of the GDUFA are poten-
tially an example of this. Supply interruptions resulting from this activity can be
viewed as a necessary step on the road to a different equilibrium. As discussed,
once oversight reaches a consistent and anticipated level within the industry, a new
equilibrium level of quality can be established and shortages should resolve given
adequate price responsiveness. In other words, if shortages are caused by changes
in regulatory oversight relative to expectations, then they should be transitory in
nature — smoothing out once all participating manufacturers adjust accordingly.
Pricing and market structure are important factors to consider in future empirical
work. For example, public controversy has recently arisen over a pattern of spikes in
retail (i.e. non-parenteral) generic drug prices.39 These reports may be connected
with disruptions that may, or may not, lead to outright shortages, and appear to
point toward an interesting avenue of research. Although a recent GAO study finds
that the number of generic drug shortages was in decline by 2013 (GAO, 2014
[12]), it is clear from the number of ongoing shortages that fragility in the supply
of generic drugs remains a concern in the United States.
39See, e.g., Adam Fein’s November 2013 blog entry [4].

DRUG SHORTAGES, PRICING, AND REGULATORY ACTIVITY 31
References
1. Russel Roberts John W. Devlin Bhat, Subha, Posted versus actual drug shortages, Am J
Health-Syst Pharm 69, 1363.
2. Rena M. Conti and Ernst R. Berndt, Anatomy of U.S. cancer drug shortages: Technology,
market structure and price competition, Working Paper (2013).
3. Robert Dorfman and Peter O. Steiner, Optimal advertising and optimal quality, American
Economic Review 44, 826.
4. Adam J. Fein, Retail generic drug costs go up up and away, www.drugchannels.net (2013).
5. Annette Birt Ken B. James Heather Kokko Sandra Salverson Fox, Erin R. and Donna L.
Soflin, Ashp guidelines on managing drug product shortages in hospitals and health systems,
Am J Health-Syst Pharm 66, 1399.
6. Erin R. Fox, Drug shortage update current status and significant trends, Online presentation:
http://www.fda.gov/downloads/Drugs/NewsEvents/UCM274565.pdf (2011).
7. John R. Graham, The shortage of generic sterile injectable drugs: Diagnosis and solutions,
Mackinac Center Policy Brief (2012).
8. K Haninger, A Jessup, and MA Koehler, Economic analysis of the causes of drug shortages,
ASPE Issue Brief (Department of Health and Human Services, Office of the Assistant Secretary
for Planning) (2011).
9. American Society of Health System Pharmacists, Provisional observations on drug product
shortages: Effects, causes, and potential solutions, Am J Health-Syst Pharm 59, 2173.
10. , http://www.ashp.org/menu/drugshortages/faqs.html, ASHP Website, accessed May
2014 (2014).
11. US Government Accountability Office, Drug shortages—FDAs ability to respond should be
strengthened (GAO-12-116), United States Government Accountability Office (2011).
12. , Drug shortages—public health threat continues, despite efforts to help ensure product
availability (GAO-14-194), United States Government Accountability Office (2014).
13. Staff report, FDAs contribution to the drug shortage crisis, U.S. House of Representativesw
112th Congress Committee on Oversight and Government Reform (2012).
14. Janet Woodcock and Marta Wosinska, Economic and technological drivers of generic sterile
injectable drug shortages, Clinical Pharmacology & Therapeutics 93, no. 2, 170.
15. Ali Yurukoglu, Medicare reimbursements and shortages of sterile injectable pharmaceuticals,
National Bureau of Economic Research Working Paper No. 17987 (2012).