dry weight and cell density of individual algal and cyanobacterial
TRANSCRIPT

Dry Weight and Cell Density of Individual Algal and Cyanobacterial Cells for Algae
Research and Development
_______________________________________
A Thesis
presented to
the Faculty of the Graduate School
at the University of Missouri-Columbia
_______________________________________________________
In Partial Fulfillment
of the Requirements for the Degree
Master of Science
_____________________________________________________
by
WENNA HU
Dr. Zhiqiang Hu, Thesis Supervisor
July 2014

The undersigned, appointed by the Dean of the Graduate School, have examined the
thesis entitled
Dry Weight and Cell Density of Individual Algal and Cyanobacterial Cells for Algae
Research and Development
presented by Wenna Hu,
a candidate for the degree of Master of Science,
and hereby certify that, in their opinion, it is worthy of acceptance.
Professor Zhiqiang Hu
Professor Enos C. Inniss
Professor Pamela Brown

DEDICATION
I dedicate this thesis to my beloved parents, whose moral encouragement and support
help me earn my Master’s degree.

ii
Acknowledgements
Foremost, I would like to express my sincere gratitude to my advisor and mentor Dr.
Zhiqiang Hu for the continuous support of my graduate studies, for his patience,
motivation, enthusiasm, and immense knowledge. His guidance helped me in all the
time of research and writing of this thesis. Without his guidance and persistent help this
thesis would not have been possible.
I would like to thank my committee members, Dr. Enos Inniss and Dr. Pamela Brown
for being my graduation thesis committee. Their guidance and enthusiasm of my
graduate research is greatly appreciated.
Thanks to Daniel Jackson in immunology core for the flow cytometer operation training,
and Arpine Mikayelyan in life science center for fluorescent images acquisition.
Besides, I am grateful to my fellow labmates: Tianyu Tang for her generous advice,
help and support in my thesis work. Chiqian Zhang for helping me learn how to do
bacterial cell counting. Thanks to Shashikanth Gajaraj, Shengnan Xu, Weiming Hu,
Jialiang Guo, Meng Xu, Jingjing Dai, Can Cui, Minghao Sun, Jianyuan Ni and Yue Liu,
for all the help and great time we have had in the last two years.

iii
Last but not least, thanks to my dear friends, Shuang Gao, Jingwen Tan, Mingda Li,
who has supported, and encouraged me throughout this entire process. I am so blessed
to have you by my side.

iv
Table of Contents
Acknowledgements ........................................................................................................ ii
Abstract ......................................................................................................................... xi
1. Introduction ................................................................................................................ 1
1.1 Microalgae and Cyanobacteria ......................................................................... 1
1.2 Classification.................................................................................................... 2
1.2.1 Microalgae Classification ..................................................................... 2
1.2.2 Classification for Cyanobacteria ........................................................... 2
1.3 Cell Morphology .............................................................................................. 3
1.3.1 Microalgae ............................................................................................ 3
1.3.2 Cyanobacteria ....................................................................................... 5
1.4 Methods for Microbial Cell Counting.............................................................. 6
1.4.1 Spectrophotometry ................................................................................ 7
1.4.2 Hemocytometry..................................................................................... 8
1.4.3 Solid Phase Cytometry (SPC) ............................................................. 11
1.4.4 Flow cytometry ................................................................................... 12
1.4.5 Quantitative polymerase chain reaction (q-PCR) ............................... 16
1.5 Microalgae cultivation ................................................................................... 18
1.5.1 Open systems ...................................................................................... 18
1.5.2 Closed systems .................................................................................... 19
1.5.3 Hybrid systems.................................................................................... 20
1.5.4 A hetero-photoautotrophic two-stage cultivation process ................... 20
1.6 Environmental factors affecting algal growth ................................................ 21
1.6.1 Light .................................................................................................... 21
1.6.2 Temperature ........................................................................................ 22
1.6.3 Nutrients .............................................................................................. 23
1.6.4 Carbon dioxide and pH ....................................................................... 24
1.7 Applications of algae for wastewater treatment and biofuel production ....... 26
1.7.1 Wastewater treatment .......................................................................... 26
1.7.1.1 Nitrogen removal ............................................................................. 27
1.7.1.2 Phosphorus removal ......................................................................... 28
1.7.1.3 CO2 sequestration and organic carbon removal ............................... 29
1.7.1.4 Toxic metal removal ......................................................................... 30
1.7.2 Biofuel production .............................................................................. 31
1.8 Research Objectives ....................................................................................... 32
2. Materials and Methods ............................................................................................. 34
2.1 Algal and Cyanobacterial Cultivation ............................................................ 34
2.2 Cell Concentration Determined by Spectrophotometry, Hemocytometry and
Flow Cytometry ................................................................................................... 34

v
2.3Determination of Cell Dry Weight of Algae and Cyanobacteria at Exponential
Growth Phase ....................................................................................................... 35
2.4 Determination of Cell Dry Weight of Nonphotosynthetic Bacteria at
Exponential Growth Phase ................................................................................... 39
2.5 Determination of Cell Dry Weight of the Algae in Continuous Flow Bioreactor
.............................................................................................................................. 40
2.6 Cell Size of Algae and Cyanobacteria ........................................................... 41
2.7 Cell Density of Algae and Cyanobacteria ...................................................... 41
3. Results and Discussion ............................................................................................ 43
3.1 Cell Concentration Determined by Spectrophotometer, Hemocytometry and
Flow Cytometry ................................................................................................... 43
3.2 Cell Counting for Mixed Phototrophic Samples ............................................ 47
3.3 Dry Weight of Individual Algal, Cyanobacterial and E. coli Cells at
Exponential Growth Phase ................................................................................... 48
3.4 Dry Weight of Individual Algal Cells in a Continuous Flow Bioreactor ....... 52
3.5 Cell Size and Cell Density of Algae and Cyanobacteria................................ 55
3.5.1 Cell Size of Algae and Cyanobacteria ................................................ 55
3.5.2 Cell Density of Algae and Cyanobacteria ........................................... 57
4. Conclusions .............................................................................................................. 58
5. Future Study ............................................................................................................. 59
Reference ..................................................................................................................... 60
Appendixes .................................................................................................................. 66

vi
List of Tables
Table 1.1: Algae classification and characteristics ................................................ 2
Table 1.2 CO2 tolerance and optimum CO2 concentration of various microalgae
species .......................................................................................................... 25
Table 3.1 Dry weight of individual Cholorella Vulgaris cells at exponential phase
...................................................................................................................... 49
Table 3.2 Cell concentration and individual cell weight of Microcystis aeruginosa
in exponential phase ..................................................................................... 51
Table 3.3 Individual cell dry weight of Cholorella vulgaris in CSTR ................ 53
Table 3.4 Cells size in batch of Cholorella vulgaris and Microcystis aeruginosa
...................................................................................................................... 55

vii
List of Figures
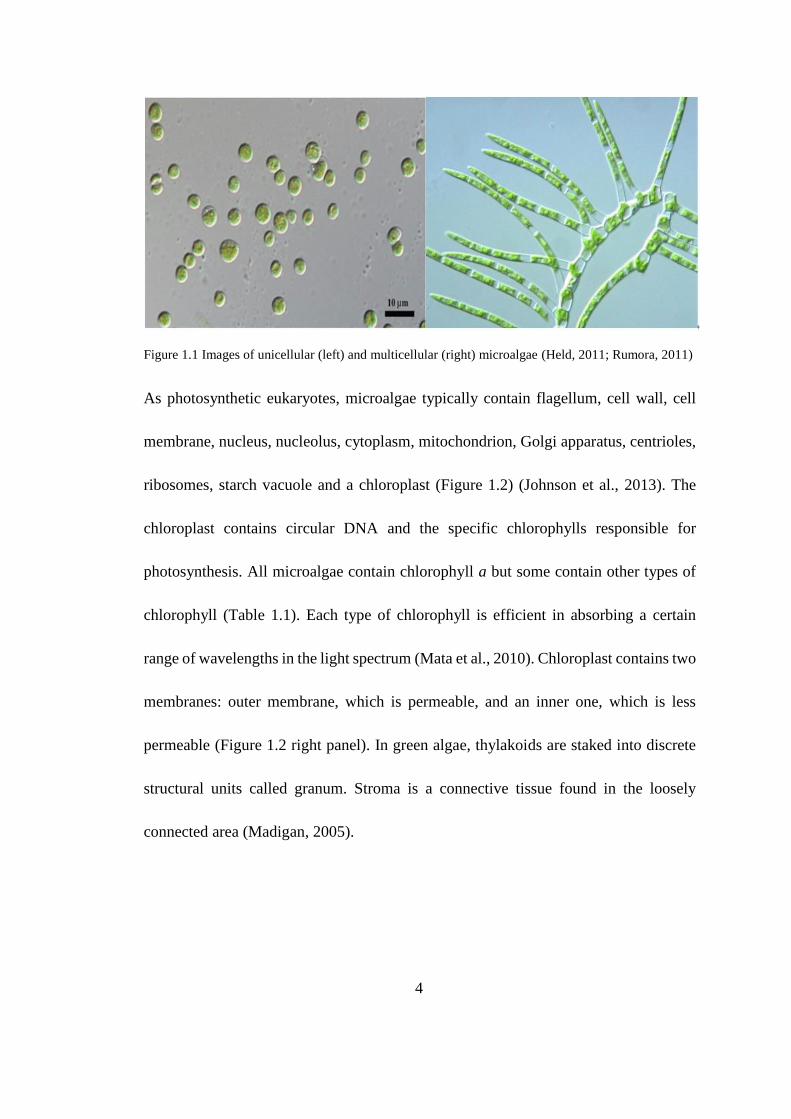
Figure 1.1 Images of unicellular (left) and multicellular (right) microalgae (Held
2011, Rumora 2011) ...................................................................................... 4
Figure 1.2 Microalgal cell (left) and chloroplast (right) structure (Rittmann 2001,
Madigan 2005) ............................................................................................... 5
Figure 1.3 Images of unicellular (left) and filamentous (right) cyanobacteria (NIES
2013, Tsukki 2013 ) ....................................................................................... 5
Figure 1.4 Intracellular membranes and compartments in a cyanobacterial cell
(Kelvinsong 2013) ......................................................................................... 6
Figure 1.5 A hemocytometer (left) and the hemocytometer image at 100 ×
microscopic magnification (right) (SIGMA company) ................................. 9
Figure 1.6 Epifluorescence images of cells showing SYTOX Green fluorescence
(green) and autofluorescence (red) for green algae: Chlorella sp. (left) and
cyanobacteria: Chroococcidiopsis sp. (right) (Knowles and Castenholz 2008)
...................................................................................................................... 10
Figure 1.7 A schematic of flow cytometry (WIKIPEDIA) .................................. 13
Figure 1.8 Image of an open pond system (Wen 2014) ....................................... 19
Figure 1.9 A simplified schematic of the assimilation of inorganic nitrogen by
algae (Infante et al. 2013) ............................................................................ 27

viii
Figure 1.10. Schematic of the mechanism of converting CO2 to algal biomass
(Widjaja et al. 2009) .................................................................................... 30
Figure 2.1 An experimental setup of batch study of phototrophic growth .......... 36
Figure 2.2 Flow cytometric image for algae (left) and cyanobacteria (right) ...... 38
Figure 2.3 Experimental setup of two identical bench-scale CSTR systems ...... 40
Figure 3.1 A standard curve of cell concentration determined by flow cytometry
for algae (a, R2=0.997) and cyanobacteria (b, R2=0. 997) ........................... 44
Figure 3.2 A standard curve of cell concentration determined by hemocytometry
for algae (a, R2=0.993) and cyanobacteria (b, R2=0. 997) ........................... 45
Figure 3.3 A correlation of cell concentration determined by hemocytometry and
flow cytometry for algae (a, R2=0.997) and cyanobacteria (b, R2=0. 998) . 46
Figure 3.4 Difference in size and morphology based flow cytometry (algae:
cyanobacteria=1:1 counted by hemocytometry) .......................................... 47
Figure 3.5 A standard curve of the ratio of algae to cyanobacteria determined by
flow cytometry verse that by hemocytometry (R2=0.999)........................... 48
Figure 3.6 Chlorella vulgaris growth curve ........................................................ 49
Figure 3.7 Change in the orthophosphate-P concentration during the growth of
chlorella vulgaris ......................................................................................... 50
Figure 3.8 Growth curve of Microcystis aeruginosa ........................................... 51
ix
Figure 3.9 Orthophosphate-P concentration for Microcystis aeruginosa in
exponential phase ......................................................................................... 52
Figure 3.10 Change in the concentration of Chlorella vulgaris of the CSTR at the
SRT of 7 d .................................................................................................... 53
Figure 3.11 Change in the orthophosphate-P concentration of the CSTR for the
growth of Cholorella Vulgaris ..................................................................... 54
Figure 3.12 Cell size measurement for algae (a) and cyanobacteria (b) with
fluorescent microscopy ................................................................................ 56
Figure 3.13 Cell size measurement in algal CSTR with fluorescent microscopy 57
Figure S1 Changes in mixed liquor pH for the growth of Chlorella vulgaris (a)
and Microcystis aeruginosa (b) in batch and CSTR systems (c) ................. 67
Figure S2 Changes in OD in an algal CSTR........................................................ 67
Figure S3 Hemocytometric images of algae (left) and cyanobacteria (right) ...... 68
Figure S4 Overlay images in bright field and fluorescent field of algae (left) and
cyanobacteria (right) .................................................................................... 68
x
List of Abbreviations
OD Optical Density
SPC Solid Phase Cytometry
q-PCR Quantitative Polymerase Chain Reaction
SRT Solids Retention Time
ADP Adenosine Diphosphate
A- MBR Algal-based Membrane Bioreactor
TOC Total Organic Carbon
CSTR Continuous Flow Stirred-tank Reactor
FS Forward Light Scatter
SS Side Light Scatter
BBM Bold’s Basic Medium
R2A Reasoner’s 2A Agar
CFU Colony Forming Unit
xi
Abstract
Phototrophs have received more and more attention due to their nutrient removal,
biomass production as well as the potential for biofuel feedstock. This research
determined the dry weight of algal and cyanobacterial cells and compared with that of
regular bacteria. For microbes growing during exponential phase in batch studies, the
average dry weights of green alga Chlorella vulgaris, cyanobacterium Microcystis
aeruginosa and facultative bacterium E.coli were (2.24 ± 0.16) × 10-11 g/cell, (1.21 ±
0.09) × 10-11 g/cell and (1.69 ± 0.36) × 10-13 g/cell, respectively. By using fluorescent
microscopy, the average sizes of Chlorella vulgaris and Microcystis aeruginosa were
(4.34 ± 0.90) μm and (2.29 ± 0.61) μm, respectivily. It is obvious that the dry weight
of individual cells increases as cell size increase. Correspondingly, the average density
of single cells were (0.57 ± 0.04) g/cm3 and (0.87 ± 0.02) g/cm3 for algae and
cyanobacteria, respectively. In a continuous flow algal cultivation system, individual
algal cell weight was (3.91 ± 0.26) ×10-11 g/cell and cell density was (0.51 ± 0.07)
g/cm3 with an average cell size of (5.28 ± 1.33) μm under steady-state conditions. The
results could be used for the estimation of algal biomass production for algae research
and development.

1
1. Introduction
1.1 Microalgae and Cyanobacteria
Microalgae and cyanobacteria are the primary producers of organic matter in aquatic
environments due to CO2 fixation during photosynthesis. They are mostly found in
oceans, lakes, rivers and salt ponds and are able to grow and live in terrestrial
environments and harsh conditions as well (Rodríguez-Palacio, Crisóstomo-Vázquez,
Álvarez-Hernández, & Lozano-Ramírez, 2012). Microalgae are unicellular eukaryotic
organisms, some of which form colonies resulting in green colonies that are visible to
naked eye. Cyanobacteria, often known as blue-green algae, are oxygenic
photosynthetic bacteria which contain blue-green and green pigments (WHO, 2009).
Cyanobacteria lack phycobilins but have chlorophyll a and b, giving them a more green
than blue color (Parmar, Singh, Pandey, Gnansounou, & Madamwar, 2011).
Microalgae and cyanobacteria are the only known organisms that are capable of both
oxygenic photosynthesis and hydrogen production. Thus, these organisms have the
potential to produce renewable energy and serve as alternative sources for biodiesel
from nature’s most plentiful resources: water and solar energy (Parmar et al., 2011).
Nevertheless, a series of problems have occurred worldwide due to water pollution

2
associated with algae and cyanobacteria bloom, such as in lakes and reservoirs, and
drinking water supplies, which are harmful to human health.
1.2 Classification
1.2.1 Microalgae Classification
Algae have been classified in terms of various parameters such as pigments, flagella,
reserve material, shape and cell wall composition. Based on the different chlorophylls
and photosynthetic pigments they contain, algae can be classified into seven taxonomic
groups (Rittmann, 2001). Table 1.1 summarizes the groups of algae and their
characteristics, such as cell covering and habitat (Sze, 1998).
Table 1.1: Algae classification and characteristics
Algae group Chlorophylls Outer chloroplast membranes Habitat
Cyanophyta a,b 0 Marine, freshwater, soil
Chlorophyta a,b 2 Marine, freshwater, soil
Chrysophyta a,c,e 4 Marine, freshwater, soil
Euglenophyta a,b 3 Mostly freshwater
Phaeophyta a,c 4 Marine
Pyrrophyta a,c 3 Marine, freshwater
Rhodophyta a,d 2 Marine
1.2.2 Classification for Cyanobacteria
Cyanobacteria are classified into five groups by morphology. The first three,
Chroococcales, Pleurocapsales and Oscillatoriales, are not supported by phylogenetic
studies. However, the latter two, Nostocales and Stigonematales, are monophyletic and
make up the heterocystous cyanobacteria which are nitrogen-fixing bacteria formed
during N2 starvation (Lele, 2007). Heterocystous species dominate N2 fixation in

3
freshwater and brackish environments. By protecting nitrogenase from being
inactivated by O2, heterocystous cyanobacteria fix N2 and perform photosynthesis
simultaneously (Miller, Cloutier, & Turner, 2003).
1.3 Cell Morphology
Individual size, is a fundamental indicator of cell state, affecting most aspects of a cell
since allometric relationships link cell size to processes, such as nutrient uptake,
photosynthesis and respiration, settling rates and physical/chemical transport. Hence,
cell morphology and size are potentially suitable for environmental monitoring (Jacson,
1989).
1.3.1 Microalgae
Most microalgae are in micrometer size. For instance, Chlorella vulgaris, a green
microalgae with spherical shape, is 2 to 10 μm in diameter (Havlik et al., 2013;
VanderGheynst, Guo, Cheng, & Scher, 2013). In terms of cell morphology, microalgae
may be spherical (Figure 1.1, left panel), rod-shaped, spindle-shaped or club-shaped.
They may be in groups like filamentous clusters or as individual strands that are either
branched ( Figure 1.1, right panel) or unbranched (Mata, Martins, & Caetano, 2010).
4
Figure 1.1 Images of unicellular (left) and multicellular (right) microalgae (Held, 2011; Rumora, 2011)
As photosynthetic eukaryotes, microalgae typically contain flagellum, cell wall, cell
membrane, nucleus, nucleolus, cytoplasm, mitochondrion, Golgi apparatus, centrioles,
ribosomes, starch vacuole and a chloroplast (Figure 1.2) (Johnson et al., 2013). The
chloroplast contains circular DNA and the specific chlorophylls responsible for
photosynthesis. All microalgae contain chlorophyll a but some contain other types of
chlorophyll (Table 1.1). Each type of chlorophyll is efficient in absorbing a certain
range of wavelengths in the light spectrum (Mata et al., 2010). Chloroplast contains two
membranes: outer membrane, which is permeable, and an inner one, which is less
permeable (Figure 1.2 right panel). In green algae, thylakoids are staked into discrete
structural units called granum. Stroma is a connective tissue found in the loosely
connected area (Madigan, 2005).

5
Figure 1.2 Microalgal cell (left) and chloroplast (right) structure (Madigan, 2005; Rittmann, 2001)
1.3.2 Cyanobacteria
Cyanobacteria include unicellular (Figure 1.3, left panel) and filamentous forms (Figure
1.3, right panel) and vary from spherical, oval, fusiform and rod-like, to irregular in
shape (Lele, 2007). Cell size ranges from 0.5 to 60 μm (Srivastava, 2013).
Figure 1.3 Images of unicellular (left) and filamentous (right) cyanobacteria (NIES, 2013; Tsukki, 2013 )
A cyanobacterial cell has a peptidoglycan cell wall and sandwiched between
cytoplasmic and outer membranes (Figure 1.4) (Srivastava, 2013). As prokaryotes,
cyanobacteria do not have nuclear envelope or a true nucleus, but rather have a nucleoid.

6
The cytoplasm contains the photosynthetic apparatus, called thylakoids, which contains
the phycobillisomes (Khan, 2013).
Figure 1.4 Intracellular membranes and compartments in a cyanobacterial cell (Kelvinsong, 2013)
1.4 Methods for Microbial Cell Counting
Microbial cell counting, or cell enumeration, is necessary to determine the number of
cells in a milliliter (mL) of liquid or in a gram (g) of solid material (Tortora, 2007).
Counting cells in culture has two major applications. The first is to estimate the size of
the cultured algal and cyanobacterial population. Although many alternative estimates
of population size are available, such as biomass, wet or dry weight, chlorophyll content
and organic nitrogen content, these indirect measurements do not determine the number
of individual cells in a population (Andersen, 2005). For instance, cell counting is an
essential component of cell quota which gives the average single cellular content of
some constituents, such as nitrogen and phosphorous (Andersen, 2005). The second
application of cell counting is to estimate the microbial growth rate. For instance, the

7
early detection of increasing cell numbers of microalgae and cyanobacteria would allow
mitigation measures to be taken in time to prevent a bloom and subsequent ecological
damage. Counting microscopic cells is challenging since 1 mL of liquid contains
millions of cells (Katase, Tsuboi, & Tsumura, 2013). Several direct and indirect
methods for cell enumeration are summarized in the following sections:
1.4.1 Spectrophotometry
Spectrophotometry is a convenient indirect method to record the optical density (OD)
value at a specific wavelength. OD is represented in terms of transmittance, which can
be determined by Beer-Lambert Law of Absorbance (Adrien, 1998). The Beer-Lambert
law relates the concentration of a sample to the attenuation of light as it passes through
the sample, so that it is capable of proportionaly correlating cell concentration ([x],
cells/mL) with OD (Myers, 2013).
[X] = k × OD
For a given culture sample, a good spectrophotometer should yield a linear relationship
between cell number and the absorbance.
Both microalgae and cyanobacteria have chlorophyll a, so spectrophotometry is widely
applied in phototrophic research. Chlorophyll a absorbs the light with wavelength of
680 nm through the suspension of cells, and the amount of absorbed light is proportional
to the cell density or cell number in suspension by using a standard curve (M. J. Griffiths,

8
C. Garcin, R. P. van Hille, & S. T. Harrison, 2011). In addition to cell number, the
amount of light absorbed is also a function of cell morphology. Consequently, an
independent calibration curve is required for each phototrophic study, as the cell size
and shape are related to the specific growth rate and the nutrient composition (Biesta-
Peters, Reij, Joosten, Gorris, & Zwietering, 2010).
Although counting microbial cells by spectrophotometry is rapid and nondestructive, it
is not an ideal method since sensitivity is a drawback. For instance, the sensitivity is
limited to about 107 cells per mL for most bacteria (Nair, 2005).
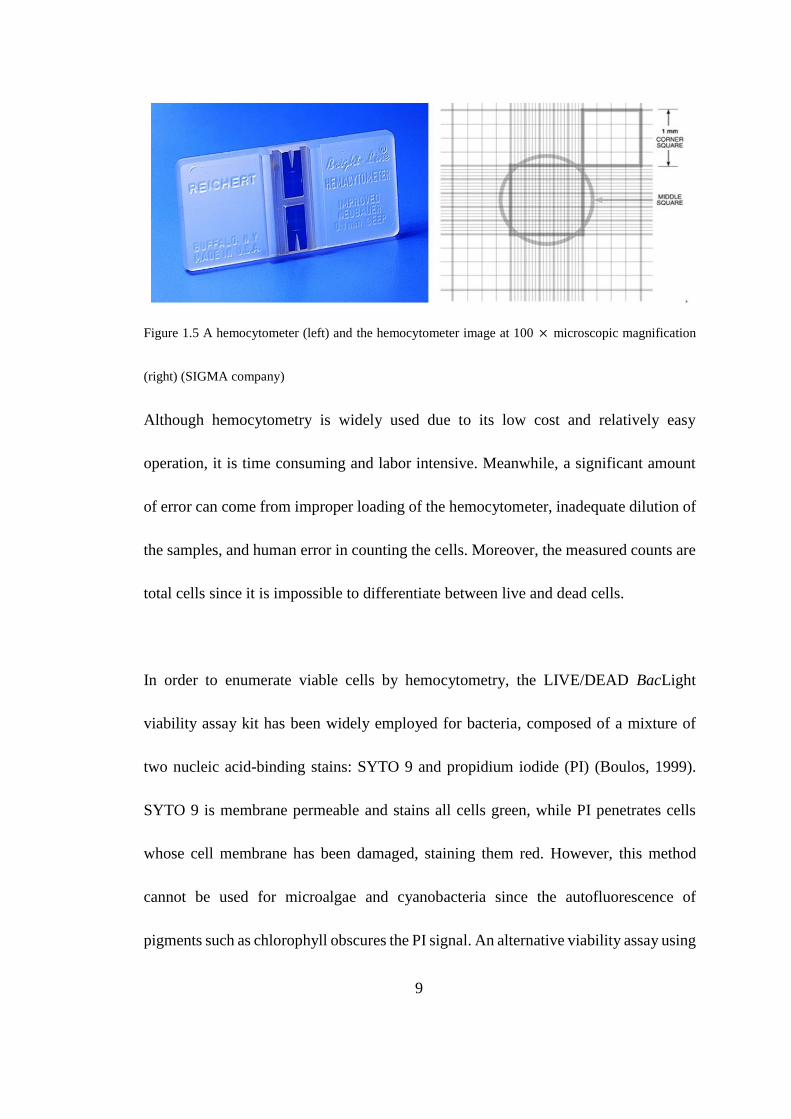
1.4.2 Hemocytometry
A hymocytometer is a special type of microscopic slide consisting of two chambers,
which is divided into nine (1.0 mm × 1.0 mm) large squares with each area of 1
mm². The central counting area of the hemocytometer contains 25 large squares and
each large square has 16 smaller squares (Figure 1.5). The chambers is 0.1 mm in height
so that each square corresponds to a given volume, applied to count cells with a size of
2-30 μm and concentration of 104-107 cells/mL (Andersen, 2005). Suspensions should
be dilute enough to ensure the cells do not overlap each other on the grid and distribute
uniformly (Grigoryve, 2013). To avoid counting cell twice, only those cells on the lines
of two sides of the large squares are counted with the microscope.
9
Figure 1.5 A hemocytometer (left) and the hemocytometer image at 100 × microscopic magnification
(right) (SIGMA company)
Although hemocytometry is widely used due to its low cost and relatively easy
operation, it is time consuming and labor intensive. Meanwhile, a significant amount
of error can come from improper loading of the hemocytometer, inadequate dilution of
the samples, and human error in counting the cells. Moreover, the measured counts are
total cells since it is impossible to differentiate between live and dead cells.
In order to enumerate viable cells by hemocytometry, the LIVE/DEAD BacLight
viability assay kit has been widely employed for bacteria, composed of a mixture of
two nucleic acid-binding stains: SYTO 9 and propidium iodide (PI) (Boulos, 1999).
SYTO 9 is membrane permeable and stains all cells green, while PI penetrates cells
whose cell membrane has been damaged, staining them red. However, this method
cannot be used for microalgae and cyanobacteria since the autofluorescence of
pigments such as chlorophyll obscures the PI signal. An alternative viability assay using

10
SYTOX Green may be applied to differentiate live and dead phototrophic cells.
SYTOX Green is a fluorescent stain with a high affinity for nucleic acids that only
penetrates damaged cell membranes. The three positive charges carried by the stain
cause it to be excluded completely from living cells (Knowles & Castenholz, 2008).
Once the stain binds with nucleic acids it fluoresces bright green, with excitation and
emission maxima at 502 and 523 nm, respectively (Roth, 1997). A red fluorescence
signal emitted by chlorophyll a with a maximum wavelength near 680 nm, often persists
after a cell has been killed by membrane permeabilization. However, the strong green
fluorescence of SYTOX Green bound to intact nucleic acids remaining in the cell
overpowers the weaker red signal. As a result, the dead cell will appear bright green
(Figure 1.6) (Knowles & Castenholz, 2008). Therefore, SYTOX Green fluorescence
and autofluorescence can be used simultaneously as markers to count live and dead
cells of microalgae and cyanobacteria.
Figure 1.6 Epifluorescence images of cells showing SYTOX Green fluorescence (green) and
autofluorescence (red) for green algae: Chlorella sp. (left) and cyanobacteria: Chroococcidiopsis sp.
(right) (Knowles & Castenholz, 2008)

11
1.4.3 Solid Phase Cytometry (SPC)
SPC is a novel technique that detects and enumerates microorganisms at low cell
concentrations (Haese, 2002). Prior to scanning, microbes are collected following
membrane filtration and fluorescently labelled with an argon laser excitable dye. Next,
the entire membrane filter surface is scanned and the fluorescent light emitted by
labeled cells is detected by two photo multiplier tubes with wavelength 500-530 nm
and 540-585 nm, respectively (Mandal, 2011). Meanwhile, fluorescent events are
automatically counted by a laser scanning device. A set of discriminants are applied by
software to differentiate viable microorganisms from electronic noise or non-target
autofluorescent particles (Tobe, 2006). The technique therefore allows an accurate
enumeration down to a detection limit of one cell per filter. After scanning, cells can be
visualized by epifluorescence microscopy.
SPC is capable of rapid and accurately enumerating rare evens with similar precision
to flow cytometry and is an alternative to traditional plate counting. By allowing
analysis of the spatial and temporal dynamics of specific populations, SPC is widely
applied in toxic algal quantification. For instance, cell counts of algal P. parvum are 2-
8 × 10³ cells/mL by SPC after fluorescent in situ hybridization, close to the light
microscopic cell counts of 6-9 × 10³ cells/mL. (Tobe, 2006).

12
1.4.4 Flow cytometry
Flow cytometry is a powerful tool for the analysis of multiple biological parameters of
individual cells or particles within heterogeneous cell populations. It has been widely
used to perform cell counting and for numerous cell function assessments (De Graaf et
al., 2011). Flow cytometry may be considered as the form of automated fluorescence
microscopy in which a sample is injected into a fluid (dye) that passes through a sensing
medium of flow cell for recording. In flow cytometry, the cells are carried in a laminar
flow through a focus of light the wavelength of which matches the absorption spectrum
of autofluorescence or the dye with which the cells have been stained (Figure 1.7). On
passing through the focus each cell emits a pulse of fluorescence and the scattered light
is collected by lenses and directed on to selective detectors. These detectors transform
the light pulses into an equivalent electrical signal. The light scattering of the cells gives
information on their size, shape and structure (Su, Mennerich, & Urban, 2012).
Therefore, a flow cytometer is highly effective in rapid analyzing individual cells at the
rate of thousand cells per second.

13
Figure 1.7 A schematic of flow cytometry (WIKIPEDIA)
One important feature of flow cytometry is that measurements are made separately on
each particle within the suspension in turn, and not just as average values for whole
population. For instance, with two typical strains in China waters, flow cytometry
protocols for algal cell counting and for algal live/dead cell assay were established by
using Microcysis aeruginosa and Chlorella ellipsoideac (Chen et al., 2013). The
protocols were adopted for cell counting and live/dead assay of the algal cells with UV-
C disinfection treatment at 0-200 mJ.cm-2. The results indicate that the cell counting
data based on flow cytometry analysis are well correlated with that of microscopic
analysis (R2=0.98) while reducing the detection time to less than 5 min (Chen et al.,
2013).

14
One advantage of using flow cytometry to analyze microalgae is the autofluorescence
of naturally occurring intracellular pigments, which can be employed to distinguish
between different species or between microalgae and other microorganisms without
applying fluorescent probes (Hyka, Lickova, Přibyl, Melzoch, & Kovar, 2013). On the
other hand, the autofluorescence spectrum can overlap with the red spectral range of
commonly used dyes. Therefore, flow cytometry established with bacteria or yeasts
which use, for instance, propidium iodide or Nile red are not applicable for microalgae
(Veldhuis & Kraay, 2000). For this reason, careful attention should be paid to selection
of an appropriate fluorescent dye with respect to the particular microalgal strain being
studied and the lasers available with the flow cytometry device being used. Algae
possess pigments (chlorophylls, carotenoids, sometimes also phycobilins), which are
detectable by flow cytometry as strong red or orange autofluorescence (>600 nm). The
strong pigment autofluorescence can cause interference or quenching of a dye if it
fluoresces within the same spectrum. This affects the quantitative signal information
from the fluorescent dye. Therefore, ideal fluorescent dyes/probes chosen for the
investigation of algae should: (1) have maximal fluorescence intensities in the range of
500-600 nm, at which there is almost no interference with the autofluorescence of the
pigments (mainly chlorophyll a); (2) be non-toxic and sensitive at low concentrations
of the dye to achieve better recovery of the cells after sorting; (3) show excitation at

15
488 nm, since affordable flow cytometry devices used in industry are only with an air
cooled single-line argon blue laser tuned to this wavelength (Veldhuis & Kraay, 2000).
Flow cytometric analyses of C. vulgaris cells are performed in a Coulter Epics XL4
flow cytometer equipped with an argon-ion excitation laser (488 nm), detectors of
forward and side light scatter and four fluorescence detectors corresponding to four
different wavelength intervals: 505-550, 550-600, 600-645, and >645 nm. For each
analyzed parameter, data are recorded in a logarithmic scale and results are expressed
as a mean value obtained from histograms in arbitrary units. Fluorescence of
chlorophyll a (>645 nm) is used as a flow cytometry gate to exclude non-microalgal
particles. At least 100,000 cells per culture are analyzed. Cell size and morphology are
determined since the forward light scatter (FS) is correlated with the size or volume of
a cell or particle and the side light scatter (SS) is correlated with the granularity. (Rioboo,
O'Connor, Prado, Herrero, & Cid, 2009).
Flow cytometry has been also used to determine the growth of C. vulgaris.
Photosynthetic single-cell microorganisms generally show very strong
autofluorescence due to the presence of chlorophyll and/or other pigments like
carotenoids or phycobiliproteins. In C. vulgaris cells, autofluorescence corresponds to
the signal gathered in the FL4 detector (660-700 nm), emitted by the chlorophyll a and

16
related pigments after being excited at 488 nm. This autofluorescence is used to
exclusively analyze intact algal cells and to exclude non-microalgal particles
(Chioccioli, Hankamer, & Ross, 2014).
1.4.5 Quantitative polymerase chain reaction (q-PCR)
Quantitative polymerase chain reaction (q-PCR) is an in-vitro method used to increase
number of specific DNA sequence in a sample. PCR is used increasingly in research
because of its high sensitivity and specificity. A specific DNA fragment is amplified
during a 4-step PCR process (Katase et al., 2013). The target DNA is first denatured at
high temperature and two synthetic oligonucleotides primers flanking the target DNA
are present in excess. DNA polymerase then extends the primers using the original
DNA as the template. After an appropriate incubation period, the mixture is heated
again to separate the strands. The mixture is then cooled to allow the primers to
hybridize with complementary regions of newly synthesized DNA, and the whole
process is repeated.
When this is performed over and over with newly synthesized DNA as template in
addition to original target DNA, an exponential amplification of the DNA fragment
between two primers is obtained. Theoretically, PCR can amplify a single copy of DNA
a million fold in less than 2 h, hence, it has the potential to disseminate or greatly reduce
the dependence on cultural enrichment (Boyer & Combrisson, 2013).

17
Because q-PCR quantifies the number of copies of a targeted sequence and there are
potentially multiple copies of that sequence in a cell, we need to determine the copy
number of the sequence that we targeted for a cell before we translate gene quantities
into meaningful cell densities (Ata, Nalcaci, & Ovez, 2012).
Culture sample cell densities are determined via flow cytometry while q-PCR was
performed after sample filtration. Copy number is then defined as the slope of simple
linear regression of copies detected by q-PCR vs. abundance detected with flow
cytometry. The copy number regression is forced through the origin, as copy number
should directly correspond to cell number (Zamor, Glenn, & Hambright, 2012).
To estimate the number of DNA copies per genome, the plasmid standard with a known
copy number per microliter is plotted against the number of DNA copies per microliter
of DNA extract and thereafter divided by the cell density representing 1 μL of DNA
extract. Thus, the regression slope represents an estimate of the number of DNA copies
per cell for each cultured strain. The gene copy number per cell is subsequently
analyzed against the length and biovolume of the cells, in turn, to establish a
relationship between cell size and number of gene copies for the different species of
cultured cells (Godhe et al., 2008).

18
Although q-PCR is a powerful technology, the reactions can be dramatically affected
by presence of inhibitory compounds and selective microbiological media. A problem
for routine use of q-PCR in lab is that the procedures are rather complicated and very
clean environment is needed to perform the tests. Further, q-PCR cannot distinguish
between live and dead cells and hence may provide false negative results (Sanzani, Li
Destri Nicosia, Faedda, Cacciola, & Schena, 2014)
1.5 Microalgae cultivation
The current algae cultivation systems can be categorized into three groups according to
their reactor design: open systems, closed systems, and hybrid systems. The major
difference among these systems is whether the algae are exposed to the surrounding
environment. A hetero-photoautotrophic two-stage cultivation process is also an option
for nutrients removal, wastewater recycling and algal lipid accumulation (Zhou et al.,
2012).
1.5.1 Open systems
A raceway pond (Figure 1.8), an open system for algae cultivation, has been extensively
used since the 1950s. It is usually about 0.3 m deep to provide sufficient sunlight to
allow photosynthesis by microalgae cells (Chisti, 2007).

19
Figure 1.8 Image of an open pond system (Wen, 2014)
Currently, most commercial scale algae cultivation systems are open ponds because
they are relatively inexpensive to build. Some are built near wastewater treatment plants
to easily access nutrients available in wastewater. Despite the economic advantage of
open ponds, there are disadvantages. Firstly, since the system is exposed to the
atmosphere, water loss by evaporation increases considerably as water temperature
increases. Secondly, contamination is another inevitable issue with this system (Mata
et al., 2010). Finally, open ponds require large land areas.
1.5.2 Closed systems
Typical closed reactors include flat plate reactors, tubular photobioreactors (PBRs) and
bag systems (Wang et al., 2010). Compared with open ponds, the closed reactors
minimize water evaporation and contamination, and increase photosynthesis efficiency
due to culture conditions and operating parameters such as light intensity, temperature,
and CO2 that can be controlled better in PBRs (Mata et al., 2010). However, PBRs have

20
several drawbacks including overheating, oxygen accumulation, scale up difficulties
and high capital and operating costs (Mata et al., 2010).
1.5.3 Hybrid systems
Hybrid systems combine the merits of open and closed systems in a two-stage
cultivation system. The first stage uses closed PBRs to culture the inoculum for the
second stage where algae are cultivated in open ponds. In this way, culture is exposed
to minimal contamination before being fed to large scale ponds (Chisti, 2007). However,
large-scale applications of this approach has been limited by the high cost of the first
stage.
1.5.4 A hetero-photoautotrophic two-stage cultivation process
Some algae species can grow in a photoautotrophic mode under light, or in a
heterotrophic mode in the presence of organic carbon or in a mixotrophic culture mode
when supplied with both organic and inorganic carbon under light/dark conditions (Das,
Aziz, & Obbard, 2011). A hetero-photoautotrophic two-stage cultivation process is a
way of sequential heterotrophic and photoautotrophic growth for improved nutrient
removal, wastewater recycling and enhanced algal lipid accumulation as well as CO2
fixation for cost-effective and environmentally-friendly production of algae-based
biofuel (Zhou et al., 2012).

21
Growing algae in heterotrophic mode is a way to obtain high cell density biomass with
high lipid content for high-quality biodiesel feedstock (Miao and Wu, 2006). The
organic carbon in wastewater is not sufficient to sustain continuous growth of algae if
complete utilization of nutrients in the wastewater is desirable. A hetero-
photoautotrophic mode is therefore an option to solve this problem. Since the
accumulation of neutral lipids trends to occur in nitrogen-limited environments
(Richardson et al. 1969), the presence of nitrogen compounds may lead to the biomass
with low lipid content. Therefore, the culture process is to be separated into two
independent but sequential parts, a heterotrophic dominated stage using organic carbon
in wastewater for maximal cell density and lipid accumulation and an autotrophic
dominated stage to further remove nutrients in the recycled wastewater and accumulate
lipid in the nitrogen-deficient environment (Zhou et al., 2012).
1.6 Environmental factors affecting algal growth
A number of environmental factors that affect the growth of microalgae includes light
intensity, temperature, nutrient concentration, O2, CO2, pH, solids retention time (SRT)
and toxic chemicals. Several important factors are discussed below.
1.6.1 Light
As algae are photosynthetic organisms, light intensity is a controlling parameter in algal
growth; however, excessive light can inhibit photosynthesis. Algae absorb
photosythetically active part of solar radiation, which ranges from 400-700 nm

22
(Červený, Šetlík, Trtílek, & Nedbal, 2009). In laboratory-scale studies, PBRs are
internally or externally illuminated with fluorescent lamps or other light distributors.
To successfully use artificial light for photosynthesis, photons with wavelengths
between 600 and 700 nm must be generated (Bitog et al., 2011). It is reported that both
the CO2 fixation rate and O2 evolution rate of C. vulgaris were directly proportional to
the light intensity less than 97.2 μmol/m²/s (Fan et al., 2007). As soon as the intensity
exceeded 97.2 μmol/m²/s, the CO2 fixation rate and O2 evolution rate both increased
slightly and then remained constant after 145.8 μmol/m²/s. Thus, the light intensity
value of 145.8 μmol/m²/s was the saturation point, which should be the optimum value
for C. vulgaris (Fan et al., 2007). The outer layer of algae in the reactor can sometimes
absorb too much light, inhibiting algal growth. Under such conditions, toxic
photocatalytic products like hydrogen peroxide and superoxide can accumulate. Triplet
chlorophyll can be formed and the photosystem II reaction centers are damaged (L. Xu,
Weathers, Xiong, & Liu, 2009). On the other hand, the inner layers of algae may not
get enough light because of self-shading, so the volumetric biomass productivity per
unit of incident light will reduce. Therefore, efficient light intensity in the culture should
always be maintained.
1.6.2 Temperature
Algal growth is also temperature dependent, requiring an optimal value for maximal
growth. Temperature is also important for the dissociation of carbon-containing

23
molecules, making carbon available for photosynthesis. Temperature influences
respiration and photorespiration more strongly than photosynthesis ((Necchi, 2004).
However, if CO2 or light is a limiting factor for photosynthesis, the influence of
temperature can be insignificant (Pulz, 2001). The optimal temperature for algae
cultures is generally between 20 to 24 ℃, although this may vary with the composition
of the culture medium, the species and strain cultured. Most commonly cultured species
of algae tolerate temperatures between 16 and 27 ℃. Temperatures lower than 16 ℃
will slow down algal growth, whereas those higher than 35 ℃ are lethal for a number
of species (Bitog et al., 2011).
1.6.3 Nutrients
The essential elements for algal growth, such as carbon, nitrogen and phosphorous are
abundant in wastewater. Hence, microalgae have the potential to clean wastewater by
removing nitrogen, phosphorus and organic carbon from water, which helps reducing
the eutrophication in the environment.
Inorganic nitrogen such as NH4+ or NO3
- is an essential nutrient for amino acid synthesis
in algae. Availability of the nitrogen source affects cell content or composition of
proteins, carbohydrates, pigments lipids and fatty acids (Harrison, Thompson, &
Calderwood, 1990). Typically, NO3- concentrations in natural waters are higher than
NH4+ concentrations, and NO3
- is therefore the dominant nitrogen source for algae in

24
natural water. However, to assimilate NO3-, algae need to reduce NO3
- to NH4+, a
process that requires energy. As a result, NH4+ is a more energy-efficient nitrogen
source for algae (Harper, 1992). Ammonium, at concentrations of 100 to 250 μM,
may be inhibitory to some algae species, but most algae species tolerate concentrations
as high as 1,000 μM (Ross, 1973).
Apart from nitrogen and phosphorus, both iron and manganese are required for electron
transport, energy transfer, nitrogen assimilation, oxygen metabolism and enzymatic
processes, as well as for DNA, RNA, or chlorophyll synthesis (Kuma & Matsunaga,
1995). Iron and manganese can limit algal growth due to their low concentrations in
most waters (Coale et al., 1996).
Zinc is another important trace metal involved in algal growth. At the concentrations of
10-100μmol/L Zn2+ is essential for optimal growth of Isochrysis galbana but higher
concentrations of Zn2+ (≥ 1,000μmol/L) reduce the growth (Sun & Wang, 2009).
1.6.4 Carbon dioxide and pH
During photosynthesis, algae utilize carbon dioxide as the carbon source for cell growth.
Since algae live on a high concentration of carbon dioxide, greenhouse gases, nitrogen
dioxide and pollutants in the atmosphere from different sources can serve as the algal
nutrients. Algae production facilities can thus be fed with exhaust gases from

25
combustion of fossil fuels to significantly increase productivity (Bitog et al., 2011).
Moreover, algae extract carbon dioxide from water and convert it into organic
compounds. The amount of CO2 needed for growth varies according to algal species
and PBRs. The specific CO2 requirements of algae is likely influenced by PBRs type,
although this remains to be investigated. In terms of maximum CO2 tolerance, some
species can survive with very high CO2 concentration, but usually lower CO2
concentration is required for their maximum growth which can be shown in Table 1.2
(Merchuk, Gluz, & Mukmenev, 2000).
Table 1.2 CO2 tolerance and optimum CO2 concentration of various microalgae species
Speccies Maximum tolerance of
CO2 concentration Operating concentration
Cyanidium caldarium 100%
Scenedesmum sp. 80% 20-20%
Chlorococcum litoorale 60%
Synechococcus
elongatus 60%
Euglena sp. 45% 5%
Chlprella sp. 40% 10%
Eudorina sp. 20%
Dunaliella terialecta 15%
Nannochloris sp. 15%
Chlamydomonas sp. 15%
Tetraselmis sp. 14%

26
High concentrations of CO2 decreases water pH because unutilized CO2 will be
converted to H2CO3. Alternatively, using bicarbonate instead of gaseous CO2 will result
in pH increase (Widjaja, Chien, & Ju, 2009).
Algae generally prefer a near neutral to alkaline pH (7.5). A pH value greater than 8.5
to 9 starts to affect algal growth (Richmond, 2004). But in general, different pH values
seem not to have a significant effect on algal growth (Richmond, 2004).
1.7 Applications of algae for wastewater treatment and biofuel production
1.7.1 Wastewater treatment
Culturing phototrophs in nutrient-rich water is a new attempt to trap nitrogen,
phosphorus and toxic metals from the polluted water while producing phototrophic
biomass for biofuel applications.
Compared to other biofuel feedstock, phototrophs have the following advantages: First,
phototrophs can grow rapidly and have high oil contents of 20-50% on a dry weight
basis. Algae do not compete with crops for arable land and freshwater since they can
be cultivated in brackish water and on non-arable land. Second, phototrophs have the
ability to utilize nutrients from wastewater and to fix carbon dioxide, thus providing an
alternative method for wastewater treatment and reducing greenhouse gas emissions to
improve air quality. Moreover, byproducts of phototrophs cultivation after lipid

27
extraction, namely algal biomass residue, can be used as a nitrogen source, such as a
protein-rich animal feed or fertilizer for crops.
1.7.1.1 Nitrogen removal
Nitrogen is a critical nutrient required for the growth of all organisms. Organic nitrogen
is found in a variety of biological substances, such as peptides, proteins, enzymes,
chlorophylls, energy transfer molecules (ADP, ATP), and genetic materials such as
RNA and DNA (Harrison et al., 1990). Algae play a key role in converting inorganic
nitrogen to its organic form through assimilation. As shown in Figure 1.9, nitrate and
nitrite undergo reduction with the assistance of nitrate reductase and nitrite reductase,
respectively. Thus, all forms of inorganic nitrogen are ultimately reduced to ammonium.
Finally, using glutamate (GLU) and adenosine triphosphate (ATP), glutamine synthase
facilitates the incorporation ammonium into the amino acid glutamine (Infante et al.,
2013).
Figure 1.9 A simplified schematic of the assimilation of inorganic nitrogen by algae (Infante et al., 2013)

28
Ammonium is thought to be the preferred form of inorganic nitrogen because a redox
reaction is not involved in its assimilation; thus, it requires less energy. Studies have
shown that, in general, algae tend to prefer ammonium over nitrate, and nitrate
consumption does not occur until the ammonium is almost completely consumed
(Harrison et al., 1990). Therefore, wastewater with high ammonium concentrations can
be effectively used to rapidly grow microalgae. It has been reported that Chlorella sp.
is tolerant to NH4+-N at a high concentration ranging from 81 to178 mg/L (Wang et al.,
2010).
1.7.1.2 Phosphorus removal
Phosphorus is also a key factor in the metabolism of algae. During algae metabolism,
phosphorus, preferably in the forms of H2PO4- and HPO4
2-, is incorporated into organic
compounds through phosphorylation, much of which involves the generation of ATP
from adenosine diphosphate (ADP), accompanied by a form of energy input (T. Cai,
Park, & Li, 2013). Energy input can come from the oxidation of respiratory substrates,
the electron transport system of the mitochondria, or in the case of photosynthesis, from
light. Phosphates are transferred by energized transport across the plasma membrane of
the algal cell. Not only are inorganic forms of phosphorus utilized by microalgae, but
some varieties of algae are able to use the phosphorus found in organic esters for growth
(Martin et al., 1994). Phosphorus removal is not only governed by the uptake into the
cell, but also by external conditions such as pH and algal biomass concentrations.

29
Under phosphorus limitation, more phosphorous is taken up than required by algae for
their growth, known as “luxury uptake” (Riegman, Stolte, Noordeloos, & Slezak, 2000).
Furthermore, the induced flocculation of microalgae can facilitate chemical phosphate
precipitation. Therefore, phosphorous can be removed by algae through a combination
of adsorption and algae-induced chemical precipitation(Sañudo-Wilhelmy et al., 2004).
It is reported that the intracellular phosphorus is 0.4% in an algae-based membrane
bioreactor (A-MBR), indicating there is no luxury uptake occurring due to relative high
influent phosphorus concentration (M. Xu, Bernards, & Hu, 2014). Meanwhile, the
overall average extracellular phosphorus content is 7.5%, which accounts for more than
90% of the total phosphorus in the algae biomass.
1.7.1.3 CO2 sequestration and organic carbon removal
CO2 from the atmosphere and industrial exhaust gases can be fixed through the
photosynthetic activity of autotrophic microalgae. In addition, high levels of total
organic carbon (TOC) in the wastewater can be utilized by some algae species for fast
growth under photoheterotrophic or mixotrophic mode in light or under
chemoheterotrophic mode in dark (Wang et al., 2010). Carbon can be also utilized in
the form of soluble carbonates for cell growth, either by direct uptake or conversion of
carbonate to free carbon dioxide through carboanhydrase activity. For instance,
mixotrophic algae can assimilate CO2 and organic carbon simultaneously. The

30
assimilation of organic carbon can be through either phagotrophy or osmotrophy
(Subashchandrabose, Ramakrishnan, Megharaj, Venkateswarlu, & Naidu, 2013). The
mechanism of converting CO2 to biomass is shown in Figure 1.10 (Widjaja et al., 2009).
Therefore, the use of algae to mitigate CO2 from flue gases is an emerging research area
and, if effective, could benefit both the environment and biofuel production.
Figure 1.10. Schematic of the mechanism of converting CO2 to algal biomass (Widjaja et al., 2009)
1.7.1.4 Toxic metal removal
Wastewater from industries such as leather, steel and electroplating, contain high levels
of toxic heavy metals such as chromium, silver, copper, zinc and iron. Biosorption is
considered as an effective technique to remove metals from industrial wastewater
because of obvious benefits of high efficiency and selectivity for absorbing metals in
low concentrations, due to wide operational range of pH and temperature, energy-
saving, easy retrieval of metal and easy recycling of the biosorbent (Lam, Wut, Chan,
& Wu, 1999).

31
Among easily available biomasses groups, algae may provide a sustainable solution for
the treatment of municipal and industrial wastewater. For example, C. minutissima can
be used as a biosorbent to remove Cr (VI) (Ata et al., 2012). Metal cations and anions
can be adsorbed onto the biomass materials through physical and chemical adsorption
by van der Waals forces, electrostatic interactions, ion-exchange reaction,
complexation, surface precipitation, or their combinations. Microalgae, either in
original or modified forms, have been found to possess the ability to bind metals in
solution and be able to be utilized as adsorbents for metals (Monteiro, Castro, &
Malcata, 2012).
1.7.2 Biofuel production
Many species of microalgae are known to have high content of lipids, which have the
potential to be converted to biofuel, mainly biodiesel, via the transesterification of
intracellular accumulated oils. Due to their rapid growth and ability to accumulate oil
in concentrations of up to 50% of their dry weight, together with the possibility of year-
round production, microalgae can enable higher oil yield than oilseed crops (Widjaja et
al., 2009). Some algae species have high lipid contents when grown in wastewater. C.
vulgaris grown in an artificial medium resulted in 20-42% (dry basis) lipids with
removal efficiencies of 97% for ammonium and 96% for total phosphorus (Johnson et
al., 2013)

32
1.8 Research Objectives
Although microalgae and cyanobacteria are capable of treating wastewater and
extracting biofuel, algal blooms occur in the world. Therefore, algae harvesting is
important to both biofuel extraction and algal bloom control. Fundamental research on
microalgae and cyanobacteria based on cell morphology, concentration and density has
potential applications to estimate harvesting efficiency and lipid content in a given
volume of algal culture. For instance, cell density (g/cm3), determines whether
microbes float on the surface of water, suspend in water or sink to the bottom.
Furthermore, density is an essential factor to determine the appropriate methods and
anticipate the degree of difficulty for cell harvesting. Notably, cells adjust their density
during important processes such as cell cycle progression, apoptosis, differentiation and
malignant transformation even when volume and mass appear to remain constant
(Bryan et al., 2014; Grover et al., 2011). Moreover, combining concentration (cells/mL)
and weight of individual cells (g/cell) as well as theoretical lipid content of species,
biofuel productivity can be estimated.
The main objective of this study was to determine the dry weight of individual algal
and cyanobacterial cells and compared with that of nonphotosynthetic bacteria.
Moreover, we compared cell size and density of microalgae (chlorella vulgaris) and
cyanobacteria (Microcystis aeruginosa) during exponential phase of a batch study. In

33
particular, the dry weight of microalgae (Chlorella vulgaris) was compared between
batch study and continuous flow stirred-tank reactor (CSTR) operation.

34
2. Materials and Methods
2.1 Algal and Cyanobacterial Cultivation
Pure algal species Chlorella vulgaris (Carolina Biological Supply Company,
Burlington, NC) and pure cyanobacteria species Microcystis aeruginosa (UTEX 2385)
were grown individually in 250 mL Erlenmeyer flasks containing 125 mL of sterilized
Bold’s basal medium (BBM). The BBM contained the following key nutrients : 2.94
mM NaNO3, 0.2mM MgSO4.7H2O, 0.58 mM K₂HPO₄, 1.1 mM KH₂PO₄, 0.23mM
CaCl₂, 0.43 mM NaCl, 0.13 mM EDTA, 0.47 mM KOH, 0018 Mm FeSO4.7H2O, 0.18
mM H3BO3, 0.055 mM ZnSO4, 0.005 mM Na2MoO4.H2O, 0.004 mM CoCl2, 0.01 mM
MnCl2 and 0.06 mM CuSO4.5H2O (Simmons & Wallschlager, 2011). CO2 available in
the air was used as carbon source for photosynthesis.
2.2 Cell Concentration Determined by Spectrophotometry, Hemocytometry and Flow
Cytometry
Indirect measurements of concentrations of Chlorella vulgaris and Microcystis
aeruginosa were determined by UV-Vis spectrophotometer (Thermo Scientific,
GENESYS 20) at 680 nm (M. J. Griffiths, C. Garcin, R. P. van Hille, & S. T. L.
Harrison, 2011). Hemocytometry was applied for direct cell enumeration after a series
of 10-fold dilutions.

35
A linear relationship between cell number based on hemocytometry and flow
cytometric measurement was established.
To differentiate algal and cyanobacterial cells, a phototrophic suspension was prepared
by mixing Chlorella vulgaris and Microcystis aeruginosa at the ratios of 1:1, 1:2, 1:3,
1:4, 1:5, 2:1, 3:1, 4:1 and 5:1, respectively. A linear relationship between the ratio of
algal to cyanobacteria based on hemocytometry and flow cytometry was also
established.
2.3 Determination of Cell Dry Weight of Algae and Cyanobacteria at Exponential
Growth Phase
Studies of phototrophic growth were set up to determine individual cell dry weight, size
and cell density during exponential phase. Triplicate samples of Chlorella vulgaris and
Microcystis aeruginosa were collected on days 4, 8, 12, 16 during their exponential
growth phase. The initial cell concentration in a 200-mL cultivation was maintained the
same at an OD of 0.20 for both algae and cyanobacteria using modified BBM which
contained a low phosphorous concentration (2 mg/L as PO4--P) to minimize P
adsorption/precipitation on the cell surface.
Both Chlorella vulgaris and Microcystis aeruginosa were cultured at 24 ± 1 ℃ on a
shaker (Eppendorf, Innova 2000). The culture was mixed at 160 rpm and grown for 16

36
days (Figure 2.1). The batch cultivation went through 12h light/12h dark (L/D) cycle
on a daily basis to mimic natural conditions. The algal or cyanobacterial suspension
was exposed to fluorescent light at an average light intensity of 63.5 μmol/m²/s
measured by a light meter ((LI-250A, Biosciences). During the sampling period, water
quality parameters such as pH, and orthophosphate-P concentration were determined
following the standard methods (APHA, 2005).
Figure 2.1 An experimental setup of batch study of phototrophic growth
Hemocytometry and flow cytometry were applied to determine the algal or
cyanobacterial cell concentrations. The hemocytometer is composed of nine equally
sized large squares. The central one is divided into 25 small squares with each volume
of 4 10-6 mL. Chlorella vulgaris and Microcystis aeruginosa were counted in small
squares since their sizes are less than 10 μm. The cell concentration was calculated as
follows:

37
𝑐𝑒𝑙𝑙 𝑛𝑢𝑚𝑏𝑒𝑟
𝑚𝐿=
𝑐𝑒𝑙𝑙 𝑛𝑢𝑚𝑏𝑒𝑟 𝑝𝑒𝑟 𝑠𝑚𝑎𝑙𝑙 𝑠𝑞𝑢𝑎𝑟𝑒
4 × 10⁻⁶ 𝑚𝐿
Flow cytometric analysis was carried out for cell counting. Fluorescent beads of known
size and concentration were added to samples to provide an internal standard. To
differentiate pure phototropic species from the beads, the differences should exist based
on their size, morphology and their fluorescence. In this study, fluorescent counting
beads (7.7 μm, SPHERO AccuCount) were applied at a final concentration of 1×10⁵
particles/mL during phototrophic cell counting by a flow cytometer (CyAn ADP,
Beckman Coulter Inc., Brea, CA). Briefly, an aliquot (100 μL) of fluorescent bead stock
was added to a 1 mL cell culture sample and was vortexed for 10 s for complete mixing
before analysis. Both Chlorella vulgaris and Microcystis aeruginosa were well
differentiated from the fluorescent beads by recording the autofluorescent signals of
FL1 (530/40 nm) and FL4 (680/30 nm) band pass filters, which allow transmission of
photons that have wavelengths within a narrow range. Each flow cytometric analysis
required a total of 500,000 counting events (Figure 2.2). Summit V5 software was
applied to the analysis of flow cytometric images.

38
Figure 2.2 Flow cytometric image for algae (left) and cyanobacteria (right)
The cell concentration was calculated in the following:
𝑐𝑒𝑙𝑙 𝑛𝑢𝑚𝑏𝑒𝑟
𝑚𝐿=
𝑐𝑒𝑙𝑙 𝑛𝑢𝑚𝑏𝑒𝑟 𝑐𝑜𝑢𝑛𝑡𝑒𝑑 𝑏𝑦 𝐹𝐶𝑀
𝑏𝑒𝑎𝑑𝑠 𝑛𝑢𝑚𝑏𝑒𝑟 𝑐𝑜𝑢𝑛𝑡𝑒𝑑 𝑏𝑦 𝐹𝐶𝑀×
1 × 10⁵
1 𝑚𝐿
For the dry weight of biomass per volume of the suspension of Chlorella vulgaris or
Microcystis aeruginosa, initial mass of a 0.45 μm filter membrane was measured after
heating in a furnace at 105°C for 2 hours. An aliquot (140 mL) of biomass sample was
collected on each sampling day during exponential phase and was vacuum filtered
through the filter membrane. DI water was used to wash sample on the filter for 3 times
to wash out chemicals attached on the cell surface. The filter membrane along with
biomass was dried for 2 hours at 105°C and the dry weight of biomass per volume was
calculated as follows:
𝑔
𝑚𝐿=
𝑛𝑒𝑡 𝑤𝑒𝑖𝑔ℎ𝑡 𝑜𝑓 𝑚𝑒𝑚𝑏𝑟𝑎𝑛𝑒 𝑏𝑒𝑓𝑜𝑟𝑒 𝑎𝑛𝑑 𝑎𝑓𝑡𝑒𝑟 𝑓𝑖𝑙𝑡𝑟𝑎𝑡𝑖𝑜𝑛
𝑓𝑖𝑙𝑡𝑟𝑎𝑡𝑖𝑜𝑛 𝑣𝑜𝑙𝑢𝑚𝑒

39
Finally the dry weight of individual algal or cyanobacterial cells was calculated based
on cell concentration and dry weight of biomass per volume in the following:
𝑔
𝑐𝑒𝑙𝑙=
𝑑𝑟𝑦 𝑤𝑒𝑖𝑔ℎ𝑡 (𝑔/𝑚𝐿)
𝑐𝑒𝑙𝑙 𝑐𝑜𝑛𝑐𝑒𝑛𝑡𝑟𝑎𝑡𝑖𝑜𝑛 (𝑐𝑒𝑙𝑙/𝑚𝐿)
2.4 Determination of Cell Dry Weight of Nonphotosynthetic Bacteria at Exponential
Growth Phase
Escherichia. coli (TOP 10) was inoculated in sterilized Reasoner’s 2A agar (R2A)
medium with 5-fold dilution since original R2A medium easily caused biofilm
formation. The diluted R2A medium contains the following nutrients per liter: 0.1g
yeast extract, 0.1 g pepteose peptone, 0.1 g casamino acids, 0.1 g dextrose, and 0.1 g
soluble starch. In addition, the medium contained 0.06 g/L sodium pyruvate, 0.06 g/L
dipotassium sulfate and 0.01 g/L magnesium sulfate (H. Cai et al., 2014). E.coli was
cultivated on a shaker (180 rpm) in an incubator at 37 ℃ for 6 hours. The cell
concentration and cell size were determined at the end of cultivation.
To count E.coli cell number of a sample at the exponential phase, a standard plate count
method was applied for bacterial enumeration. By using PBS buffer, serial dilution was
performed and inoculated agar plates were stored for 10 h at 37°C in incubator. The
bacterial cell numbers in colony forming units (CFU) were determined after the
cultivation by taken into account the dilution factor.

40
The dry weight per volume of E.coli sample was determined similarly to that of algae
or cyanobacteria with minor modification. An aliquot (100 mL) of bacterial suspension
was centrifuged at 30,000 rpm for 10 min to remove the upper layer of supernatant
(about 90 mL). The remaining cell suspension was filtered through 0.22 μm filter for
bacterial mass determination.
2.5 Determination of Cell Dry Weight of the Algae in Continuous Flow Bioreactor
Two bench-scale continuous stirred tank reactor (CSTRs) were operated for Chlorella
vulgaris cell size, cell dry weight and cell density calculation (Figure 2.3).
Figure 2.3 Experimental setup of two identical bench-scale CSTR systems
Each CSTR system had a total volume of 7.7 L, which was operated at a SRT of 7 d.
Because of complete mixing and with no biomass recycling, SRT and HRT were the
same in such a system. During the start-up operation, 1.2 L Chlorella vulgaris was
inoculated with the modified BBM medium. The algal CSTR system was operated at
24 ± 1 ℃ with a 12/12 L/D cycle until steady state (> 3 SRTs) was reached. The cell

41
concentration, cell size, OD, influent and effluent water quality parameters, such as pH,
orthophosphate-P, and biomass COD concentrations were determined when the CSTR
system reached steady-state. To determine the effect of phosphorous adsorption on cell
dry weight measurement, intercellular and extracellular phosphorous contents of algal
biomass in the algal CSTRs were determined according to the method described
elsewhere through oxalic acid washing (Sañudo-Wilhelmy et al., 2004)
2.6 Cell Size of Algae and Cyanobacteria
To measure phototrophic cell size, fluorescent microscopy is an appropriate method
based on autofluoresence of phototrophs. Fluorescent microscopy (Olympus I×70)
with Cy5HQ filter with excitation wavelength of 590-650 nm and emission wavelength
in the rage of 670-735 nm was applied to determine the size of Chlorella vulgaris and
Microcystis aeruginosa. MetaMorph software was applied for image analysis. For
fluorescent microcopy, cell size was averaged from the measurements of 30 cells
measured for each sample. With triplicate samples, a total of 90 cells were measured
for size on each sampling day.
2.7 Cell Density of Algae and Cyanobacteria
Based on cell size data collected by fluorescent microscopy, individual cell volume was
calculated since cells are spherical. Associated with cell concentration measured by
flow cytometry and hemocytometry and dry weight biomass concentration, cell density
was calculated as follows:

42
cell density (𝑔 𝑐𝑚3⁄ ) =𝑑𝑟𝑦 𝑤𝑒𝑖𝑔ℎ𝑡 (𝑔/𝑐𝑒𝑙𝑙)
𝑖𝑛𝑑𝑖𝑣𝑖𝑑𝑢𝑎𝑙 𝑐𝑒𝑙𝑙 𝑣𝑜𝑙𝑢𝑚𝑒 (𝑐𝑚3)

43
3. Results and Discussion
3.1 Cell Concentration Determined by Spectrophotometer, Hemocytometry and Flow
Cytometry
Pure Chlorella vulgaris and Microcystis aeruginosa cultures were diluted in series to
have different OD values before the cell concentration was correlated and determined
by hemocytometry, spectrophotometry, and flow cytometry, respectively, as shown in
Figure 3.1 and Figure 3.2.
(a)
0
5
10
15
0 0.2 0.4 0.6 0.8 1
Cel
l num
ber
(×
10
6ce
lls/
mL
)
OD680

44
(b)
Figure 3.1 A standard curve of cell concentration determined by flow cytometry for algae (a, R2=0.997)
and cyanobacteria (b, R2=0. 997)
(a)
0
5
10
15
20
25
0 0.2 0.4 0.6 0.8 1
Cel
l num
ber
(×
10
6ce
lls/
mL
)
OD680
0
5
10
15
20
0 0.2 0.4 0.6 0.8 1
Cel
l num
ber
(×
10
6ce
lls/
mL
)
OD680

45
(b)
Figure 3.2 A standard curve of cell concentration determined by hemocytometry for algae (a, R2=0.993)
and cyanobacteria (b, R2=0. 997)
The two methods used for cell counting, has a good linear relationship (Figure 3.3).
However, hemocytometric counting results were always greater than those of flow
cytometry. For algae, cell numbers counted by hemocytometry counts are about 1.4
times more than flow cytometer. While for cyanobacteria, hemocytometry counts are
about 1.7 times greater than flow cytometry. Flow cytometry may underestimate cell
numbers due to cell aggregation during cell counting while hemocytometry could
include more human errors.
0
10
20
30
40
0 0.2 0.4 0.6 0.8 1
Cel
l num
ber
(×
10
6ce
lls/
mL
)
OD680

46
(a)
(b)
Figure 3.3 A correlation of cell concentration determined by hemocytometry and flow cytometry for
algae (a, R2=0.997) and cyanobacteria (b, R2=0. 998)
0
5
10
15
20
0 2 4 6 8 10 12 14
Cel
l num
ber
by h
emocy
tom
eter
(×10
6ce
lls/
mL
)
Cell number by flow cytometer (×106 cells/mL)
0
10
20
30
40
0 5 10 15 20 25
Cel
l num
ber
by h
emocy
tom
eter
(×10
6ce
lls/
mL
)
Cell number by flow cytometer (×106 cells/mL)

47
3.2 Cell Counting for Mixed Phototrophic Samples
The phototrophic samples were prepared as mixed cultures with ratios of 1:1, 1:2, 1:3,
1:4, 1:5, 2:1, 3:1, 4:1 and 5:1 between Chlorella vulgaris and Microcystis aeruginosa
based on hemocytomotry. Flow cytometry was applied to differentiate phototrophs and
determine their fractions (Figure 3.4). A standard curve of cell ratio between Chlorella
vulgaris and Microcystis aeruginosa determined by flow cytometry versus that by
hemocytometry are shown in Figure 3.5.
Figure 3.4 Difference in size and morphology based flow cytometry (algae: cyanobacteria=1:1 counted
by hemocytometry)

48
Figure 3.5 A standard curve of the ratio of algae to cyanobacteria determined by flow cytometry verse
that by hemocytometry (R2=0.999)
The results demonstrated that flow cytometry is capable of differentiating algae from
cyanobacteria based on their difference in cell size and morphology. A good linear
relationship between the two ratios existed. However, the ratio determined by
hymocytometry was about 2.5 times of that by flow cytometry. This might be due to
underestimation of cyanobacterial cell numbers by hemocytometer as cell sizes of
cyanobaceteria were too small to differentiate under microscopy. Moreover,
aggregation of cyanobacteria could affect cell counting.
3.3 Dry Weight of Individual Algal, Cyanobacterial and E. coli Cells at Exponential
Growth Phase
From the batch growth curve of Chlorella vulgaris, algal cells continued to grow from
day 0 to day 16 (Figure 3.6). Algal samples were taken on days 4, 8, 12, and 16.

49
Figure 3.6 Chlorella vulgaris growth curve
The OD of algal samples was adjusted to 0.433 before analysis by flow cytometry and
hemocytometry. Then combined with dry weight biomass concentration, individual cell
weight was determined (Table 3.1).
Table 3.1 Dry weight of individual Cholorella Vulgaris cells at exponential phase
At exponential growth phase, the dry weight of individual cells of Chlorella vulgaris
ranged from (1.54 ± 0.06) × 10-11 g/cell to (3.35 ± 0.71) × 10-11 g/cell, with an average
0
0.3
0.6
0.9
1.2
1.5
0 4 8 12 16
OD
68
0
Day
Flow cytometry Hemocytometry
Day 4 0.433 (3.08 ± 0.03)×10-11
(1.76 ± 0.04)×10-11
Day 8 0.433 (3.32 ± 0.01)×10-11
(1.54 ± 0.06)×10-11
Day 12 0.433 (3.35 ± 0.71)×10-11
(1.70 ± 0.07)×10-11
Day 16 0.433 (3.01 ± 0.33)×10-11
(1.73 ± 0.02)×10-11
Sampling day ODIndividual cell weight (g/cell)

50
of (2.24 ± 0.16) × 10-11 g/cell (n = 12). Although the modified BBM contained
sufficient phosphorous for C. vulgaris growth, the P concentration only decreased from
6.1 mg/L to 4.6 mg/L (Figure 3.7), suggesting that phosphorous uptake has little effect
on dry weight measurements in batch studies
Figure 3.7 Change in the orthophosphate-P concentration during the growth of chlorella vulgaris
Similar to algae, cyanobacteria continued to grow from day 0 to day 16 (Figure3.8).
The OD of cyanobacterial samples was fixed at 0.423 before flow cytometric and
hemocytometric measurements (Table 3.2).
0
1
2
3
4
5
6
7
0 4 8 12 16
PO
43
- -P
(m
g/L
)
Day

51
Figure 3.8 Growth curve of Microcystis aeruginosa
Table 3.2 Cell concentration and individual cell weight of Microcystis aeruginosa in exponential
phase
At exponential phase, individual cell weight varies from (6.02 ± 0.01) × 10-12 to (1.87
± 0.05) × 10-11 g/cell, with an average of (1.21 ± 0.09) × 10-11. Compared to algae, at
the same OD value, cell concentration of cyanobacteria is much greater, which results
from the cell size of cyanobacteria being smaller than algae. No phosphorous
aggregation was observed in the exponential phase of cyanobacteria (Figure 3.9).
0
0.2
0.4
0.6
0.8
1
0 4 8 12 16
OD
68
0
day
Flow cytometry Hemocytometry
Day 4 0.423 (1.43 ± 0.24)×10-11
(6.02 ± 0.01)×10-12
Day 8 0.423 (1.87 ± 0.05)×10-11
(7.33 ± 0.11)×10-12
Day 12 0.423 (1.86 ± 0.02)×10-11
(6.38 ± 0.05)×10-12
Day 16 0.423 (1.72 ± 0.03)×10-11
(7.99 ± 0.24)×10-12
Individual cell weight (g/cell)
`Sampling day OD

52
Figure 3.9 Orthophosphate-P concentration for Microcystis aeruginosa in exponential phase
E.coli individual dry weight determined by flow cytometry was (4.28 ± 0.43)×10-7
g/cell, indicating flow cytometry was not successful in counting E. coli cells due to cell
aggregation and floc formation during analysis. Hemocytometry was also not
successful in bacterial cell counting due to resolution issues. Alternatively, standard
agar plate counting was applied. The average dry weight of individual E. coli cells was
(1.69 ± 0.36) × 10-13 g/cell (n = 6).
3.4 Dry Weight of Individual Algal Cells in a Continuous Flow Bioreactor
An algal CSTR system was operated for more than 30 days (Figure 3.10). Algal samples
were collected on day 21 and day 26. Individual cell dry weight is shown in Table 3.3.
0
3
6
9
12
15
0 4 8 12 16
PO
43
- -P
Day

53
Figure 3.10 Change in the concentration of Chlorella vulgaris of the CSTR at the SRT of 7 d
Table 3.3 Individual cell dry weight of Cholorella vulgaris in CSTR
The average dry weight of individual C. vulgaris cells of the CSTR system ranged from
(2.16 ± 0.09) × 10-11 g/cell to (5.87 ± 0.27) × 10-11 g/cell with an average of (3.91 ±
0.26)×10-11 g/cell (n = 8), which almost double compared to that from the batch study.
However, orthophosphate-P concentration decreased rapidly in the first 4 days due to
the presence of phosphorus in the seed culture (Figure 3.11).
0
50
100
150
200
250
300
0 5 10 15 20 25 30 35
CO
D (
mg/L
)
Day
Flow cytometry Hemocytometry
Day 21 (5.87 ± 0.27)×10-11
(2.58 ± 0.13)×10-11
Day 26 (5.02 ± 0.54)×10-11
(2.16 ± 0.09)×10-11
Sampling day Individual cell weight (g/cell)

54
Figure 3.11 Change in the orthophosphate-P concentration of the CSTR for the growth of Cholorella
Vulgaris
To determine whether phosphorous adsorption or coprecipitation on the cell surface has
a significant effect on individual cell weight, intercellular and extracellular P contents
were determined to be 7.18 × 10⁻¹³ and 4.23 × 10⁻¹³ g P/cell, respectively. Compared to
the average dry weight of an algal cell, the effect of phosphorous
adsorption/precipitation is neglected, which means most phosphorous decreased can be
attributed to the use orthophosphate-P for growth by the algae for cell formation. Indeed,
given the known of cell concentrations, the intracellular P content of algae in the CSTR
was 1.30 %, which is very close to the empirical value 1.35% of algae from the formula
C106H181O45N6P. These data suggest that individual algal cell weight in CSTR is larger
than batch study.
0
1
2
3
4
5
0 5 10 15 20 25 30 35
PO
43
- -P
(m
g/L
)
day

55
3.5 Cell Size and Cell Density of Algae and Cyanobacteria
3.5.1 Cell Size of Algae and Cyanobacteria
The cell size in micrometers of algae and cyanobacteria were measured by fluorescent
microscopy. Cell sizes for Cholorella Vulgaris and Microcystis aeruginosa in batch
study are shown in Table 3.4 and Figure 3.12.
Table 3.4 Cells size in batch of Cholorella vulgaris and Microcystis aeruginosa
(a)
Sampling day Min Max Mean Min Max Mean
4 2.66 5.72 3.79 ± 0.61 1.47 7.20 2.62 ± 0.46
8 2.90 7.99 4.72 ± 1.20 2.64 4.45 3.33 ± 0.38
12 2.43 8.12 5.32 ± 1.27 1.40 6.68 3.30 ± 0.91
16 2.62 5.13 3.54 ± 0.51 1.35 4.19 2.74 ± 0.68
Algae diameter (μm) Cyanobacteria diameter (μm)
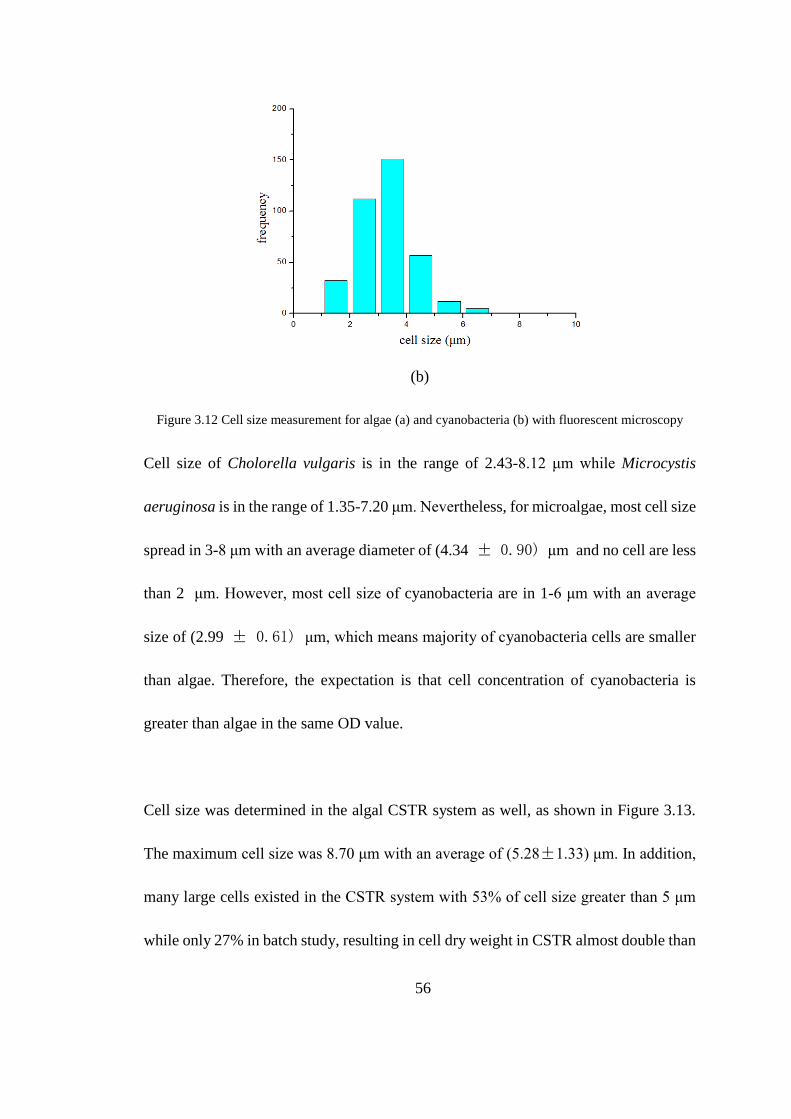
56
(b)
Figure 3.12 Cell size measurement for algae (a) and cyanobacteria (b) with fluorescent microscopy
Cell size of Cholorella vulgaris is in the range of 2.43-8.12 μm while Microcystis
aeruginosa is in the range of 1.35-7.20 μm. Nevertheless, for microalgae, most cell size
spread in 3-8 μm with an average diameter of (4.34 ± 0.90) μm and no cell are less
than 2 μm. However, most cell size of cyanobacteria are in 1-6 μm with an average
size of (2.99 ± 0.61) μm, which means majority of cyanobacteria cells are smaller
than algae. Therefore, the expectation is that cell concentration of cyanobacteria is
greater than algae in the same OD value.
Cell size was determined in the algal CSTR system as well, as shown in Figure 3.13.
The maximum cell size was 8.70 μm with an average of (5.28±1.33) μm. In addition,
many large cells existed in the CSTR system with 53% of cell size greater than 5 μm
while only 27% in batch study, resulting in cell dry weight in CSTR almost double than

57
that of batch study. These larger cells were attributed to cell aggregation and floc
formation in the long-term CSTR operation.
Figure 3.13 Cell size measurement in algal CSTR with fluorescent microscopy
3.5.2 Cell Density of Algae and Cyanobacteria
Combined individual cell dry weight and size, cell density was determined. Cell density
of Chlorella vulgaris and Microcystis aeruginosa were (0.57 ± 0.04) g/cm3 and (0.87 ±
0.02) g/cm3, respectively. In the algal CSTR system, cell density of Chlorella vulgaris
was (0.51 ± 0.07) g/cm3.

58
4. Conclusions
This research determined the cell dry weight, cell size and cell density of algae
Chlorella vulgaris and cyanobacteria Microcystis aeruginosa at exponential phase. The
results were also compared with those of an algal CSTR system under continuous flow
operation.
For phototrophs cultivated in batch systems, the dry cell weight of individual cells of
Chlorella vulgaris and Microcystis aeruginosa were (2.24 ± 0.16) ×10-11 g/cell and
(1.21 ± 0.09) ×10-11 g/cell, respectively. For comparison, a regular bacterium E.coli has
a cell weight of (1.69 ± 0.36) ×10-13 g/cell. Compared to that of batch growth result, in
the algal CSTR system, the average cell weight increased to (3.91 ± 0.26) ×10-11 g/cell,
which was attributed to cell aggregation or colony formation through long-term
continuous flow operation.
The dry weight of individual algal or cyanobacterial cells depends on cell size. The cell
size of algae ranged from 2.43 to 8.12 μm, with an average of (4.34 ± 0.90) μm. For
comparison, the cell size of cyanobacteria ranged from 1.35 to 7.20 μm with an average
of (2.29 ± 0.61) μm. Cell densities for algae and cyanobacteria were (0.57 ± 0.04)
g/cm3 and (0.87 ± 0.02) g/cm3, respectively. While in algal CSTR systems, average
algal cell size increased to (5.28 ± 1.33) μm and the cell density was (0.51 ± 0.07) g/cm3.

59
5. Future Study
Individual cell weight may be affected by lipid content in phototrophs. Light intensity,
nutrients concentration, nitrogen and phosphorous ratio and other factors may change
intracellular composition including lipid content. Future research can be explored to
determine the effect of these factors.
Individual cell weight and cell density may change when algae are cultivated under P
limited conditions, which often results in luxury P uptake (Riegman et al., 2000). Future
research is needed to determine these physical properties of the cells under
environmental stress conditions.

60
Reference
Adrien, N. G. (1998). Derivation of mean cell residence time formula. Journal of
Environmental Engineering, 124(5), 473-474.
Andersen, R. A. (2005). Algal Culturing Techniques, Elsevier Science Publishing Co
Inc.
APHA, A., WEF. (2005). Standard Methods for the Examination of Water and
Wastewater, 21st edition. Washington, DC: American Public Health
Association.
Ata, A., Nalcaci, O. O., & Ovez, B. (2012). Macro algae Gracilaria verrucosa as a
biosorbent: A study of sorption mechanisms. Algal Research, 1(2), 194-204.
Biesta-Peters, E. G., Reij, M. W., Joosten, H., Gorris, L. G. M., & Zwietering, M. H.
(2010). Comparison of two optical-density-based methods and a plate count
method for estimation of growth parameters of bacillus cereus. Applied and
Environmental Microbiology, 76(5), 1399-1405.
Bitog, J. P., Lee, I. B., Lee, C. G., Kim, K. S., Hwang, H. S., Hong, S. W., . . . Mostafa,
E. (2011). Application of computational fluid dynamics for modeling and
designing photobioreactors for microalgae production: A review. Computers
and Electronics in Agriculture, 76(2), 131-147.
Boulos, L. (1999). LIVE/DEAD BacLight: application of a new rapid staining method
for direct enumeration of viable and total bacteria in drinking water, Journal of
Microbiological Methods.
Boyer, M., & Combrisson, J. (2013). Analytical opportunities of quantitative
polymerase chain reaction in dairy microbiology. International Dairy Journal,
30(1), 45-52.
Bryan, A. K., Hecht, V. C., Shen, W., Payer, K., Grover, W. H., & Manalis, S. R. (2014).
Measuring single cell mass, volume, and density with dual suspended
microchannel resonators. Lab Chip, 14(3), 569-576. doi: 10.1039/c3lc51022k
Cai, H., Zhang, W. M., Yang, H. H., Wang, Y. M., Zhang, B., Jiang, R., . . . Qian, J. Q.
(2014). Comparison of different culture media on bacterial colony count in
hemodialysis water. Journal of Shanghai Jiaotong University (Medical Science),
34(1), 56-59+87.
Cai, T., Park, S. Y., & Li, Y. (2013). Nutrient recovery from wastewater streams by
microalgae: Status and prospects. Renewable and Sustainable Energy Reviews,
19, 360-369.
Červený, J., Šetlík, I., Trtílek, M., & Nedbal, L. (2009). Photobioreactor for cultivation
and real-time, in-situ measurement of O2 and CO2 exchange rates, growth
dynamics, and of chlorophyll fluorescence emission of photoautotrophic
microorganisms. Engineering in Life Sciences, 9(3), 247-253.

61
Chioccioli, M., Hankamer, B., & Ross, I. L. (2014). Flow cytometry pulse width data
enables rapid and sensitive estimation of biomass dry weight in the microalgae
Chlamydomonas reinhardtii and Chlorella vulgaris. PLoS One, 9(5), e97269.
doi: 10.1371/journal.pone.0097269
Chisti, Y. (2007). Biodiesel from microalgae. Biotechnology Advances, 25(3), 294-306.
Coale, K. H., Johnson, K. S., Fitzwater, S. E., Gordon, R. M., Tanner, S., Chavez, F.
P., . . . Kudela, R. (1996). A massive phytoplankton bloom induced by an
ecosystem-scale iron fertilization experiment in the equatorial Pacific Ocean.
Nature, 383(6600), 495.
Das, P., Aziz, S. S., & Obbard, J. P. (2011). Two phase microalgae growth in the open
system for enhanced lipid productivity. Renewable Energy, 36(9), 2524-2528.
De Graaf, M. T., De Jongste, A. H. C., Kraan, J., Boonstra, J. G., Smitt, P. A. E. S., &
Gratama, J. W. (2011). Flow cytometric characterization of cerebrospinal fluid
cells. Cytometry Part B - Clinical Cytometry, 80 B(5), 271-281.
Fan, L., Zhang, Y., Cheng, L., Zhang, L., Tang, D., & Chen, H. (2007). Optimization
of carbon dioxide fixation by chlorella vulgaris cultivated in a membrane-
photobioreactor. Chemical Engineering and Technology, 30(8), 1094-1099.
Godhe, A., Asplund, M. E., Härnström, K., Saravanan, V., Tyagi, A., & Karunasagar,
I. (2008). Quantification of diatom and dinoflagellate biomasses in coastal
marine seawater samples by real-time PCR. Applied and Environmental
Microbiology, 74(23), 7174-7182.
Griffiths, M. J., Garcin, C., van Hille, R. P., & Harrison, S. T. (2011). Interference by
pigment in the estimation of microalgal biomass concentration by optical
density. J Microbiol Methods, 85(2), 119-123. doi:
10.1016/j.mimet.2011.02.005
Griffiths, M. J., Garcin, C., van Hille, R. P., & Harrison, S. T. L. (2011). Interference
by pigment in the estimation of microalgal biomass concentration by optical
density. Journal of Microbiological Methods, 85(2), 119-123. doi:
http://dx.doi.org/10.1016/j.mimet.2011.02.005
Grigoryve, Y. (2013). Cell counting with a hemocytometeer, BitesizeBio.
Grover, W. H., Bryan, A. K., Diez-Silva, M., Suresh, S., Higgins, J. M., & Manalis, S.
R. (2011). Measuring single-cell density. Paper presented at the 15th
International Conference on Miniaturized Systems for Chemistry and Life
Sciences 2011, MicroTAS 2011.
Haese, E. D., Nelis, H.J.,. (2002). Rapid detection of single cell bacteria as a novel
approach in food microbiology. J. AOAC. Int., 85: 979-983.
Harper, D. (1992). The ecological relationships of aquatic plants at Lake Naivasha,
Kenya. Hydrobiologia, 232(1), 65-71.

62
Harrison, P. J., Thompson, P. A., & Calderwood, G. S. (1990). Effects of nutrient and
light limitation on the biochemical composition of phytoplankton. Journal of
Applied Phycology, 2(1), 45-56.
Havlik, I., Reardon, K. F., Ünal, M., Lindner, P., Prediger, A., Babitzky, A., . . . Scheper,
T. (2013). Monitoring of microalgal cultivations with on-line, flow-through
microscopy. Algal Research, 2(3), 253-257. doi: 10.1016/j.algal.2013.04.001
Held, P. (2011). [Determination of Algal Cell Lipds Using Nile Red-Using Microplates
to Monitor Neutral Lipids in Chlorella Vulgaris]. Retrved 6/5, 2014, from
http://www.biotek.com/resources/articles/nile-red-dye-algal.html.
Hyka, P., Lickova, S., Přibyl, P., Melzoch, K., & Kovar, K. (2013). Flow cytometry for
the development of biotechnological processes with microalgae. Biotechnology
Advances, 31(1), 2-16.
Infante, C., León, I., Florez, J., Zárate, A., Barrios, F., & Zapata, C. (2013). Removal
of ammonium and phosphate ions from wastewater samples by immobilized
Chlorella sp. International Journal of Environmental Studies, 70(1), 1-7.
Jacson, G. A. (1989). Simulation of bacterial attraction and adhesion to falling particles
in an aquatic environment. Limnol. Oceanogr., 34(3), 514-530.
Johnson, T. S., Badri, J., Sastry, R. K., Shrivastava, A., Kishor, P. B. K., & Sujatha, M.
(2013). Genetic improvement of Biofuel plants: Recent progress and patents.
Recent Patents on DNA and Gene Sequences, 7(1), 2-12.
Katase, M., Tsuboi, S., & Tsumura, K. (2013). Rapid enumeration of viable bacterial
cells in processed soy products using an automated cell counting system. Food
Control, 32(2), 501-504.
Kelvinsong. (2013). [Diagram of a cyanobacterium], Retrived 6/19, 2014, from
http://en.wikipedia.org/wiki/Cyanobacteria#mediaviewer/File:Cyanobacterium
-inline.svg.
Khan, N. Z. (2013). Vesicle Transport with Emphasis on Chloroplasts. University of
Gothenburg.
Knowles, E. J., & Castenholz, R. W. (2008). Effect of exogenous extracellular
polysaccharides on the desiccation and freezing tolerance of rock-inhabiting
phototrophic microorganisms. FEMS Microbiol Ecol, 66(2), 261-270. doi:
10.1111/j.1574-6941.2008.00568.x
Kuma, K., & Matsunaga, K. (1995). Availability of colloidal ferric oxides to coastal
marine phytoplankton. Marine Biology, 122(1), 1-11.
Lam, P. K. S., Wut, P. F., Chan, A. C. W., & Wu, R. S. S. (1999). Individual and
combined effects of cadmium and copper on the growth response of Chlorella
vulgaris. Environmental Toxicology, 14(3), 347-353.
Lele, S. S., Kumar K. Jyoti. (2007). Algal Bioprocess Technology. New Age
International Pvt Led Publishers.
Madigan, M. T. (2005). Brock Biology of Microorganisms, 11th edn, SciELO Espana.

63
Mandal, P. K., Biswas, A.K., CHoi, K., Pal, U.K.,. (2011). Methods for Rapid Detection
of Foodborne Pathogens: An Overview. American Journal of Food Technology,
6: 87-102.
Martin, J. H., Coale, K. H., Johnson, K. S., Fitzwater, S. E., Gordon, R. M., Tanner, S.
J., . . . Tindale, N. W. (1994). Testing the iron hypothesis in ecosystems of the
equatorial Pacific Ocean. Nature, 371(6493), 123-129.
Mata, T. M., Martins, A. A., & Caetano, N. S. (2010). Microalgae for biodiesel
production and other applications: A review. Renewable and Sustainable
Energy Reviews, 14(1), 217-232.
Merchuk, J. C., Gluz, M., & Mukmenev, I. (2000). Comparison of photobioreactors for
cultivation of the red microalga Porphyridium sp. Journal of Chemical
Technology and Biotechnology, 75(12), 1119-1126.
Miller, R. F., Cloutier, R., & Turner, S. (2003). The oldest articulated chondrichthyan
from the Early Devonian period. Nature, 425(6957), 501-504. doi:
10.1038/nature02001
Monteiro, C. M., Castro, P. M. L., & Malcata, F. X. (2012). Metal uptake by microalgae:
Underlying mechanisms and practical applications. Biotechnology Progress,
28(2), 299-311.
Myers, A. J., Curtis, S. B., Cuitis, R. W. (2013). Improving accuracy of cell and
chromophore concentration measurements using optical density, BMC
Biophysics.
Nair, A. J. (2005). Comprehensive Biotechnology Xii, Firewall Media.
Necchi. (2004). Photosynthetic responses to temperature in tropical lotic macroalgae.
Phycological Research, 52(2), 140-148.
NIES. (2013). [National Institute for Environmental Studies Microcystis aeruginosa].
Retrieved 6/2/2014, from http://mcc.nies.go.jp//strainList.do?strainId=1308.
Parmar, A., Singh, N. K., Pandey, A., Gnansounou, E., & Madamwar, D. (2011).
Cyanobacteria and microalgae: a positive prospect for biofuels. Bioresour
Technol, 102(22), 10163-10172. doi: 10.1016/j.biortech.2011.08.030
Pulz, O. (2001). Photobioreactors: Production systems for phototrophic
microorganisms. Applied Microbiology and Biotechnology, 57(3), 287-293.
Richmond, A. (2004). Principles for attaining maximal microalgal productivity in
photobioreactors: An overview. Hydrobiologia, 512, 33-37.
Riegman, R., Stolte, W., Noordeloos, A. A. M., & Slezak, D. (2000). Nutrient uptake
and alkaline phosphatase (EC 3:1:3:1) activity of Emiliania huxleyi
(Prymnesiophyceae) during growth under N and P limitation in continuous
cultures. Journal of Phycology, 36(1), 87-96.
Rioboo, C., O'Connor, J. E., Prado, R., Herrero, C., & Cid, A. (2009). Cell proliferation
alterations in Chlorella cells under stress conditions. Aquatic Toxicology, 94(3),
229-237.

64
Rittmann, B. E., Perry L. McCarty,. (2001). Environmental Biotechnology: Principles
and Applications,. McGraw-Hill, New York.
Rodríguez-Palacio, M. C., Crisóstomo-Vázquez, L., Álvarez-Hernández, S., & Lozano-
Ramírez, C. (2012). Strains of toxic and harmful microalgae, from waste water,
marine, brackish and fresh water. Food Additives and Contaminants - Part A
Chemistry, Analysis, Control, Exposure and Risk Assessment, 29(2), 304-313.
Ross, G. G. (1973). A model for the competitive growth of two diatoms. Journal of
Theoretical Biology, 42(2), 307-331.
Roth, B. L., Poot, M., Yue, S.T., Millard, P.J. (1997). Bacterial viability and antibiotic
susceptibility testing with SYTOX green nucleic acid stain. Applied and
Environmental Microbiology, 63(6), 2421-2431.
Rumora, K. (2011). [Freshwater & Marine Alagae: Mougeotia], Retrived 6/19, 2014,
from
http://protist.i.hosei.ac.jp/pdb/images/Chlorophyta/Stigeoclonium/sp_2a.html.
Sañudo-Wilhelmy, S. A., Tovar-Sanchez, A., Fu, F. X., Capone, D. G., Carpenter, E.
J., & Hutchins, D. A. (2004). The impact of surface-adsorbed phosphorus on
phytoplankton Redfield stoichiometry. Nature, 432(7019), 897-901.
Sanzani, S. M., Li Destri Nicosia, M. G., Faedda, R., Cacciola, S. O., & Schena, L.
(2014). Use of quantitative PCR detection methods to study biocontrol agents
and phytopathogenic fungi and oomycetes in environmental samples. Journal
of Phytopathology, 162(1), 1-13.
Simmons, D. B., & Wallschlager, D. (2011). Release of reduced inorganic selenium
species into waters by the green fresh water algae Chlorella vulgaris. Environ
Sci Technol, 45(6), 2165-2171. doi: 10.1021/es103337p
Srivastava, A. K. (2013). Stress Biology of Cyanobacteria : Molecular Mechanisms to
Cellular Responses, . CRC Press, Boca Raton, FL, USA.
Su, Y., Mennerich, A., & Urban, B. (2012). Coupled nutrient removal and biomass
production with mixed algal culture: Impact of biotic and abiotic factors.
Bioresource Technology, 118, 469-476.
Subashchandrabose, S. R., Ramakrishnan, B., Megharaj, M., Venkateswarlu, K., &
Naidu, R. (2013). Mixotrophic cyanobacteria and microalgae as distinctive
biological agents for organic pollutant degradation. Environment International,
51, 59-72.
Sun, Y., & Wang, C. (2009). The optimal growth conditions for the biomass production
of Isochrysis galbana and the effects that phosphorus, Zn2+, CO2, and light
intensity have on the biochemical composition of Isochrysis galbana and the
activity of extracellular CA. Biotechnology and Bioprocess Engineering, 14(2),
225-231.
Sze, P. (1998). A Biology of the algae 3 rd ed. . McGraw-Hill, Boston.

65
Tobe, K. (2006). Automated detection and enumeration for toxic algae by solid-phase
cytometry and the introduction of a new probe for Prymnesium parvum
(Haptophyta: Prymnesiophyceae). Journal of Plankton Research, 28(7), 643-
657. doi: 10.1093/plankt/fbi147
Tortora, G. J., Funk, B.R., Case, C.L.,. (2007). Microbiology, an introduction. 9th ed.
Boston: Pearson.
Tsukki, Y. (2013 ). [Cyanophyceae: Nostocales: Oscillatoriaceae]. Retrieved 6.2.2014,
from
http://protist.i.hosei.ac.jp/PDB/Images/Prokaryotes/Oscillatoriaceae/Lyngbya/
sp_01.html.
VanderGheynst, J. S., Guo, H. Y., Cheng, Y. S., & Scher, H. (2013). Microorganism
viability influences internal phase droplet size changes during storage in water-
in-oil emulsions. Bioprocess Biosyst Eng, 36(10), 1427-1434. doi:
10.1007/s00449-013-0886-6
Veldhuis, M. J. W., & Kraay, G. W. (2000). Application of flow cytometry in marine
phytoplankton research: Current applications and future perspectives. Scientia
Marina, 64(2), 121-134.
Wang, L., Li, Y., Chen, P., Min, M., Chen, Y., Zhu, J., & Ruan, R. R. (2010). Anaerobic
digested dairy manure as a nutrient supplement for cultivation of oil-rich green
microalgae Chlorella sp. Bioresource Technology, 101(8), 2623-2628.
Wen, Z. (2014). Algae for Biofuel Production, Retrived by 6/21, 2014, from
http://www.extension.org/pages/26600/algae-for-biofuel-
production#.U6aR7vmSzMB.
WHO. (2009). Guidelines for safe recreational water environments pp. 136-137
Widjaja, A., Chien, C. C., & Ju, Y. H. (2009). Study of increasing lipid production from
fresh water microalgae Chlorella vulgaris. Journal of the Taiwan Institute of
Chemical Engineers, 40(1), 13-20.
Xu, L., Weathers, P. J., Xiong, X. R., & Liu, C. Z. (2009). Microalgal bioreactors:
Challenges and opportunities. Engineering in Life Sciences, 9(3), 178-189.
Xu, M., Bernards, M., & Hu, Z. (2014). Algae-facilitated chemical phosphorus removal
during high-density Chlorella emersonii cultivation in a membrane bioreactor.
Bioresource Technology, 153, 383-387.
Zamor, R. M., Glenn, K. L., & Hambright, K. D. (2012). Incorporating molecular tools
into routine HAB monitoring programs: Using qPCR to track invasive
Prymnesium. Harmful Algae, 15, 1-7.
Zhou, W., Min, M., Li, Y., Hu, B., Ma, X., Cheng, Y., . . . Ruan, R. (2012). A hetero-
photoautotrophic two-stage cultivation process to improve wastewater nutrient
removal and enhance algal lipid accumulation. Bioresource Technology, 110,
448-455.

66
Appendixes
(a)
(b)
4
5
6
7
8
9
10
11
0 4 8 12 16
pH
Day

67
(c)
Figure S1 Changes in mixed liquor pH for the growth of Chlorella vulgaris (a) and Microcystis
aeruginosa (b) in batch and CSTR systems (c)
Figure S2 Changes in OD in an algal CSTR
0
2
4
6
8
10
0 5 10 15 20 25 30 35
pH
Day
0.000
0.050
0.100
0.150
0.200
0.250
0 5 10 15 20 25 30 35
OD
68
0
Day

68
Figure S3 Hemocytometric images of algae (left) and cyanobacteria (right)
Figure S4 Overlay images in bright field and fluorescent field of algae (left) and cyanobacteria (right)