dsd-int 2015 - heatstress urban area - kluck
TRANSCRIPT
Heatstress in urban public space
Delft Software Days 2015
Dr.ir. Jeroen KluckDeltares, 30 October 2015Expert Urban Water, Tauw
Professor Urban water, Amsterdam University of Applied Sciences

HEAT

Excess mortality
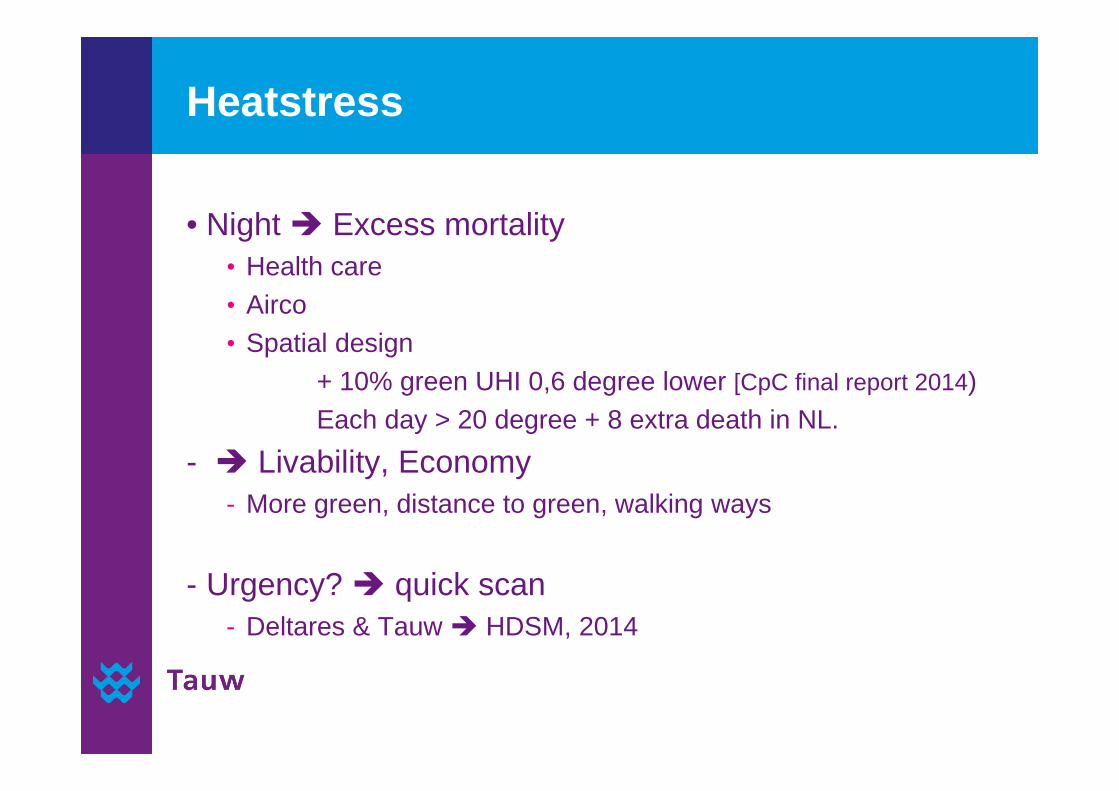
Heatstress
• Night Excess mortality• Health care• Airco• Spatial design
+ 10% green UHI 0,6 degree lower [CpC final report 2014)Each day > 20 degree + 8 extra death in NL.
- Livability, Economy- More green, distance to green, walking ways
- Urgency? quick scan- Deltares & Tauw HDSM, 2014
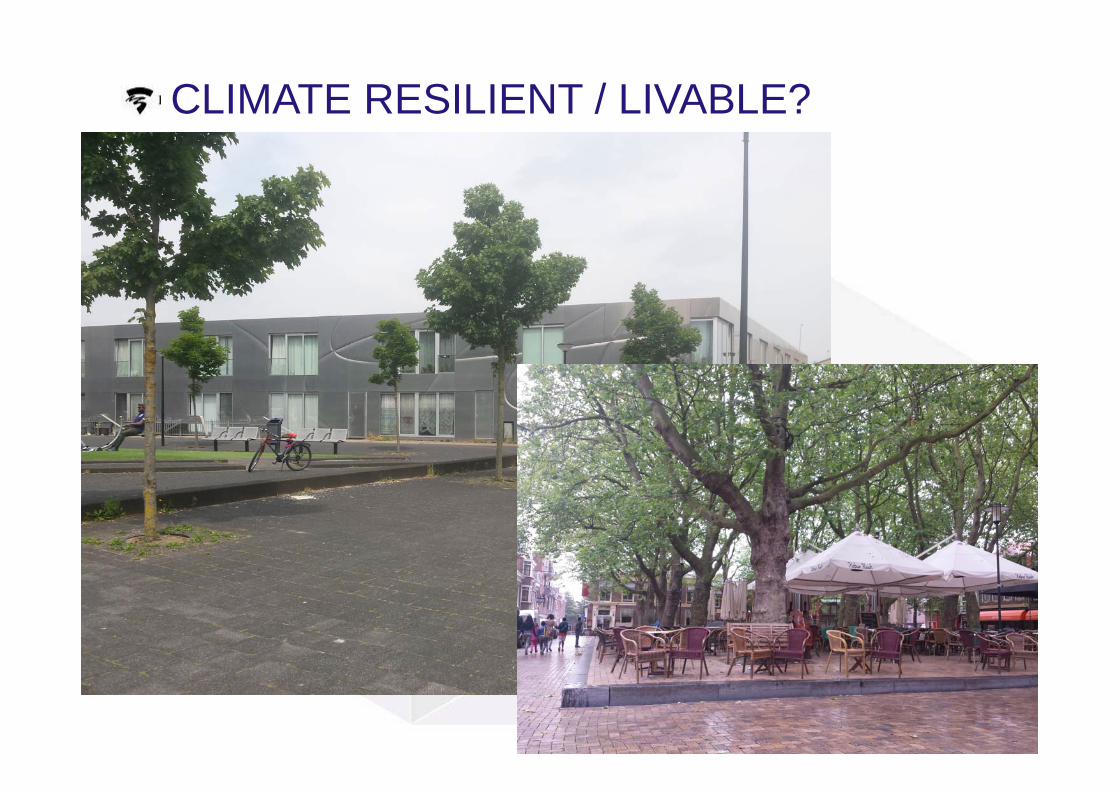
CLIMATE RESILIENT / LIVABLE?

Wat gebeurt er al?
Laura Kleerkoper, Amsterdam University of Applied Sciences

Urgency?
- Measurements?- Model (simple complete)
- start simple quick scan - Data lidar 0,5*0,5, water, green- assumptions
- Deltares & Tauw HDSM, 2014
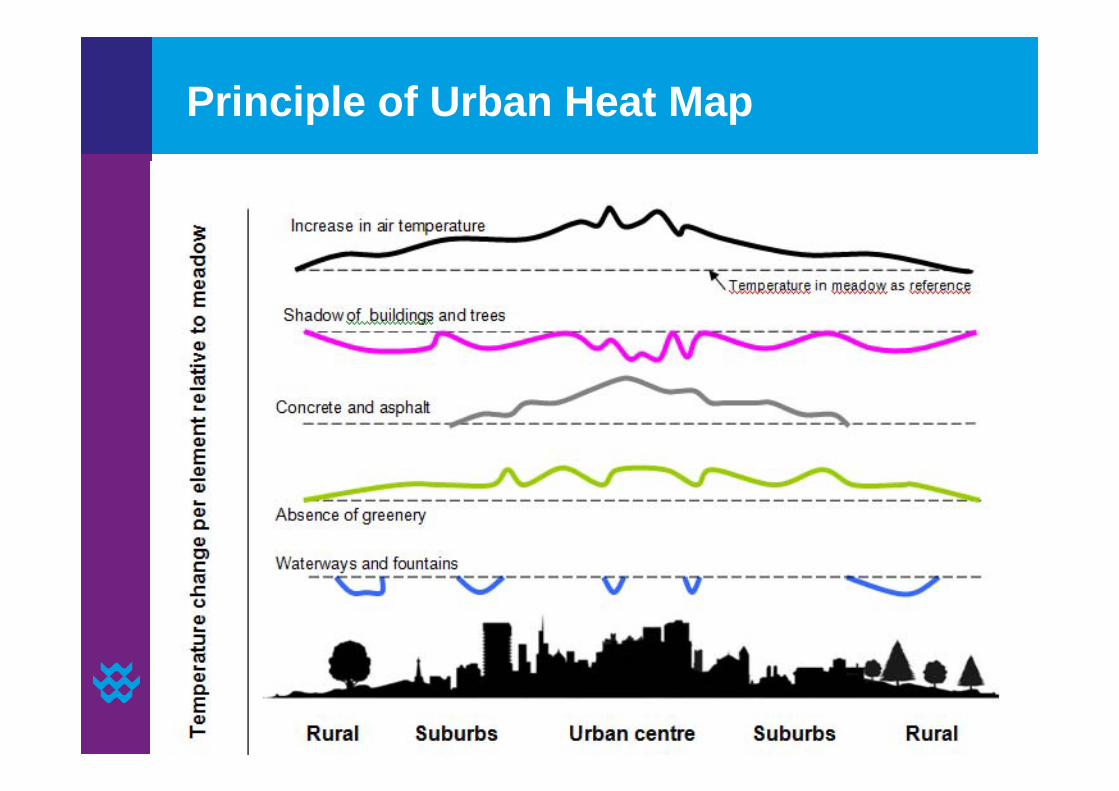
Principle of Urban Heat Map

Air temperature Groningen- Red is hotter,
- Blue is cooler
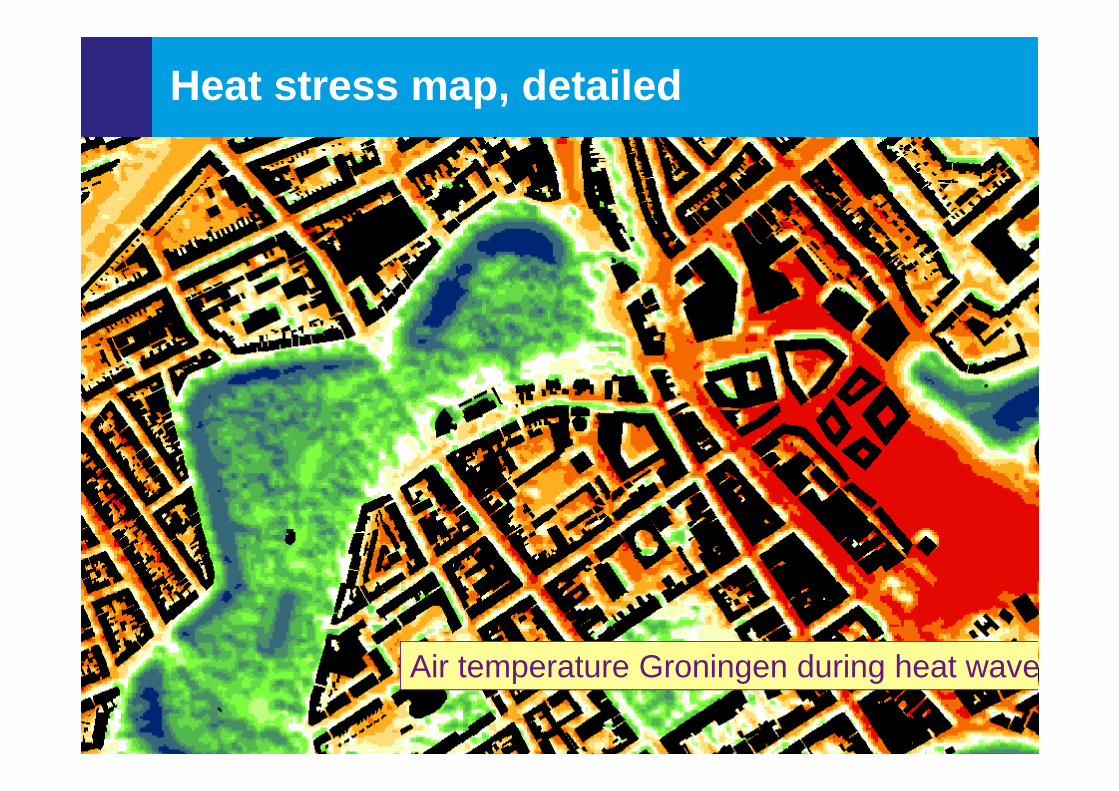
Air temperature Groningen during heat wave
Heat stress map, detailed
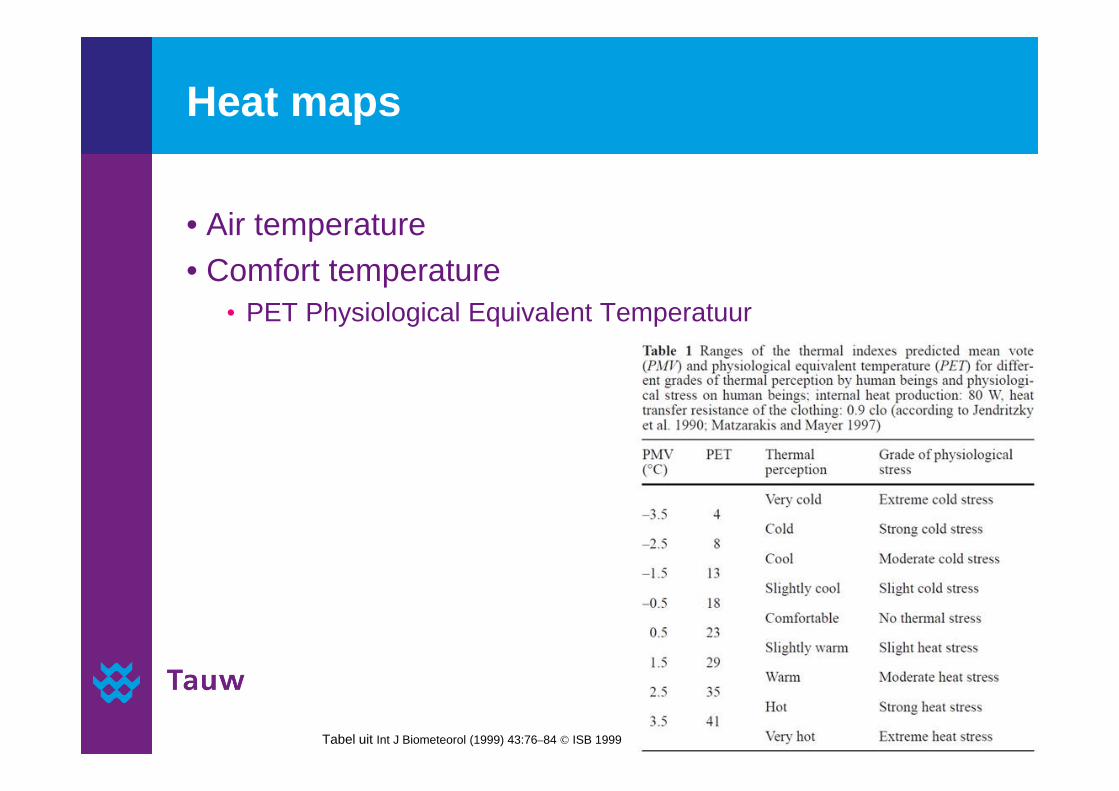
Heat maps
• Air temperature• Comfort temperature
• PET Physiological Equivalent Temperatuur
Tabel uit Int J Biometeorol (1999) 43:76–84 © ISB 1999
Aim
- Comfort temperature – measurements/opinion - Advice for spacial design- Examples of • climate robust design
12

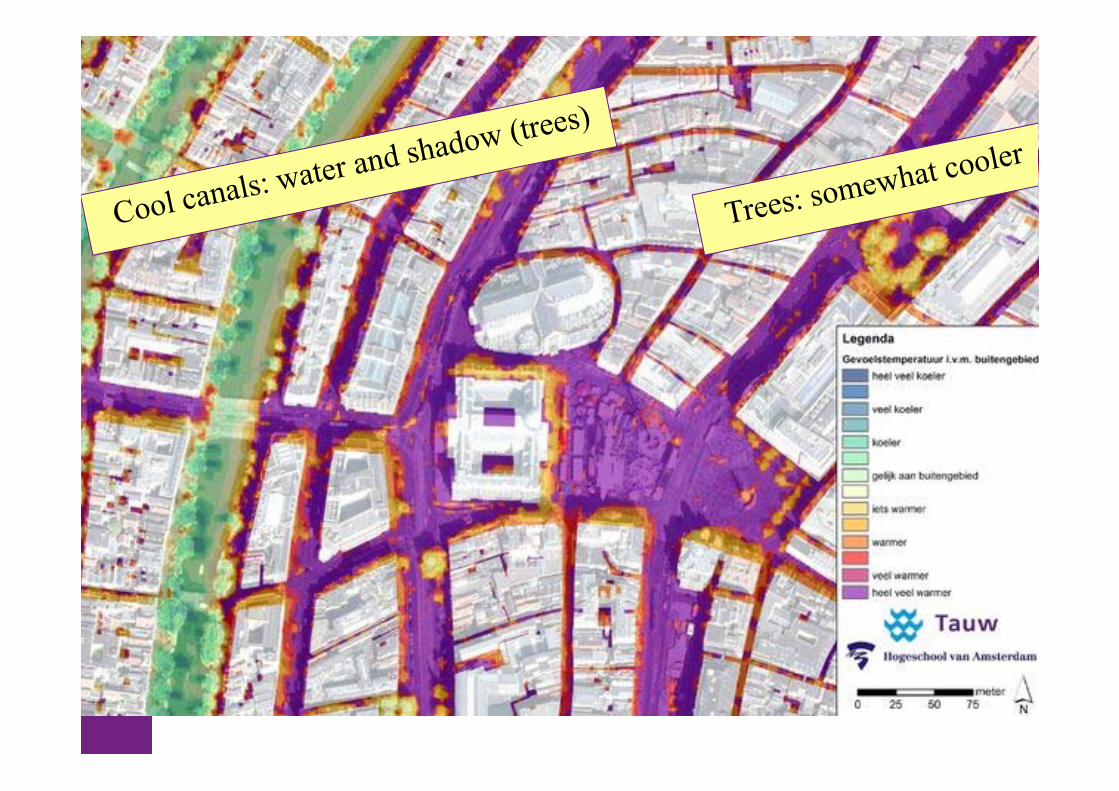
Heatstress map – effect trees

Expected PET 4th of juli ’15, Utrecht

Estimate of PET 2050 – end of hot day

Estimate of PET 2050 – end of hot day

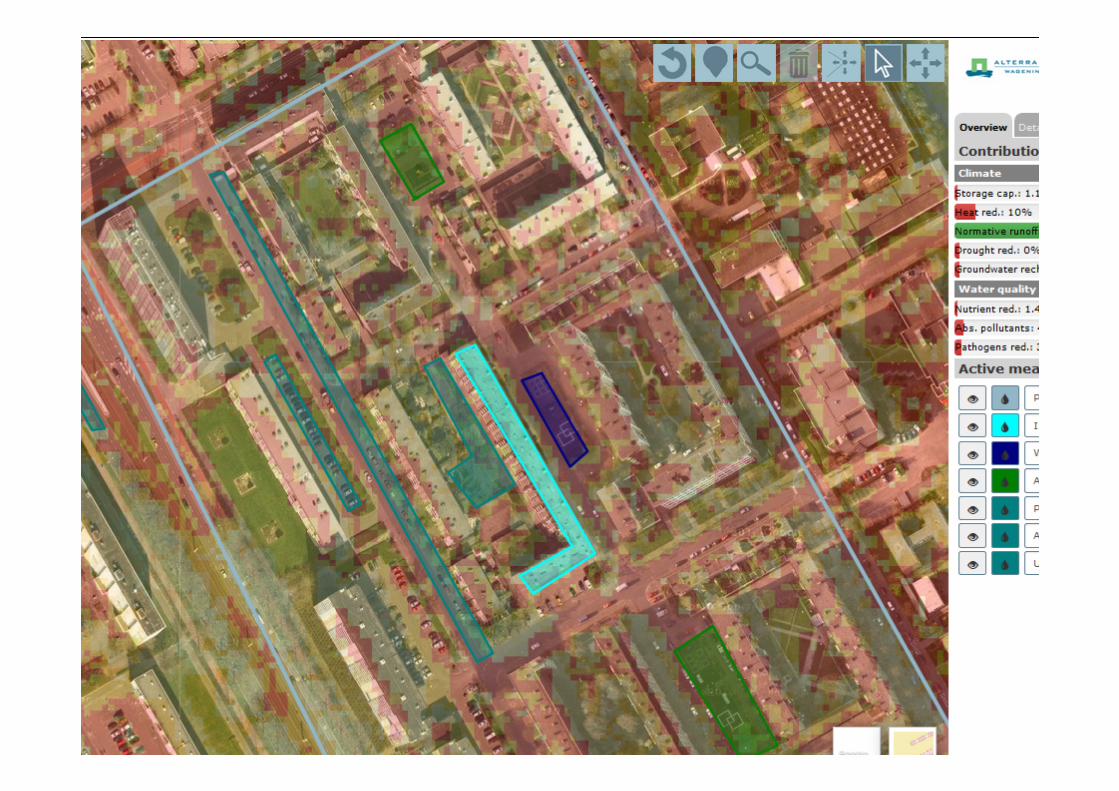
Design urban space
• Adaptation Support Tool (AST)• Insight in ‘hot’ spots• Insight in • Planning Effect of measures like
– Water– Trees/green