why modelling heatstress?
TRANSCRIPT

1
http://delta.tudelft.nl/article/green-gutters-abate-rain-storms/30246
Using Quick Scan methods for managementof urban heat and flood risks
or ‘I don’t like models’
.
ir. F. (Floris) Boogaard, Professor at HanzeUniversity of Applied Sciences Groningen (Netherland)[email protected]
Trondheim, 5 February 2016
Who is Floris Boogaard?Dutch direct: I don’t trust models
“EU”: (quick scan) models have my greatest respect(q ) y g p
16-2-2016 Kenniscentrum NoorderRuimte bureau NoorderRuimte
Content1. Why modelling heat and flooding?2. Quick scan models
1. Data needed
2. urban heat
3. flood risks
3. Verification and calibration4. Getting things done: quick wins5. Knowledge exchange (3D)6. More info?
Challenges in urban areas
16-2-2016 Kenniscentrum NoorderRuimte bureau NoorderRuimte
examples of problems in the Urban areas: floodings, degradation of waterways, heatstress, drought leading to lower groundwatertable and subsidence with results as damage of buildings
Why modelling heatstress?
16-2-2016 Kenniscentrum NoorderRuimte bureau NoorderRuimte
2
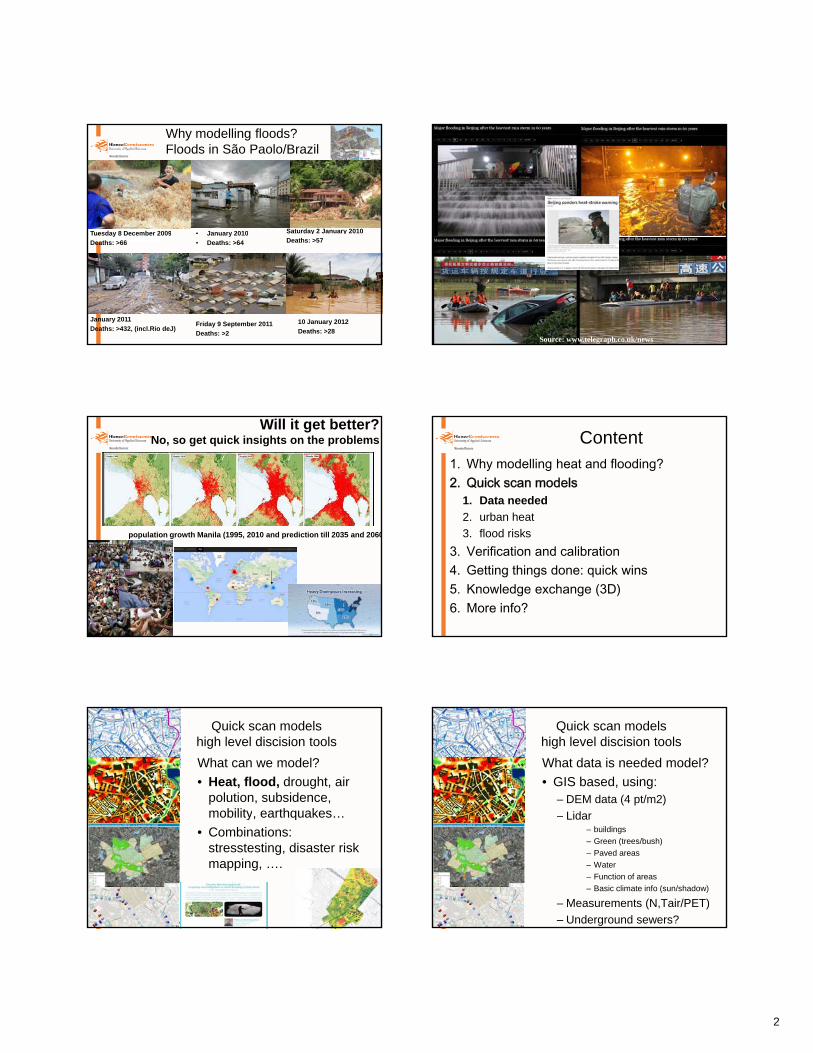
Why modelling floods?Floods in São Paolo/Brazil
Saturday 2 January 2010• January 2010Tuesday 8 December 2009 y y
Deaths: >57January 2010
• Deaths: >64
January 2011
Deaths: >432, (incl.Rio deJ)10 January 2012
Deaths: >28
Tuesday 8 December 2009
Deaths: >66
Friday 9 September 2011
Deaths: >216-2-2016 Kenniscentrum NoorderRuimte bureau NoorderRuimte16-2-2016
Kenniscentrum NoorderRuimte bureau NoorderRuimte
Source: www.telegraph.co.uk/news
Will it get better?No, so get quick insights on the problems
population growth Manila (1995, 2010 and prediction till 2035 and 2060
Content1. Why modelling heat and flooding?2. Quick scan models
1. Data needed
2. urban heat
3. flood risks
3. Verification and calibration4. Getting things done: quick wins5. Knowledge exchange (3D)6. More info?
Quick scan modelshigh level discision tools
What can we model?
• Heat, flood, drought, air polution, subsidence, mobility, earthquakes… y, q
• Combinations: stresstesting, disaster risk mapping, ….
16-2-2016 Kenniscentrum NoorderRuimte bureau NoorderRuimte
16-2-2016
Quick scan modelshigh level discision tools
What data is needed model?
• GIS based, using:– DEM data (4 pt/m2)
– LidarLidar– buildings
– Green (trees/bush)
– Paved areas
– Water
– Function of areas
– Basic climate info (sun/shadow)
– Measurements (N,Tair/PET)
– Underground sewers?16-2-2016
16-2-2016

3
Modelling extreme stormwater eventssimplifications
Modelling sewers at extreme events?Rubbish in is rubbish out
Modelling sewerscalibration
16-2-2016 Kenniscentrum NoorderRuimte bureau NoorderRuimte
Detailed modellingor quick scan?
Dagneerslag in augustus 2005neerslagmeter Bunnik
KNMI De Bilt
KNMI Doorn
overstortenoverstorten
InterneInterne--en/of externe en/of externe overstortenoverstorten eindgemaleneindgemalen
RioolRiool--en en
eindgemaleneindgemalenRegenmetersRegenmeters
RioolRiool--waterstandenwaterstanden
Gegevens opslagGegevens opslag
VerwerkingVerwerking
InformatieInformatieInformatieInformatie
RapportagesRapportages
Presentatie:Presentatie:BeeldschermBeeldschermRapportagesRapportages
TopografTopografieieEvenemEvenementenentenOntwikkOntwikkelingenelingen
RBSRBS ZBZB MIDMIDASAS
ExterExternn
DataData
ObjectObjectgegevengegevenss
ObjectObjectgegevengegevenss
MeetMeetgegevengegevenss
MeetMeetgegevengegevenss
RWZI’sRWZI’s kwaliteitkwaliteit
RegenwwterRegenwwterRegenwwterRegenwwter
GrondwaterGrondwaterGrondwaterGrondwater
OppervlaktewaterOppervlaktewaterOppervlaktewaterOppervlaktewater
0
5
10
15
20
25
30
35
1/08/
05
2/08
/05
3/08
/05
4/08
/05
5/08
/05
6/08
/05
7/08
/05
8/08
/05
9/08/
05
10/0
8/05
11/0
8/05
12/0
8/05
13/0
8/05
14/0
8/05
15/0
8/05
16/0
8/05
17/08
/05
18/0
8/05
19/0
8/05
20/0
8/05
21/08
/05
22/0
8/05
23/0
8/05
24/0
8/05
25/0
8/05
26/0
8/05
27/0
8/05
28/0
8/05
29/08
/05
30/0
8/05
31/0
8/05
datum
mm
nee
rsla
g
Nulmeting zuurstof in oppervlaktewater
0
1
2
3
4
5
6
7
8
-7-2
00
6 1
8:0
0
2-7
-20
06
21
:55
4-7
-20
06 1
:50
5-7
-20
06 5
:45
6-7
-20
06 9
:40
7-7
-20
06
13
:35
8-7
-20
06
17
:30
9-7
-20
06
21
:25
21
-7-2
006
1:2
0
22
-7-2
006
5:1
5
23
-7-2
006
9:1
0
4-7
-20
06
13
:05
5-7
-20
06
17
:00
6-7
-20
06
20
:55
28
-7-2
006
0:5
0
29
-7-2
006
4:4
5
30
-7-2
006
8:4
0
-7-2
00
6 1
2:3
5
-8-2
00
6 1
6:3
0
2-8
-20
06
20
:25
4-8
-20
06 0
:20
5-8
-20
06 4
:15
6-8
-20
06 8
:10
7-8
-20
06
12
:05
8-8
-20
06
16
:00
9-8
-20
06
19
:55
0-8
-20
06
23
:50
2-8
-20
06 3
:45
3-8
-20
06 7
:40
4-8
-20
06
11
:35
5-8
-20
06
15
:30
6-8
-20
06
19
:25
zuu
rsto
fge
ha
lte
(m
g O
2/l
)
-0,01
0,04
0,09
0,14
0,19
0,24
OT
OT
Extremes and contribution of sewers
Content1. Why modelling heat and flooding?2. Quick scan models: disaster modelling
1. Data needed
2. urban heat
3. flood risks
3. Verification and calibration4. Getting things done: quick wins5. Knowledge exchange 6. More info?
4
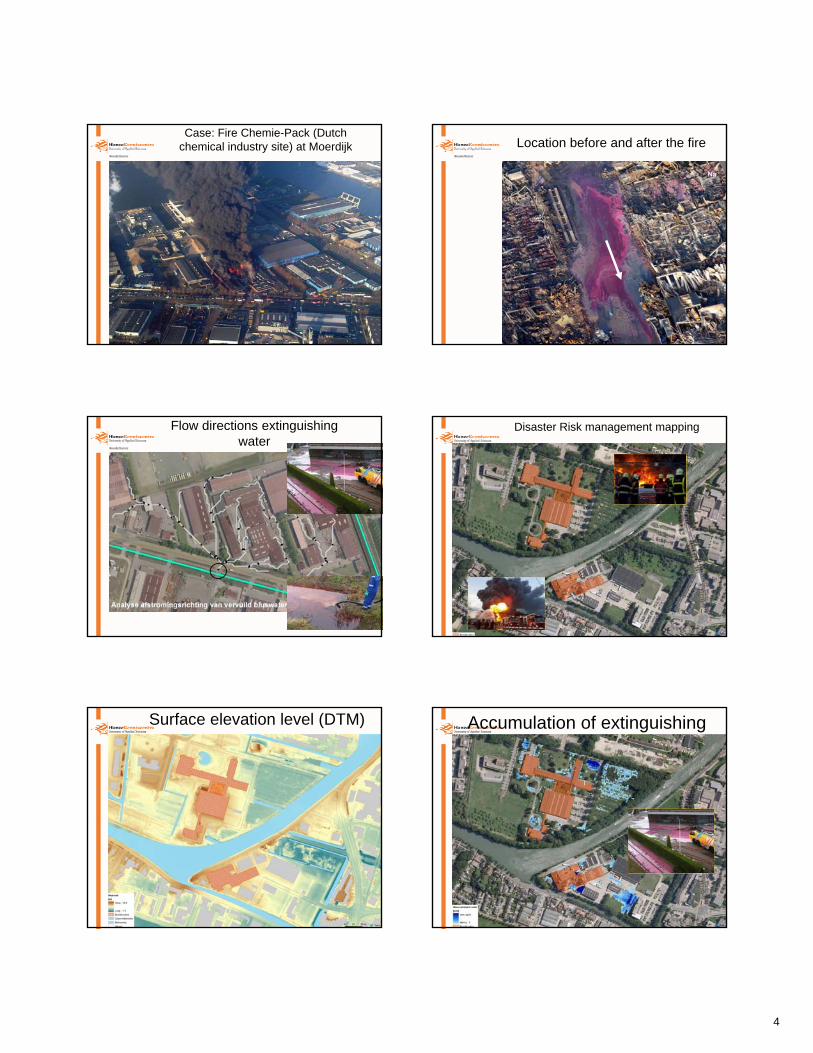
Case: Fire Chemie-Pack (Dutch chemical industry site) at Moerdijk Location before and after the fire
VoorNa
Flow directions extinguishing water
Disaster Risk management mapping
Surface elevation level (DTM) Accumulation of extinguishing water
5
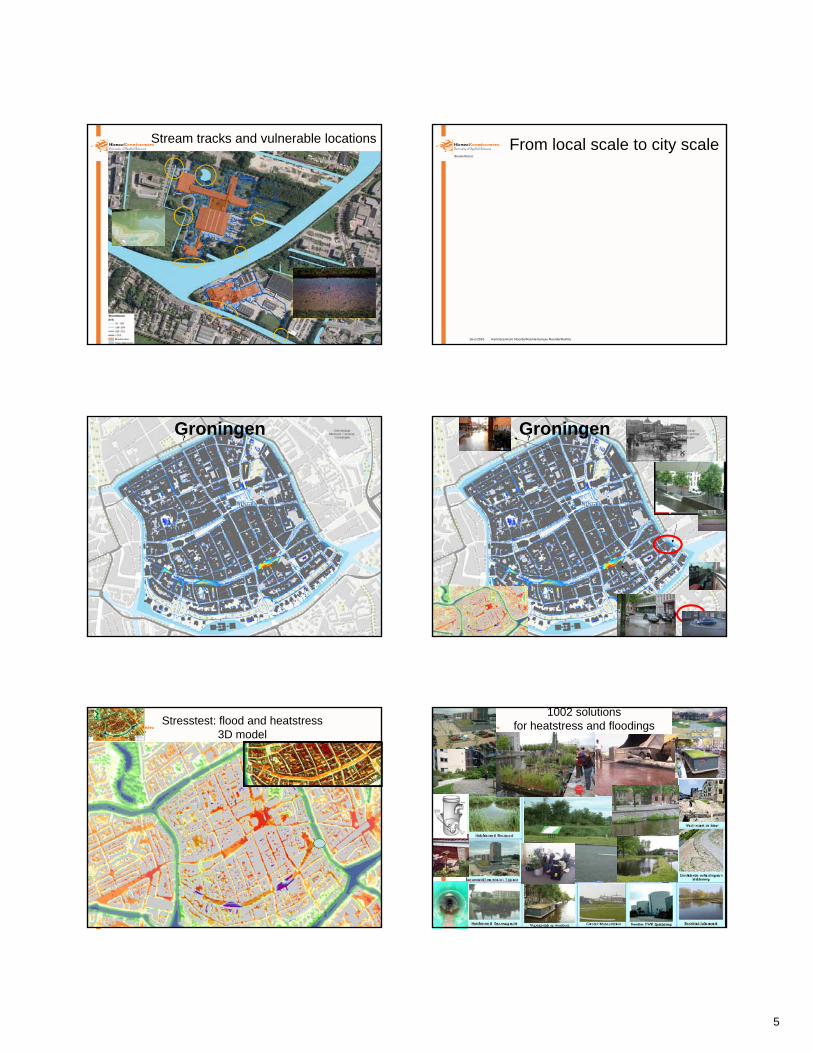
Stream tracks and vulnerable locations From local scale to city scale
16-2-2016 Kenniscentrum NoorderRuimte bureau NoorderRuimte
?Groningen
?Groningen
?
Stresstest: flood and heatstress3D model
Mapping
measurements
Bildet kan ikke v ises. Datamaskinen har kanskje ikke nok minne til å åpne bildet, eller bildet kan være skadet. Start datamaskinen på nytt, og åpne deretter filen på nytt. Hvis rød x fortsatt v ises, må du kanskje slette bildet og deretter sette det inn på nytt.
1002 solutionsfor heatstress and floodings

6
Groningeninfo available for verification
16-2-2016 Kenniscentrum NoorderRuimte bureau NoorderRuimte
- de winschoterkade
1950 2010
Groningen: model verificationcould we predict this?
measures
https://www.youtube.com/watch?v=mzFahS9RJPA
3D flood and heatstressmodels
Impression of 3D
16-2-2016 Kenniscentrum NoorderRuimte bureau NoorderRuimte
HoogeveenWOLK 3D

7
Content1. Why modelling heat and flooding?2. Quick scan models
1. Data needed
2. urban heat
3. flood risks
3. Verification and calibration4. Getting things done: quick wins5. Knowledge exchange (3D)6. More info?
16-2-2016 Kenniscentrum NoorderRuimte bureau NoorderRuimte
16-2-2016 Kenniscentrum NoorderRuimte bureau NoorderRuimte
Results
Results
16-2-2016 Kenniscentrum NoorderRuimte bureau NoorderRuimte
Impression of heatstress measurements
16-2-2016 Kenniscentrum NoorderRuimte bureau NoorderRuimte

8
Country Organisation City projectsNederland University of Applied Sciences Amsterdam o.a. Groningen,
Amsterdam, Hoogeveen,Houten en Eindhoven
Raak onderzoek Klimaatbestendige Stad,inrichting in de praktijk
Nederland University of Applied Sciences Rotterdamen Leeuwarden (VHL) en WetterskipFryslan
Leeuwarden, Drachten,Delft, Rotterdam
Diverse projecten omtrent (beoordeling van)duurzame watersystemen oa met onderwaterdrones
Nederland ministerie van Infrastructuur en Milieu Hoogeveen, Meppel. Masterclasses kilmaatadaptatieNederland STOWA Diverse (inter)nationale
steden en regiosImplementatie en actualisatiewww.climatescan.nl
Noorwegen Norwegian University of Science andTechnology (NTNU),University of Applied and The Geological
Oslo/Trondheim/Bergen
“INnovations for eXtreme Climatic eventS”“INXCES”
But does it work in other climates?Some HUAS projects 2016-2020
16-2-2016 Kenniscentrum NoorderRuimte bureau NoorderRuimte
University of Applied and The GeologicalSurvey of Norway (NGU)
Zweden Luleå University of Technology (LTU) Luleå “INnovations for eXtreme Climatic eventS”“INXCES”
Roemenië Technical University of Civil EngineeringofBucharest (UTCB-CCIAS)
Bucharest “INnovations for eXtreme Climatic eventS”“INXCES”
Duitsland Oldenburgisch-OstfriesischeWasserverband
Brake Water Co-Governance for sustainableecosystems
Zweden Havs- och vattenmyndigheten enVattenmyndigheten Västerhavetsvattendistrikt
Gothenburg Water Co-Governance for sustainableecosystems
Denemarken SEGESKommunernes LandsforeningAalborg Kommune
Aarhus,Kopenhagen
Aalborg
Water Co-Governance for sustainableecosystems
Engeland The Rivers Trust Callington Water Co-Governance for sustainableecosystems
From Groningen to Taiwanother climates….
16-2-2016 Kenniscentrum NoorderRuimte bureau NoorderRuimte
Netherlands vs Taiwan
16-2-2016 Kenniscentrum NoorderRuimte bureau NoorderRuimte
Comparable landsizeUrbanisation in the west
16-2-2016 Kenniscentrum NoorderRuimte bureau NoorderRuimte
16-2-2016 Kenniscentrum NoorderRuimte bureau NoorderRuimte 16-2-2016 Kenniscentrum NoorderRuimte bureau NoorderRuimte

9
16-2-2016 Kenniscentrum NoorderRuimte bureau NoorderRuimte
Sorry, but does this model
represent real temperatures and
stress?
measurements
16-2-2016 Kenniscentrum NoorderRuimte bureau NoorderRuimte
measures and measurmentsheatstress
16-2-2016 Kenniscentrum NoorderRuimte bureau NoorderRuimte
Content1. Why modelling heat and flooding?2. Quick scan models
1. Data needed
2. urban heat
3. flood risks
3. Verification and calibration4. Getting things done: quick wins (international)5. Knowledge exchange (3D)6. More info?
Examples extreme floodingRIO Europe vb Copenhagen

10
Place? Climate city approachMultifunctionional and space for water
• Mapping flooding/heatstress
• Buildings
– Roofs
– Green buildings
• Squares
– Open areasp
– Playgrounds
• Roads
– Road surface
– Road storage
– Near roads
• Green
– parcs
– Little green
Copenhagen: Use existing infrastructure
16-2-2016 Kenniscentrum NoorderRuimte bureau NoorderRuimte
Examples extreme floodingsBergen Norway
16-2-2016 Kenniscentrum NoorderRuimte bureau NoorderRuimte
More to come: “INnovations foreXtreme Climatic eventS”“INXCES”
Visit Hollandwww.climatescan.nlYou are welcome
16-2-2016 Kenniscentrum NoorderRuimte bureau NoorderRuimte
Content1. Why modelling heat and flooding?2. Quick scan models
1. Data needed
2. urban heat
3. flood risks
3. Verification and calibration4. Getting things done: quick wins5. Knowledge exchange6. More info?
tools: research participationmeetings, fieldtrips, interviews, courses, seminars, jobrotation, augmented reality, serious gaming, …
SKIP

11
Example WaterTownWaterBurgh – integrated
planning
Wetley-Tetley – Pluvial
flooding
61Egmond – political
decisions
Bryggen – settlement of
historic buildings
Flooding Egmond aan Zee
Augustus 2006: 60mm/h
A story and solutions to share
•budget
•>20 solutions– Dimensions
– Cost
– Experience
– Do’s and donts
•bloody nose game
101 solutions in Watertown
If roads flood, use that
Use road infrastructure‘sleeping policeman’

12
Scoring scenario Conclusions
1. I don’t like models but I need quick scan methods with strong visualization for disaster modelling/stresstesting
2. Quick scan models1 Limited data needed1. Limited data needed
2. Exmaples: urban heat, flood risks (and more)
3. Verification and calibration is needed4. Participation: getting things done
1. quick wins2. Knowledge exchange (3D)
5. More info? www.climatescan.nl
Content1. Why modelling heat and flooding?2. Quick scan models
1. Data needed
2. urban heat
3. flood risks
3. Verification and calibration4. Getting things done: quick wins5. Knowledge exchange6. More info?
Floodmodel for planningAmsterdam: prioritize
Floodmodel for planningAmsterdam: prioritize
Gemeten neerslag weerstation gemeente Diemen
0
10
20
30
40
50
60
70
80
19:40 20:52 22:04 23:16 0:28 1:40 2:52 4:04
tijd (5 min vakken)
nee
rsla
g m
m/h
Bui april-2009 Bui mei-2009 Bui 8 Bui 9 Bui 10