dupont 4q 2012 earnings conference call -...
TRANSCRIPT

DuPont 4Q 2012 Earnings Conference Call
DuPont 4Q 2012 Earnings Conference Call
January 22, 2013

DuPont 4Q 2012 Earnings Conference Call
DuPont 4Q 2012 Earnings Conference Call
The attached charts include company information that does not conform to generally accepted accounting principles (GAAP). Management believes that an analysis of this data is meaningful to investors because it provides insight with respect to ongoing operating results of the company and allows investors to better evaluate the financial results of the company. These measures should not be viewed as an alternative to GAAP measures of performance. Furthermore, these measures may not be consistent with similar measures provided by other companies.
This data should be read in conjunction with the Company’s fourth quarter earnings news release dated January 22, 2013, which will be furnished to the SEC on Form 8-K. Reconciliations of non-GAAP measures to GAAP results are available on the Investor Center website at www.dupont.com.
Forward Looking Statements During the course of this presentation we may make forward-looking statements or provide forward-looking information. All statements that address expectations or projections about the future are forward-looking statements. Some of these statements include words such as “plans,” “expects,” “will,” “anticipates,” “believes,” “intends,” and “estimates.” Although they reflect our current expectations, these statements are not guarantees of future performance, but involve a number of risks, uncertainties, and assumptions. Some of those risk factors include: fluctuations in energy and raw material prices; failure to develop and market new products and optimally manage product life cycles; global economic and capital markets conditions; litigation and environmental matters; changes in laws and regulations or political conditions; and business or supply disruptions. The Company does not undertake to update any forward-looking statements as a result of future developments or new information. Comments regarding first quarter and full year 2013 reference operating earnings, which exclude significant items and also exclude non-operating pension and other postretirement employee benefit costs.
Developing Markets Total developing markets is comprised of Developing Asia, Developing Europe, Middle East & Africa, and Latin America. A detailed list of all developing countries is available on the Earnings News Release link on the Investor Center website at www.dupont.com.
Regulation G
2

DuPont 4Q 2012 Earnings Conference Call
3
$ in billions, except EPS
4Q12 vs. 4Q11 FY12 vs. FY11
EPS
Underlying** $.11 (58)% $3.33 (6)%
Reported $.02 $2.61
Segment PTOI** $0.5 (26)% $5.7 (1)%
Consolidated Net Sales $7.3 - $34.8 3%
Volume 3% (2)%
Local Prices - 4%
Currency Impact (2)% (2)%
Portfolio / Other (1)% 3%
4Q12 4Q11 FY12 FY11
Base Tax Rate** 10.3% 27.3% 22.8% 21.3%
4Q and FY 2012 Financial Highlights*
* Results shown are on a continuing operations basis.
** See Schedules B, C, and D in the earnings news release for details of
significant items and reconciliations of non-GAAP measures.

DuPont 4Q 2012 Earnings Conference Call
DuPont 4Q 2012 Earnings Conference Call
4
Global Sales* – Regional Highlights
4Q 2012 Sales YOY % CHG 4Q 2012 Sales by Region
U.S. & Canada 35%
Developing EMEA
7%
Developed EMEA 15%
Developing Asia 16%
Developed Asia 10%
Latin America 17%
Region %
Worldwide 0
U.S. & Canada 0
Non-U.S. & Canada (1)
Developing Markets 8
Developing Asia 8
Developing EMEA 3
Latin America 10
* Company sales from continuing operations.

DuPont 4Q 2012 Earnings Conference Call
4Q 2012 EPS* Waterfall
5
Key
Takeaways
Lower Performance Chemicals volume, price, and plant utilization
Strong Ag performance in Latin America drove volume, share gain and price
Improved Performance Materials on volume gain, mix & lower variable costs
Higher fixed cost from Ag growth investments and higher non-cash pension
* Earnings per share from continuing operations.
** Excluding significant items. See schedules B and D in the earnings news
release for significant items and the reconciliations of non-GAAP measures.
Underlying EPS**
$.31
Reported EPS
($.01)
($.03)
($.04)
($.05)
$.12 ($.12)
$.04 ($.06)
Underlying
EPS** $.02
Reported EPS
4Q11 EPS Local Prices VariableCost
Volume Fixed Cost Currency Income Tax Pharma Other 4Q12 EPS
$.26
$.11

DuPont 4Q 2012 Earnings Conference Call
DuPont 4Q 2012 Earnings Conference Call
6
Balance Sheet and Cash December 31, 2012
Free Cash Flow* - Total Company
• $3.1B free cash flow
• $500 million contribution to principal U.S. pension plan
• ~$400 million working capital productivity
• FY capex spend $1.8B
Strong Balance Sheet
• $4.4B cash, cash equivalents and marketable securities
• $11.7B gross debt
• $7.3B net debt*
* Reconciliations of non-GAAP measures can be found on the company’s Investor Center website at www.dupont.com.
Free Cash Flow*
0.0
1.0
2.0
3.0
4.0
2011 2012
$ B
illi
on
s
0
4
8
12
16
Dec-11 Mar-12 Jun-12 Sep-12 Dec-12
$ B
illio
ns
Gross Debt Cash Net Debt*
Cash and Debt

DuPont 4Q 2012 Earnings Conference Call
Introducing 2013 Guidance
* Excludes non-operating pension/OPEB costs and significant items. Refer to company website for detailed reconciliations of non-GAAP measures.
7
$27.7
$33.7 $34.8 ~$36
2010 2011 2012 2013E
$3.33
$4.02 $3.77
$3.85-4.05
2010 2011 2012 2013E
Sales (billions) Operating EPS*
2013E: ~3% growth 2013E: 2-7% growth
1H13: earnings decline YoY vs. tough comp 2H13: earnings growth YoY

DuPont 4Q 2012 Earnings Conference Call
2013 Assumptions
8
Global GDP ~2% growth
Industrial production ~2% increase
Productivity targets ~$300 million restructuring savings >$300 million additional ongoing cost productivity
Raw material, energy & transportation
~5% increase primarily due to higher seed input costs
Currency FY: flat 1Q13: slight headwind
Tax rate 23-24%
Capital expenditures ~$1.9 billion
Depreciation & amortization
~$1.6 billion
Pension contributions ~$350 million (to plans other than principal U.S. plan)

DuPont 4Q 2012 Earnings Conference Call
DuPont 4Q 2012 Earnings Conference Call
9
Agriculture Pioneer, Crop Protection
0.0
0.5
1.0
1.5
2.0
4Q10 4Q11 4Q12
$ in
Billio
ns
4Q PTOI **
4Q Sales *
4Q10 4Q11 4Q12
-15%
-10%
-5%
0%
-150
-100
-50
0
PT
OI M
arg
in
$ in
Millio
ns
* Segment sales include transfers.
** Excluding significant items. See schedules C and D in the earnings
news release for reconciliations of non-GAAP measures.
1H and FY Outlook
Solid Ag environment and continuing momentum of seed and crop protection businesses will drive significant sales increases in 1H
1H earnings will increase moderately as margins are pressured slightly from higher seed input costs
FY low teens sales growth from volume and price
Continued growth investments in new product launches, route-to-market, production capacity and R&D
4Q Comments
Sales up 18% with volume gains of 11% and price gains of 7% offsetting the negative impact of currency
Strong growth in Latin America in both Pioneer and Crop Protection
Multiple point share gain for Pioneer in Brazil summer corn
Crop Protection growing faster than the market at 13%
Seasonal loss improved $24 million as sales growth offset additional commercial and research investments

DuPont 4Q 2012 Earnings Conference Call
DuPont 4Q 2012 Earnings Conference Call
10
Electronics & Communications
0%
4%
8%
12%
16%
20%
0
25
50
75
100
125
4Q10 4Q11 4Q12
PT
OI M
arg
in
$ in
Millio
ns
0.0
0.2
0.4
0.6
0.8
1.0
4Q10 4Q11 4Q12
$ in
Billio
ns
4Q Sales *
4Q PTOI **
4Q Comments
Sales essentially flat on higher volume offset by lower price due to metals pass-through
Continued demand for smart phone and tablets
Signs of stabilization emerging in PV market
PTOI down $18 million; 4Q 2011 PTOI included $20 million licensing income
1Q and FY Outlook
1Q sales down modestly with gradual sequential improvement as the year progresses
1Q PTOI down significantly on weaker mix
FY PV installations up in the U.S., Japan and China, offset by declines in Europe
Consumer electronics growth from smart phones and tablets
* Segment sales include transfers.
** Excluding significant items. See schedules C and D in the earnings
news release for reconciliations of non-GAAP measures.

DuPont 4Q 2012 Earnings Conference Call
DuPont 4Q 2012 Earnings Conference Call
11
Industrial Biosciences
4Q11 4Q12
0%
4%
8%
12%
16%
20%
0
10
20
30
40
50
PT
OI M
arg
in
$ in
Millio
ns
4Q PTOI **
4Q Sales * 4Q Comments
Sales up 4% on 3% higher volume and 1% higher prices
Higher demand for Sorona® in carpeting
Continued growth in food enzymes; softness in the ethanol industry
PTOI increased 29% due to volume increases, realization of synergies
Full year margin up 300 basis points
1Q and FY Outlook
1Q sales up modestly on continued growth in Sorona® and food enzymes offsetting reduced demand for ethanol
1Q PTOI up substantially on sales growth, margin improvements in biomaterials and synergies
FY expect margin expansion and strong demand for Sorona® with ethanol softness
0.0
0.1
0.2
0.3
0.4
4Q11 4Q12
$ in
Billio
ns
* Segment sales include transfers.
** Excluding significant items. See schedules C and D in the earnings
news release for reconciliations of non-GAAP measures.

DuPont 4Q 2012 Earnings Conference Call
DuPont 4Q 2012 Earnings Conference Call
12
Nutrition & Health
0.0
0.2
0.4
0.6
0.8
1.0
4Q10 4Q11 4Q12
$ in
Billio
ns
4Q Sales *
4Q Comments
Sales up 6% evenly split between volume and price; higher local prices partially offset by unfavorable currency
Strong demand for probiotics, cultures and enablers
PTOI of $66 million up 27% with margin improvement from higher prices and cost synergies
Full year margin up 300 basis points
4Q PTOI **
4Q10 4Q11 4Q12 0%
3%
6%
9%
12%
0
20
40
60
80
PT
OI M
arg
in
$ in
Millio
ns
1Q and FY Outlook
1Q sales up moderately driven by solid market fundamentals
1Q PTOI essentially flat as higher sales and integration synergies are offset by higher raw material costs
PTOI margins improving through the year
* Segment sales include transfers.
** Excluding significant items. See schedules C and D in the earnings
news release for reconciliations of non-GAAP measures.

DuPont 4Q 2012 Earnings Conference Call
DuPont 4Q 2012 Earnings Conference Call
13
Performance Chemicals Titanium Technologies (DTT), Chemicals & Fluoroproducts (DC&F)
4Q Sales *
4Q PTOI **
0.0
0.5
1.0
1.5
2.0
4Q10 4Q11 4Q12
$ i
n B
illio
ns
0%
5%
10%
15%
20%
25%
30%
0
100
200
300
400
500
600
4Q10 4Q11 4Q12
PT
OI
Marg
in
$ i
n M
illio
ns
4Q Comments
1Q and FY Outlook
1Q PTOI and sales down substantially versus peak quarter mostly due to lower Ti02 prices and fluoropolymers demand
1Q PTOI and sales down moderately on a sequential basis vs. 4Q12
Ti02 industry fundamentals showing gradual improvement as the year progresses
FY sales down moderately with PTOI margins declining 7-9 percentage points vs. near-peak margin, primarily due to lower TiO2 prices
Sales down 15% primarily from lower TiO2 price and fluoropolymers volume decline
Ti02 volumes down slightly; customer inventory levels appear to be normalized
PTOI down 54% on lower sales and lower plant utilization
FY PTOI margins of 23%
* Segment sales include transfers.
** Excluding significant items. See schedules C and D in the earnings
news release for reconciliations of non-GAAP measures.

DuPont 4Q 2012 Earnings Conference Call
DuPont 4Q 2012 Earnings Conference Call
14
Performance Materials Performance Polymers (DPP), Packaging & Industrial Polymers (P&IP)
0%
5%
10%
15%
20%
25%
0
75
150
225
300
375
4Q10 4Q11 4Q12
$ in
Millio
ns
0.0
0.4
0.8
1.2
1.6
2.0
4Q10 4Q11 4Q12
$ in
Billi
on
s
4Q Sales *
4Q PTOI **
4Q Comments
Sales down 5% with 3% higher volumes partially offsetting 5% lower price and 3% reduction from portfolio change
Stable packaging markets and strong demand in North American automotive markets
PTOI up 68% due to lower feedstock cost, higher volume, and improved mix
1Q and FY Outlook
1Q sales flat with weakness in European & Japan automotive markets offset by solid packaging demand
1Q PTOI up moderately on favorable mix
FY forecasted growth in consumer and industrial markets in Asia
FY continued North American and China automotive market growth partially offset by softness in the electronics sector
PT
OI M
arg
in
* Segment sales include transfers.
** Excluding significant items. See schedules C and D in the earnings
news release for reconciliations of non-GAAP measures.

DuPont 4Q 2012 Earnings Conference Call
DuPont 4Q 2012 Earnings Conference Call
15
Safety & Protection Protection Technologies (DPT), Building Innovations (BI), Sustainable Solutions (DSS)
0%
4%
8%
12%
16%
20%
0
25
50
75
100
125
4Q10 4Q11 4Q12
PT
OI
Marg
in
$ i
n M
illi
on
s
4Q Sales *
4Q PTOI **
0.0
0.2
0.4
0.6
0.8
1.0
4Q10 4Q11 4Q12
$ i
n B
illi
on
s
1Q and FY Outlook
1Q sales down modestly with continued softness in industrial markets and inconsistent spending in public sector
1Q PTOI down moderately on weaker mix
FY sequentially improving as year progresses on increased China infrastructure spending, U.S. housing market rebound and more consistent spending in public sector
4Q Comments
Sales up 2% on 3% higher volume, partially offset by 1% lower prices due to unfavorable currency
Higher demand for Sustainable Solutions offerings and U.S. construction products
PTOI down 6% primarily due to lower plant utilization related to softness in certain industrial markets and U.S. public sector
* Segment sales include transfers.
** Excluding significant items. See schedules C and D in the earnings
news release for reconciliations of non-GAAP measures.

DuPont 4Q 2012 Earnings Conference Call
DuPont 4Q 2012 Earnings Conference Call
16
Save the Date! Investor Day – May 2, 2013 • Hotel du Pont, Wilmington, DE
• 9:00 am – 2:00 pm
• More details to come

DuPont 4Q 2012 Earnings Conference Call
DuPont 4Q 2012 Earnings Conference Call
17
Industrial Chemical Prices
Total Company Volume and Local Pricing Trends
Appendix

DuPont 4Q 2012 Earnings Conference Call
DuPont 4Q 2012 Earnings Conference Call
Industrial Chemical Prices
18
DuPont 4Q 2012 Earnings Conference Call
DuPont 4Q 2012 Earnings Conference Call
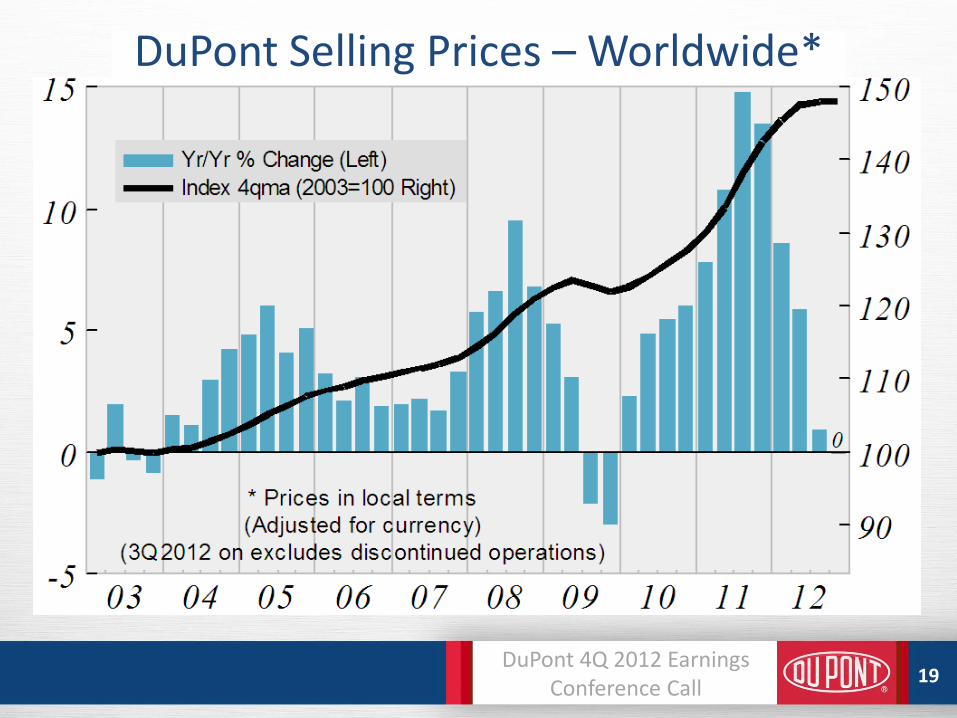
DuPont Selling Prices – Worldwide*
19

DuPont 4Q 2012 Earnings Conference Call
DuPont 4Q 2012 Earnings Conference Call
DuPont Sales Volume – Worldwide*
20

DuPont 4Q 2012 Earnings Conference Call
21