durability study of a polymeric composite material for ...alhaik/durability study of a polymeric...
TRANSCRIPT
Durability Study of a Polymeric Composite Material for Structural Applications
M. S . AL-HAIKI andH. GARME~AN11~2*
'Department of Mechanical Engineering, FAMU-FSU College of Engineering Floridu A&M Unwersity-Floridu Stute University, Tallahassee, FL 3231 6
2Center for Muterials Research and Technology (MARTECH) Floridu Stute University
Tallahassee, Florida, 3231 6
An experimental study was canied out to investigate the mechanical behavior of a structural carbon based composite for infrastructure industry. Creep and load re- laxation experiments were conducted to investigate the rate sensitivity behavior for a temperature range of 20-60"C. The results show that the mechanical properties were degraded under elevated temperature conditions. A threshold stress was mea- sured, at any given temperature, below which no observable strain rate is detected. Results show that load relaxation experiment can be used as an effective tool to study durability and long-time creep behavior. The load relaxation test methodology for the prediction of model parameters was found to be more time and cost efficient than traditional long-time creep tests.
1. INTRODUCTION
tructural composites possessing superior strength/ s w eight and modulus/weight characteristics in- cluding high performance fiber (glass, carbon, aramid and hybrid) reinforced composites with polymer ma- trices are being considered as alternative materials for structural applications (1). The relative ease of manu- facturing lightweight components and the wide range of physical properties and several other outstanding properties make polymer matrix composites (PMCs) very attractive for industrial applications (24).
For industrial applications, the composite is sub- jected to a complicated loading history requiring changes in several processes, which occur simultane- ously-strength and modulus degradation, stress level relaxation, and creep. Each of these processes has its own load, time, and temperature dependence. There- fore, all effects must be accounted for in the long-term durability investigation of the composite. I t is clear that to predict the mechanical degradation in such loading conditions, a constitutive model is needed that can capture the largest strain rate behavior of the material at higher temperatures and severe environ- mental conditions.
__ *Corresponding author. E-mail: [email protected].
POLYMER COMPOSITES, DECEMBER2001, Voi. 22, No. 6
Over the last two decades, durability prediction of polymer matrix composites has become the keystone in structural design. Strain rate sensitivity together with the high strength and durability determines the reliability of the composite structural parts. The relia- bility for long-term structural applications under se- vere conditions of temperature is an important factor for composite usage. Imperatively, any discussion of the sustained use of a structural material must ad- dress the performance of PMCs under loads applied for extended periods of time (5, 1).
The current trend toward the use of PMCs in infra- structure applications demands durability under dif- ferent loading conditions. This requires better under- standing of the composite behavior under service conditions. While fibers are the main source of the tremendous strength and stiffness properties of the PMCs, the matrix-related properties are of primary importance for all types of loading (tensile, creep, re- laxation) in long = term applications. When a poly- meric matrix is heated to a temperature below its glass transition temperature, T$. the material is no longer in a stable thermodynamic state. This results in a change in mechanical properties such as yield stress, creep resistance, toughness and viscosity and is known as physical aging (6-13).
Constitutive modeling of PMCs to cover a wide range of strain rate and strain range presents a dis- tinct challenge. Although progress had been made in
779
M. S . AI-Haik and H. Gamstani
#
constructing models for small strain and temperature regimes, (6, 14, 15), much less progress had been made for predicting the durability of PMCs for long- term exposure to high temperatures. PMCs can be- come brittle, viscoelastic or viscoplastic depending on the loading conditions to which they are exposed. The major hindrance in modeling the PMC behavior is that mechanisms of deformation in polymers seem to be more complicated than those in metals. Hence, classi- cal constitutive models and concepts for metals are not directly applicable to modeling polymers and poly- mer composites. Analytical models were proposed to predict the strain rate behavior of PMCs. A determin- istic approach was proposed by Gates (16), who pro- vided test methods and an elastic/viscoplastic consti- tutive model that accounts for some aspects of rate dependent tension and compression loading behavior of PMC materials throughout the temperature range. These tests included stress relaxation and creep. However, these models have been applied to relax- ation results with very short time duration and as a result the simulations covered a very small strain rate regime. Similar approaches based on the viscoplastic nature of PMCs are discussed thoroughly by Drozdov, (17), Bardenhagen (18) and Fish (19).
The industrial applications of PMCs underline the necessity for long-term performance of those materi- als. In order to realize much of the potential of PMCs, tools to accelerate testing and predicting long-term performance were generated by several investigators. The long-term exposure of PMCs to service environ- mental conditions degrades original properties. One powerful method to extract long-term response from accelerated tests of PMCs is time-temperature super- position (2 1). Information on long-term deformation and strength ise normally obtained via these acceler- ated tests by extrapolation of the short-term test data, obtained under accelerated testing conditions. Such tests can include experiments a t higher temperatures,
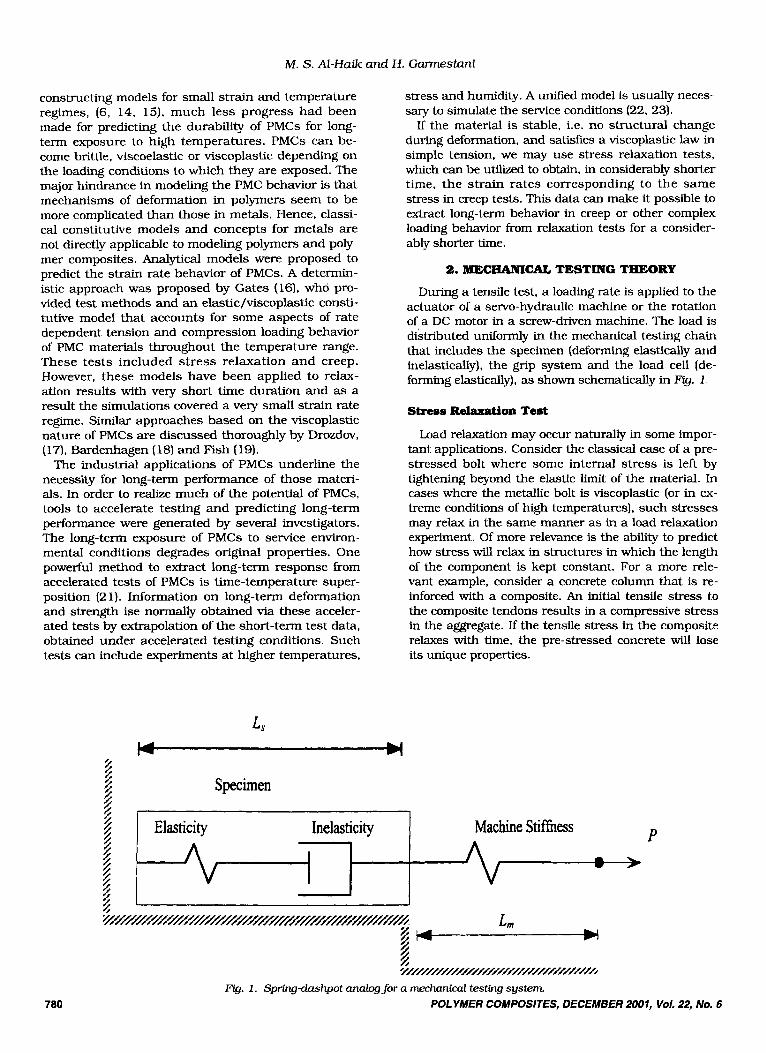
P Elasticity Inelasticity Machine Stiffness
stress and humidity. A unified model is usually neces- sary to simulate the service conditions (22, 23).
If the material is stable, i.e. no structural change during deformation, and satisfies a viscoplastic law in simple tension, we may use stress relaxation tests, which can be utilized to obtain, in considerably shorter time, the strain rates corresponding to the same stress in creep tests. This data can make it possible to extract long-term behavior in creep or other complex loading behavior from relaxation tests for a consider- ably shorter time.
2. MECHANICAL TESTING THEORY During a tensile test, a loading rate is applied to the
actuator of a servo-hydraulic machine or the rotation of a DC motor in a screw-driven machine. The load is distributed uniformly in the mechanical testing chain that includes the specimen (deforming elastically and inelastically), the grip system and the load cell (de- forming elastically), as shown schematically in Fig. 1.
B $ + 5
Stress Relaxation Temt
Load relaxation may occur naturally in some impor- tant. applications. Consider the classical case of a pre- stressed bolt where some internal stress is left by tightening beyond the elastic limit of the material. In cases where the metallic bolt is viscoplastic (or in ex- treme conditions of high temperatures), such stresses may relax in the same manner as in a load relaxation experiment. Of more relevance is the ability to predict how stress will relax in structures in which the length of the component is kept constant. For a more rele- vant example, consider a concrete column that is re- inforced with a composite. An initial tensile stress to the composite tendons results in a compressive stress in the aggregate. If the tensile stress in the composite relaxes with time, the pre-stressed concrete will lose its unique properties.
w
780

Durability Study of a Composite for Structural Applications
Stress relaxation can be defined as the decrease in stress in a solid under a constant strain, or extension at a constant temperature. This decrease in stress, in the case of a one-phase polycrystalline material, is the result of dislocations moving, overcoming localized barriers (24). ASTM standard E328 describes a num- ber of experimental steps designed to perform stress relaxation correctly. One of the major issues in using the relaxation data is the contribution of machine compliance. In both screw-driven and servohyrraulic machines, the machine compliance may be large and depend upon the major components used in the de- sign. It has been found (24) that screw-driven ma- chines have a definite stiffness, which relaxes during the test when the machine and specimen stifFnesses are of the same order of magnitude. In the following, it will be shown that the machine compliance for both machines can be measured and incorporated in the calculations. Servohydraulic machines operating under strain-control mode provide infinite stiffness, hence eliminating machine relaxation (25). One can use the spring-dashpot analog to describe the response of the machine-specimen system to deformation. The elastic (time-independent) portion of deformation is repre- sented by the spring, and the inelastic (time-dependent) portion is represented by the dashpots, as seen in Rg. 1. During load relaxation, the total change in length for both the machine and the specimen becomes zero:
[ALe + ALi13 + [AL,], = 0
where (ALe + Ah), is the elastic and inelastic change in the specimen length, and A L is the change in the extension resulting from the load frame.
The stifhess of the machine is represented as
where P is the total load and L,, is the elastic elonga- tion of the machine. Taking the time derivative of Eq 1 and using Eq 2. Hence,
(3)
Dividing Eq 3 by the length of the specimen at the onset of relaxation, we obtain the strain rates as
(4)
where &, and ii are elastic and inelastic strain rate in the specimen respectively, and u is the stress rate.
The elastic strain in the specimen is related to the stress by Young’s modulus and
U E, - - - E
Hence, the specimen inelastic strain during the relax- ation test is given by
(5)
where u is the nominal stress, ei is the inelastic strain, 4, is the initial gauge length, A, is the original cross- sectional area, and E is the Young’s modulus of the sample.
From the above equations, it is clear that the ma- chine stiffness K, can influence the results if the strain is not measured directly from the specimen. Eq 5 can be rewritten as
U E . = -
EA
where EA is defined as an apparent elastic modulus in the elastic region.
(7)
The stress relaxation test provides u’ as a function of stress (slope of the stress versus time curve at vari- ous stress levels). From this data, inelastic strain rate of the specimen can be calculated as a function of stress, prior strain history, and a number of state variables, X,
Ei = f(u, E , x) (8) Together with Eq 7, the relaxation time is shown to be inversely proportional to the apparent modulus
where ui and of are the initial and final stresses re- spectively. Equation 9 shows that in order to reduce the time of relaxation, it is important to minimize the apparent modulus (26, 27).
Extrapolation of short-term test results for very long time periods is a fundamental problem in the analysis of structures whose lifetime is measured in years or decades. A reasonable duration for commonly per- formed tests is in the order of an hour, a day, even a month, but not longer. It has been suggested that the relaxation data may be used to extrapolate the creep and inelastic behavior at longer times (16, 25, 26). Lemaitre (28) showed that the time necessary for at- taining a state characterized by particular values of the stress, plastic strain, and plastic strain rate is of the order 5-50 times shorter for relaxation than for creep. Grzywinski (29) and Findley (30) cited similar conclusions.
Creep Test
The creep test is usually performed by loading a specimen to a specific load and the load is then main- tained at a constant value and the strain is recorded. During creep experiments, the load remains constant
P = O (10)
since the total strain can be decomposed into elastic and inelastic components;
E = E, + Ei (1 1)
POLYMER COMPOSITES, DECEM8ER 2001, Vol. 22, No. 6 781

M. S. Al-Haik and H. Garmestani
the strain rate E is found by differentiating Eq 11 and noting that E , is a constant
(12) E = E i
Although creep and relaxation are different kinds of testing, they are related in the sense that they both measure the strain rate sensitivity of materials under a specific load (for creep) and total strain (for relax- ation). The difference is the fact that a much larger strain (deformation) is involved during creep than during load relaxation. The extent of the deformation for the load relaxation is determined from machine compliance. On the other hand, if the material satis- fies a viscopiastic law in simple tension, of the form,
. .
0 = f ( E p . Ep) (13)
then there is an experimental method that can be used to obtain, by relaxation, in considerably shorter times, the strain rates that correspond to those in creep tests. This makes it possible to construct
long-term creep curves from short relaxation tests (28). The methodology is illustrated in Flg. 2. To find the strain corresponding to a constant stress u* at temperature Tc, we consider multiple relaxation tests performed with each relaxation reaching a limiting stress, u*. At every point of the relaxation curves u(t) where u = u* the material state is given by:
u = u* U*
E E p = E - -
E, = - U (u*)/E
The constitutive equations above link u, E ~ , Ep for any loading history and so the values should also be rep- resentative of a creep test at u = u*. This is with the assumption that the strain history (during creep] does not vary u* significantly! We may therefore trace the trajectory of the creep test by plotting a graph (E,, Lb, and by integrating the function whose curve is that
'f I
I
"t
782 POLYMER COMPOSITES, DECEMBER 2001, Vol. 22, No. 6
Durability Study of a Composite for Structural Applications
which passes through these points, denoting this function by g(&J = kp. we obtain the creep curve ep(t) where creep time can be calculated from
So the inelastic strain rate in a relaxation test can be used to find out the plastic strain at a creep test, as illustrated from the formulation above, given by Lemarite, (28). Similar approaches to link the strain rate of relaxation and creep tests were performed by Gates (9) and Grzywinski (29).
Creep and load relaxation experiments are related in the sense that they both measure the strain rate sensitivity of materials under a specific load. If the in- ternal material structure does not change during these tests, there exists one unique strain rate for each stress level. The total strain during a load relax- ation test is less than 0.2% and as a result it can be assumed that the internal structure remains con- stant. Such a condition may not be valid for a creep test since a much larger strain is consumed. The other factor that may influence the results is the tran- sients due to anelasticity. Anelastic strain is defined as the time-dependent component of the inelastic strain that is recoverable. Other factors influencing the results are the machine response time, temperature stability, and sampling rate for data acquisition. A crucial parameter in validating the flow stress re- sponse to changes in strain-rate is the machine re- sponse time. The environmental temperature stability and isolation from vibration (which may become sub- stantial for hydraulic type testing machines) are among other important experimental variables. The flow stress of the material is directly related to the tem- perature of the material and must remain constant to correctly evaluate the material response. The temper- ature stability is important for both creep and relax- ation experiments. For load relaxation experiments, an accurate measurement of lower strain rate (below lo4) requires a temperature stability of 0.2”C.
5. MATERIALS
A structural carbon reinforced composite material is used for the investigation of viscoplastic-viscoelastic properties. The materials were provided by the Florida Department of Transportation.
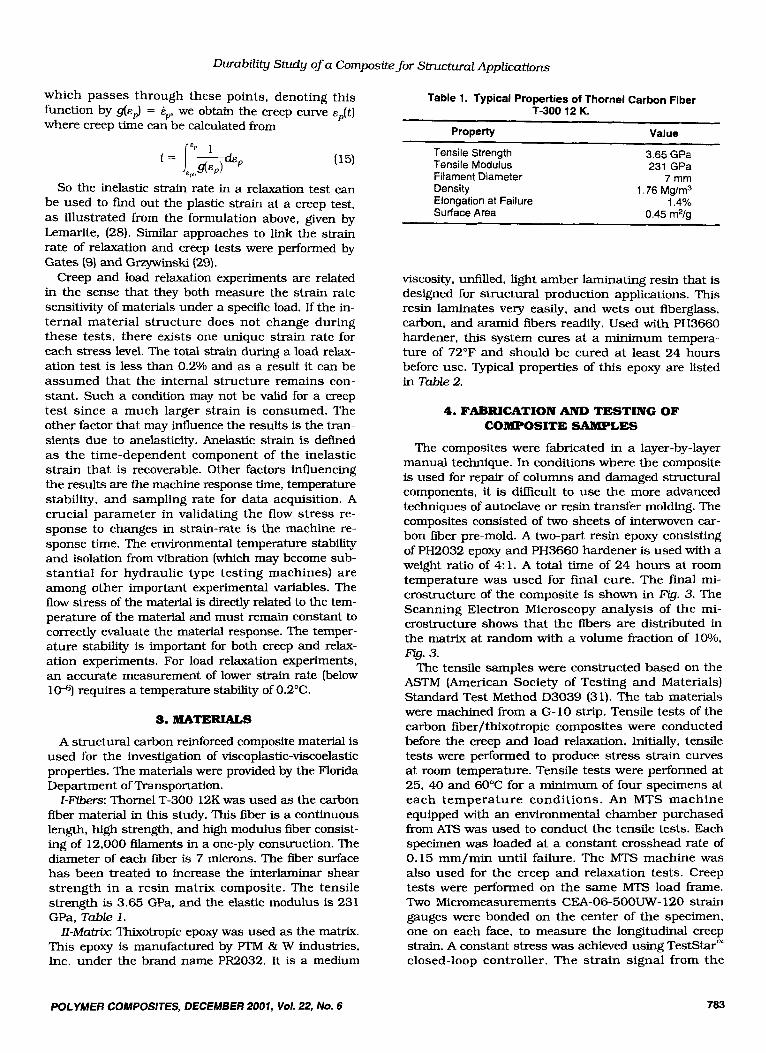
&Fibers: Thornel T-300 12K was used as the carbon fiber material in this study. This fiber is a continuous length, high strength, and high modulus fiber consist- ing of 12,000 filaments in a one-ply construction. The diameter of each fiber is 7 microns. The fiber surface has been treated to increase the interlaminar shear strength in a resin matrix composite. The tensile strength is 3.65 GPa, and the elastic modulus is 231 GPa, Table 1.
II-Matrix Thixotropic epoxy was used as the matrix. This epoxy is manufactured by PTM & W industries, Inc. under the brand name PR2032. It is a medium
Table 1. Typical Properties of Thornel Carbon Fiber
Property Value
Tensile Strength 3.65 GPa Tensile Modulus 231 GPa Filament Diameter 7 mm
1.76 Mg/m3 Density
0.45 m2/a Surface Area
T-300 12 K.
Elongation at Failure 1.4%
viscosity, unfilled, light amber laminating resin that is designed for structural production applications. This resin laminates very easily, and wets out fiberglass, carbon, and aramid fibers readily. Used with PH3660 hardener, this system cures at a minimum tempera- ture of 72°F and should be cured at least 24 hours before use. Typical properties of this epoxy are listed in Table 2.
4. FABRICATION AND TESTING OF COMPOSITE SAMPLES
The composites were fabricated in a layer-by-layer manual technique. In conditions where the composite is used for repair of columns and damaged structural components, it is difficult to use the more advanced techniques of autoclave or resin transfer molding. The composites consisted of two sheets of interwoven car- bon fiber pre-mold. A two-part resin epoxy consisting of PH2032 epoxy and PH3660 hardener is used with a weight ratio of 4: 1. A total time of 24 hours at room temperature was used for final cure. The final mi- crostructure of the composite is shown in Rg. 3. The Scanning Electron Microscopy analysis of the mi- crostructure shows that the fibers are distributed in the matrix at random with a volume fraction of lo%,
The tensile samples were constructed based on the ASTM (American Society of Testing and Materials) Standard Test Method D3039 (31). The tab materials were machined from a G-10 strip. Tensile tests of the carbon fiber/thixotropic composites were conducted before the creep and load relaxation. Initially, tensile tests were performed to produce stress strain curves at room temperature. Tensile tests were performed at 25, 40 and 60°C for a minimum of four specimens at each temperature conditions. An MTS machine equipped with an environmental chamber purchased from ATS was used to conduct the tensile tests. Each specimen was loaded at a constant crosshead rate of 0.15 mm/min until failure. The MTS machine was also used for the creep and relaxation tests. Creep tests were performed on the same MTS load frame. Two Micromeasurements CEA-06-5OOUW- 120 strain gauges were bonded on the center of the specimen, one on each face, to measure the longitudinal creep strain. A constant stress was achieved using Teststar’” closed-loop controller. The strain signal from the
Fig. 3.
POLYMER COMPOSITES, DECEMBER 2007, Vol. 22, No. 6 783

M. S. AZ-Haik and H. Garmestani
Table 2. Typical properties of Thixotropic Epoxy.
PH2032 PH3660 Curing agent Component Epoxy resin base
Viscosity 90 N.s/m2 95 N.s/m2
by weight 100 27 Density 1.109 Kg/L 1 1.34 KglL
Pot life (4 oz.) 50-60 rnin. Tensile Strength (for 10 ply Laminate, 55% Glass fiber) Tensile modulus (for 10 ply Laminate, 55% Glass fiber)
Mix ratio by volume 3.2 1
Glass transition temperature (Tg) 91.11"C
311 MPa 17.6 GPa
strain indicator was recorded by a d a t a data acquisition system. The nominal stress/time his-. acquisition system. Each specimen was tested for one tory was then monitored and recorded for 1 hour. The hour under 25, 40 and 60°C temperature environ- relaxation tests were conducted under the same tem- ments, and the applied stress was set to the values of perature conditions as before. 50%. 70% and 90% of the corresponding strength under each temperature condition. 6. RESULTS AND DISCUSSION
Standard tensile specimens were loaded for stress relaxation using the same load frame. Each sample was loaded at a constant displacement rate of 0.15 mm/min until a desired strain was achieved. At this point, a constant strain was maintained in the speci- men. By maintaining a constant strain in the speci- men, concern about the machine compliance was eliminated. The reduction of nominal stress with time was then measured for 1 hour per sample, using the
The strength and elastic properties of the composite samples were measured from the stress-strain data at three different temperatures. Load as measured by the load cell was converted to stress using the average cross sectional area of the specimen measured prior to the test. Axial strain was calculated by averaging the readings of the two strain gauges. Five tests at each temperature were performed to obtain an aver- age value for these properties, Table 3.
200x 1 ooox Flg. 3. The microstructure of the ThDmel carbonfiber/lXixo&opropic epoxy matrix-using ESEM. The over all volumefiaction was found tObelO%.
784 POLYMER COMPOSITES, DECEMBER 2001, Vol. 22, No. 6

Durability Study of a Composite for Structural Applications
Table 3. Mechanical Properties at Three Temperatures Level.
T W ) ULJ (MPa) E IGPa) ~~ -
25 190.3 5 3.0 31.02 k 0.6 40 150.6 C 3.0 17.93 5 0.6 60 97.2 C 3.0 11.03 5 0.6
Tenaile Tests Results
The effect of the temperature on the stress-strain behavior of the composite is plotted in Fig. 4. It is clear from the data that the elastic moduli and the strength decrease as the temperature increases. Since the 60°C is close to the glass transition temperature of the polymer matrix (Tg = 9l0C), the elastic modu- lus and strength have been decreased significantly to values 30% and 50 Yo, respectively, of those at room temperature. Table 1 shows the degradation of the strength and the modulus as the temperature in- creases. The values in Table 1 are the average values for 5 tests at each temperature.
Creep Tests Results
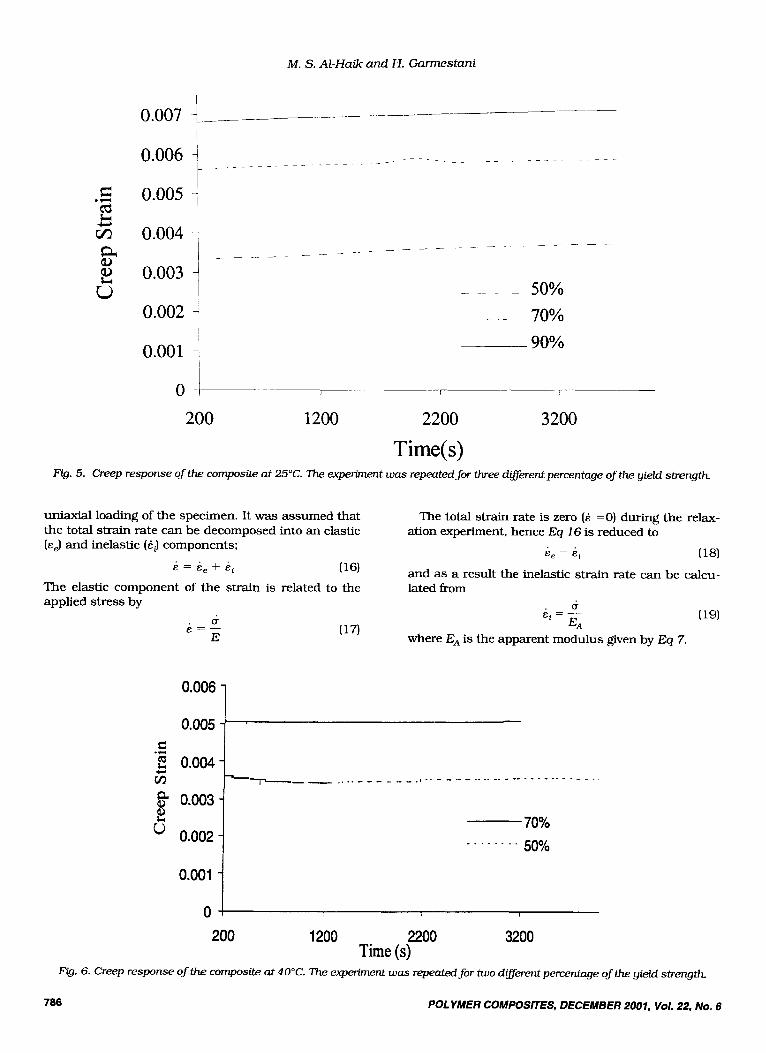
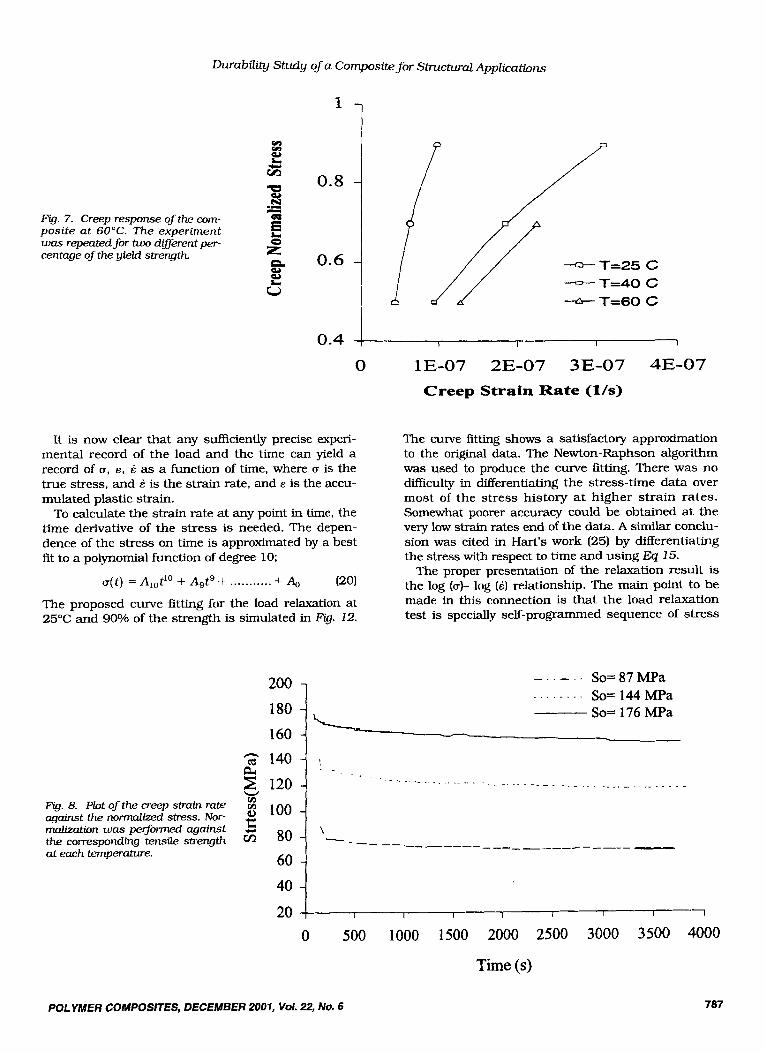
The experimental data from creep tests are plotted in Figs. 5-7, where the creep deformation was per- formed at three different stress levels for each temper- ature value. It was observed that at a temperature of 60°C, the sample failed to sustain the creep stress of 90% of the strength; this was observed for 3 different
200
160 - 6
3 120 I * * 80 !2 3j
40
0
_ _ _ - T= 60 C _ _ _ _ _ _ - ~ T= 40 C
T= 25 C
samples under the same conditions to ensure the re- peatability of this observation. It is noticed that with the application of load, an instantaneous strain re- sponse is developed, followed by a transient strain. A steady state (constant strain rate) creep develops dur- ing the strain history at larger time. A plot of the creep strain rate as a function of the holding stress is shown in Flg. 8. Significant creep strain rates were noticed, especially at higher stress levels. The strain rate range under different temperature and loading conditions was 4.3 X lo4 - 3.1 X (sec-I). The stresses were normalized with respect to the ultimate tensile strength at the corresponding temperatures. A higher creep strain was noticed when the test speci- men was held under a higher temperature. The mod- ulus of the thermoplastic composite decreased at ele- vated temperatures: thus, that may have accelerated the creep response.
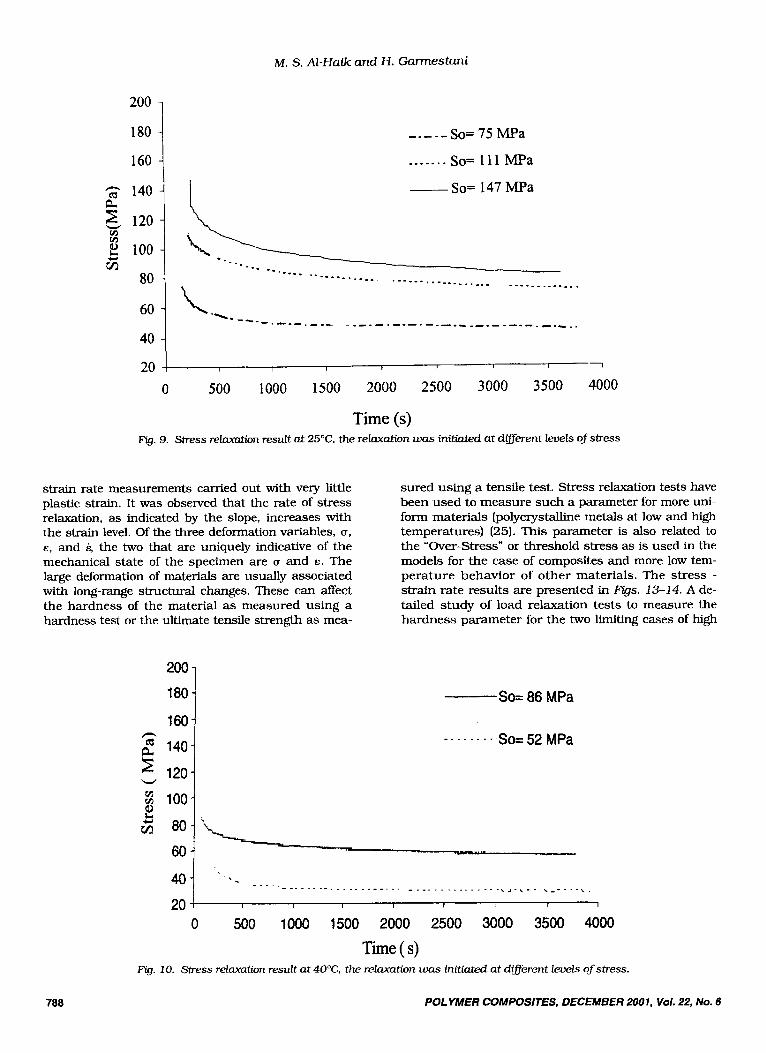
Load Relaxation Tests Results
Representative stress-time relaxation curves (stress- time) for the composite under different temperature conditions are presented in Figs. 9- I 1 . The loading portion of each curve provides a measure of the elas- tic constant of the testing machine, Km, as illustrated in Eq 3. The remainder of the curve is the relaxation history at fixed crosshead position of the testing ma- chine. The final strain history is plotted as log (u)- log ( E ) curves as shown in the following. The analysis re- quires the use of apparent elastic modulus during the
0.0000 0.0040 0.0080
Strain Flg. 4. Stress-strain curves for the tensile tests under dixerent temperature environments.
0.0 120
POLYMER COMPOSITES, DECEMBER 2001, Vol. 22, No. 6 785
M . S. Al-Haik and H. Garmestani
0.007
0.006
0.005
0.004
0.003
0.002
0.001
0 200 1200 2200 3200
Time( s) Fig. 5. Creep response of the composite at 25°C. The experiment was repeuted for three dig*erentpercentage of the yield strength
uniaxial loading of the specimen. It was assumed that the total strain rate can be decomposed into an elastic ( E J and inelastic ( B J components:
& = &, + E i (16)
The elastic component of the strain is related to the
The total strain rate is zero (E =0) during the relax-
(18) &, = Ei
and as a result the inelastic strain rate can be calcu- lated from
ation experiment, hence Eq 16 is reduced to
applied stress by . u E'4
(19) & . = - . u & = -
where EA is the apparent modulus given by Eq 7. (17) E
0.006
0.005 E
I & 0.003 E
0.002 70%
. ,50% _ . . _ .. .
I I I
200 1200 2200 3200 Time (s)
Fig. 6. Creep response of the composite at 40°C. The experiment was repeated for huo dgerent percentage of the yield strength
786 POLYMER COMPOSITES, DECEMBER 2001, Vol. 22, No. 6
Durability Study of a Composite for Structural Applications
200 -I
180 -
160 -
140 -
3- 120 - v v) 8 100 -
80 - 60 -
Fig. 8. Plot of the creep swain rate against the r w m stress. Nor- malization was per$ormed against
at each temperature.
z the corresponding tensile strengfi
40 -
20
wl
L 8 fi
. . . . . . . . So= 144 MPa So= 176 MPa
0 . s,
............ .......... -- ........ _ _ _ _ __ .. _ _ . . . . - -.._ . . . . . .- -
\
/-_--- ----- -----___ - -
1 I I I I I I I
Flg. 7. Creep response of the com- posite at 6 0 ° C . The experiment was repeated for two d@@ent per- centage of the yield strength
0.8
0.6
0.4
*T=25 c -T=40 C -T=60 C
0 1E-07 2E-07 3E-07 4E-07 Creep Strain Rate <l/s)
It is now clear that any sufficiently precise experi- mental record of the load and the time can yield a record of u, E, d as a function of time, where u is the true stress, and i is the strain rate, and E is the accu- mulated plastic strain.
To calculate the strain rate at any point in time, the time derivative of the stress is needed. The depen- dence of the stress on time is approximated by a best fit to a polynomial function of degree 10;
(20)
The proposed curve fitting for the load relaxation at 25°C and 90% of the strength is simulated in Fig. 12.
u(t) = Alot" + A9t9 + ........... +A,
The curve fitting shows a satisfactory approximation to the origmal data. The Newton-Raphson algorithm was used to produce the curve fitting. There was no difficulty in differentiating the stress-time data over most of the stress history at higher strain rates. Somewhat poorer accuracy could be obtained at the very low strain rates end of the data. A similar conclu- sion was cited in Hart's work (25) by differentiating the stress with respect to time and using Eq 15.
The proper presentation of the relaxation result is the log (a)- log (i) relationship. The main point to be made in this connection is that the load relaxation test is specially self-programmed sequence of stress
POLYMER COMPOSITES, DECEMBER 2007, Wol. 22, No. 6
Time (s)
787
M. S . Al-Haik and H. Gumstani
200
180
160
140 2 W 120
i! 100 Gi
v)
80
60
40
20
-. - . - So= 75 MPa
_.._. . .So= 111 MPa
-- So= 147 MPa
t I I 1 1 I I I
0 500 1000 1500 2000 2500 3000 3500 4000
Time (s) Flg. 9. Stress relaxation result at 25T, the relaxation was initiated at different levels ofstress
strain rate measurements carried out with very little plastic strain. It was observed that the rate of stress relaxation, as indicated by the slope, increases with the strain level. Of the three deformation variables, u, E , and i; the two that are uniquely indicative of the mechanical state of the specimen are u and E . The large deformation of materials are usually associated with long-range structural changes. These can affect the hardness of the material as measured using a hardness test or the ultimate tensile strength as mea-
200
180
160
2 140 n
z 120
g v
2 100
rn 80 60
40
20
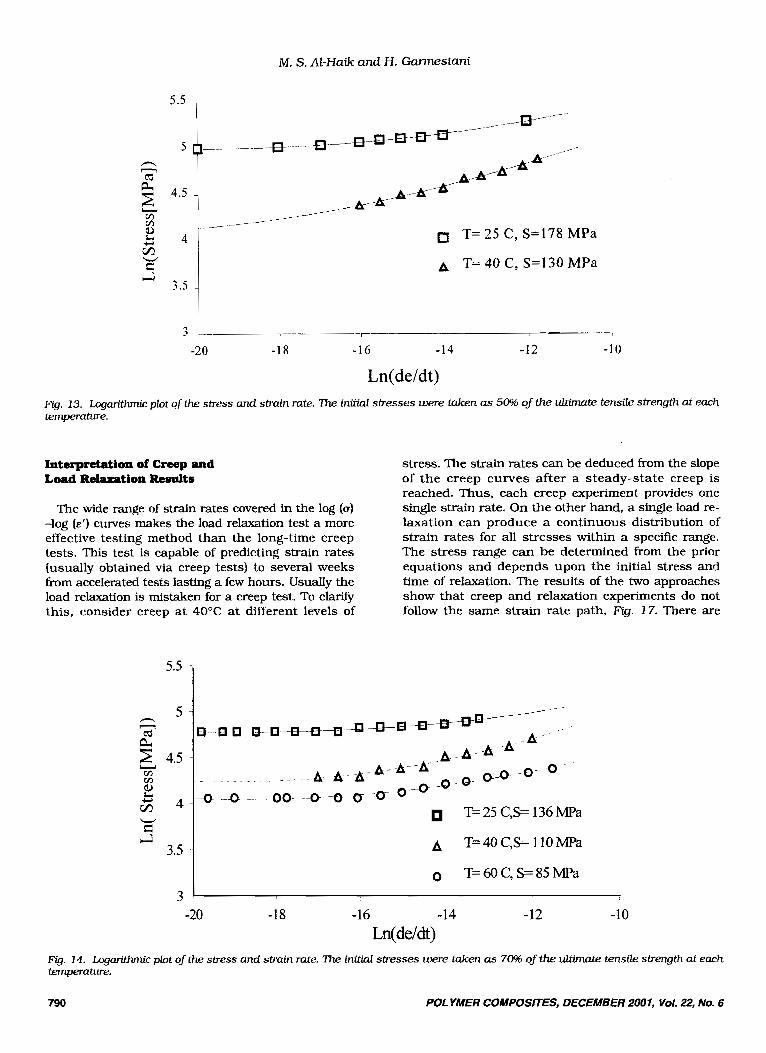
sured using a tensile test. Stress relaxation tests have been used to measure such a parameter for more uni- form materials (polycrystalline metals at low and high temperatures) (25). This parameter is also related to the “Over-Stress” or threshold stress as is used in the models for the case of composites and more low tem- perature behavior of other materials. The stress - strain rate results are presented in Figs. 13-14. A de- tailed study of load relaxation tests to measure the hardness parameter for the two limiting cases of high
So= 86 MPa
So= 52 MPa -. . . . . - .
h - - - ~ ._ -- . . . .. - _ - - - .- - . _ _ . . ._ _ _ . . .. ., ,., - _ . c
‘ - .
I I I I I I I I
0 500 1000 1500 2000 2500 3000 3500 4000
Time ( s) Fg. 10. Stress relaxation result at 40°C the relaxation was initiated at diTerent levels of stress.
788 POLYMER COMPOSITES, DECEMBER 2001, Val. 22, No. 6

Durability Study of a Composite for Structural A p p l i c ~ t i o n ~
- 168 - E c 164-
200 -,
160 1 180
I So= 86 Mpa
-. . . ~ ~ ~ ~ So= 52 Mpa
W
m m 100
3; 801 . . ~ 401 j - . _ -.
20 j-' I I I , 0 500 loo0 1500 2000 2500 3000 3500 4OOO
F@. 1 1 . Stress relaxation result at 60°C. the relrucation was initiated at chfferent leuels of stress.
and low temperatures was illustrated by Hart (25). The outstanding feature of all the log (a) - log ( E ' )
curves is the very large strain rate regime that is cov- ered in each relaxation run. Also, the stress at the end of the relaxation test drops to a parameter usually re- ferred to as ouerstress. Of particular importance in the viscoplastic analysis of composites, the overstress de- picts the excess of the rate-dependent stress (from re- laxation tests) over the stress at the same strain in ten- sile tests. The nature of log (u) -log (&') curves implies the existence of an overstress parameter because of the nonlinearity in the log-log scale horizontal slope at the
m. 12. Curvefitting for stress- time data at 25°C and 90% of the strength. The data were fitted into a polynomial of degree 10.
I W
very low strain rates. If viscoplasticity (or inelasticity) is absent or if the behavior is completely plastic, the nonlinearity would be replaced by a horizontal line from the beginning of relaxation. Interestingly, for our materials the inelastic deformation was rate (time)-de- pendent even at room temperature. In FQ. 16, the re- laxation stresses and their corresponding stress drops were normalized with respect to their respective ulti- mate tensile strength for each temperature. Both the temperature and the initial stresses are the control parameters, which control the time-dependent relax- ation behavior of the composite.
I \ - - - - Experimental
152 / I I I I
0 1000 2000 3000 4000
Time ( s)
POLYMER COMPOSITES, DECEMBER 2007, Vol. 22, No. 6 789
M. S . At-Ha& and H. Garmestani
-20 -1 8 -16 -14 -12 -10
Ln(de/dt) Fg. 13. Logarithmic plot of the stress and strain rate. The initial stresses were taken as 50% of the ultimate tensile strength at each temperature.
Interpretation of Creep and Load Relaxation Results
The wide range of strain rates covered in the log (0)
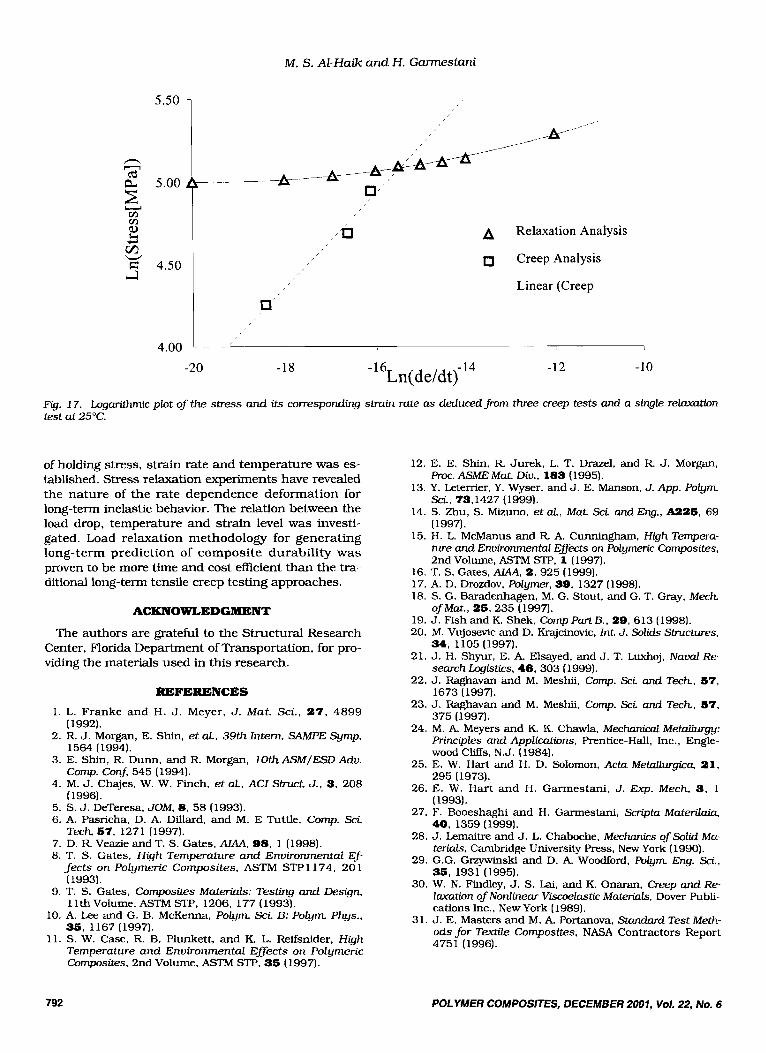
-log ( E ’ ) curves makes the load relaxation test a more effective testing method than the long-time creep tests. This test is capable of predicting strain rates (usually obtained via creep tests) to several weeks from accelerated tests lasting a few hours. Usually the load relaxation is mistaken for a creep test. To clanfy this, consider creep at 40°C at different levels of
stress. The strain rates can be deduced from the slope of the creep curves after a steady-state creep is reached. Thus, each creep experiment provides one single strain rate. On the other hand, a single load re- laxation can produce a continuous distribution of strain rates for all stresses within a specific range. The stress range can be determined from the prior equations and depends upon the initial stress and time of relaxation. The results of the two approaches show that creep and relaxation experiments do not follow the same strain rate path, Fig. 17. There are
T= 25 C,S= 136 MPa - 1 4
3.5 1 0 T=60C7S=85MPa
3 -20 -18 -16 -14 -12 -10
Ln(de/dt) 9. 14. Logarithmic plot of the stress and strain rate. The initial stresses were taken as 709f1 of the ultimate tensile strength at each temperature.
790 POLYMER COMPOSITES, DECEMBER 2001, Vol. 22, No. 6

Durability Study of a Composite for Structural Applications
5.5 -
T= 25 C , S=121 MPa
/’ 5.0 A T=4OC, S=76 MPa n n cb a 2 4.5
2 s
U cn cn
+ 4.0
3 3.5
0 T= 60 C , S=5 1 MPa
~ - 0 e - - -0-
-%
A-
0
a/ ,,
./’
,
3.0 I.---- 7
-19 -17 -1 5 -1 3 -1 1
Ln( de/dt) Fig. 15. Logarithmic plot of the stress and strain rate. ‘Ihe initial stresses were taken as 50% of the ultimate tensile strength at each temperature.
several reasons for this difference. First, creep requires a larger strain and as a result, it is accompanied with in- ternal structural changes. Second, such structural changes may involve larger damage to the composite ma- terial (compared to relaxation test) and may involve other mechanisms such as fiber breakage and debonding.
6. CONCLUSIONS
The present work describes different short-time test- ing schemes to predict long-time viscoplastic behavior
, /
0
0 , ,
of PMCs. The high temperature test results show that both the strength and elastic modulus degrade with an increase in temperature. The results show #at the strength values drop significantly with temperature (from 190.3 MPa to 97.2 MPa at 60°C). Creep and stress relaxation tests measure the structure dimen- sional stability of the composite, and because the tests can be of long duration, such tests are of great practical importance. Creep of the composite has been investigated using the strain gauge method: the effect
/ I
/ I , ,
d
A T=20C
0 T=40C
0 T=60C
0 0.1 0.2 0.3 0.4 0. Normalized Drop Stress (DS/Su)
Fig. 16. Plot of the normalized initial stress level against the mdized stress drop. Normalization was taken w.r.t strength at the corresponding temperatures.
POLYMER COMPOSITES, DECEMBER 2001, Vol. 22, No. 6 791
5.50 7
M. S . Al-Haik and H . Gamstani
I n
U v) m
I
! E l
3i ! W 5 4.50
-A r -
c(
A Relaxation Analysis
0 Creep Analysis
Linear (Creep
-20 -18 L n ( d e / d t j 1 4
-16 -12 10
Fg. 1 7. Logarithmic plot of the stress and its corresponding strain rate as deduced from three creep tests and a single retawation test at 25°C.
of holding stress, strain rate and temperature was es- tablished. Stress relaxation experiments have revealed the nature of the rate dependence deformation for long-term inelastic behavior. The relation between the load drop, temperature and strain level was investi- gated. Load relaxation methodology for generating long-term prediction of composite durability was proven to be more time and cost efficient than the tra- ditional long-term tensile creep testing approaches.
ACKNOWLEDGMENT
The authors are grateful to the Structural Research Center, Florida Department of Transportation, for pro- viding the materials used in this research.
REFERENCES 1. L. Franke a n d H. J. Meyer, J . Mat. Sci., 27, 4899
2. R. J. Morgan, E. Shin, et aL. 39th Intern. SAMPE Symp,
3. E. Shin, R. DUM, and R. Morgan, 10th ASM/ESD Adu.
4. M. J. Chajes. W. W. Finch, et aL, ACI Struct. J. , 3, 208
5. S. J. DeTeresa, JOM, 8, 58 (1993). 6. A. Pasricha, D. A. Dillard, and M. E Tuttle, Comp. Sci
7. D. R. Veazie and T. S. Gates, AIAA, 98. 1 (1998). 8. T. S . Gates, High Temperature and Environmental Ef-
fec ts on Polymeric Composites, ASTM STP 1 174, 20 1 ( 1993).
9. T. S. Gates, Composites Materials: Testing and Design, 1 lth Volume, ASTM STP, 1206, 177 (1993).
10. A. Lee and G. B. McKenna, Polym Sci B: Polym Phys., 35, 1167 (1997).
11. S. W. Case, R. B. Plunkett, and K. L. Reifsnider, High Temperature and Environmental E f e c t s on Polymeric Composites, 2nd Volume, ASTM STP, 35 (1997).
( 1992).
1564 (1994).
Comp. ConJ 545 ( 1994).
( 1996).
Tech, 57. 1271 (1997).
12.
13.
14.
15.
16. 17. 18.
19. 20.
21.
22.
23.
24.
25.
26.
27.
28.
29.
E. E. Shin, R. Jurek, L. T. Drazel, and R. J. Morgan, Roc. ASME Mat. Div.. 183 (1995). Y. Leterrier, Y. Wyser, and J. E. Manson, J. App. Polym Sci, 73,1427 (1999). S. Zhu, S. Mizuno, et aL, Mat. Sci. and Eng., A226, 69 (1997). H. L. McManus and R. A. Curmr@mm , H g h Tempera- ture and Environmental Effects on Polymeric Composites, 2nd Volume, ASTM STP, 1 (1997). T. S. Gates, AIAA. 2, 925 (1999). A. D. Drozdov, Polymer, 30. 1327 (1998). S. G. Baradenhagen. M. G. Stout, and G. T. Gray, Mech.
,J. Fish and K. Shek. Comp PartB., 20, 613 (19981. M. Vujoswic and D. Krajcinovic, Int. J . Solids Structures, 34, 1105 (1997). J. H. Shyur, E. A. Elsayed, and J. T. Luxhoj, Naval Re- search Logistics, 46, 303 (1999). 3. Raghavan and M. Meshii, Comp. Sci and Tech, 57, 1673 (1997). J. Raghavan and M. Meshii, Comp. Sci and Tech., 57, :375 (1997). M. A. Meyers and K. K. Chawla, Mechanicai MetaUurgy: Principles and Applications, Prentice-Hall, Inc., Engle- wood Cliffs, N.J . (1984). E. W. Hart and H. D. Solomon, Acta MetaUurgica. 21, 295 (1973). E. W. Har t and H. Garmestani , J. Exp. Mech, 3, 1 (1993). F. Booeshaghi and H. Garmestani, Scripta Materilaia, 40, 1359 (1999). J. Lemaitre and J. L. Chaboche. Mechanics of Solid M a - terials, Cambridge University Press, New York (1990). G.G. Grzywinski and D. A. Woodford, Polym Eng. Sci, 35. 1931 119951.
Of Mat., 25, 235 (1997).
30. W. ‘N. Findley, J . S. Lai. and K. Onaran, Creep and Re- laxation of Nonlinear Viscoelastic Materials, Dover Publi- cations Inc., New York (1989).
31. J. E. Masters and M. A. Portanova, Standard Test Meth- ods for Textile Composites, NASA Contractors Report 4751 (1996).
792 POLYMER COMPOSITES, DECEMBER 2007, Voi. 22, No. 6