durham research onlinedro.dur.ac.uk/5215/1/5215.pdf · welfare state regimes and ... germany)...
TRANSCRIPT

Durham Research Online
Deposited in DRO:
18 June 2009
Version of attached �le:
Accepted Version
Peer-review status of attached �le:
Peer-reviewed
Citation for published item:
Eikemo, T. and Bambra, C. and Judge, K. and Ringdal, K. (2008) 'Welfare state regimes and di�erences inself-perceived health in Europe : a multi-level analysis.', Social science medicine., 66 (11). pp. 2281-2295.
Further information on publisher's website:
http://dx.doi.org/10.1016/j.socscimed.2008.01.022
Publisher's copyright statement:
Additional information:
Use policy
The full-text may be used and/or reproduced, and given to third parties in any format or medium, without prior permission or charge, forpersonal research or study, educational, or not-for-pro�t purposes provided that:
• a full bibliographic reference is made to the original source
• a link is made to the metadata record in DRO
• the full-text is not changed in any way
The full-text must not be sold in any format or medium without the formal permission of the copyright holders.
Please consult the full DRO policy for further details.
Durham University Library, Stockton Road, Durham DH1 3LY, United KingdomTel : +44 (0)191 334 3042 | Fax : +44 (0)191 334 2971
http://dro-test.dur.ac.uk

1
Welfare state regimes and
differences in self-perceived health
in Europe: a multilevel analysis
Word count
Main text: 5814
Main text including abstract, references, figure and tables: 8 905

2
Abstract
The aim of this study was to determine the degree to which welfare state regime
characteristics explained the proportional variation of self-perceived health between
European countries, when individual and regional variation was accounted for, by
undertaking a multilevel analysis of the European Social Survey (2002 and 2004). A
total of 65065 individuals, from 218 regions and 21 countries, aged 25 and above
were included in the analysis. The health outcomes related to people‟s own mental
and physical health in general. The study showed that almost 90 % of the variation in
health was attributable to the individual level, while approximately 10 % was
associated with national welfare state characteristics. The variation across regions
within countries was not significant. Type of welfare state regime appeared to account
for approximately half of the national-level variation of health inequalities between
European countries. Scandinavian and Anglo-Saxon welfare regimes were observed
to have better self-perceived general health in comparison to Southern and East
European welfare regimes.
Keywords:
Health inequalities, welfare state, welfare state regimes, multilevel analysis,
morbidity, Europe
3
Introduction
The purpose of this paper is to examine and explain between country differences in
self-perceived health in Europe by undertaking a multilevel analysis of the European
Social Survey (2002 and 2004). It focuses on one main research question: to what
extent does welfare state regime classification explain the proportional variation of
self-perceived health between European countries, when individual and regional
variation is accounted for? This not only implies a need to determine the degree to
which self-perceived health actually varies between countries but also to examine
whether (and if so, why) the characteristics of certain types of welfare state and
welfare state regimes may have a health-protective effect.
Welfare states and welfare state regimes
It is now widely acknowledged that welfare states are important determinants of
health in Europe as they mediate the extent, and impact, of socio-economic position
on health (e.g. Bambra, 2006a; Eikemo, Huisman, Bambra, & Kunst, in press;
Navarro et al., 2003). Health status, especially inequalities in health within and
between European countries, is largely determined by income inequalities, the
distribution of wealth, and other aspects of socio-economic inequalities (Kawachi,
Kennedy, Lochner, & Prothrow-Stith, 1997; Mackenbach et al., 1997; Wilkinson,
1996). Welfare provision in its entirety (social transfers and welfare services) is
designed to address these issues of inequality and should therefore have a bearing
upon health outcomes (Bartley & Blane, 1997; Conley & Springer, 2001; Navarro et
al., 2003) Welfare states provide a variety of social transfers (such as housing related
benefits, unemployment, pensions, and sickness and disability benefits) as well as key
services (most notably health care or social services), which together mediate the
4
relationship between socio-economic position and health. The principles underpinning
welfare states, the generosity of social transfers, and entitlements, vary extensively
across European countries. For example, in some unemployment benefits are related
to previous earnings (e.g. Norway, Germany) whereas in others they are provided at a
standard flat-rate (e.g. UK) lowering the relative wage replacement rate (Eikemo &
Bambra, in press). Similarly, entitlement to welfare state benefits and services varies,
with some countries providing universal coverage (e.g. Sweden or Norway) whilst
others use means-testing (e.g. Ireland or UK).
Welfare state typologies place those welfare states that are the most similar (in terms
of principles, provision, etc) together into clusters of countries with different welfare
state regimes, emphasising within regime coherence and between regime differences.
Influential within this field is the well known work of Esping-Andersen (1990). In
The Three Worlds of Welfare State Capitalism (1990), he classifies welfare states into
three regime types (Liberal, Conservative, Social Democratic) on the basis of three
principles: decommodification (the extent to which an individual‟s welfare is reliant
upon the market), social stratification (the role of welfare states in maintaining or
breaking down social stratification), and the private-public mix (the relative roles of
the state, the family and the market in welfare provision). A fourth principle,
defamilisation („the degree to which individual adults can uphold a socially
acceptable standard of living, independently of family relationships, either through
paid work or through social security provisions‟) (Lister, 1997) was added to the
analysis in 1999 (Esping-Andersen, 1999). These principles reflect the relative roles
of the state, the family and the market in the provision of welfare. Liberal (UK,
Ireland) welfare states are characterised by their basic and minimal levels of

5
provision: social transfers are modest and often attract strict entitlement criteria;
recipients are usually means-tested and stigmatised; the dominance of the market is
encouraged both passively, by guaranteeing only a minimum, and actively, by
subsidising private welfare schemes. The conservative welfare state regime
(Germany, France, Austria, Belgium, Italy and, to a lesser extent, the Netherlands) is
distinguished by its „status differentiating‟ welfare programs in which benefits are
often earnings related, administered through the employer; and geared towards
maintaining existing social patterns. The role of the family is also emphasised and the
redistributive impact is minimal. However, the role of the market is marginalised. The
Social Democratic regime type (Scandinavian countries), is characterised by
universalism, comparatively generous social transfers, a commitment to full
employment and income protection; and a strongly interventionist state. The state is
used to promote social equality through a redistributive social security system.
There has been extensive scholarly debate about the theoretical and empirical value of
the Three Worlds typology (for a detailed summary see Arts & Gelissen, 2002 or
Bambra, 2006b) and as a result of this, modified or alternative typologies have been
proposed by others (Bambra C., 2004, 2005a, 2005b; Bonoli, 1997; Castles &
Mitchell, 1993; Korpi & Palme, 1998; Navarro et al., 2006), most of which place
emphasis on those characteristics of welfare states not extensively examined by
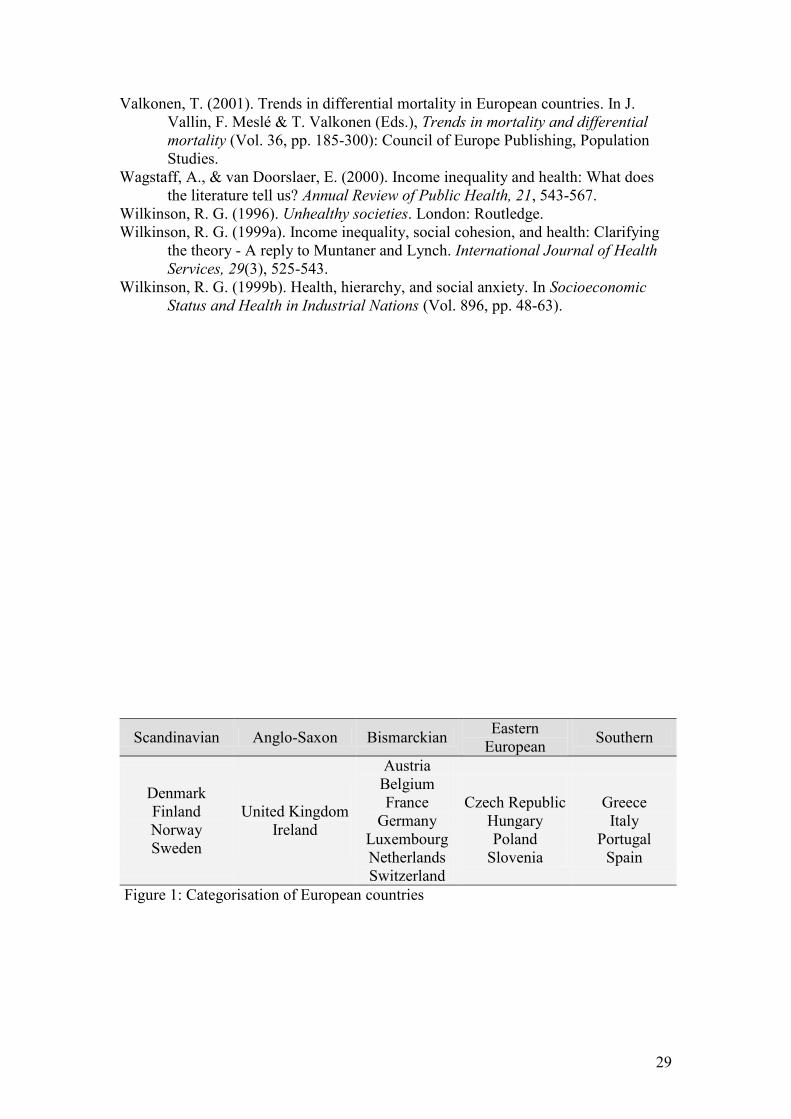
Esping-Andersen or which cover more countries. Ferrera‟s (1996) four-fold typology,
which focuses on different dimensions of how social benefits are granted and
organised, has been highlighted as one of the most empirically accurate welfare state
regime typologies (Bambra, 2007a). Ferrera makes a distinction between the
Scandinavian (Social Democratic), Anglo-Saxon (Liberal), Bismarckian

6
(Conservative) and Southern countries (Figure 1). Although there are clear similarities
between Ferrera‟s and Esping-Andersen‟s typologies, Ferrera‟s classification is
intended to account for differences in the way welfare is delivered whilst Esping-
Andersen‟s still tends to emphasise the quantity of welfare provided (Bambra, 2007a;
Bonoli, 1997). In this way, the additional Southern regime is characterised by a
fragmented system of welfare provision which consists of diverse income
maintenance schemes that range from the meagre to the generous and a health care
system that provides only limited and partial coverage. There is also a strong reliance
on the family and charitable sector (Ferrera, 1996). One new challenge to
conventional welfare regime typologies concerns the Eastern European countries.
These countries have experienced extensive economic upheaval and have undertaken
comprehensive social reforms throughout the 1990s (Kovacs, 2002). In comparison
with the other member states of the European Union, they have limited health service
provision and overall population health is relatively poor. In our analysis, we will use
Ferrera‟s typology (1996) expanded by adding a category for Eastern Europe (Czech
Republic, Hungary, Poland, and Slovenia).
Health differences between individuals and regions
Although the focus of this paper lies at country-level, it is important to consider health
variations at the individual level additionally, because health is mainly attributed to
individual characteristics. At this level, social inequalities in health have mainly been
approached by means of occupational class (Kunst & Mackenbach, 1994; Kunst et
al., 2005), educational attainment (Cavelaars et al., 1998b; Silventoinen & Lahelma,
2002) and income (Adler et al., 1994; Cavelaars et al., 1998a; Fritzell, Nermo, &
Lundberg, 2004; Marmot, 2002; Subramanian & Kawach, 2006a; Subramanian &

7
Kawachi, 2004; Wagstaff & van Doorslaer, 2000), all regarded as indicators of socio-
economic status (SES). We have also seen that social network (social contacts with
one or several persons) and social support (quality of social interactions) appear to
make individuals feel healthier, live longer, feel better and cope with difficulties due
to chronic diseases and acute difficulties (Berkman, 1985; House, Landis, &
Umberson, 1988; Pinquart & Sorensen, 2000; Wilkinson, 1999a, 1999b).
The data used in this study also allows us to investigate the proportional variation of
self-perceived health among regions as compared to individual and country-level
variation. Even though the extent to which self-perceived health varies among regions
within European countries has not been previously investigated, we might expect that
self-perceived health in Europe is also related to regional factors. Previous studies of
mortality have shown that there is a regional north-south gradient in ischaemic heart
disease mortality in both Britain and France, which could be partly explained by
people‟s socioeconomic position (Lang et al., 1999; Morris et al., 2001). Another
study concluded that ischaemic heart disease mortality is about 50% higher in East
compared to West Germany (Muller-Nordhorn, Rossnagel, Mey, & Willich, 2004).
Health differences between countries and welfare state regimes
Some European countries are healthier than others (Mackenbach, 2006) and the main
aim of this study is to examine and explain disparities of self-perceived health in
Europe by means of welfare state regimes, when individual and regional variation are
accounted for. Welfare state regime typologies have previously been used to analyse
cross-national differences in population health (Chung & Muntaner, 2007; Coburn,
2004; Navarro et al., 2003; Navarro et al., 2006). These studies have invariably all

8
concluded that population health is enhanced by the relatively generous and universal
welfare provision of the Scandinavian countries (Chung & Muntaner, 2007; Coburn,
2004; Navarro et al., 2003; Navarro et al., 2006). For example, studies have
consistently shown that infant mortality rates (IMR) vary significantly by welfare
regime type (Bambra, 2006a; Chung & Muntaner, 2007; Coburn, 2004; Navarro et al.,
2006), with rates lowest in the Scandinavian countries and highest in the Southern
regimes. These systematic differences in health outcomes may be explained by the
relative roles of the state, the family and the market in welfare provision (Esping-
Andersen, 1990) with the more highly decommodifying welfare states (Scandinavian)
- through income redistribution (Dahl, Elstad, Hofoss, & Martin-Mollard, 2006;
Subramanian & Kawachi, 2006b; Torsheim, Currie, Boyce, & Samdal, 2006b;
Torsheim et al., 2006a) and low unemployment (Ferrie, Shipley, Stansfeld, & Marmot,
2002; Keefe et al., 2002; Lahelma, 1992; Martikainen & Valkonen, 1996) – providing
better protection against the health effects of a low market (socio-economic) position.
Furthermore, the welfare state is important to population health in terms of how the
state interacts with the family structure (Hatland, 2001), and thereby reduces the
welfare burden on families and/or women (the state de-familises the family/women)
(Bambra, 2004, 2007b; Esping-Andersen, 1999; Korpi, 2000).
Previous studies of health differences between welfare state regimes (e.g. Bambra,
2006a; Chung & Muntaner, 2007; Coburn, 2004) have used mortality (especially
IMR) or life expectancy data as their health outcomes (Navarro et al., 2006); they
have tended to rely on Esping-Andersen‟s three-fold classification of welfare states
(often excluding Southern and Eastern Europe), and they have seldom utilised a
multilevel design (except for the studies of Olsen & Dahl (2007) and Chung &

9
Muntaner (2007), in which two levels were applied). Therefore, this paper is the first
to focus particularly on morbidity (self-perceived health) differences between welfare
state regimes in Europe. This study is also distinguished from others in this field
because we use a five-fold typology of welfare states, and we also use multilevel
analysis with three levels.
Data and methods
This study is based on the cumulative data file (edition 2.0) for the first two rounds
(fielded in 2002 and 2004) of the European Social Survey (ESS), which was released
on January 29, 2007. The main objective of the ESS is to provide high quality data
over time about changing social attitudes and values in Europe. Extensive descriptions
of the ESS are at the ESS web site (www.europeansocialsurvey.org). The data and
extensive documentation are freely available for downloading at the Norwegian
Social Science Data Services (NSD) web site (www.nsd.uib.no). Available data from
65 065 individuals (people aged 25 + were included), within 218 regions (see
appendix for detailed description), within 21 countries, were included in a multilevel
analysis after deleting cases listwise by each variable in our analysis. The 21 countries
were further defined into 5 types of welfare regimes.
Health outcome variables
We used two indicators of morbidity available in the ESS: self reported general health
and limiting longstanding illness. Self reported general health was constructed from a
variable asking; „How is your (physical and mental) health in general?‟. Eligible
responses were „very good‟, „good‟, „fair‟, „bad‟, and „very bad‟. We dichotomized
the variable into „very good or good‟ health versus „less than good‟ health („fair‟,

10
„bad‟, and „very bad‟). As for limiting longstanding illness, people were asked if they
were hampered in daily activities in any way by any limiting longstanding illness or
disability, infirmity or mental health problem. Eligible responses were „yes a lot‟,
„yes to some extent‟ and „no‟. We dichotomized this variable into „yes‟ (regardless of
whether to some extent or a lot) and „no‟.
--- Table 1 about here ---
Individual level explanatory variables
The first explanatory variable is educational attainment, where people were asked to
state their highest achieved level of education ranging from „not completed primary
education‟ to „second stage of tertiary education‟. We defined „not completed primary
education‟, „primary or first stage of basic‟, and „lower secondary or second stage of
basic‟ as „primary education‟, „upper secondary‟ remains unchanged, while „post
secondary/non-tertiary‟, „first stage of tertiary‟, and „second stage of tertiary‟ are
defined as „post-secondary / tertiary education‟. Occupational class was defined
according to the European Socio-economic Classification (ESeC)
(www.iser.essex.ac.uk/esec/), which is a further development of the widely applied
EGP classification (Erikson & Goldthorpe, 1992). The ESeC classification classifies
people according to their positions within labour markets and production units, with
special attention to their employment relations. The ESeC is designed to facilitate
international overviews and cross-national comparisons across the EU (Rose &
Harrison, 2007). In order to improve population coverage, those who are not currently
in paid employment are allocated to an ESeC class on the basis of their last main paid
job. We applied a summary measure comparing classes 5 to 9 (lower occupational
11
classes) with 1 to 4 (higher occupational classes). Those with unknown occupation
were included in the analyses as „no reported class‟ (see Table 1 for further
description). Just over 7 % of the respondents did not report any occupation and were
included in the analysis with „no reported occupation‟. Income was measured by
annual household income divided into four equal sized groups (quartiles). Individuals
were classified into their relative economic income position within each country in
order to control for different currencies and standards of living within the various
countries. (To include more cases, an extra group consisting of people with no
information on income, was added to the dummy-set). Social network was measured
by frequency of social meetings with friends, relatives or colleagues. The response
categories „never‟, „less than once a month‟, „once a month‟ and „several times a
month‟ were recoded in to one group („limited social network‟), while the values
describing „once a week‟, „several times a week‟, and „every day‟ were set as the
reference category. Social support was measured by quality of social meetings. The
question asked was whether the person has anyone to discuss intimate or personal
matters with. This variable was divided into two categories by the response categories
„yes‟ and „no‟.
Country level explanatory variables
We investigated whether type of welfare regime may contribute in explaining the
health variation between countries by classifying the 21 countries into five different
categories according to the Ferrera (1996) classification expanded by a category for
Eastern Europe (Figure 1). More information about all explanatory variables at level 1
and 2 is given in Table 1.
12
--- Table 1 about here ---
Multilevel modelling
Multilevel models are increasingly used within the social sciences because they allow
the possibility of modelling outcomes as a function of explanatory variables at
different levels. The basic principle is that the data are structured in hierarchically
nested groups (Kreft & Leeuw, 1998; Leyland & Goldstein, 2004). The ESS allows
for three hierarchic levels to be used. The level 1 units are individual people; the level
2 units are regions within countries, while the units at level 3 are European countries.
By using general health and limiting longstanding illness as the dependent variables,
we were able to investigate to what extent health varies at each level compared to the
others and at the same time to seek to identify factors that may explain this variation.
The analyses were done in two steps. First, we analysed the variation in health
without using any explanatory variables in order to decompose the variance of the
intercept into variance components for each of the three levels (Table 2). Such models
are called intercept-only models or just variance component models. The second step
was to analyze a model with all the lower explanatory variables fixed, in order to see
how health varies by means of individual characteristic such as sex, age and
socioeconomic position (Table 3, Model 1). Thereafter, we added the country-level
welfare regime variables (level 3) as shown in the second model of Table 3. The 3-
level logistic variance component model, which has no explanatory variables, may be
written as follows:
Lijk = 0jk
0jk = 0 + V0k + U0j+ eijk

13
The expression Lijk represenents the linear logit function of the model. The intercept
(0) varies randomly across regions and countries, which is illustrated by the j and k
subscript attached to it. The intercept for the jth region is given by the average
intercept 0 plus a random departure u0jk. Following the same logic, the intercept for
the kth country will be the average intercept 0 plus the random variation v0k. eijk
represents the individual-level residual. We can therefore say that the parameter 0
constitutes the fixed part of the regression, while u0jk and v0k are random “residuals”
on the regional and national level. The second step was to include explanatory
variables:
Lijk = 0jk+ 1X1ijk + 2X2ijk + … + n+1Xn+1ijk
0jk = 0 + V0k + U0j+ eijk
The parameters were calculated using the software MLwiN. Browne (2003) and
Goldstein (2003) advise the use of MCMC methods (with starting values based on the
2nd
PQL method) for binary response models. The big advantage of MCMC is that it
allows exact interference, which is important for any level 3 parameters (such as
variance) where the number of units is small. Alternatively we could have applied
laplace methods, but these are also approximations to max likelihood and not always
guaranteed to work well and quadrature can be very slow when there are a lot of
parameters.
The parameter estimates in all models are given with 95 % confidence intervals. For
all multilevel models, we calculated the variance partition coefficient (VPC), which
14
gives the proportion of the total variance that is attributable to each level. As the level
1 and 2+3 variances are not on the same scale, we have used the latent variable
approach (see Snijders & Bosker (1999) for further details), by assuming the observed
values (0 and 1) arise from an underlying continuous variable with logistic
distribution. The variance of a standard logistic distribution is π2 / 3 ≈ 3.29 and the
level 1 variance will be replaced by this value, so that both the level 1 and level 2+3
variances are allocated on a continuous scale. For 3-level discrete response models,
the VPC at country-level may calculated as [V0k / (V0k + U0j+ 3.29)], the VPC at
regional level as [U0k /(V0k + U0j+ 3.29)], while individual-level VPC equals [3.29 /(
V0k + U0j+ 3.29)]. We have presented these numbers as % of total variance
(VPC*100).
Results
The interpretation of the results from Table 2 is very straightforward, as it simply
shows how much of the total variance of self-perceived health that is attributed to
each of the three levels. This is calculated as the ratio of the random country variance
(i.e. the intercept) to the total variance. For example, the country-level variance of
poor general health using the 2nd
order PQL method is 0.318, which gives a
proportional variance (in percent) of 8.68. The calculation is [0.318 / (3.29 + 0.054 +
0.318))]*100. Thus, roughly 8.68 % of the variation of health is due to differences
among the countries. At least four findings should be noted from Table 2 (3-level
variance component models). First, the variation of peoples‟ general (poor) health is
mainly caused by individual factors, as roughly 90 % of the total variation is located
here. Second, people‟s general health does not seem to vary much across regions
within countries. Third, it appears that cases of limiting longstanding illness vary less
15
than general poor health between European countries, as only 3.92 % of the total
variation was attributable at this level according to the 2nd
PQL-estimation. Because
there is very little variation to explain with respect to limiting longstanding illness, we
will only focus on poor general health in the following multilevel analyses. Finally,
Table 2 compares the variance attributable at each level using different modelling
techniques to test the sensitivity of this analysis to different methods. The results did
not change substantially according to the various modelling technique. The
forthcoming multilevel analysis with explanatory variables (Table 3) will thus be
based on the Bayesian MCMC estimation with priors from 2nd
PQL method only.
--- Table 2 about here ---
The multilevel analyses shown in Table 3 (3-level random intercept models) include
explanatory variables. Model 1 includes level-1 variables only and shows that having
poor health is positively correlated with being older, being a woman, having only
primary education, belonging to lower social classes, having low income, having a
poor social network and not much social support. Largest health differences were
observed between those with low (1st quartile) and high (4th quartile) income
(OR=1.75) and between high and low educated people (OR=1.66). The variation in
intercepts between countries indicates that 9.65 % of the total variation of individual
health outcomes is due to country-level characteristics, after we have adjusted for
individual-level characteristics (Table 3).
The country-level variation is reduced from 0.355 (model 1) to 0.189 in model 2 after
controlling for the welfare regime typologies, which means that the proportional

16
variance is reduced from 9.65 % to 5.43 %. This model shows that Scandinavian and
Anglo-Saxon countries seem to have the best general health situation, while Southern
welfare regimes and East European countries seem to have the worst general health
compared to the Scandinavian countries. Bismarckian welfare regimes appear to hold
an average position. The individual-level variables did not seem to change
substantially from the first to the second model.
--- Table 3 about here ---
Discussion
Summarising the results, this study has shown that nearly 90% of the variation of self-
perceived general health outcomes was due to characteristics at the individual level.
Country-level characteristics accounted for around 10 % of disparities in self-
perceived health. Intra-country regional variation, however, was almost non-existent
after controlling for individual and country level variation. The key finding of this
study is that the Scandinavian and Anglo-Saxon welfare regimes seem to have
arrangements that give them an advantage compared to Southern and East European
welfare systems.
Before going deeper into this main finding, we have to consider some possible
methodological limitations, which could influence this main result of the study. First,
it is important to be aware of possible artefacts due to cultural differences in European
countries. The fact that limiting longstanding illness may be regarded as a more robust
measure than people‟s general health perception, combined with our finding that

17
general health outcomes vary more at the national level compared to those of limiting
longstanding illness, may indicate that possible biases due to different cultural health
perceptions must be addressed. Results from a Finnish study, comparing cultural
differences in self-rated health in Finland and Italy, suggest that self-rated health is a
useful summary of physical health, but may be sensitive to cultural environment
(Jylha, Guralnik, Ferrucci, Jokela, & Heikkinen, 1998). We are therefore aware of the
possibility that health expectations may vary according to culture and that direct
cultural comparisons of self-rated health outcomes in general should be made with
caution. The strength of this study, however, is that all questions are collected from
the same survey, asking the same questions within the same period of time. Second,
self-rated health is not as reliable as studies of mortality. However, a growing number
of studies have shown that weaker measures of health are strongly correlated with
harder health measures, such as death, both in the USA (Idler & Benyamini, 1997)
and in Europe (Heistaro, Jousilahti, Lahelma, Vartiainen, & Puska, 2001). Third, the
outcomes of poor general health might be sensitive to the cut off point on the health
scale. Defining „fair health‟ as „good health‟ could change the between-country
differences, as the category „fair‟ may not be strictly comparable between countries.
However, sensitivity analyses (not shown in tables) showed that the main pattern
between the welfare regimes did not change when „fair‟ was defined as „good health‟.
Furthermore, defining „fair‟ as „poor health‟ has become more or less the standard
procedure within social epidemiology and we have mainly done this for comparative
reasons. Fourth, our analysis has not tested other attributes of countries such as GDP
or income inequality. These might have associations with welfare regime and the
relationships we have reported may therefore not be directly attributable to the
welfare regimes as such, but possibly to other national factors that are not measured

18
here. For example, differences between the Southern and Eastern European regimes
on the one hand, and those of Northern Europe on the other hand, are perhaps due to
the combined effects of the relative poverty of these countries (Olsen & Dahl, 2007)
(they have lower GDP per capita than the Bismarckian, Anglo-Saxon or Scandinavian
countries), higher rates of smoking prevalence, the overhang of recent political
upheavals and ex-dictatorship (Navarro et al., 2006), as well as the somewhat residual
and fragmentary nature of their welfare state provision with its high reliance on the
family and incomplete population coverage (Leibfreid, 1992). Finally, Bayesian
estimation procedures vary according to different starting values. However, sensitivity
analyses (not shown in tables) showed that our main results were not sensitive to
different prior distributions. We also performed bootstrap estimations (using both
MQL and PQL), which improves the accuracy of inferences about parameter values
and corrects bias in parameter estimates (Goldstein & Rasbash, 1996). These analyses
also confirmed our main results.
Individuals and regions
Socioeconomic inequalities in health have been reported among individuals
throughout Europe to a larger or lesser extent (Mackenbach & Bakker, 2002). In our
study, individual factors account for nearly 90 % of differences in health status in our
study. All of our indicators of socioeconomic status (SES) demonstrated a consistent
pattern of health differences between groups of high and low SES. Not only were all
associations significant; a perfect gradient was also observed with respect to the
income quartiles and levels of education. These observations are supported by
numerous studies, which have shown that people with privileged socio-economic
status on the average have better general health and live longer than people with low

19
socio-economic status (EUROTHINE - final report, 2007; Mackenbach, 2006;
Siegrist & Marmot, 2006). Self-perceived health did not seem to vary significantly
among the 218 regions in this study when controlling for individual and country level
variation. Although previous studies have shown that health indeed may vary by
region when a limited number of regions are examined (Lang et al., 1999; Morris et
al., 2001; Muller-Nordhorn et al., 2004) they do not seem to have an effect in a
broader European perspective. However, these studies did control for both individual
and country level variation.
The links between welfare regimes and health status
Welfare regime characteristics are important factors in explaining the variation of
self-perceived health between different European populations, as they explain about
half of the between-country variation in health. The main finding of this study is that
there are differences in self-perceived health between different welfare state regimes
and that the Scandinavian and Anglo-Saxon welfare regimes seem to have
arrangements that give them an advantage compared to the Southern and East
European welfare states.
That there are differences in self-perceived health between different welfare state
regimes is perhaps not that surprising either empirically or theoretically. Previous
empirical studies have also consistently identified such patterns (Bambra, 2006a;
Chung & Muntaner, 2007; Coburn, 2004; Navarro et al., 2006; Olsen & Dahl, 2007).
In theoretical terms, whilst all welfare states are designed to address issues of
inequality, they do so in different ways and to different extents (Esping-Andersen,
1990). Empirically, this has been demonstrated in a number of studies. In a
longitudinal cross-national study of income inequalities and welfare provision

20
between countries, Coburn (2004) concluded that countries which were the least neo-
liberal in their economic and social policy orientation (i.e. the Scandinavian welfare
states), had lower Infant Mortality Rates (IMR), and less mortality at younger ages.
This study also suggested that welfare state regime might be the link between
GDP/capita and mortality. Similarly, Bambra (2006a) found significant differences in
IMR between Esping-Andersen‟s three worlds of welfare: weighted IMR for the
Liberal (Anglo-Saxon), Conservative (Bismarckian) and Social Democratic
(Scandinavian) regimes were 6.7, 4.5 and 4.0 respectively. This study also found a
moderate correlation between decommodification levels (1998 data) and IMR (r=-
0.585, p=0.018). In another recent study of IMR, Navarro et al. (2006) examined
differences between four different welfare state regimes (grouped in terms of political
traditions), they found that those countries which have had long periods of
government by redistributive political parties (most notably the Scandinavian
countries) have experienced lower IMR and, to a lesser extent, increased life
expectancy at birth. These findings were reinforced by Chung and Muntaneer‟s
(2007) multilevel longitudinal analysis of welfare state regimes in which they found
that around 20% of the difference in infant mortality rate among countries, and 10%
for low birth weight, could be explained by the type of welfare state. Social
Democratic (Scandinavian) countries had significantly lower IMR and low birth
weight rates, compared to all other welfare state regimes (when the other three
regimes in the analysis were combined). Our study reinforces and extends the results
of these studies by showing that there are also differences between welfare state
regimes in respect of morbidity (as measured by self-perceived health), when regional
and country-level health variation is accounted for.

21
Suggested explanations for the better performance of the Scandinavian welfare state
regimes in terms of both mortality, and now morbidity, have varied. For example,
Coburn (2004) and Bambra (2006a) have both suggested that the key characteristics
of the Scandinavian welfare state package (universalism, generous replacement rates,
extensive welfare services) result in narrower income inequalities and higher levels of
decommodification, both of which are associated with better population health. For
example, Wilkinson has highlighted that societies with lower income inequalities
have better health than those with larger inequalities. Furthermore, higher
decommodification is associated with lower infant mortality (Bambra, 2006a; Coburn,
2004). Coburn (2004), along with Navarro et al. (2003; 2006), have also highlighted
the importance of the accumulative positive effect on income inequalities of
governance by pro-redistribution political parties in the Scandinavian countries. Other
commentators (for example Bambra et al., 2007b; or Stanistreet, Bambra, & Scott-
Samuel, 2005) have also suggested that increased gender equality within the
Scandinavian welfare states may be another incremental factor behind their better
health outcomes. Furthermore, proponents of the social capital approach have
highlighted the high levels of social cohesion and integration within Scandinavian
societies (e.g. Putnam, 2000), something which has also been associated with better
population health (e.g. Kawachi et al., 1997). Overall, following Chung and Muntaner
(2007), the literature suggests that it is unlikely that there is one particular facet of the
Scandinavian welfare model that leads to better health outcomes, rather it is the
interaction and combination of a variety of policies (e.g. universal access to welfare
services, higher replacement rates, higher levels of employment amongst both men
and women), over a sustained period of time (Chung & Muntaner, 2007; Navarro V.
22
et al., 2006) which has led to a health enhancing reduction in material and social
inequality.
Our study has also shown that self-perceived health is significantly worse in the
Southern and Eastern European regimes. This result is also in keeping with the
existing research literature as many studies have highlighted the comparatively poor
performance of these countries (Bobak, Pikhart, Rose, Hertzman, & Marmot, 2000;
Carlson, 1998; Knesebeck, Verde, & Dragano, 2006; Olsen & Dahl, 2007)
particularly in terms of mortality (see for example Leinsalu, Vagero, & Kunst, 2003;
Mackenbach, 2006; Shkolnikov et al., 2006; Valkonen, 2001). Although the existing
research literature on health differences between welfare state regimes is unequivocal
on the better performance of the Scandinavian welfare model, and the poorer
performance of the Eastern and Southern European countries (Bambra, 2006a; Chung
& Muntaner, 2007; Coburn, 2004; Navarro et al., 2006; Olsen & Dahl, 2007); it is
less unanimous on the relatively poor performance of the Anglo-Saxon countries.
Some studies (e.g. Bambra, 2006a; Coburn, 2004) have demonstrated the
comparatively poor population health of Anglo-Saxon countries (particularly in terms
of IMR). For example, Navarro and Shi (2001) and Coburn (2004) using a four-fold
typology, and Bambra (2006a) using a three-fold typology of welfare state regimes,
all found that IMR were significantly higher in the Anglo-Saxon countries than the
Bismarckian or Scandinavian. Coburn (2004) also suggested that the Anglo-Saxon
countries, due to their pursuit of more neo-liberal approaches (e.g. less public
expenditure on welfare and a corresponding rise in reliance upon the market as a
provider of welfare) did not experience the expected decreases in the period 1960-
1995 in infant mortality due to their relatively high GDP/per capita (for example, in

23
1960 the UK was ranked as 7th of 18 OECD countries in terms of IMR, by 1995 it
had slipped to 13th). However, in contrast, the recent study by Chung and Muntaner
(2007) of IMR and low birth weights by welfare state regime over a 39 year period
found that when all four of the welfare state regimes used in the study were compared
separately (rather than Scandinavian versus the other three regime types combined),
there were no significant differences between the four regimes. Similarly, Coburn‟s
(2004) study suggested that there were less pronounced differences in mortality in
later life between the Anglo-Saxon countries and the other welfare state regimes and
Navarro et al.‟s (2006) study found less conclusive evidence of between regime
differences for life expectancy.
Our study of variations in self-perceived health by welfare state regime therefore adds
to this ongoing research debate. Given the uncertainty of the research literature in this
area, it is only possible to speculate on possible explanations for the, somewhat
counter-intuitive, performance of the Anglo-Saxon countries. One possibly quite
substantial explanation which we would like to put forward is the role of health care
services, an often overlooked social determinant of health (Chung & Muntaner, 2007).
Although the Anglo-Saxon countries in our European study - the UK and Ireland -
conform fairly well to the general characteristics of an Anglo-Saxon approach to
social transfers e.g. use of means-testing, restrictive entitlement criteria, and low
replacement rates (Esping-Andersen, 1990); they do not take a ”typically” Anglo-
Saxon market based approach to the provision of key welfare state services (Bambra,
2005a, 2005b). Most notably, health care is not provided by a market based system
(as it is in the USA or Australia). For example, in the UK – like the Scandinavian
countries – health care is provided via a National Health Service with similar
coverage rates and low levels of private health care expenditure as in the
24
Scandinavian countries (Bambra, 2005a, 2005b). It is possible that such highly
decommodified health care services mediate the relationship between the otherwise
Anglo-Saxon social transfer policies of the UK and Ireland, on self-perceived health.
Clearly, more empirical examination of this and other possible explanations is
required.
Conclusion
This study confirms what previous studies on the social determinants of health have
shown; that socio-economic position is important in explaining disparities in health at
the individual level. However, going further into the mechanisms of different welfare
state regimes is an important path to follow in the process of identifying interventions
to improve public health, as welfare regime appears to account for approximately half
of the national-level variation of health inequalities among European countries.
Scandinavian and Anglo-Saxon welfare regimes were observed to have better self-
perceived general health than Bismarckian, Southern and East European welfare
regimes. Welfare state characteristics such as levels of decommodification and the
extent of welfare services might contribute to these differentials.
References
Adler, N. E., Boyce, T., Chesney, M. A., Cohen, S., Folkman, S., Kahn, R. L., et al.
(1994). Socioeconomic-Status and Health - the Challenge of the Gradient.
American Psychologist, 49(1), 15-24.
Arts W, & Gelissen J. (2002). Three worlds of welfare or more? Journal of European
Social Policy, 12, 137-158.
Bambra C. (2004). The worlds of welfare: Illusory and gender blind? Social Policy
and Society, 3, 201-212.
Bambra C. (2005a). Worlds of welfare and the health care discrepancy. Social Policy
and Society, 4, 31-41.
25
Bambra C. (2005b). Cash versus services: 'worlds of welfare' and the
decommodification of cash benefits and health care services Journal of Social
Policy, 34, 195-213.
Bambra C. (2006a). Health status and the worlds of welfare. Social Policy and
Society, 5, 53-62.
Bambra C. (2006b). Decommodification and the worlds of welfare revisited. Journal
of European Social Policy, 16, 73-80.
Bambra C. (2007a). Sifting the wheat from the chaff: A two-dimensional discriminant
analysis of welfare state regime theory. Social Policy and Administration, 41,
1-28.
Bambra C. (2007b). Defamilisation and welfare state regimes: A cluster analysis.
International Journal of Social Welfare, 16-326.
Bambra, C., Pope, D., Stanistreet, D., Swami, V., Kunst, A., & Scott-Samuel, A.
(2007c). Gender, health inequality and welfare state regimes: a cross-national
study of twelve European countries. In Tackling Health Inequalities in Europe
(EUROTHINE) Final Report. Rotterdam: ErasmusMC.
Bartley, M., & Blane, D. (1997). Socioeconomic determinants of health: Health and
the life course: Why safety nets matter. BMJ, 314, 1194.
Berkman, L. F. (1985). The relationship of social networks and social support to
morbidity and mortality. In S. Cohen & S. L. Syme (Eds.), Social support and
health. Orlando: Academic Press.
Bobak, M., Pikhart, H., Rose, R., Hertzman, C., & Marmot, M. (2000).
Socioeconomic factors, material inequalities, and perceived control in self-
rated health: cross-sectional data from seven post-communist countries. Social
Science & Medicine, 51(9), 1343-1350.
Bonoli J. (1997). Classifying welfare states: A two-dimension approach. Journal of
Social Policy, 26, 351-372.
Browne, W. J. (2003). MCMC estimation in MLwiN. London: Institute of Education.
Carlson, P. (1998). Self-perceived health in East and West Europe: Another European
health divide. Social Science & Medicine, 46(10), 1355-1366.
Castles F., & Mitchell D. (1993). Worlds of welfare and Families of Nations. In
Castles F. (Ed.), Families of Nations: Patterns of Public Policy in Western
Democracies. Dartmouth: Aldershot.
Cavelaars, A., Kunst, A. E., Geurts, J. J. M., Crialesi, R., Grotvedt, L., Helmert, U., et
al. (1998b). Differences in self reported morbidity by educational level: A
comparison of 11 Western European countries. Journal of Epidemiology and
Community Health, 52(4), 219-227.
Cavelaars, A., Kunst, A. E., Geurts, J. J. M., Helmert, U., Lundberg, O., Mielck, A.,
et al. (1998a). Morbidity differences by occupational class among men in
seven European countries: an application of the Erikson-Goldthorpe social
class scheme. International Journal of Epidemiology, 27(2), 222-230.
Chung H., & Muntaner C. (2007). Welfare state matters: A typological multilevel
analysis of wealthy countries. . Health Policy, 80, 328-339.
Coburn D. (2004). Beyond the income inequality hypothesis: class, neo-liberalism,
and health inequalities. Social Science & Medicine, 58, 41-56.
Conley, D., & Springer, K. (2001). Welfare state and infant mortality. American
Journal of Sociology, 107, 768-807.
Dahl, E., Elstad, J. I., Hofoss, D., & Martin-Mollard, M. (2006). For whom is income
inequality most harmful? A multi-level analysis of income inequality and
mortality in Norway. Social Science & Medicine, 63(10), 2562-2574.

26
Eikemo, T. A., & Bambra, C. (in press). The welfare state: a glossary for public
health. Journal of Epidemiology and Community Health.
Eikemo, T. A., Huisman, M., Bambra, C., & Kunst, A. (in press). Health inequalities
according to educational level in different welfare regimes: a comparison of
23 European countries. Sociology of Health & Illness.
Erikson, R., & Goldthorpe, J. H. (1992). The Constant Flux. Oxford: Clarendon Press.
Esping-Andersen G. (1990). The three worlds of welfare capitalism. London: Polity.
Esping-Andersen G. (1999). Social foundations of post-industrial economies. Oxford:
Oxford University Press.
European Social Survey. http://ess.nsd.uib.no.
European Socio-economic Classification home page.
http://www.iser.essex.ac.uk/esec/.
EUROTHINE - final report. (2007). Tackling Health inequalities in Europe.
Rotterdam: ErasmusMC.
Ferrera M. (1996). The southern model of welfare in social Europe. Journal of
European Social Policy, 6, 17-37.
Ferrie, J. E., Shipley, M. J., Stansfeld, S. A., & Marmot, M. G. (2002). Effects of
chronic job insecurity and change in job security on self reported health, minor
psychiatric morbidity, physiological measures, and health related behaviours
in British civil servants: the Whitehall II study. Journal of Epidemiology and
Community Health, 56(6), 450-454.
Fritzell, J., Nermo, M., & Lundberg, O. (2004). The impact of income: assessing the
relationship between income and health in Sweden. Scandinavian Journal of
Public Health, 32(1), 6-16.
Goldstein, H., & Rasbash, J. (1996). Improved approximations for multilevel models
with binary responses. Journal of the Royal Statistical Society Series a-
Statistics in Society, 159, 505-513.
Hatland, A. (2001). Changing family patterns: A challenge to social security. In M.
Kautto, J. Fritzell, B. Hvinden, J. Kvist & H. Uusitalo (Eds.), Nordic welfare
states in the European context (pp. 116-136). London and New York:
Routledge.
Heistaro, S., Jousilahti, P., Lahelma, E., Vartiainen, E., & Puska, P. (2001). Self rated
health and mortality: a long term prospective study in eastern Finland. Journal
of Epidemiology and Community Health, 55(4), 227-232.
House, J. S., Landis, K. R., & Umberson, D. (1988). Social Relationships and Health.
Science, 241(4865), 540-545.
Idler, E. L., & Benyamini, Y. (1997). Self-rated health and mortality: A review of
twenty-seven community studies. Journal of Health and Social Behavior,
38(1), 21-37.
Jylha, M., Guralnik, J. M., Ferrucci, L., Jokela, J., & Heikkinen, E. (1998). Is self-
rated health comparable across cultures and genders? Journals of Gerontology
Series B-Psychological Sciences and Social Sciences, 53(3), S144-S152.
Kawachi, I., Kennedy, B. P., Lochner, K., & Prothrow-Stith, D. (1997). Social capital,
income inequality, and mortality. American Journal of Public Health, 87(9),
1491-1498.
Keefe, V., Reid, P., Ormsby, C., Robson, B., Purdie, G., & Baxter, J. (2002). Serious
health events following involuntary job loss in New Zealand meat processing
workers. International Journal of Epidemiology, 31(6), 1155-1161.
Knesebeck, O. V., Verde, P. E., & Dragano, N. (2006). Education and health in 22
European countries. Social Science & Medicine, 63(5), 1344-1351.
27
Korpi W. (2000). Faces of inequality: gender, class and patterns of inequalities in
different types of welfare states. Social Politics, 7, 127-191.
Korpi W., & Palme J. (1998). The paradox of redistribution and the strategy of
equality: welfare state institutions, inequality and poverty in the Western
countries. American Sociological Review, 63, 662-687.
Kovacs, J. M. (2002). Approaching the EU and reaching the US? Rival narratives on
transforming welfare regimes in East-Central Europe. West European Politics.
, 25 175 Sp. Iss. .
Kreft, I., & Leeuw, J. (1998). Introducing multilevel modeling: Sage.
Kunst A., & Mackenbach, J. P. (1994). Measuring socio-economic inequalities in
health. Copenhagen: WHO Regional Office for Europe.
Kunst, A. E., Bos, V., Lahelma, E., Bartley, M., Lissau, I., Regidor, E., et al. (2005).
Trends in socioeconomic inequalities in self-assessed health in 10 European
countries. International Journal of Epidemiology, 34(2), 295-305.
Lahelma, E. (1992). Unemployment and Mental Well-Being - Elaboration of the
Relationship. International Journal of Health Services, 22(2), 261-274.
Lang, T., Ducimetiere, P., Arveiler, D., Amouyel, P., Ferrieres, J., Ruidavets, J. B., et
al. (1999). Trends and geographical disparities in coronary heart disease in
France: are results concordant when different definitions of events are used?
International Journal of Epidemiology, 28(6), 1050-1058.
Leibfreid, S. (1992). Towards a European welfare state. In Z. Ferge & J. E. Kolberg
(Eds.), Social policy in a changing Europe (pp. 245-279). Frankfurt: Campus-
Verlag.
Leinsalu, M., Vagero, D., & Kunst, A. E. (2003). Estonia 1989-2000: enormous
increase in mortality differences by education. International Journal of
Epidemiology, 32(6), 1081-1087.
Leyland, A. H., & Goldstein, H. (2004). Multilevel Modelling of Health Statistics:
John Wiley & Sons, ltd.
Lister R. (1997). Citizenship: Feminist Perspectives. London.
Mackenbach, J. P. (2006). Health Inequalities: Europe in Profile: An independent,
expert report commissioned by, and published under the auspices of, UK
Presidency of the EU.
Mackenbach, J. P., & Bakker, M. (2002). Reducing inequalities in health: A
European perspective: Routledge.
Mackenbach, J. P., Kunst, A. E., Cavelaars, A., Groenhof, F., Geurts, J. J. M.,
Andersen, O., et al. (1997). Socioeconomic inequalities in morbidity and
mortality in western Europe. Lancet, 349(9066), 1655-1659.
Marmot, M. (2002). The influence of income on health: Views of an epidemiologist.
Health Affairs, 21(2), 31-46.
Martikainen, P. T., & Valkonen, T. (1996). Excess mortality of unemployed men and
women during a period of rapidly increasing unemployment. Lancet,
348(9032), 909-912.
Morris, R. W., Whincup, P. H., Lampe, F. C., Walker, N., Wannamethee, S. G., &
Shaper, A. G. (2001). Geographic variation in incidence of coronary heart
disease in Britain: the contribution of established risk factors. Heart, 86(3),
277-283.
Muller-Nordhorn, J., Rossnagel, K., Mey, W., & Willich, S. N. (2004). Regional
variation and time trends in mortality from ischaemic heart disease: East and
West Germany 10 years after reunification. Journal of Epidemiology and
Community Health, 58(6), 481-485.
28
Navarro V., Borrell C., Benach J., Muntaner C., Quiroga A., Rodriquez-Sanz M., et
al. (2003). The importance of the political and the social in explaining
mortality differentials among the countries of the OECD, 1950-1998.
International Journal of Health Services Research, 33, 419-494.
Navarro V., Muntaner C., Borrell C., Benach J., Quiroga A., Rodríguez-Sanz M., et
al. (2006). Politics and health outcomes. Lancet, 368, 1033-1037.
Navarro V., & Shi L. (2001). The political context of social inequalities and health.
International Journal of Health Services Research, 31, 1-21.
Norwegian Social Science Data Services. http://www.nsd.uib.no.
Olsen, K. M., & Dahl, S. A. (2007). Health differences between European countries.
Social Science & Medicine, 64(8), 1665-1678.
Pinquart, M., & Sorensen, S. (2000). Influences of socioeconomic status, social
network, and competence on subjective well-being in later life: A meta-
analysis. Psychology and Aging, 15(2), 187-224.
Putnam, R. D. (2000). Bowling alone. The collapse and revival of American
community. New York: Simon & Schuster.
Rose, D., & Harrison, E. (2007). The European socio-economic classification: A new
social class schema for comparative European research (Vol. 9, pp. 459 - 490):
Routledge.
Shkolnikov, V. M., Andreev, E. M., Jasilionis, D., Leinsalu, M., Antonova, O. I., &
McKee, M. (2006). The changing relation between education and life
expectancy in central and eastern Europe in the 1990s. Journal of
Epidemiology and Community Health, 60(10), 875-881.
Siegrist, J., & Marmot, M. (2006). Social inequalities in health. New evidence and
policy implications. Oxford: University Press.
Silventoinen, K., & Lahelma, E. (2002). Health inequalities by education and age in
four Nordic countries, 1986 and 1994. Journal of Epidemiology and
Community Health, 56(4), 253-258.
Snijders, T., & Bosker, R. (1999). Multilevel analysis. An introduction to basic and
advanced multilevel modeling. London: Sage.
Stanistreet, D., Bambra, C., & Scott-Samuel, A. (2005). Is patriarchy the source of
men's higher mortality? Journal of Epidemiology and Community Health,
59(10), 873-876.
Subramanian, S. V., & Kawach, I. (2006a). Being well and doing well: on the
importance of income for health. International Journal of Social Welfare, 15,
S13-S22.
Subramanian, S. V., & Kawachi, I. (2004). Income inequality and health: What have
we learned so far? Epidemiologic Reviews, 26, 78-91.
Subramanian, S. V., & Kawachi, I. (2006b). Whose health is affected by income
inequality? A multilevel interaction analysis of contemporaneous and lagged
effects of state income inequality on individual self-rated health in the United
States. Health & Place, 12(2), 141-156.
Torsheim, T., Currie, C., Boyce, W., & Samdal, O. (2006b). Country material
distribution and adolescents' perceived health: multilevel study of adolescents
in 27 countries. Journal of Epidemiology and Community Health, 60(2), 156-
161.
Torsheim, T., Ravens-Sieberer, U., Hetland, J., Valimaa, R., Danielson, M., &
Overpeck, M. (2006a). Cross-national variation of gender differences in
adolescent subjective health in Europe and North America. Social Science &
Medicine, 62(4), 815-827.
29
Valkonen, T. (2001). Trends in differential mortality in European countries. In J.
Vallin, F. Meslé & T. Valkonen (Eds.), Trends in mortality and differential
mortality (Vol. 36, pp. 185-300): Council of Europe Publishing, Population
Studies.
Wagstaff, A., & van Doorslaer, E. (2000). Income inequality and health: What does
the literature tell us? Annual Review of Public Health, 21, 543-567.
Wilkinson, R. G. (1996). Unhealthy societies. London: Routledge.
Wilkinson, R. G. (1999a). Income inequality, social cohesion, and health: Clarifying
the theory - A reply to Muntaner and Lynch. International Journal of Health
Services, 29(3), 525-543.
Wilkinson, R. G. (1999b). Health, hierarchy, and social anxiety. In Socioeconomic
Status and Health in Industrial Nations (Vol. 896, pp. 48-63).
Scandinavian Anglo-Saxon Bismarckian Eastern
European Southern
Denmark
Finland
Norway
Sweden
United Kingdom
Ireland
Austria
Belgium
France
Germany
Luxembourg
Netherlands
Switzerland
Czech Republic
Hungary
Poland
Slovenia
Greece
Italy
Portugal
Spain
Figure 1: Categorisation of European countries

30

31
Table 1 Descriptive statistics for the variables to be analysed a
Variables Description Min. Max. Percentb
Subjective poor health (n=65065)
Poor health Poor general health (‘very bad’, ‘bad’ and ‘fair health’ as compared to ‘good’ and ‘very good’ health)
0 1 36.15 %
Limiting longstanding illness
Hampered by a limiting longstanding illness (‘yes’ and ‘to some extent’ as compared to ‘no’)
0 1 26.12 %
Demographic
Age Age in years 25 109 50.75
Women Gender, 1=women, 1=men 0 1 49.88 %
Socio-economic status
Primary education Primary education 0 1 41.60 %
Upper sec. education Upper secondary education 0 1 32.74 %
Tertiary education Tertiary education (reference category) 0 1 25.66 %
Lower occupational classes
(5) Self employed occupations (agriculture etc). (6) Lower supervisory and lower technician occupations. (7) Lower services, sales and clerical occupations. (8) Lower technical occupations. (9) Routine occupations.
0 1 46.80 %
Higher occupational classes
(1) Large employers, higher grade professional, administrative and managerial occupations. (2) Lower grade professional, administrative and managerial occupations and higher grade technician and supervisory occupations. (3) Intermediate occupations. (4) Small employer and self employed occupations (exc agriculture etc).
0 1 45.97 %
No reported class Unknown occupation, but included in the analysis 0 1 7.23 %
Income_q1 1. income quartile 0 1 17.93 %
Income_q2 2. income quartile 0 1 19.83 %
Income_q3 3. income quartile 0 1 17.69 %
Income_q4 4. income quartile (reference category) 0 1 19.89 %
No reported income Unknown income, but included in the analysis 0 1 24.66 %
No social support No one to discuss personal matters with 0 1 10.62 %
Limited social network Meet with friends, relatives, colleagues less than once a week
0 1 40.54 %
Country level variables (n=21)
Welfare regime Country classification
1 Scandinavian (DK, FI, NO, SE) (reference category) 0 1 19.43 %
2 Bismarckian (AT, BE, CH, DE, FR, LU, NL) 0 1 34.73 %
3 Anglo-Saxon (GB, IE) 0 1 8.39 %
4 South-European (ES, GR, IT, PT) 0 1 19.39 %
5 East European (CZ, HU, PL, SI) 0 1 18.06 % a Min.: minimum value, Max.; maximum value. N=65065 for all cases.
b Mean for age.

1
Table 2 Proportional variation of ill-health between individuals, regions and countries
a
Estimation procedure
Statistics Poor general health Limiting longstanding illness
2nd
order PQL
Level Individual regional national Individual regional national
Variance 3.290 0.054 (0.008) 0.318 (0.071) 3.290 0.049 (0.008) 0.126 (0.029)
% of total variance 89.85 % 1.47 % 8.68 % 95.19 % 1.41 % 3.64 %
MCMC (priors from 2
nd order PQL)
Level Individual regional national Individual regional national
Variance 3.290 0.032 (0.012) 0.355 (0.086) 3.290 0.017 (0.008) 0.135 (0.032)
% of total variance 89.48 % 0.87 % 9.65 % 95.59 % 0.49 % 3.92 %
1st order MQL
Level Individual regional national Individual regional national
Variance 3.290 0.035 (0.006) 0.283 (0.063) 3.290 0.047 (0.008) 0.116 (0.027)
% of total variance 91.19 % 0.97 % 7.84 % 95.28 % 1.36 % 3.36 %
MCMC (priors from 1
st order MQL)
Level Individual regional national Individual regional national
Variance 3.290 0.000 (0.000) 0.354 (0.083) 3.290 0.003 (0.001) 0.134 (0.033)
% of total variance 90.29 % 0.00 % 9.71 % 95.22 % 0.87 % 3.91 %
a 3-level variance component models of poor general health and limiting longstanding illness using both IGLS and
MCMC estimation based on 2nd
order PQL and 1st order MQL estimation.

30
Table 3 A multilevel analysis of poor general health on individual-level variables (model 1) and welfare regime types (model 2)
a
Model 1 Model 2
Categories Variables OR (95% CI) OR (95% CI)
Intercept 0.02 (0.02 – 0.02) 0.01 (0.01 – 0.02)
Sex Men 0 0
Women 1.36 (1.06 – 1.76) 1.37 (1.19 – 1.59)
Age Age 1.04 (1.04 – 1.05) 1.05 (1.04 – 1.05)
Level of education
Primary education 1.66 (1.57 – 1.75) 1.65 (1.56 – 1.75)
Upper secondary 1.24 (1.17 – 1.30) 1.23 (1.17 – 1.30)
Post secondary / tertiary 1 1
Occupational class
Lower classes 1.29 (1.23 – 1.35) 1.29 (1.23 – 1.36)
Higher classes No reported class
1 1
1.24 (1.15 – 1.35) 1.25 (1.15 – 1.35)
Income
1.quartile 1.75 (1.64 – 1.87) 1.75 (1.63 – 1.87)
2.quartile 1.38 (1.29 – 1.47) 1.38 (1.29 – 1.47)
3.quartile 1.13 (1.06 – 1.21) 1.13 (1.06 – 1.21)
4.quartile 1 1
No reported income 1.27 (1.19 – 1.35) 1.27 (1.19 – 1.35)
Social network No social network 1.22 (1.17 – 1.26) 1.21 (1.16 – 1.26)
Has a social network 1 1
Social support No discussion partner 1.56 (1.48 – 1.65) 1.56 (1.48 – 1.65)
Discussion partner 1 1
Welfare regime
Scandinavian 1
Anglo-Saxon 0.76 (0.47 – 1.24)
South European 1.90 (1.56 – 2.31)
Bismarckian 1.19 (0.98 – 1.46)
East European 3.27 (2.47 – 4.33)
Statistics Between country variation (u0j) 0.355 (p<0.01) 0.189 (p<0.01)
Proportion of level-2 variation 0.87 % 0.00 %
Proportion of level-3 variation 9.65 % 5.43 %
N 65065 65065

31
a 2 three-level random intercept models of poor general health using MCMC estimation based
on 2nd
PQL estimation. Model 1 has individual-level variables only, while model 2 includes welfare regime typologies + model 1.