dust in sn1987a john danziger oats-inaf dept. of physics trieste university castiglione della...
TRANSCRIPT

DUST in SN1987A
John Danziger
OATS-INAFDept. of PhysicsTrieste University
Castiglione della Pescaia 16 Sep. 2013
Patrice Bouchet, Saclayhas been a collaboratorsince 24 February, 1987.

The first and only publication with Francesca.
The UV Spectrum of an O-rich SNR in the SMC(Blair, Raymond, Danziger, Matteucci 1989)
1E0102-7219 - bright non-thermal Xray (Einstein), high expansion velocity (6500km/s), Young SNR.
IUE spectra showed lines of OI, [OII], OIII], OIV], CIII]CIV, [NeIV] and MgIIRecombination lines of OI in UV and V spectra allowed scalingto compare with shock models.A combination of shock heating and photoionization (Xrays)provide best fit to line ratios.Abundances relative to O were compared with WoosleyWeaver models for 15 and 25 Msun SNe. No details here.

UV and optical spectra of 1E 0102-7219

This chap might have been included as a co-author of this paper since he participatedin the observations with IUE at Vilspa even though he was – 3 months 9 days old at thetime.
Perhaps it was that experience thatcaused him to leave astronomy to become a psychologist.I never dared ask.
Addendum!

1. Red giant stars (AGB).2. Circumstellar material around hot stars, LBVCar) SNe. 3. Molecular clouds.4. Novae ejecta.5. Core-collapse supernovae ( the basis of this talk). In this last case there have shown to be cases where dust apparently formed not only in the SN envelope but in the surrounding CSM as a result of the interaction.NB. Dust is also destroyed in some environments.
SN1987A provides a good prototype because of the quality and temporal coverage.
Dust forms in and around:

How does the presence of dust manifest itself?
Possible dust indicators.1. Presence of molecules prior to or after (>8 SNe).2. Blueward line shifts. Arguably the most unequivocal.3. Decrease in visual light curves (after 400 days).4. Increase in IR emission.5. Effects on Bolometric light curve.
All of these manifestations were seen in SN1987A!Some observed in other SNe of which there are nowMore than 15 known examples none of which are Type IaSNe. There are however some Type Ib and Ic (?).

Temporal behaviour of 1stovertone band of CO
Dust preceded by molecule formation CO, SiO <150 days
SN1987A
Liu et al.1992 derive CO mass as afunction of time accounting for chemistry,optical depths, non-LTE (black dots).

Optical spectra when dust forms – an analytical approach.
1. A parabolic shaped emission line indicated that dust was evenly distributed within a velocity of 1870k/s defined by the blue side of the profile.2. The shift of the maximum of the profile and the profileshape at zero velocity gave independent determinations ofthe optical depth, and albedo.3. The slowing of the increase of optical depths at day 775suggested that the dust formation rate was slowing. A silicatedust mass at this epoch of 3x10⁻⁴ Msun was obtained.4. The wavelength dependence of the shift of the line maximum (greater shift at shorter wavelengths) showed thatthe dust particles were small i.e. comparable to or smallerthan the wavelength of the emission lines. Some evidence fordark clumps hiding dust.

Suntzeff, Bouchet 1990
Geneva photometry
Faster decay of light curves B,V,GenevaSuggests dust formation may have begunAs early as day 450!
Accurate Photometry
Bolometric
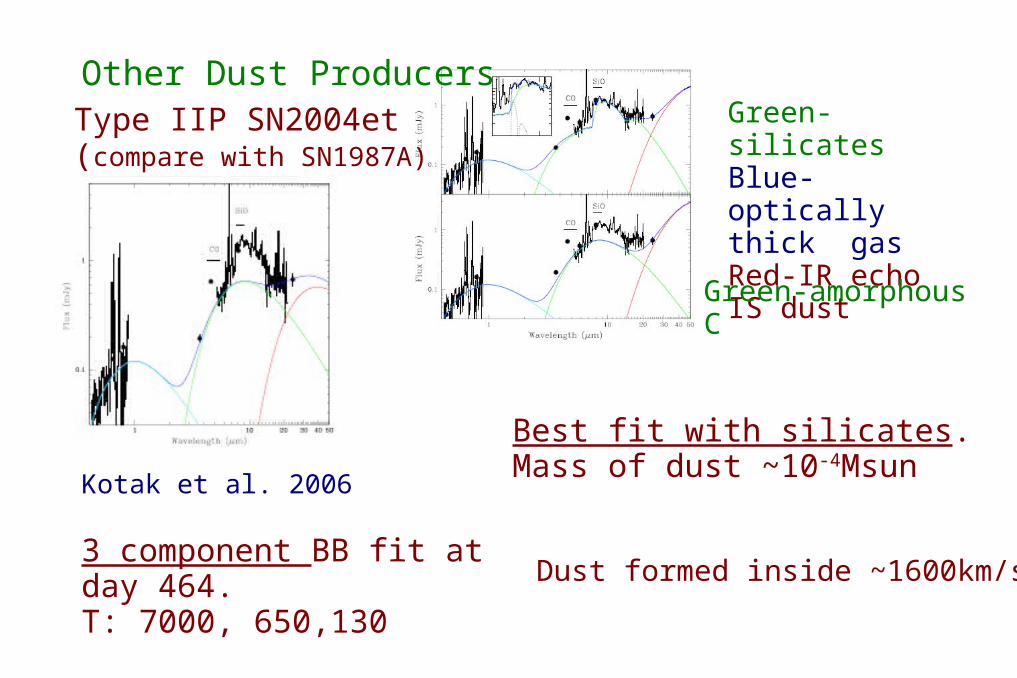
Kotak et al. 2006
Type IIP SN2004et(compare with SN1987A)
3 component BB fit atday 464.T: 7000, 650,130
Green-silicatesBlue-optically thick gasRed-IR echo IS dust
Green-amorphous C
Best fit with silicates.Mass of dust ~10-4Msun
Dust formed inside ~1600km/s
Other Dust Producers

Overlay of HST (Dec2006)(black) with VISIR(red-yellow)shows correlation far from 100%.
Other comparisons show dust anulus possiblythicker than visual HST anulus.
Most Recent Imaging at 10-11Most Recent Imaging at 10-11
Starting 2003 GeminiS, VLT showed ringdust and debris, with ring dust brightening,A result of ejecta-ring interaction.
At 6067 days, T of ring dust ~180KRing dust mass ~ 10-6 Msun
Detection of mid-IR emission in central debris made on days 6067And 7241.

SPITZER - SN1987A
Dust mass abs. coeffs.
Spitzer 02/2004
No evidence fordust destructionso far.Dwek et al. 2010.Broad bands do not discriminate
type of dust!

HERSCHEL – SN1987A (Matsuura et al.2011)
Cold dust 17-23KMass 0.4 – 0.7 Msun in ejecta.
If correct this would help to explain dust at high z formed predominantly in CC SNe.
The fits of dust emission to the Herschel spectra require that all refractory elements expected from nucleosynthesis in modelsend up in dust.

Comments concerning understanding the HERSCHEL interpretation of high mass.
1. All available refractory element mass forms dust. i.e. 100% efficiency2. The mass of dust in the debris should cause large absorption, not apparent. This should be modelled.3. A drastic drop in emission lines from refractory elements would occur at least if this occurred early.4. Temperature for HERSCHEL dust is 20K almost the same as ambient ISM. (T of debris dust at day 1316 was 155K. Dust condensation starts at ~1000K).5. Dust around SNR detected with ISO is hotter.6. IR emission from Herschel dust should be added to Bolometric energy budget.7. Jerkstrand et al. 2011 have shown that at 8 years 0.58Msun of C/O are in clumps but all of this does not necessarily end up in dust.8. It was noted (Danziger et al 1989) that when dust was forming at day 530 the [SiI]1.6 mic line was decreasing faster than would be expected if only dust extinction were responsible. One possible reason was that all the Si was going into SiO and grains. Other possible explanations exist.

Cherchneff (2012) models molecule formation in 15 Msun SNe progenitor with solar metal abundances. Yields fromHeger and Woosley
There are some general features in the model also seen in the observations.There are some general features in the model also seen in the observations.Onset of dust formation lasting for 1000days. Slow beginning, rapid rise Onset of dust formation lasting for 1000days. Slow beginning, rapid rise and then slowing to zero molecule increase.and then slowing to zero molecule increase.
Dominant molecular components: Silicates; oxides of Si, Mg, Fe; C solids; carbides (SiC); Fe ; also molecules of CO, SiO.

ALMA – Rotational lines of CO Kamenetzky et al. 2013 – day ~9250
Mass of CO at least 0.01 MsunT > 14K. Possible backwarming by soft Xrays fromthe ring needs to be understood.Red – unresolved CO emissionVelocity of CO 2200k/s (cf.1870k/s day 600).
SN1987A

An Interpretation of Dust Evolution in SN1987A (no dust destruction included)
New instruments have been successful in elaborating the natureof the dust associated with SN1987A.They include: Mid-IR imaging at ESO, CTIO; SPITZER (spectra);HERSCHEL (spectra); ALMA (spectra, imaging)
Molecules formed early; amorphous warm dust started forming near 450 days with some clumping; ring dust present from red supergiant phase heated by ejecta-ring interaction; cold dust began to form from Increasing mass of molecules in the central region (20 years of accumulation), small percentage (?) of molecular gas still present in central regions together with dust.
Observations leave uncertain: type of dust (ring excepted),efficiency, pulsar excluded by cold central region? At days 6067,7241a central mid-IR (N band) object exists which cannot be cold dust

Some Continuing Uncertainties Concerning Dust
1. The nature of dust in the envelope of SN87A and other SNe. This includes not only grain compositions (silicates, carbon, Fe) but sizes and shapes.2. Do different SNe produce different types of dust and if so what are the defining parameters.e.g. progenitor mass and metallicity3. Clump sizes and optical depths.4. The formation of dust at large redshifts. Clearly dust in the Milky Way has been significantly contributed to by more than SNe. Strong contenders e.g. AGB stars, ISM (molecular clouds) but at z>6 are CC SNe the only realistic candidates?

ENDEND

Plots of emission line strengths vs. time show wavelength dependence, thus very smallparticles < wavelength of light. Effect also seenin photometry. Originally identified as diffuse silicate dust.
Dust particlesizes?
But note extra effect for [SiI]1.65m. Si into silicates, IR catastrophe, or fading of [FeII] line blended with [SiI] due to recombination.

Early IR Spectra of SN1987A
Day 1316Already at BB 155kPeak longwards of N,M
First one sees broad emission featuresdue to molecular bands, then thermal emission by dust.
Temporal series

Mid-IR images at different epochs.Top left to right. N-band at day 6067,11.7 day 6526, N-band day 7241, 11.7day 7569.Bottom left to right. Q-band at day 6526,ratio of N-bands day 7241/6067, this ratioContoured. Ring dust temperatures ~180K.
Different cut forfaint stuff insidering.
Starting 2003 (GeminiS and VLT) midIR imaging showed ring dustand debris? increasing brightness together with Xray, radio, HST V.A result of ejecta-ring interaction which began much earlier.
CIRCUMSTELLAR DUST
Ring dust mass~ 10-6 Msun.

SN1990I Type Ib SN.
Both light curve and blue line shifts support dust formation near 230 days.
How much dust? Not determined!
Dust also in Type Ib

SN1957D in M83
Spectrum observed 30 years later shows lines blue shifted by about 650km/sec. Dust?

No indication in LC ofcentral debris to indicateformation of massiveamounts of dust in debris.Nor have there beenadditional significant blueward line shifts.
HST Photometry

SNe suggesting possibleevidence of dust.Spectra + IRSN1987A 1979CSN1999em 1985L SN1990I SN1998S 1994YSN1980K NB 1997abSN2003gd NB 1999elSN2002hh 2006jcSN2005bfSN2004et (see below)
Sample of youngSN Remnants showing IR emission from associated dust (SPITZER)TychoKeplerCrabCas AAlso older SNRs.
Observational TheoryAttempts to show how verylarge masses of dust are produced in SNe to explainthe high z IR luminosities.(e.g. Kozasa, Todini,Ferrara-results said to berobust). More later.

Blue shift of [OI]6300,6363lines near day 530. Seeaccurate photometry later.
Dust in thin shell not supported by observationsof line profiles.
SN1987A
Analytic approach

Thin shell produces flat top profiles – notobserved.
Uniformly distributeddust produces parabolicshaped profiles varyingwith and
Analytic modelling
= optical depth = albedo

Shows effect of on line shift and shape at 0 velocity.(2 independentmeasures).
Analytic models vs.observations.
Good agreement between 2independent measures of supports model.
Profile shape shows dust contained within 1870km/s. More concentrated in SN99em.
At day 775 when dust formation indicated byoptical depths has slowed down masses ofdust using were obtained:Amorphous silicates 3x10⁻⁴ Msun.Fe, graphite, amorphous C 1-2 orders of mag.less.