dynamic analysis of loads and stresses in connecting rods
TRANSCRIPT

Dynamic analysis of loads andstresses in connecting rodsP S Shenoy and A Fatemi�
Department of Mechanical, Industrial, and Manufacturing Engineering, The University of Toledo, Toledo, Ohio, USA
The manuscript was received on 25 June 2005 and was accepted after revision for publication on 6 February 2006.
DOI: 10.1243/09544062JMES105
Abstract: Automobile internal combustion engine connecting rod is a high volume productioncomponent subjected to complex loading. Proper optimization of this component, which iscritical to the engine fuel efficiency and more vigorously pursued by the automotive industryin recent years, necessitates a detailed understanding of the applied loads and resulting stressesunder in-service conditions. In this study, detailed load analysis under service loading con-ditions was performed for a typical connecting rod, followed by quasi-dynamic finite elementanalysis (FEA) to capture stress variations over a cycle of operation. On the basis of the resultingstress-time histories, variation of stress ratio, presence of mean and bending stresses, andmulti-axiality of stress states in various locations of the connecting rod under service operating con-ditions were investigated. It was found that even though connecting rods are typically tested andanalyzed under axial loading and stress state, bending stresses are significant and a multiaxialstress state exists at the critical regions of connecting rod. A comparison is also made betweenstresses obtained using static FEA which is commonly performed and stresses using quasi-dynamic FEA. It is shown that considerable differences in obtained stresses exist between thetwo sets of analyses.
Keywords: connecting rod load analysis, connecting rod stress analysis
1 INTRODUCTION
Automobile internal combustion engine connectingrod is a high volume production critical component.It connects reciprocating piston to rotating crank-shaft, transmitting the thrust of piston to crankshaft,and is subjected to complex loading. It undergoeshigh cyclic loads of the order of 108–109 cycles,which range from high compressive loads becauseof combustion, to high tensile loads because ofinertia. Therefore, durability of this component isof critical importance. Usually, the worst case loadis considered in the design process. Literaturereview suggests that investigators [1, 2] use maxi-mum inertia load as one extreme load correspondingto the tensile load and compressive gas load produ-cing maximum torque as the other extreme design
load corresponding to the compressive load. Inrecent years, more emphasis has been placed onhigher vehicle fuel efficiency. Optimization of con-necting rods in an engine is critical to fuel efficiency.Proper optimization of this component, however,necessitates a detailed understanding of the appliedloads and resulting stresses under in-serviceconditions.
Inertia load is a time-varying quantity and canrefer to inertia load of the connecting rod or of thepiston assembly. Questions are naturally raised inlight of such complex structural behaviour such as:Does the peak load at the ends of a connecting rodrepresent the worst case loading? Under the effectsof bending and axial loads, can one expect higherstresses than that experienced under axial loadalone? Moreover, very little information is availablein the literature on bending stiffness requirements,or on the magnitude of bending and multiaxialstresses.
Webster et al. [2] performed three-dimensionalfinite element analysis (FEA) of a high-speed diesel
�Corresponding author: Department of Mechanical, Industrial,
and Manufacturing Engineering, The University of Toledo, 2801
W. Bancroft St, Toledo, OH 43606, USA. email: afatemi@
eng.utoledo.edu
615
JMES105 # IMechE 2006 Proc. IMechE Vol. 220 Part C: J. Mechanical Engineering Science

engine connecting rod. They used maximum com-pressive load which was measured experimentally,and maximum tensile load which is essentially theinertia load of piston assembly mass in their analysis.Load distributions on the piston pin end and crankend were also determined experimentally. Ishidaet al. [3] measured stress variation at the columncenter and column bottom of connecting rod, aswell as bending stress at the column center. Fromtheir study it was observed that at high enginespeeds, the maximum stress in connecting rodcolumn bottom does not occur at the top deadcenter. It was also observed that the stress ratiovaries with location, and at a given location it varieswith engine speed. The maximum bending stressover one engine cycle at the column center wasfound to be about 25 per cent of the maximumstress at that location.
Another study used FEA with applied loadsincluding bolt tightening load, piston pin interfer-ence load, compressive gas load, and tensile inertiaload [4]. On the basis of the stress and strainmeasurements performed on connecting rod, closeagreement was found with loads predicted by inertiatheory. The study indicated that stresses in a con-necting rod due to bending loads are substantial,and that buckling and bending stiffness are import-ant design factors that must be taken into accountduring the design process.
Balasubramaniam et al. [1] used the various indi-vidual loads acting on connecting rod for performingsimulation and obtaining stress distribution bysuperposition. The loading consisted of inertia load,firing load, press fit of the bearing shell, and boltforces. Athavale and Sajanpawar [5] also modelledthe inertia load in their finite element (FE) model.An interface software was developed to apply theacceleration load to elements on the connectingrod depending upon their location, as accelerationvaries in magnitude and direction with location onthe connecting rod. They fixed the ends of the con-necting rod to determine its deflection and stresses.This, however, may not be representative of thepinned joints that exist in a connecting rod. The con-necting rod was separately analysed for tensile loaddue to piston assembly mass (piston inertia), andfor compressive load due to gas pressure. The effectof inertia load due to mass of the connecting rodwas also analysed separately. Pai [6] presented anapproach to optimize the shape of the connectingrod subjected to a load cycle consisting of inertiaload deduced from gas load as one extreme, andpeak inertia load exerted by piston assembly massas the other extreme and used fatigue life as theoptimization constraint.
In this study, a detailed load analysis under serviceloading conditions was performed for a typical forged
steel connecting rod, followed by quasi-dynamicFEA to capture stress variation over a cycle of oper-ation. Such stress analysis under realistic operatingloads is critical to any durability or optimizationstudy of a connecting rod and is vastly differentfrom the typical uniaxial testing and static analysiscommonly conducted for this component. This isbecause, in a typical static analysis, the loads actingat the two ends of the connecting rod are equal inmagnitude and are in static equilibrium. On theother hand, in a quasi-dynamic analysis, the loadsat the two ends need not be equal and the connectingrod is in equilibrium at any instant in time, only whenthe inertia load resulting from angular velocity andacceleration (both translational and angular) areaccounted for. Therefore, although the quasi-dynamic analyses are repeated at different timepoints, they are based on time-varying dynamicinput data. For this reason, the analysis is referredto as ‘quasi-dynamic’. Details of the dynamic loadanalysis are discussed in the next section. Optimiz-ation aspects and fatigue behaviour of the connectingrod are investigated in references [7, 8], respectively.
In this article, FE modelling aspects, resultingstress-time histories, variation of stress ratio,presence of mean and bending stresses, and multi-axiality of stress states in various locations of theconnecting rod under service operating conditionsare discussed. A comparison is also made betweenresults obtained using static FEA commonly per-formed, and results using quasi-dynamic FEA repre-senting more realistic service operating conditions.
2 LOAD ANALYSIS
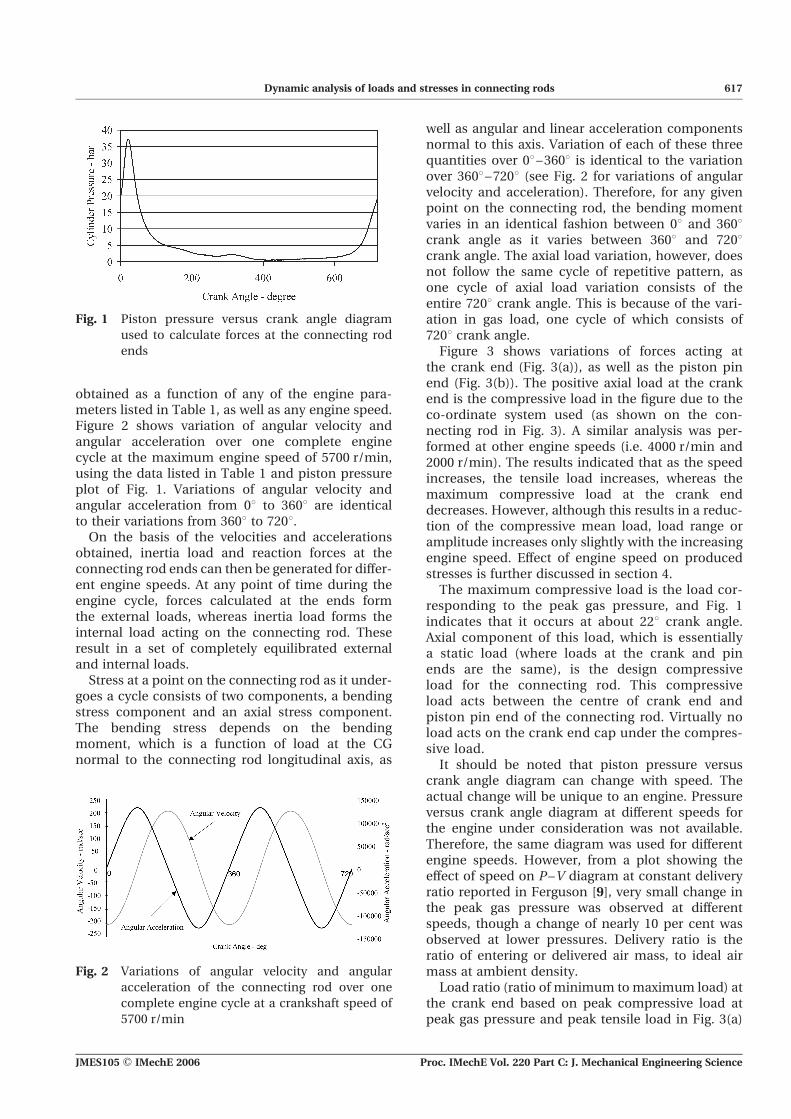
Engine configuration to which the typical connectingrod investigated belongs is shown in Table 1 andpiston pressure versus crank angle diagram used inthe analysis is shown in Fig. 1. With these data andusing commercial software such as ADAMS andI-DEAS, angular velocity and angular accelerationof the connecting rod, as well as linear accelerationsof the connecting rod crank end center and of thecenter of gravity (CG) can be obtained. Variationsof these quantities during one engine cycle can be
Table 1 Configuration of the engine to which the
connecting rod belongs
Crankshaft radius (mm) 48.5Connecting rod length (mm) 141Piston diameter (mm) 86Mass of the piston assembly (kg) 0.434Mass of the connecting rod (kg) 0.439Izz about the center of gravity (kg m2) 0.00144Distance of CG from crank-end centre (mm) 36.4Maximum gas pressure (bar) 37.3
616 P S Shenoy and A Fatemi
Proc. IMechE Vol. 220 Part C: J. Mechanical Engineering Science JMES105 # IMechE 2006
obtained as a function of any of the engine para-meters listed in Table 1, as well as any engine speed.Figure 2 shows variation of angular velocity andangular acceleration over one complete enginecycle at the maximum engine speed of 5700 r/min,using the data listed in Table 1 and piston pressureplot of Fig. 1. Variations of angular velocity andangular acceleration from 08 to 3608 are identicalto their variations from 3608 to 7208.
On the basis of the velocities and accelerationsobtained, inertia load and reaction forces at theconnecting rod ends can then be generated for differ-ent engine speeds. At any point of time during theengine cycle, forces calculated at the ends formthe external loads, whereas inertia load forms theinternal load acting on the connecting rod. Theseresult in a set of completely equilibrated externaland internal loads.
Stress at a point on the connecting rod as it under-goes a cycle consists of two components, a bendingstress component and an axial stress component.The bending stress depends on the bendingmoment, which is a function of load at the CGnormal to the connecting rod longitudinal axis, as
well as angular and linear acceleration componentsnormal to this axis. Variation of each of these threequantities over 08–3608 is identical to the variationover 3608–7208 (see Fig. 2 for variations of angularvelocity and acceleration). Therefore, for any givenpoint on the connecting rod, the bending momentvaries in an identical fashion between 08 and 3608crank angle as it varies between 3608 and 7208crank angle. The axial load variation, however, doesnot follow the same cycle of repetitive pattern, asone cycle of axial load variation consists of theentire 7208 crank angle. This is because of the vari-ation in gas load, one cycle of which consists of7208 crank angle.
Figure 3 shows variations of forces acting atthe crank end (Fig. 3(a)), as well as the piston pinend (Fig. 3(b)). The positive axial load at the crankend is the compressive load in the figure due to theco-ordinate system used (as shown on the con-necting rod in Fig. 3). A similar analysis was per-formed at other engine speeds (i.e. 4000 r/min and2000 r/min). The results indicated that as the speedincreases, the tensile load increases, whereas themaximum compressive load at the crank enddecreases. However, although this results in a reduc-tion of the compressive mean load, load range oramplitude increases only slightly with the increasingengine speed. Effect of engine speed on producedstresses is further discussed in section 4.
The maximum compressive load is the load cor-responding to the peak gas pressure, and Fig. 1indicates that it occurs at about 228 crank angle.Axial component of this load, which is essentiallya static load (where loads at the crank and pinends are the same), is the design compressiveload for the connecting rod. This compressiveload acts between the centre of crank end andpiston pin end of the connecting rod. Virtually noload acts on the crank end cap under the compres-sive load.
It should be noted that piston pressure versuscrank angle diagram can change with speed. Theactual change will be unique to an engine. Pressureversus crank angle diagram at different speeds forthe engine under consideration was not available.Therefore, the same diagram was used for differentengine speeds. However, from a plot showing theeffect of speed on P–V diagram at constant deliveryratio reported in Ferguson [9], very small change inthe peak gas pressure was observed at differentspeeds, though a change of nearly 10 per cent wasobserved at lower pressures. Delivery ratio is theratio of entering or delivered air mass, to ideal airmass at ambient density.
Load ratio (ratio of minimum tomaximum load) atthe crank end based on peak compressive load atpeak gas pressure and peak tensile load in Fig. 3(a)
Fig. 1 Piston pressure versus crank angle diagram
used to calculate forces at the connecting rod
ends
Fig. 2 Variations of angular velocity and angular
acceleration of the connecting rod over one
complete engine cycle at a crankshaft speed of
5700 r/min
Dynamic analysis of loads and stresses in connecting rods 617
JMES105 # IMechE 2006 Proc. IMechE Vol. 220 Part C: J. Mechanical Engineering Science

is 21.23. At the piston pin end, based on the samepeak compressive load as for the crank end butpeak tensile load from Fig. 3(b), load ratio is 22.31.Therefore, load ratio varies over the length of theconnecting rod. As a result, fatigue testing at differentload ratios is often conducted in order to test differ-ent regions of the connecting rod [10].
It should be noted that the analysis presentedassumes that the crank rotates at a constantangular velocity. Therefore, angular accelerationof the crank is not included in the analysis. How-ever, when forces at the ends of the connectingrod in a similar engine configuration under con-ditions of crankshaft acceleration and deceleration
(acceleration of 6000 r/s2 and deceleration of700 r/s2) were compared with forces under constantcrankshaft speed, the difference was found to be lessthan 1 per cent.
3 FE MODELLING OF THE CONNECTING ROD
In order to capture the structural behaviour of theconnecting rod under service operating conditions,quasi-dynamic FEA was performed. An FE modelmesh with about 105 parabolic tetrahedral elements,with uniform global element length of 1.5 mm andlocal element length of 1 mm at locations with
Fig. 3 Axial, normal, and resultant forces at the connecting rod ends at crank speed
of 5700 r/min. (a) Forces at the crank end. (b) Forces at the piston-pin end
618 P S Shenoy and A Fatemi
Proc. IMechE Vol. 220 Part C: J. Mechanical Engineering Science JMES105 # IMechE 2006

chamfers, was used. As a connecting rod isdesigned for very long life, stresses are in the elasticrange, and as a result linear elastic analysis wasconducted.
While performing quasi-dynamic FEA of the con-necting rod, external loads computed from the loadanalysis discussed in section 2 were applied to boththe crank end and the piston pin end of the connect-ing rod. Many FE models were solved, each modelwith the applied loads obtained from the load analy-sis at the crank angle of interest. Therefore, as indi-cated earlier, such analysis is different from a staticanalysis as the time-varying dynamic nature of theloading represented by load variation at differentcrank angles is accounted for. It should also benoted that the dynamic load analysis step wasrequired as a separate step, as input to the stressanalysis step using IDEAS. This is because, althoughcommonly available commercial software are typi-cally capable of providing stresses as output fromdynamic input loads (i.e. gas pressure and inertia)they are not capable of determining the dynamicloads. Time-varying dynamic loads were determinedfrom multi-body dynamic analysis using ADAMS,based on the crank revolutions per minute, pistongas pressure (which varies with time or crankangle), and mass properties of the connecting rod.Combining the two analyses (i.e. multi-bodydynamics and FE stress analyses) into a single steprequires immense computational power to developFE models of the entire system, which may becomeavailable in the future with the rapidly increasingcomputing power.
If the component of the resultant force along theconnecting rod length suggested a tensile load toact on the connecting rod, the resultant load wasapplied with cosine distribution, based on exper-imental results [2]. The cosine distribution wasapplied 908 on either side of the direction of theresultant load, totally 1808. But if the componentof the resultant force along the connecting rodlength suggested a compressive load to act on theconnecting rod, the resultant load was applied withuniform distribution [2]. The uniformly distributedload was applied 608 on either side of the directionof the resultant load, totally 1208 on the contactsurface.
The application of boundary condition is illus-trated in Fig. 4, for a random crank angle of 4328.The computed direction of the resultant load at thecrank end is 73.18. Therefore, 1208 of the surface ofthe crank end (608 on either side of this direction)carries a uniformly distributed load. The directionof the resultant load at the piston pin end is 39.48.Therefore, 1208 of the surface of the pin end carriesa uniformly distributed load. As the axial com-ponents of the loads are compressive, loads wereapplied with uniform distribution, rather thancosine distribution.
Stresses in the regions near the ends of the con-necting rod are sensitive to the type of load distri-bution applied (uniformly distributed or cosinedistribution). Away from these regions however, forexample at the crank end transition to the shank(typical critical or failure region), stresses differonly by 7 per cent at the crank angle of 4328, when
Fig. 4 Illustration of the way in which boundary conditions were applied when solving the
quasi-dynamic FEA model. The illustration is for a crank angle of 4328
Dynamic analysis of loads and stresses in connecting rods 619
JMES105 # IMechE 2006 Proc. IMechE Vol. 220 Part C: J. Mechanical Engineering Science

load distribution is changed from cosine touniformly distributed load.
To account for the dynamic motion of theconnecting rod and the resulting inertia loads, theacceleration boundary conditions were imposed.Translational acceleration in the direction of thecrank towards the crank center, angular velocity,and angular acceleration were imposed on the con-necting rod. The crank end center was specified asthe center of rotation.
A way to simulate the pin joint is to apply all theloads acting on the connecting rod that keeps theconnecting rod in dynamic equilibrium at the instantunder consideration (i.e. at a specific crank angle)and then solve the model. The FE model was solvedby eliminating the rigid body motion, achieved byspecifying kinematics degrees of freedom, and speci-fying elimination of rigid body motion while solving,as opposed to applying restraints. Not applyingrestraints and using loads at both ends of the con-necting rod permits better representation of theloads transferred through the pin joints.
4 RESULTS AND DISCUSSION OF STRESSANALYSIS
A few geometric locations were identified on the con-necting rod at which stresses were traced over theentire load cycle to obtain the stress-time history.Some of these locations are shown in Fig. 5 andinclude high stressed regions of the crank end(locations 5, 10, and 11) the pin end at the oil hole(locations 6 and 7), the shank (locations 8 and 9),and at transitions to the shank at the crank andpiston pin ends (locations 1, 2, 3, and 4). Locations1, 3, 6, 8, and 10 are symmetrically located fromlocations 2, 4, 7, 9, and 11, respectively, with respectto the centerline of the connecting rod. The pointsselected cover the typical critical (i.e. failure)locations of connecting rod [8].
Figures 6 and 7 show the stress-time histories forthe shank region (locations 1, 2, 8, and 9) as well asthe transitions of the shank to the crank and pinends (locations 3, 4, 10, and 11) at a crank speed of5700 r/min. von Mises stress variation under serviceloading condition is also plotted. The von Misesstress carries the sign of the principal stress thathas the maximum absolute value. Clearly, not oneinstant of time can be identified as the time atwhich all the points on the connecting rod experi-ence the maximum state of stress. However, thestress-time histories indicate that all the criticallocations identified in Fig. 5 undergo maximum ten-sile stress at the crank angle of 3608, except locations2 and 9 where the maximum stress occurs at thecrank angle of 3488. The transitions to the crankand pin ends are the critical regions with high tensilestresses. In the shank region, the compressive stressis higher in magnitude than the tensile stress. There-fore, adequate buckling strength is also required.
To design against fatigue failure, some investi-gators have used the overall operating load range ofthe connecting rod (i.e. load range comprised themaximum static tensile and compressive loads),whereas others have used the load range at the maxi-mum power output. This is illustrated with referenceto location 8 and Fig. 6. At this location, the overalloperating stress range obtained using the overallload range is 244 MPa (i.e. from 2160 MPa due tothe maximum gas pressure to 84 MPa from Fig. 6).However, the stress range at the maximum speedfor this location is 157 MPa (i.e. from 273 to84 MPa in Fig. 6), representing a 36 per cent decrease(when compared with 244 MPa) in the stress range.A 36 per cent change in the stress range or amplitudecan result in more than an order of magnitudechange in the fatigue life. Therefore, using the overalloperating load range can lead to an overly conserva-tive design of the component.
The tensile load increases as the engine speedincreases as evident from Fig. 8, which shows a plot
Fig. 5 Locations on the connecting rod where the stress variation was traced over one
complete cycle of the engine
620 P S Shenoy and A Fatemi
Proc. IMechE Vol. 220 Part C: J. Mechanical Engineering Science JMES105 # IMechE 2006

of stress variation at location 8 with engine speed.The tensile stress increases as the speed increases,as an increase of the inertia load due to the pistonmass results in increasing the tensile load on theconnecting rod. Note that the tensile load consistsof both structural load and acceleration load dueto inertia. An important observation from Fig. 8 isthat even though maximum and mean stressesincrease with increasing engine speed, the stressrange (or amplitude, as amplitude is half the range)is independent of speed, as it remains constant.The stress range or amplitude is the primary stresscontrolling fatigue design of the connecting rod,whereas mean stress has a secondary influence.Connecting rods in the engine are usually testedwith a load sequence typically consisting of differentengine speeds [10].
An aspect of dynamic loading is the bending stressit produces and its significance. As noted earlier,the locations specified in Fig. 5 are symmetricwith respect to the centerline of the component.
A difference between stresses at the symmetriclocations in the stress-time history plots (Figs 6 and7) indicates the presence of bending stress, the mag-nitude of which is equal to half the difference. Forexample, the maximum bending stress is 26 percent of the maximum stress at the section throughlocation 8, and 22 per cent of the maximum stressat the section through location 1 (Fig. 6). The shiftin the peak stress between points 8 and 9 in Fig. 6is because of the bending stress. This suggests thatthe bending stiffness in the shank needs to be ade-quate to sustain these bending stresses. Bendingstiffness as an important design factor has alsobeen suggested in reference [4].
Another important observation that can be madefrom the stress-time histories in Figs 6 and 7 isthat, however, the state of stress is predominantlyuniaxial for some locations, it is multiaxial at otherlocations such as 6, 7, 10, and 11. Figure 7 indicatesthat at locations 10 and 11 the stress component sy
is as high as 30 per cent of the stress component sx
Fig. 6 Stress variation over the engine cycle in the shank region (locations 1, 2, 8, and 9) at
5700 r/min. XX is the sx component of stress
Dynamic analysis of loads and stresses in connecting rods 621
JMES105 # IMechE 2006 Proc. IMechE Vol. 220 Part C: J. Mechanical Engineering Science

at the crank angle of 3608, which is significant. Thestress multiaxiality is proportional (or in-phase),and results from stress concentrations such as inlocations 10 and 11. Equivalent stress approachbased on von Mises criterion is commonly used formultiaxial proportional stresses to compute equival-ent stress amplitude, sqa.
For multiaxial mean stresses, it has been observedthat mean shear stress does not affect cyclic bendingor cyclic torsion fatigue behaviours, whereas meanhydrostatic stress influences fatigue life [11, 12]. Asa result, using the following equation, which is insen-sitive to the mean shear stress, but accounts formean hydrostatic stress can be used to compute anequivalent mean stress, sqm, based on individualmean stress components smx, smy, and smz
sqm ¼ smx þ smy þ smz (1)
This equation also captures the beneficial effect ofthe compressive residual stresses produced throughthe common practice of surface peening of connect-ing rods, as residual stresses can be treated as meanstresses in fatigue analysis.
The stress ratio (minimum to maximum stressratio), and therefore mean stress, varies not onlywith location in the connecting rod, but also withengine speed at a location. For example, for location8 shown in Fig. 8, the stress ratio changes from 219at 2000 r/min to 21 at 5700 r/min. The combinationof tensile mean stress and stress amplitude resultsin higher fatigue damage at locations 2, 4, and 9,as compared with the corresponding symmetriclocations 1, 3, and 8, respectively. To account forthe mean stress, completely reversed von Misesequivalent stress amplitude, Sf, can be computedbased on the commonly used modified Goodmanequation
sqa
Sfþsqm
Su¼ 1 (2)
where Su is the ultimate tensile strength of thematerial [12].
5 COMPARISON OF QUASI-DYNAMICAND STATIC ANALYSES
Most investigators have used static axial loads for thedesign, analysis, and testing of connecting rods. Inthis study, FEA was also carried out under axialstatic load to compare the results with the morerealistic quasi-dynamic analysis results discussed insection 4. Quasi-dynamic FEA results differ fromthe static FEA results because of the time-varyinginertia load of the connecting rod, which is respon-sible for inducing bending stresses and varyingaxial load along the length, as discussed earlier.
Fig. 7 Stress variation over the engine cycle at the
transitions to the pin end (locations 3 and 4)
and to the crank end (locations 10 and 11) at
5700 r/min. XX is the sx component of stress,
YY is the sy component of stress, XY is the
txy component of stress, and XZ is the txzcomponent of stress
Fig. 8 Minimum stress, maximum stress, mean stress,
and stress range at location 8 on the connecting
rod as a function of engine speed
622 P S Shenoy and A Fatemi
Proc. IMechE Vol. 220 Part C: J. Mechanical Engineering Science JMES105 # IMechE 2006

The static FEA model is shown in Fig. 9. Note that,under tensile static load,half of thepistonpin inner sur-face (1808) is completely restrained. Similarly,when theconnecting rod is under axial compressive load, 1208 ofcontact surface area is totally restrained. The stressrange used for fatigue design based on a static analysisis obtained from the difference between themaximumstress corresponding to the maximum static tensileload, and the minimum stress corresponding to themaximum static compressive load.
Figure 10 compares the equivalent von Misesstress amplitudes (i.e. Sf from equation 2) for thedifferent locations identified in Fig. 6 obtained fromstatic as well as quasi-dynamic analyses. As can beseen from this figure, the stress amplitude based onthe static analysis is higher at all locations. The differ-ence is about a factor of two at some locations,including typical failure locations at 3 and 4. Such adifference in stress amplitude results in orders ofmagnitude difference in fatigue lives. Therefore,static analysis of a connecting rod can yield unrealis-tic stresses, whereas quasi-dynamic analysis pro-vides more accurate results better suited for fatiguedesign and/or optimization of this high volume pro-duction component.
6 CONCLUSIONS
The following conclusions can be drawn from thisstudy.
1. Static analysis of a connecting rod that is typicallyperformed can yield unrealistic stresses, whereasquasi-dynamic analysis provides more accurateresults better suited for fatigue design and optim-ization analysis of this high volume productioncomponent.
2. Using the overall operating load range of the con-necting rod which comprises the maximum statictensile and compressive loads, rather than theload range at the maximum power output, can
lead to an overly conservative design of thecomponent.
3. Maximumandmean stresses increase with increas-ing engine speed because of the increase in the iner-tia load. The stress range (or amplitude), however, isindependent of the engine speed.
4. The load ratio or the mean load varies over thelength of the connecting rod. The stress ratioand therefore mean stress, also varies withlocation in the connecting rod, as well as withengine speed at a location.
5. The bending stress produced as a result ofdynamic loading is significant and bending stiff-ness in the shank should be considered as animportant design factor.
6. In spite of the fact that typical testing and analysisof connecting rod is conducted under uniaxialstress state, the state of stress is multiaxial at criti-cal locations and mainly results from stress con-centrations. The use of an equivalentstress approach is necessary to account for thestress multiaxiality.
ACKNOWLEDGEMENTS
The American Iron and Steel Institute (AISI) isacknowledged for providing financial support forthis study. Dr M. Pourazady of the University ofToledo helped with the quasi-dynamic FEA in thiswork and his help is appreciated.
REFERENCES
1 Balasubramaniam, B., Svoboda, M., and Bauer, W.Structural optimization of I.C. engines subjected tomechanical and thermal loads. Comput. Meth. Appl.Mech. Engrg, 1991, 89, 337–360.
Fig. 9 FEA model of the connecting rod with static
tensile load at the crank end with cosine
distribution over 1808 and piston pin end fully
restrained over 1808Fig. 10 Comparison of equivalent von Mises stress
amplitudes under static and quasi-dynamic
loading conditions
Dynamic analysis of loads and stresses in connecting rods 623
JMES105 # IMechE 2006 Proc. IMechE Vol. 220 Part C: J. Mechanical Engineering Science

2 Webster, W.D., Coffell, R., and Alfaro, D. A threedimensional finite element analysis of a high speeddiesel engine connecting rod. SAE Technical Paper831322, 1983.
3 Ishida, S., Hori, Y., Kinoshita, T., and Iwamoto, T.Development of technique to measure stress on connect-ing rod during firing operation. SAE Technical Paper951797, 1995, pp. 1851–1856.
4 Rice, R. C. (Ed.) SAE Fatigue design handbook,3rd edition, 1997 (Society of Automotive Engineers,Warrendale, PA).
5 Athavale, S. and Sajanpawar, P. R. Studies on somemodelling aspects in the finite element analysis ofsmall gasoline engine components. Proceedings of thesmall engine technology conference, Society of Automo-tive Engineers of Japan, Tokyo, 1991, pp. 379–389.
6 Pai, C. L. The shape optimization of a connecting rodwith fatigue life constraint. Int. J. Mater. Prod. Technol.,1996, 11(5–6), 357–370.
7 Shenoy, P. S. and Fatemi, A. Connecting rod optimiz-ation for weight and cost reduction. SAE TechnicalPaper 2005-01-0987, 2005.
8 Afzal, A. and Fatemi, A. A comparative study of fatiguebehaviour and life predictions of forged steel and PMconnecting rods. SAE Technical Paper 2004-01-1529,2004.
9 Ferguson, C. R. Internal combustion engines, appliedthermo sciences, 1986 (John Wiley & Sons, Shrewsbury).
10 Sonsino, C. M. and Esper, F. J. Fatigue design forPM components, 1994 (European Powder MetallurgyAssociation (EPMA), New York).
11 Socie, D. F. andMarquis, G. B.Multiaxial fatigue, 2000(Society of Automotive Engineers, Warrendale, PA).
12 Stephens, R. I., Fatemi, A., Stephens, R. R., andFuchs, H. O. Metal fatigue in engineering, 2nd edition,2000 (John Wiley & Sons, New York).
APPENDIX
Notation
Sf completely reversed fatigue strengthSu ultimate tensile strength
smx, smy mean stress componentssqa equivalent (von Mises) alternating
stresssqm equivalent mean stresssx, sy stress components
624 P S Shenoy and A Fatemi
Proc. IMechE Vol. 220 Part C: J. Mechanical Engineering Science JMES105 # IMechE 2006