dynamic measurements for determining poisson’s ratio of
TRANSCRIPT

Nordic Concrete Research – Publ. No. NCR 58 – ISSUE 1 / 2018 – Article 6, pp. 95-106
95
DOI: 10.2478/ncr-2018-0006 ISSN online 2545-2819
ISSN print 0800-6377
© Article authors. This is an open access article distributed under the Creative Commons Attribution-NonCommercial-NoDerivs licens. (http://creaticecommons.org/licenses/by.nc-nd/3.0/).
Received: March 15, 2018
Revision received: May 11, 2018
Accepted: May 11, 2018
Dynamic Measurements for Determining Poisson’s Ratio of Young Concrete
Lamis Ahmed Ph.D., Assistant Professor KTH Royal Institute of Technology Division of Concrete Structures SE-100 44 STOCKHOLM, Sweden e-mail: [email protected]
ABSTRACT Knowledge of the elastic properties of concrete at early age is often a pre-requisite for numerical calculations. This paper discusses the use of a laboratory technique for determining Poisson’s ratio at early concrete age. A non-destructive test set-up using the impact resonance method has been tested and evaluated. With the method, it has been possible to obtain results already at 7 hours of concrete age. Poisson's ratio is found to decrease sharply during the first 24 hours to reach a value of 0.08 and then increase to approximately 0.15 after seven days. Key words: Modelling, testing, Poisson’s ratio, young concrete 1. INTRODUCTION Young concrete is studied, with a special focus on the period from the first contact between cement and water and up to 12 hours of age, which often is regarded as the most critical period with respect to e.g. vibration damage [1]. In some structural applications, for example in tunnelling, mining, bridge deck maintenance, construction of hydropower and nuclear power facilities, there is a need to control the response of young concrete that can be subjected to different types of dynamic loads, for example from impact vibration. Due to difficulties in performing experiments on young concrete, for example early formwork removal problems, simulation models are needed as a complement. These models require insertion of material data for concrete, such as the development of compressive strength, tensile strength, modulus of
Nordic Concrete Research – Publ. No. NCR 58 – ISSUE 1 / 2018 – Article 6, pp. 95-106
96
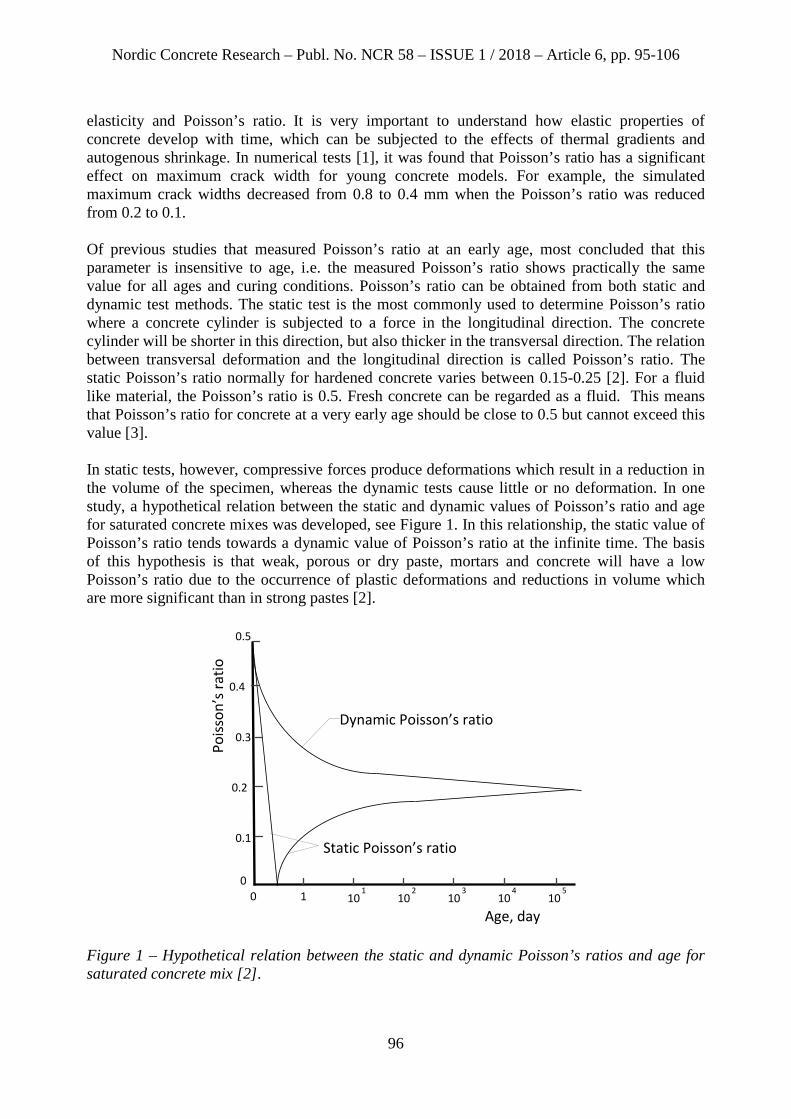
elasticity and Poisson’s ratio. It is very important to understand how elastic properties of concrete develop with time, which can be subjected to the effects of thermal gradients and autogenous shrinkage. In numerical tests [1], it was found that Poisson’s ratio has a significant effect on maximum crack width for young concrete models. For example, the simulated maximum crack widths decreased from 0.8 to 0.4 mm when the Poisson’s ratio was reduced from 0.2 to 0.1. Of previous studies that measured Poisson’s ratio at an early age, most concluded that this parameter is insensitive to age, i.e. the measured Poisson’s ratio shows practically the same value for all ages and curing conditions. Poisson’s ratio can be obtained from both static and dynamic test methods. The static test is the most commonly used to determine Poisson’s ratio where a concrete cylinder is subjected to a force in the longitudinal direction. The concrete cylinder will be shorter in this direction, but also thicker in the transversal direction. The relation between transversal deformation and the longitudinal direction is called Poisson’s ratio. The static Poisson’s ratio normally for hardened concrete varies between 0.15-0.25 [2]. For a fluid like material, the Poisson’s ratio is 0.5. Fresh concrete can be regarded as a fluid. This means that Poisson’s ratio for concrete at a very early age should be close to 0.5 but cannot exceed this value [3]. In static tests, however, compressive forces produce deformations which result in a reduction in the volume of the specimen, whereas the dynamic tests cause little or no deformation. In one study, a hypothetical relation between the static and dynamic values of Poisson’s ratio and age for saturated concrete mixes was developed, see Figure 1. In this relationship, the static value of Poisson’s ratio tends towards a dynamic value of Poisson’s ratio at the infinite time. The basis of this hypothesis is that weak, porous or dry paste, mortars and concrete will have a low Poisson’s ratio due to the occurrence of plastic deformations and reductions in volume which are more significant than in strong pastes [2].
10 102
101
103
104
105
Age, day
Static Poisson’s ratio
Dynamic Poisson’s ratio
Poiss
on’s
ratio
0
0.1
0.2
0.3
0.4
0.5
Figure 1 – Hypothetical relation between the static and dynamic Poisson’s ratios and age for saturated concrete mix [2].

Nordic Concrete Research – Publ. No. NCR 58 – ISSUE 1 / 2018 – Article 6, pp. 95-106
97
However, two important studies [3] and [4], describe a significant decrease in Poisson’s ratio at very early ages. A static test was performed in [3] and showed decreasing trends for static Poisson’s ratio, from approximately 0.4 to 0.1 during the first 10-15 hours, at a compressive strength of about 1 MPa, Figure 2 (a). After this, Poisson’s ratio increases with strength growth. Poisson’s ratio was determined via the deformations obtained at a stress level of 1/3 of the compressive strength. The results of an investigation on high-performance concrete using the pulse velocity method [4] are showed a similar trend. It can be shown from this dynamic test that dynamic Poisson’s ratio is decreasing during a short period of about 9 to 18 hours, reaching a value of 0.14, then increasing to its final value after seven days, Figure 2 (b). Although some experimental results [5] show increasing values of Poisson’s ratio with age during the first 12 hours, for example up to about 25%, this is often considered as a close to constant value. To date, there is no information given in the Eurocode 2 [6] about how to specify Poisson’s ratio at early ages. It is thus likely that this parameter has a significant effect on numerical results for early age concrete [1]. Knowing Poisson’s ratio is required to simulate experimental behaviour by numerical analyses. Therefore, a small-scale laboratory test was performed to find a technique to measure Poisson’s ratio at early concrete age, which is here summarized. Moreover, the aim was to investigate the influence on the static and dynamic Poisson’s ratios according to the lines suggested in Figure 1.
(a)
w/c = 0.58, 20 C, OPC (Skövde)w/c = 1.00, 20 C, OPC (Skövde)w/c = 0.40, 20 C, OPC (Skövde)w/c = 0.58, 8 C, OPC (Skövde)w/c = 0.58, 20 C, OPC (Slite Std)w/c = 0.58, 20 C, OPC (St Vika Std)
OPC = Ordinary Portland Cement
Poiss
on’s
ratio
Compressive strength, MPa
(b)
Poiss
on’s
ratio
Age (hours)
w/c = 0.30w/c = 0.35w/c = 0.45
0.16
0.12
0.14
0.18
0.20
0.22
0.24
0.26
Figure 2 – Evolution of Poisson’s ratio at early age; (a) static test [3] and (b) dynamic test [4].

Nordic Concrete Research – Publ. No. NCR 58 – ISSUE 1 / 2018 – Article 6, pp. 95-106
98
2. EXPERIMENTAL WORK 2.1 Materials In this study, two concrete prisms of 160×100×800 mm3 were cast. The concrete composition is presented in Table 1, chosen on the basis of laboratory investigations performed in [7]. A series of 150 mm cubes was cast to determine the development of compressive strength which was possible from 10 hours. The equation, where t is concrete age in days, is derived from tested cubes, giving the relation between the age of concrete and compressive strength (fc) [7] as: Table 1 – Compositions and mechanical property of the concrete used in the tests.
Composition Content Cement (CEM I 42.5 N – SR 3 MH), kg/m3 495 Water, kg/m3 220 Aggregate 0-8 mm, kg/m3 1540 Silika U/D, kg/m3 20 Glenium, kg/m3 4 Compressive strength, cube test MPa 84
𝑓𝑓𝑐𝑐(𝑑𝑑) = 106.9 𝑒𝑒−1.79/𝑡𝑡0.51 for 0 ≤ t ≤ 112 days (1) Eurocode 2 [6] provides an empirical equation to estimate the relative compressive strength of concrete at various ages as follows:
𝑓𝑓cm(𝑑𝑑) = 𝛽𝛽𝑐𝑐𝑐𝑐(𝑑𝑑). 𝑓𝑓𝑐𝑐𝑚𝑚 (2)
𝛽𝛽𝑐𝑐𝑐𝑐(𝑑𝑑) = 𝑒𝑒𝑠𝑠 ∙[1− 28𝑡𝑡 ]0.5
(3) where: 𝑓𝑓cm (t) mean compressive strength of concrete at age t, MPa 𝑓𝑓cm mean compressive strength of concrete at age 28 days and equals to 0.8 of cube
strength, MPa 𝛽𝛽cc(𝑑𝑑) function to describe the development of compressive strength with time s coefficient which depends on the type of cement and is here assumed to be 0.2 for
fcm greater than 60 MPa [6]. 2.2 Determination of resonant frequencies The focus of this pilot test was to evaluate some dynamic properties of concrete using impact resonance method [8] where a supported specimen is struck with a small impactor and the specimen response is measured by three accelerometers on the specimen p1, p2 and p3. The output of the accelerometer is recorded. Three accelerometers were positioned onto the specimen, as shown in Figure 3, enabling recording of particle accelerations as the three fundamental longitudinal, torsional and transverse resonant frequencies of the concrete, respectively. The fundamental frequencies for the three different modes of vibration are obtained by proper location of the impact point and the accelerometers. The recording time was

Nordic Concrete Research – Publ. No. NCR 58 – ISSUE 1 / 2018 – Article 6, pp. 95-106
99
approximately 0.035 s with a sampling frequency of 9600 Hz, the highest possible. According to [9], the recorded signals of impact must be low-pass filtered before the data are sampled. In order to prevent out-of-band signals from being improperly interpreted within the analysis range, a phenomenon known as 'aliasing', the transducer signals were filtered using a low-pass (Bessel) filter with a cut-off frequency 2400 Hz, of available in the data acquisition system. Frequency spectra were obtained using the fast Fourier transform (FFT) routines of the Matlab numeric software [10]. Using the FFT introduces limitations in the resolution of the spectrum so that it is only possible to obtain information on frequencies up to the Nyquist sampling frequency [9], i.e. here 4800 Hz. It should be noted that the number of longitudinal resonance frequencies measured up to this frequency depends on the material and the boundary condition. For example, the acceleration–frequency spectra for the three points are plotted in Figure 4. The obtained longitudinal and torsional frequencies are given in Table 2.
Figure 3 – The suspended prism and the position of the accelerometers according to the testing standard [7].
Accelerometers
p1
p3
p2

Nordic Concrete Research – Publ. No. NCR 58 – ISSUE 1 / 2018 – Article 6, pp. 95-106
100
Table 2 – Measured frequencies and calculated longitudinal and torsional modulus of elasticity and Poisson’s ratios Curing
age (hours)
Longitudinal frequency
(Hz)
Torsional frequency
(Hz)
Longitudinal modulus of elasticity
(GPa)
Torsional modulus of elasticity
(GPa)
Estimated Poisson's
ratio 7.0 (526) (271) 1.59 0.61 0.294 7.5 951 277 5.25 2.11 0.242 8.0 (693) (374) 2.75 1.17 0.179 8.5 (749) (412) 3.22 1.42 0.135 9.0 (880) (447) 3.89 1.72 0.131 9.5 (824) (454) 4.44 1.98 0.121 10.0 (941), 1369 (520), 773 5.08, 10.74 2.26, 4.99 0.103* 11.0 (1049), 1460 (590), 829 6.31, 12.22 2.91, 5.74 0.084* 12.0 1547 874 12.22 5.74 0.076 14.0 1730 975 13.72 6.38 0.081 15.0 1787 1003 17.16 7.93 0.090 18.0 1927 1076 18.30 8.40 0.101 24.0 2041 1140 21.28 9.66 0.101 30.0 2110 1175 23.88 10.85 0.107 72.0 2295 1255 25.52 11.52 0.148 144.0 2375 1300 30.19 13.14 0.148 168.0 2385 1304 30.19 13.14 0.146
- The values within parentheses refer to prism No. 2., - * average value of two prisms

Nordic Concrete Research – Publ. No. NCR 58 – ISSUE 1 / 2018 – Article 6, pp. 95-106
101
(a)
(b)
(c)
Figure 4 – Example of the acceleration–frequency spectra of (a) longitudinal (b) torsional and (c) transverse vibrations of 12 hr concrete curing age.

Nordic Concrete Research – Publ. No. NCR 58 – ISSUE 1 / 2018 – Article 6, pp. 95-106
102
2.3 Determination of dynamic moduli of elasticity To estimate the dynamic modulus of elasticity of concrete, a resonance frequency tests according to ASTM C215-14 [8] was used. The dynamic modulus of elasticity is generally greater than the static modulus. The difference between dynamic and static moduli might be based on the fact that the nonhomogeneous characteristics of concrete affect the two moduli in different ways [11]. The Eurocode 2 [6] provides an empirical equation to estimate the static modulus of elasticity at the early concrete age as follows:
𝐸𝐸ci(𝑑𝑑) = 𝛽𝛽E(𝑑𝑑). 𝐸𝐸ci (4)
𝛽𝛽E = [𝛽𝛽cc(𝑑𝑑)]0.5 (5) 𝐸𝐸ci = 𝐸𝐸c0 ∙ 𝛼𝛼E(𝑓𝑓m
10 )1/3 (6)
where: 𝐸𝐸ci (t) tangent modulus of elasticity of concrete at age t Eci tangent modulus of elasticity of concrete at age of 28 days, MPa 𝐸𝐸c0 ∙ 𝛼𝛼E equal to 20.5 GPa, where a quartzitic aggregate type is assumed. 𝛽𝛽E function to describe the development of modulus of elasticity with time 𝛽𝛽cc(𝑑𝑑) coefficient according to Eq. 3 From the longitudinal frequency in Table 2, the dynamic modulus of elasticity (𝐸𝐸dy) was calculated according to [7] as follows:
𝐸𝐸dy = 𝐷𝐷𝐶𝐶 𝑓𝑓L
2 (7) where: m mass of specimen, kg D 4 (L/bd), m-1 for a prism, L is the length, b is the width and d is the depth 𝑓𝑓L fundamental longitudinal frequency, Hz The longitudinal resonant frequency is measured for each specimen immediately after removal from the frame at the specified age. The density of the concrete is assumed as 2265 kg/m3, equal to the concrete type used in Table 1 [7]. The calculated longitudinal moduli of elasticity are presented in Table 2. 2.4 Determination of Poisson’s ratio of young concrete To calculate the dynamic Poisson’s ratio (μ) the ratio of lateral to longitudinal strain for an isotropic solid was used, as follows [8]:
𝜇𝜇 = � 𝐸𝐸2𝐺𝐺
� − 1 (8) where: E modulus of elasticity G modulus of rigidity

Nordic Concrete Research – Publ. No. NCR 58 – ISSUE 1 / 2018 – Article 6, pp. 95-106
103
In this study, the longitudinal modulus of elasticity, presented in Table 2 is calculated according to Eq. (7). Based on the fundamental torsional frequency, the modulus of rigidity was calculated as follows [8]:
𝐺𝐺 = 𝐵𝐵𝐶𝐶 𝑓𝑓To2 (9)
where: 𝑓𝑓To fundamental torsional frequency, Hz, B (a/b + b/a)/[4a/b – 2.52(a/b)2 + 0.21(a/b)6] for a rectangular prism whose cross-
sectional dimensions are a and b, m, with a less than b. The torsional moduli of elasticity and Poisson’s ratio are calculated and presented in Table 2. 3. RESULTS AND DISCUSSIONS The growth of the Poisson’s ratio during the seven days is shown in Figure 5 (a). This demonstrates the evolution of Poisson’s ratio as a function of time for two test prisms. It can be seen that during the first 12 hours, a significant decrease of Poisson’s ratio occurs, which after that stabilises. By using Eq. (1), a corresponding curve for the relationship between compressive strength and Poisson’s ratio can also be presented in Figure 5 (b).
(a)
(b)
Figure 5 – Poisson’s ratio versus (a) curing age and (b) compressive strength.

Nordic Concrete Research – Publ. No. NCR 58 – ISSUE 1 / 2018 – Article 6, pp. 95-106
104
The growth of the compressive strength by applying different formulas, i.e. Eq. (1) and (2) according to [7] and Eurocode 2 [6] respectively, is shown in Figure 6. This figure shows that the Eurocode 2 equation (Eq. 2) worked well to predict the development of the compressive strength of the experimental values obtained from [7]. It should be noted that Eq. (1) has been derived from test data of concrete cubes that were conditioned in +20°C and 100% humidity (in water) before testing.
Figure 6 – Development of the compressive strength with time.
The growth of the dynamic modulus of elasticity based on the longitudinal resonant frequency and during the first 7 days is shown in Figure 7, together with the corresponding curve for the static modulus of elasticity by using Eq. (4). As expected, 𝐸𝐸𝑑𝑑𝑑𝑑 is always greater than 𝐸𝐸𝑐𝑐𝑖𝑖. The difference between the two moduli decreases as concrete strength develops with time. The dynamic elastic modulus is generally 60, 33, and 14 % higher than the static elastic modulus for 1, 3 and 7 days curing age, respectively.
Figure7 – Development of the static and dynamic moduli of elasticity with time.
Nordic Concrete Research – Publ. No. NCR 58 – ISSUE 1 / 2018 – Article 6, pp. 95-106
105
4. CONCLUSION The purpose of this study was to test and evaluate an experimental technique for estimation of the development of Poisson’s ratio and to obtain a better understanding of the test used to compute the dynamic Poisson’s ratio. From the results, it can be observed that the Poisson’s ratio to a great extent depends on concrete age during the first few hours after casting, see Figure 5 (a). The measurement results showed similar decreasing trends as previously suggested for other concrete types and methods in [3,4]. It can be observed that the possible relationship of dynamic Poisson’s ratio with age in Figure 1 is not valid and the static and dynamic Poisson’s ratios in concrete have similar decreasing trends. This behaviour may be caused by the composite nature of concrete rather than the used test method. Both static and dynamic moduli of elasticity were calculated. As expected the values of dynamic modulus of elasticity is higher than static modulus for this concrete mix, in which dynamic modulus might trend towards static at the hardened concrete stage. The used impact resonance method, in this study, was sensitive to the specimen dimensions and density of the concrete. This study can be used as a means for a more comprehensive programme research to investigate the characteristic of the mix on the Poisson’s ratio. Not only would it provide a better understanding of internal mechanisms, but also to establish consistent and accurate formulas to compute Poisson’s ratio that has an important role in the model analysis. REFERENCES 1. Ahmed L, Ansell A & Malm R: “Numerical Modelling and Evaluation of Laboratory
Tests with Impact Loaded Young Concrete Prisms,” Materials and Structures, Vol. 49, No. 11, November 2016, pp. 4691-4704.
2. Anson M & Newman K: “The Effect of Mix Proportions and Method of Testing on Poisson’s Ratio for Mortars and Concretes,” Magazine of Concrete Research, Vol. 18, No. 56, September 1966, pp. 115-130.
3. Byfors J: “Plain Concrete at Early Ages,” Research Fo 3:80, Swedish Cement and Concrete Institute, Stockholm, 1980, 464 p.
4. Mesbah H A, Lachemi M & Aitcin P-C: “Determination of Elastic Properties of High-Performance Concrete at Early Ages,” ACI Material Journal, Vol. 99, No.1, January 2002, pp. 37-41.
5. Oluokun F A, Burdette E G & Deatherage J H: “Elastic Modulus, Poisson's Ratio and Compressive Strength Relationship at Early Ages,” ACI Journal, Vol. 88, No.1, January 1991, pp. 3-10.
6. EN 1992-1-1: “Eurocode 2: Design of Concrete Structures,” Part 1-1 “General Rules and Rules for Buildings,” European Committee for Standardisation (CEN), Brussels, 2004, 236 p.
7. Bryne L E: “Time Dependent Material Properties of Shotcrete,” Bulletin No. 124, Dept. of Civil and Architectural Engineering, KTH Royal Institute of Technology, Stockholm, Sweden, 2014, 79 p.
8. ASTM C215 − 14: “Standard Test Method for Fundamental Transverse, Longitudinal, and Torsional Frequencies of Concrete Specimens,” ASTM International; West Conshohocken, Pa, USA, December 2014, 7 p.

Nordic Concrete Research – Publ. No. NCR 58 – ISSUE 1 / 2018 – Article 6, pp. 95-106
106
9. Hewlett-Packard: “The Fundamentals of Signal Analysis,” Application Note 243, Agilent Technologies, USA, 2000, 86 p
10. Mathworks Matlab. See http://www.mathworks.com/products/matlab/ for further details. Accessed 14/03/2018.
11. Philleo R E: “Comparison of Results of three Methods for Determining Young's Modulus of Elasticity of Concrete,” ACI Journal, Vol. 26, No. 5, January 1955, pp. 461–469.