dynamic team deployment in urban search and rescue · and rescue advisory group (insarag) and...
TRANSCRIPT

Dynamic Team Deployment in Urban Search and Rescue
Morgan State University The Pennsylvania State University
University of Maryland University of Virginia
Virginia Polytechnic Institute & State University West Virginia University
The Pennsylvania State University The Thomas D. Larson Pennsylvania Transportation Institute
Transportation Research Building University Park, PA 16802-4710 Phone: 814-865-1891 Fax: 814-863-3707
www.mautc.psu.edu

1. Report No.
2. Government Accession No. 3. Recipient’s Catalog No.
4. Title and Subtitle Dynamic Team Deployment in Urban Search and Rescue
5. Report Date June 16, 2014
6. Performing Organization Code
7. Author(s) E. Miller-Hooks, M. TariVerdi, M. Adan
8. Performing Organization Report No.
9. Performing Organization Name and Address University of Maryland
10. Work Unit No. (TRAIS)
11. Contract or Grant No. DTRT12-G-UTC03
12. Sponsoring Agency Name and Address US Department of Transportation Research & Innovative Technology Admin UTC Program, RDT-30 1200 New Jersey Ave., SE Washington, DC 20590
13. Type of Report and Period Covered Final
14. Sponsoring Agency Code
15. Supplementary Notes
16. Abstract
Continuing population growth and increased urbanization within disaster-prone areas have led to greater numbers of mass casualties and economic losses caused by natural hazards. The identification of an effective policy for managing limited emergency response resources in this environment, where every moment is crucial, will enable quick, life-saving decision-making. This work conceptualizes this real-time urban search and rescue team deployment problem as an M/G/c priority and preemptive spatially distributed queueing system with roving servers. Prioritization schemes that require minimal, on-site, real-time computation for operating the system are proposed and compared through numerical experiments conducted on disaster instances based on events from the 2010 Haitian earthquake.
17. Key Words Emergency response, Disaster management, Spatial queueing systems, Optimal policy
18. Distribution Statement No restrictions. This document is available from the National Technical Information Service, Springfield, VA 22161
19. Security Classif. (of this report)
Unclassified
20. Security Classif. (of this page)
Unclassified
21. No. of Pages
22. Price
i

Disclaimer
This research effort was funded by the United States Department of Transportation through the
Mid-Atlantic University Transportation Center (MAUTC). The second author was partially
supported by the I-95 Corridor Coalition Fellowship.
The contents of this report reflect the views of the authors, who are responsible for the facts and
the accuracy of the information presented herein. This document is disseminated under the
sponsorship of the U.S. Department of Transportation’s University Transportation Centers
Program, in the interest of information exchange. The U.S. Government assumes no liability for
the contents or use thereof.
ii

Dynamic Team Deployment in Urban Search and Rescue
Principal Investigator: Elise Miller-Hooks
Graduate Research Associates: Mersedeh TariVerdi
Foreign Collaborator: Matti Adan, Ariel University
iii

Executive Summary
Continuing population growth and increased urbanization within disaster-prone areas have led to
greater numbers of mass casualties and economic losses caused by natural hazards. The
identification of an effective policy for managing limited emergency response resources in this
environment, where every moment is crucial, will enable quick, life-saving decision-making.
This work conceptualizes this real-time urban search and rescue team deployment problem as an
M/G/c priority and preemptive spatially distributed queueing system with roving servers.
Prioritization schemes that require minimal, on-site, real-time computation for operating the
system are proposed and compared through numerical experiments conducted on disaster
instances based on events from the 2010 Haitian earthquake.
Of the 16 considered policies, seven policies were found to be promising under two
selected performance measures. Two of these policies were particularly notable. The first of
these prioritizes based on the lowest service time and highest number of live entrapped victims
adjusted for losses while waiting for the USAR teams to arrive. The second ranks the worksites
based on shorter service time and higher rate of change in survival likelihood, measures that
together are representative of life expectancy.
iv

Table of Content
Executive Summary ....................................................................................................................... iv
List of Figures ................................................................................................................................ vi
List of Tables ................................................................................................................................ vii
1. Introduction ................................................................................................................................. 1
2. Prior Literature on Optimal Team Deployment in Post-Disaster Situations .............................. 4
3. Queueing System and Simulation Platform ................................................................................ 6
3.1 Conceptualization as a Queueing System ........................................................................ 6
3.2 Performance measures...................................................................................................... 9
3.3 Discrete-Event Simulation Framework .......................................................................... 10
4. Proposed Deployment Policies ................................................................................................. 14
5. Experimental Setting ................................................................................................................. 20
5.1 Problem instance setting................................................................................................. 20
6. Experimental Design, Results and Analysis ............................................................................. 25
6.1 Comparison of Policies .................................................................................................. 25
6.2 Policy Performance Compared with Decision Approach .............................................. 31
6.3 Sensitivity Analysis ........................................................................................................ 33
6.4 Further Investigation of Policy FALS ............................................................................ 37
7. Conclusions and Extensions ..................................................................................................... 38
8. References ................................................................................................................................. 41
v

List of Figures
Figure 1 Flowchart of Service Request Routine ........................................................................... 12
Figure 2 Flowchart of Arrival Routine (left) and Server assignment (right) ................................ 13
Figure 3 Identified Worksites in Port-au-Prince, Haiti, Overlaid on Google Map ....................... 21
Figure 4 CDF of Total Number of Survivors................................................................................ 28
Figure 5 CDF Time-Averaged Number of Worksites Waiting in the Queue ............................... 31
Figure 6 Sensitivity Analysis of Policy Performance ................................................................... 34
Figure 7 Sensitivity to Reduction in Survival Likelihood Rates .................................................. 36
Figure 8 Sensitivity to Travel Times ............................................................................................ 36
vi
List of Tables
Table 1 Proposed USAR Team Deployment Policies ................................................................. 15
Table 2 FEMA Prioritization Guideline ....................................................................................... 16
Table 3 Parameters of Entrapped Victim Generation ................................................................... 22
Table 4 kCP (I) for a Building of Type MMSK-86 under Different Damage States ..................... 23
Table 5 D&D Ranking Results for Total Number of Survivals .................................................... 26
Table 6 Relative Probability of Policies kp Performing the Best ............................................... 28
Table 7 D&D Ranking Results for Time-average Number of Worksites Waiting in Queue ....... 29
Table 8 Policy Comparison to a Posteriori Solution .................................................................... 33
vii
1 . Introduction
Continuing population growth and increased urbanization within disaster-prone areas have led to
greater numbers of mass casualties and economic losses caused by natural weather and
geophysical events (Center for Research on the Epidemiology of Disasters, 2011). In such
events, immediate response is required to reduce the number of casualties; hence, every moment
in these post-disaster circumstances is crucial. However, local response capabilities are often not
sufficient, and national and international resources are required to serve the acute demand for
response and rescue. In this situation, even large numbers of responders cannot guarantee a
successful rescue mission in the absence of appropriate management of critical limited resources.
For instance, in response to the 2003 Bam earthquake in Iran, in addition to the local responders,
more than 44 international organizations sent rescue teams to the disaster region. Due to lack of
coordination, however, the number of fatalities may have been unnecessarily high. Casualties
were estimated at more than 35,000 people (Ramezankhani and Najafiyazdi, 2008). High levels
of casualties and damage were incurred more recently in, for example, the 2010 Haitian
earthquake also due to difficulties with mobilizing available resources. These difficulties arose
from inoperable infrastructure and communications means, which negatively impacted response
and relief operations (Margesson and Taft-Morales, 2010).
Early in the response stage, experts must make decisions based on insufficient data, since
evaluation of the disaster impacted area takes time. However, such information, particularly as it
relates to the conditions of the civil and healthcare infrastructures, is essential to efficient
decision-making during this stage. Important considerations include: condition of roadways and
remaining capacities of healthcare facilities, number and location of possible victims and their
1

medical conditions, and structural damage to buildings with probable live entrapped victims, i.e.
the worksites.
Countries around the world have developed emergency response protocols to prioritize
rescue actions and accelerate decision processes. Decisions must be made in real-time with
available information, and for expedient response, Urban Search and Rescue (USAR/US&R)
teams must be immediately informed of their tasks. The United Nation’s International Search
and Rescue Advisory Group (INSARAG) and Federal Emergency Management Agency (FEMA)
have put in place prioritization-based methodologies for quick evaluation of the disaster area and
rapid deployment of resources (USAR teams and equipment) to worksites. These methods rely
on input from reconnaissance and initial structural triage.
To prioritize response to the worksites, scoring methods that evaluate such factors as
building materials, condition of voids (influenced by structural design and collapse pattern),
usage type and special occupancy information, potentially trapped building inhabitants, known
live victims, and accessibility to victims are used in FEMA’s approach. See Section 4 for
additional details. Their protocol uses a simplified scoring method for prioritization, allowing
quick, manual computation (National US&R Response System Field Operations Guide, 2003).
This method, however, does not account for all of the factors, e.g., travel time between worksites
that affect response. INSARAG’s method uses similar input to assign priorities to the worksites,
but instead of quantifying the inputs, existence or nonexistences of specific circumstances are
used to attribute priority levels. By exploiting the capabilities of widely available computer
technologies and new information sources (including evolving information on building
conditions and probable survivors), important problem complexities and additional key
2

characteristics not considered in the FEMA and INSARAG methods can be captured in the
decision-making process.
This work conceptualizes the USAR team deployment problem as an M/G/c (M =
Poisson arrivals, G = generally distributed service times, c = number of servers) priority and
preemptive spatially distributed queueing system with roving servers. This interpretation of the
problem helps to examine and suggest modifications to existing INSARAG and FEMA
prioritization schemes to take advantage of these new information sources. Moreover, developed
prioritization schemes also address issues of dependence among contributing factors,
assumptions of additivity, issues of subjectivity, scaling inconsistencies, and assumptions of
constancy (specifically that the number of live entrapped victims present during the prioritization
will not change by the time the team travels to and accesses these potential survivors) present in
the existing schemes. Prioritization schemes for operating the queueing system are proposed and
tested. These policies can be used directly to enable quick decision-making in real-time USAR
operations.
A review of related studies to the USAR team deployment problem and discussion of key
problem aspects are provided in Section 2. Details of the modeling framework, system
performance measures and approximation methods for their quantification, and design of a
simulation platform for demonstrating and testing this framework are given in Section 3. In
Section 4, the FEMA prioritization scheme is explained and alternative policies are introduced.
The prioritization schemes or policies were tested and compared on disaster instances based on
events from the 2010 Haitian earthquake. These instances are described in Section 5. This is
followed by results from numerical experiments conducted in the simulation environment on the
Haitian instances in Section 6. Analysis and insights are also provided. Additional comparison to
3

optimal deployment decisions under perfect information is made. The number of live entrapped
victims extracted in an optimal response provides an upper bound for assessing the individual
proposed policies. Conclusions and extensions are given in Section 7.
2 . Prior Literature on Optimal Team Deployment in Post-Disaster Situations
The general topic of emergency management has been widely studied; however, few works have
focused on the deployment of rescue resources with the aim of maximizing the number of saved
lives post-disaster. The most relevant work is by Chen and Miller-Hooks (2012). Their work
addresses the USAR team deployment problem with the objective of maximizing the total
expected number of survivors (i.e. entrapped victims who are successfully extricated while still
alive). They proposed a Multistage Stochastic Program (MSP) to model and conceptualize the
USAR team deployment problem accounting for evolving information as situational awareness
improves. To solve the MSP, the problem is decomposed into a series of interrelated two-stage
stochastic programs that are solved exactly in a rolling horizon framework. The procedure
exploits real-time information as it is received over decision epochs. While pertinent to
conceptualizing the USAR team deployment problem under real-time information, their
approach is not suitable for real-time application due to excessive computational and memory
requirements. In fact, simply enumerating feasible scenarios needed for this approach is difficult
given that the number of scenario instantiations which may arise can be exceptionally large.
Thus, while this earlier work provides a framework from which to understand the team
deployment problem, it has limited utility in practical, field applications.
A second closely related study is by Fiedrich et al. (2000). Their work modeled the
problem of optimal post-disaster allocation of rescue resources as a type of dynamic resource
4

allocation problem. Their formulation seeks an optimal allocation of resources in response to
information on survivor locations with the goal of minimizing the number of casualties over a
time horizon. Casualties are incurred in three stages of the rescue operation: at the disaster site,
in the transfer time to the hospital, and at the hospital. The formulation does not account for the
possibility of receiving updated information on the disaster scene, nor does it consider many of
the other situation details. Two specialized heuristics for its solution were proposed.
There are several classes of optimization problems with relevance to the USAR team
deployment problem, including problems in: dynamic routing and scheduling, dynamic resource
allocation and team orienteering. Their relevance to the USAR team deployment problem is
discussed by Chen and Miller-Hooks (2012). They note that each of these problem classes differs
from the USAR team deployment problem in specific and important problem characteristics.
That is, each omits one or more of the following problem facets: decreasing survival likelihood
for entrapped victims; need to maximize the number of survivors; that service times or required
resources depend on the order in which service is provided; and that steady state cannot be
reached within the finite and limited decision time horizon of post-disaster rescue operations.
The focus of this work is to develop real-time solution policies for USAR team deployment
considering these features as well as uncertainty in future conditions and possible benefits from
updated information over a rolling time horizon. The proposed alternative method to conceiving
the USAR team deployment problem based on queueing provides a platform for both
conceptualizing and evaluating existing and proposed resource allocation strategies.
5
3 . Queueing System and Simulation Platform
3.1 Conceptualization as a Queueing System
The M/G/c priority and preemptive spatially distributed queueing system with roving servers
conceptualization of the USAR team deployment problem is presented in this section. In this
conceptualization, USAR teams are modeled as servers that move to the customers over the
disaster region. The order in which customers are served is determined by an operational policy.
Common policies used in queueing system modeling include, for example, first-in first-out
(FIFO) or last-in first-out (LIFO). The FEMA prioritization scheme offers an alternative policy
with specific application to USAR operations. In this context, worksites will enter the waiting
queue. They will be ranked based on the chosen policy and the teams will generally attend to
victims at those worksites with highest rankings first. The considered queueing system allows
preemption. Preemption permits redeployment in the event that new information arises indicating
that moving to an alternative site would be beneficial despite that work at the current site is
incomplete. In the current National US&R Response System Field Operations Guide (2003)
there are instructions for how to treat and mark preempted worksites and preemption decisions
are to be made by response planners. The system is considered over a time horizon during which
the system state (i.e. position of USAR teams and unserved worksite locations) changes. Survival
likelihood, arrival of new USAR teams, service time estimates, and estimates of travel time
between worksites may change stochastically depending on post-disaster relief activities and
investigations.
Alternative operational policies are devised in the next section. These policies can be
used in real-time to prioritize the worksites. To choose a best policy, the alternatives can be
compared through an evaluation of the queueing system operations under the devised operational
6

policy. Ideally, such an evaluation would be performed analytically. Such analytical assessment
is described next. The following nomenclature is employed in this description.
i, j
: Index of worksites k : Index of the USAR team deployment policies t
: Decision time wi
: Worksite i APk : Assignment Policy k of USAR teams Sit : Service time at worksite i estimated at time t (time to access victims once on
site) Βit : Drop in survival likelihood of live entrapped victims at worksite i at time t tti,j : Travel time between worksites i and j plus equipment set-up time once on
site ri : Initial estimate of number of live entrapped victims at worksite i ΔSLit, it+Δt : Change in survival likelihood of live entrapped victims at worksite i between
time t and t t+ ∆ Pfi : FEMA priority value for worksite i V(APk) : Value of Policy k by the end of the decision horizon Wqi
k : Waiting time of worksite i under Policy k Nwt : Number of worksites waiting in the queue at time t
Note that set-up time is the time that USAR teams need to place the heavy equipment
(e.g. cranes) safely at the site and decide on the best rescue path. Service time for each worksite
is defined as the time that USAR teams require to extricate the live entrapped victims from under
the debris. It includes the time to set-up needed equipment.
Typically, queueing systems are assessed in terms of average waiting time in queue,
average number of customers in the queue or in the system, total time required to serve a given
number of customers or number of customers that can be served in a given time period.
Analytical results, including steady-state exact formulae and approximations for these measures,
have been published previously for many types of queueing systems. See, for example,
(Kleinrock, 1976). The majority of results are for stationary customer-to-server queueing models,
where customers line up to be served. Results associated with queueing systems with roving 7

servers (server-to-customer systems) are given in (Larson and Odoni, 1981) and more recently in
(Boyaci et al., 2011). As these systems are complex, derived results are limited by a variety of
assumptions, including the existence of only a single server and very simple prioritization
schemes or multi-server models with no preemption and priority.
The mean waiting time and number of customers in the queue at steady-state conditions
are derived in (Larson and Odoni, 1981) for a non-preemptive server-to-customer spatial
queueing system with one server and FIFO ordering. This work further showed that the mean
number of customers and mean waiting time in the queue depend on the means and variances of
two service time distributions: service time of the busy period and all succeeding periods. If
these two service time distributions have identical mean and variance, the performance measures
of the queueing system in steady-state can be computed using equations that are very similar to
that of standard M/G/1 queueing systems using Pollaczek-Khintchine formulae.
For multi-server spatial queueing systems, Larson (1974) proposed the hypercube
queueing model. This model applies where travel times are insignificant in comparison to on-site
service times, and thus, service times are independent of location. He showed that travel times
can be included within this framework using a calibration strategy. Even with the assumption of
insignificant travel times, it is recognized that the number of states grows exponentially with
number of servers (e.g. Boyaci et al., 2011). Boyaci provides a review of performance measure
estimation methodologies associated with hypercube models devised for a variety of such multi-
server systems. However, it appears that there are no analytical results for multi-server, server-
to-customer spatial queueing systems with priorities and preemption.
While travel times may be negligible for many emergency response applications, in
circumstances involving large-scale regional disaster events, travel times between worksites may 8

be significant and the order in which trips between worksites are taken can affect system
performance. To incorporate travel times in queueing models, travel times can be included in
service times. However, this creates order-dependent service times, and no methodologies exist
for the computation of performance metrics in this context. This order dependence arises,
because service times at worksites depend not only on the time spent at each site, but the time
spent in transit from prior sites. This is further complicated by the arrival of worksites that were
not previously known.
3.2 Performance measures
In the context of USAR team deployment, a critical performance measure is the number of
survivors. In fact, survival likelihood is monotonically decreasing with varying rates depending
on the building material, collapse patterns, condition of voids, building usage and physical
condition of victims as discussed in Coburn et al. (1991). The time until worksites are served by
the teams (i.e. the waiting time in queue) depends on the sequence of visited worksites, service
times at previous worksites and travel time between worksites. Moreover, the sequence affects
the number of survivors. Thus, the number of survivors at the end of the decision horizon
depends on the team deployment strategy, that is, the prioritization method used in the queueing
model. kV(p ) , the sum of survivors from all the identified worksites at the end of the search
and rescue period T can be computed as in equation (1).
( ) (1 )k ki it qi
t T i NV P r Wβ
∈ ∈
= −∑∑ (1)
An additional performance measure of interest is the time-averaged number of worksites
waiting in the queue ( whN ). This is given in equation 2.
9

/wh wttN N T=∑ (2)
This measure is of particular importance where reliable information on live entrapped victims at
the known worksites is not present. Its value is also a function of prioritization schemes
employed in the queueing model.
While equations 1 and 2 provide structure for computing the number of live entrapped
victims or worksites served, derivation of equations for specific elements of these formulae, e.g.
kqiW , have been formidable. Thus, an alternative simulation-based technique is employed.
3.3 Discrete-Event Simulation Framework
A discrete-event simulation framework was developed using the Python programming language.
Simulation design is based on a queueing system conceptualization developed in this section.
In the simulation environment, a customer represents an identified worksite. The state of
the system at each point in time is described by the number of worksites for which service is not
yet completed and location and status of the USAR teams (idle, busy, in transit). Possible events
include: receiving an update on the characteristics of a worksite, identification of a new worksite,
arrival of a new USAR team to the disaster impacted area, and completion of service at a
worksite. Priority rankings are reexamined upon each event, and team deployment decisions are
updated allowing for preemption where found to be beneficial.
Simulation design is based on 3 routines: Service Request, Server Assignment, and
Arrival. Key to the simulation model are priority computation and replication of preemption
decisions. The Service Request routine schedules tasks given preemption decision rules and new
information on worksites. Preemption can require that a team leave a worksite before completing
10
service or be redeployed while in transit to a worksite to serve a worksite with higher priority.
Priorities are computed within the Server Assignment routine. The Arrival routine records arrival
times of servers at customers and updates the server status from “in transit” to “at location.”
Flowcharts of all three simulation routines are presented in Figures 1 and 2.
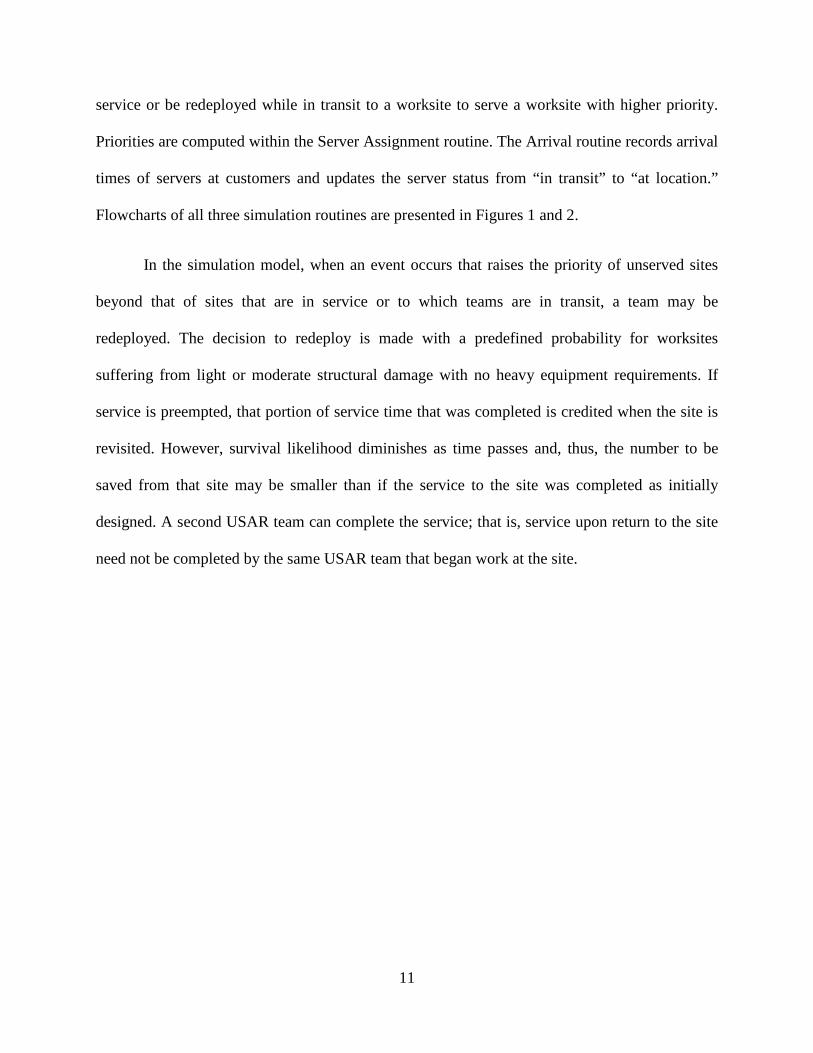
In the simulation model, when an event occurs that raises the priority of unserved sites
beyond that of sites that are in service or to which teams are in transit, a team may be
redeployed. The decision to redeploy is made with a predefined probability for worksites
suffering from light or moderate structural damage with no heavy equipment requirements. If
service is preempted, that portion of service time that was completed is credited when the site is
revisited. However, survival likelihood diminishes as time passes and, thus, the number to be
saved from that site may be smaller than if the service to the site was completed as initially
designed. A second USAR team can complete the service; that is, service upon return to the site
need not be completed by the same USAR team that began work at the site.
11

Figure 1 Flowchart of Service Request Routine
12

Figure 2 Flowchart of Arrival Routine (left) and Server assignment (right)
13

4 . Proposed Deployment Policies
Search and rescue missions begin with assessment of the disaster impacted area. Initial
investigations provide insight to USAR team managers to create an efficient response plan.
FEMA suggests two general search and rescue approaches (National US&R Response System
Field Operations Guide, 2003). The first option applies to small areas of impact wherein the area
is divided into sectors and a team is deployed to each sector. It is assumed that there is sufficient
response capabilities for the impacted region. For large affected regions, where response
capacities are exceeded and thus resources are inadequate, worksites requiring response are
prioritized.
Sixteen prioritization schemes are proposed here and described in Table 1. Each scheme
can serve equivalently as the operational policy employed within the spatial queueing system
model of Section 3. Thus, to assess and compare the performance of these policies, performance
of the queueing system under the different policies can be evaluated.
The policies consider a variety of characteristics. These characteristics include: worksite
detection times and locations, service times, travel times, diminishing survival likelihoods and
urgency for serving worksites due to changes in survival likelihood, or surrogates thereof.
Factors included in the policies were chosen based on their anticipated impact on prioritization
performance in terms of number of survivals. Single factor experiments were conducted to
determine if each considered factor would serve best in the numerator or denominator. For
example, ranking based on highest and lowest service times were tested. It was found that
assigning higher priorities to worksites with shorter service times significantly improves the total
number of survivals, and thus, service times were included in the denominator. A similar choice
was made with respect to travel times. Additionally, adjustments for loss are made in comparison
14

to the FEMA prioritization. With these guiding principles for policy creation in mind, more than
25 policies were created. Based on results from preliminary experiments, 15 of these policies
were selected for further analysis as exhibited in Table 1.
Team-to-worksite assignment decisions are updated when information on new worksites
is received, estimates on current worksites are updated or a USAR team finishes its service at a
location. These serve also as the events within the discrete-event simulation (DES) environment.
Let the set T=[e0=0, e1,e2, …, en] be the set of event times, one such event time denoted by en, for
n = 0,…,T during the rescue period. Relative priority scores with respect to the location of USAR
teams for all worksites are re-calculated using the suggested formulae from Table 1 upon each
event, en. Available teams are then assigned to the worksites with highest rank.
Table 1 Proposed USAR Team Deployment Policies
Policy ( )kPA Priority Computation unit
FEMA FEMA scoring Scheme Pfi score
FAL FEMA Adjusted for Loss Pfi – ri. ·ΔSlit, it+ tt(ij) score
FAST FEMA Adjusted by Service Time Pfi/Sit score
FALS FEMA Adjusted for Loss and Service Time Pfi – ri ·ΔSlit, it+ tt(ij)/Sit score
FATT FEMA Adjusted by Travel Time Pfi/tt(ij) score
FALR FEMA Adjusted for Loss Rate Pfi – ri. ·ΔSlit, it+ tt(ij)/ ΔSlit, it+ tt(ij) score
NW Nearest Worksite 1/tt(ij) hour-1
LST Lowest Service Time 1/Sit hour-1
HE Highest Number of Live Entrapped Victims ri # of people
HEAL HE Adjusted for Loss Rate ri ·(1- ΔSlit, it+ tt(ij)) # of people
CS Critical drop in itSl ΔSlit, it+ tt(ij) # of people / hour
15

RCS Reverse of Critical Drop in
itSl 1/ ΔSlit, it+ tt(ij) hour / # of people
HRCS HE and RCS ri/ ΔSlit, it+ tt(ij) hour
LRCS LST and RCS 1/(Sit ·ΔSlit, it+ tt(ij)) 1/ # of people
HLRCS HE and LRCS adjusted by loss due to travel ri ·(1- ΔSlit, it+ tt(ij))/ (Sit ·ΔSlit, it+ tt(ij)) 1
HEALS HEAL and LST ri ·(1- ΔSlit, it+ tt(ij))/Sit # of people / hour
The FEMA priority value, fiP , associated with each worksite i is taken as the sum of
individual scores by category listed in Table 2. The structural triage team must provide an
estimate of scores for every individual building affected by the disaster following the US&R
Response System, Field Operations Guide (2003). This information can be modified during the
response phase by further investigations and more thorough structural testing. This prioritization
scheme accounts for some factors that affect survival likelihood at each worksite and likely
number of survivors present. It implicitly assumes that these factors are additive with equal
weight. The main idea of this FEMA prioritization scheme is that worksites with better structural
condition and stability get higher rank. However, some key factors affecting survival likelihood,
such as physical condition of the live entrapped victims, are not included.
Table 2 FEMA Prioritization Guideline (retrieve from US&R Response System, Field Operations Guide, Structure Triage Form, 2003)
General Category Included Factors FEMA Scores
Estimated Number of Live Entrapped Victims
Potential number of live entrapped victims
1 to 50 (divided by 5) known live entrapped victims (add +5)
Demographic distribution* Building type (Schools/Hospitals add 25)
Structural Characteristics
Structural material Wood, concrete, steel, masonry, precast concrete
Condition of voids Very compact, separate layers to partial collapse (scale between 1 to 20)
Time to get to the victims 24 hours to 2 hours (scale between 1 to 20)
Chance of further collapse Low to high chance (scale between -1 to -20)
16

* Schools and hospitals are given higher priority
This FEMA prioritization method does not account for travel time between or to
worksites from the emergency operations center (EOC). In unreliable and heavily damaged
environments, travel between worksites can take very significant time. Moreover, during the
response phase, significant effort to clear debris and open passages in the region will be
underway (e.g. Koike et al., 2004), and travel time between worksites will be changing over the
course of the response phase. Obtaining travel time estimates in disaster scenarios has become
less problematic in recent years. In fact, in the 2010 Chilean earthquake in Bio-Bio
(Caminoschile, 2013), individuals created a coded Google map using social media applications.
This map provided updated information on the damage-level to the transportation infrastructure
in the disaster region after the earthquake. As time passes, the number of live entrapped victims
diminishes. Thus, it is essential to consider time to access these victims (i.e. service time) in the
prioritization.
The additional 15 policies defined in Table 1 seek to overcome some of the omissions or
simplifications of the FEMA prioritization scheme. All inputs required by the proposed protocols
except travel time between worksites and an explicit survival likelihood function are currently
required for use in the FEMA response procedures as indicated in Table 2.
FAL, FALS, FALR, HEAL, CS, RCS, HRCS, LRCS, and HLRCS policies incorporate
survival likelihood and/or changes in the rate of this likelihood. Note that survival likelihood
functions used in these policies can be empirically derived from data associated with previous
events, laboratory structural tests, and experience in the field. A few works have developed
probabilistic models to estimate post-disaster injury severity of the victims involved in a building
collapse. The models use information on structural type and earthquake intensity (e.g. Frolova et 17

al., 2011). Coburn et al. (1991) studied survival likelihood progression over time for varying
structural materials.
With the exception of CS and RCS, these policies also consider travel and set-up times,
the latter of which will vary by worksite. These policies prioritize according to survival
likelihood computed from the point in time that the USAR team starts the task, instead of the
time that the dispatching decision is made. That is, it captures the reduction in survival likelihood
due to access times. FAL, FALS, and FALR policies are modifications of the FEMA policy,
while HEAL, LRCS, and HLRCS are based on estimated number of live entrapped victims,
service times and changes in survival likelihood during the time it takes for the USAR teams to
travel between worksites.
The FATT policy modifies the FEMA prioritization approach to account for travel time
and set-up times between worksites, but survival likelihood is omitted. By following this policy,
worksites that are in relatively better structural condition with simultaneously shorter required
access times will have higher rank. By comparison, the NW policy focuses directly on the travel
and set-up times, omitting the FEMA score elements.
The impact of service times is investigated through the inclusion of the FAST policy.
When there is a tie in fiP for two worksites, higher priority will be given to the worksite with the
lower estimated service time. FALS combines aspects of two policies: FAL and FAST. It adjusts
fiP for the arrival time of a USAR team at the worksites while giving higher priority to the
worksites with lower service times.
The benefits corresponding to prioritizing worksites with greater number of live
entrapped victims in better physical condition is investigated in the LRCS policy by giving
18

higher weight to those worksites with lower service times and flatter survival likelihood
functions. In addition to factors included in the LRCS policy, the HLRCS policy adjusts for loss
incurred during the USAR team’s travel to the worksites.
Additional simpler policies, including LST, HE, CS, and RCS policies, are also suggested
for comparison purposes. Comparison of queueing system performance under these simpler
policies to performance under other suggested policies will enable a deeper understanding of the
importance of access and service times to a best policy creation.
19

5 . Experimental Setting
The performance of the spatial queueing system described in Section 3 is assessed under each of
the proposed operational policies presented in Section 4. The assessment is completed within the
simulation platform presented in Section 3. The numerical experiments were performed on a
Windows 7 personal computer with one 3.20 GHz CPU processor and 6.00 GB RAM. Results
and analyses are provided in Section 6.
5.1 Problem instance setting
The queueing system was evaluated under each policy for 5 replications of approximately 6,000
randomly specified problem instances derived from publically available information, including
structural failure data, associated with the 2010 earthquake in Port-au-Prince, Haiti. The problem
instances follow the case study setting in (Chen and Miller-Hooks, 2012) as closely as possible,
noting some differences in assumptions.
110 worksites were identified from satellite images as depicted in Figure 3. Building use
(school, government, hospital, other) and damage level were presumed for each worksite. 58
buildings were identified as potential worksites from the start of the rescue period based on the
existence of visible damage, indicated by circles in Figure 3. Identification of the remaining
worksites was assumed to follow a Poisson distribution with mean 0.83 worksites per hour over
the decision horizon (Chen and Miller-Hooks, 2012). These worksites are shown in Figure 3 by
dashed circles. The EOC was assumed to be located at the Toussaint Louverture International
Airport in Port-au-Prince, indicated by a square mark in Figure 3..
20

Figure 3 Identified Worksites in Port-au-Prince, Haiti, Overlaid on Google Map (adapted from Chen and Miller-Hooks, 2012)
Survival likelihood was assumed to be one at the beginning of the rescue period, and the
survival likelihood function is presumed to be negative exponentially distributed as in (Coburn et
al., 1991). At each time instance, a maximum of one USAR team was assigned to each worksite.
Individual teams work 12 hours per day; although, the response effort is carried out 24 hour per
day until its conclusion. It is further assumed that no time is lost in changing shifts. Five USAR
teams are available at the beginning of decision horizon, and five additional teams arrive over the
first 24 hours of the response phase. Their arrival times are known in advance. The rescue period
is assumed to be five days or 120 hours. Euclidean distances on a plane were employed in
estimating initial travel times with an assumed constant travel speed of 40 miles/hour (Chen and
Miller-Hooks, 2012). Travel times were designed to vary under different problem instances. To
create the random travel times, initial travel times were multiplied by a random variable with
distribution ~U[0.5,2] hours.
21

To simulate the number of live entrapped victims in each affected building, random
variates were generated for time-of-day (probability 0.23 during working/school hours) and
earthquake magnitude (5 to 9 with equal probability).
Considering the different damage levels and building uses shown in Figure 3, an estimate
of ir is made for each identified worksite assuming that the number of survivors at the given
point in time is uniformly distributed on [0, specified upper bound]. The upper bound was
calculated from the product of the number of estimated persons present in the building just prior
to the earthquake equation and the demand generation ratio given in Table 3.
Table 3 Parameters of Entrapped Victim Generation (from Chen and Miller-Hooks, 2012) Damage Level School Government Hospital Others
Destroyed 0.6 0.54 0.48 0.42
Severely Damaged 0.80 0.72 0.64 0.56
Moderately Damaged 1.00 0.90 0.80 0.70
No Visible Damage 0.50 0.45 0.40 0.35
Results from (Frolova et al., 2011) on the physical condition of live entrapped victims are
employed to estimate the initial condition of people trapped in a building in the disaster region.
In their work, Florova et al. analyzed empirical data on casualties from historically strong
earthquakes. They suggested the use of Equation 3 for estimating the probability of injuries and
fatalities for a given building.
5
1( ) ( ) ( | ),
k iC B k ii
P I P I P C B=
=∑ (3)
22

where kCP (I) is the probability that a person located within a given building is injured or dead
given an earthquake with intensity I . ( )iBP I is the probability of damage state i, i∈{1,…,5} for a
given building type B under an earthquake with intensity I, and k iP(C | B ) is the survival
likelihood (for C1 = injury, C2 = casualty) of people in building of type B under damage state i as
derived from regional empirical data. As an example, estimates from (Frovola et al., 2011) for
( )kCP I in a building made from massive stone, unreinforced bricks, concrete blocks, or reinforced
concrete floors (buildings of type MMSK-86) are given in Table 4.
Table 4 kCP (I) for a Building of Type MMSK-86 under Different Damage States (Retrieved from Frovola et
al., 2011)
Social losses Ck Damage states
3 4 5 Fatalities (k=1) 0.02 0.23 0.6
Injured (k=2) 0.09 0.37 0.37
Total 0.11 0.6 0.97
To generate random problem instances herein, kCP (I) was estimated from building
material type, collapse patterns and condition of voids consistent with building damage state. For
example, to score the condition of predicted voids for an unreinforced masonry building with
pancake collapse pattern a random score from a uniform distribution of 1 to 5 is generated. For a
reinforced concrete structure that will likely have triangular-shaped voids, this value is assumed
to be uniformly distributed on [15, 20]. Three damage states of 3, 4, and 5 (representing the
intensity of earthquake) were generated randomly from a uniform distribution with equal
probability.
23

To predict the physical condition of live entrapped victims over time, survival likelihood
functions associated with different building types presented in (Coburn et al., 1991) were
employed. These functions account for building material type and capture hourly changes in
survival rate. ΔSlit, it+Δt is randomly generated from a skewed normal distribution according to
suggested functions for each building material type.
Service time at each worksite is assumed to be independent of other criteria and
uniformly distributed on [0, 24]. Service times are estimated upon identification of a worksite
and may be randomly updated (by up to plus or minus 20%) at event intervals.
24

6 . Experimental Design, Results and Analysis
Four sets of numerical experiments were conducted based on replications derived from the 2010
Haitian earthquake case study described in Section 5. The first seeks to identify a best policy
from those considered based on statistical analysis of system performance under the given
policies. The second compares the performance of each policy to the a posteriori optimal
solution under a decision framework, and determines how close to optimal results are from
following a single, easy-to-implement policy. In a third set of experiments, sensitivity analysis
was conducted on those policies identified as performing best. Finally, possible improvements to
the best performing policy were investigated in a fourth set of experiments.
6.1 Comparison of Policies
Assessing the policies on number of survivors
To evaluate the performance of the defined queueing system under each operational policy, the
total number of survivors saved by the end of the rescue period and the time-averaged number of
worksites waiting in queue over the rescue period were analyzed.
The D&D method was applied here to identify a best operational policy from those
policies tested in terms of the number of survivors (Dudewicz and Dalal, 1975). D&D is a two-
stage procedure that uses an indifference zone approach. It is designed for selecting the best of k
systems with respect to the mean. The D&D method requires that the performance measures be
strongly normally distributed over the simulation runs. The distribution of the total number of
survivors achieved under each policy over the many replications were tested and found to be
normally distributed as required.
25

The D&D method involves a two-stage sampling approach. In the first stage, a small
sample of problem instances is tested (40 such instances were tested herein) to estimate first-
stage sample mean and variance ( (1) 2 (1)(40), (40)i iX S ). Results from the initial estimates provide
the minimum number of samples needed in the second stage to conduct the D&D ranking under
each policy. Weights used to compute final population mean and variance from runs of both
stages as required by the D&D method were computed based on the procedure described in
(Dudewicz and Dalal, 1975). Results of first- and second-stage sample size and population mean
for a confidence level of 95% are shown in Table 5.
Table 5 D&D Ranking Results for Total Number of Survivals kAP 1
iX (40) 2is (40) iN 2
i iX (N - 40) 1iw 2iw i iX (N )
HEALS 599 101.29 1062 574 0.045 0.955 575
HEAL 596 99.69 1029 571 0.047 0.953 573
HLRCS 595 99.62 1027 569 0.047 0.953 570
HRCS 593 99.69 1029 567 0.047 0.953 568
LRCS 589 98.63 1007 564 0.048 0.952 566
RCS 586 95.96 953 562 0.051 0.949 563
FALS 585 99.74 1030 560 0.047 0.953 561
FAL 581 99.27 1020 557 0.047 0.953 559
HE 578 99.25 1020 555 0.047 0.953 556
FALR 579 97.40 982 554 0.049 0.951 556
FAST 575 99.69 1029 548 0.047 0.953 549
LST 563 98.33 1001 542 0.048 0.952 543
FEMA 560 92.84 892 538 0.055 0.945 539
FATT 556 95.76 949 533 0.051 0.949 535
NW 538 97.49 984 516 0.049 0.951 517
CS 454 107.65 1199 435 0.040 0.960 435
26

* Bold font indicates those policies that performed best for the indifference zone of 10
survivors and a 95% confidence level.
The results indicate that the HEALS policy that involves the highest number of live
entrapped victims adjusted for loss rate and lowest service time, would lead to the largest
expected number of survivors, and the HEALS, HEAL, HLRCS, HRCS, and LRCS policies tied
for best given the indifference zone of 10 survivors and a 95% confidence level.
Policies HEAL and HEALS consider the number of live entrapped victims existing at
each site at the potential arrival times of the USAR teams to these sites. This is accounted for
through consideration of the survival likelihood rate of change over time. The HEALS policy
also attributes higher priority to worksites with shorter service times. As both policies perform
among the best, it can be concluded that the estimated number of live entrapped victims at the
worksites at expected team arrival times should play an important role in site prioritization. Note
that the HE policy, which is not identified as a best policy, considers the same factors as the
HEAL policy, but uses estimates of number of live entrapped victims at the time of deployment
and not the estimated arrival of the USAR teams. Consequently, it does not perform as well. Two
additional best performing policies, Policies HRCS and HLRCS, similarly account for this
factor. The LRCS policy is the only one of the five best policies to not directly consider the
number of live entrapped victims upon team arrival. Different from the other four top policies,
this policy considers only changes in the survival likelihood rate as opposed to actual expected
number of live entrapped victims. All top policies consider survival likelihood rate of change as
an important factor. It is also worth noting that the FEMA prioritization scheme results in 36
(6.2%) fewer survivors in terms of the D&D score than the best performing policy.
27

To compute the relative probability of performing best, kWinP (AP ) , of each policy kP ,
that is, the frequency with which the policy will outperform all other considered policies, results
from five replications of 3,000 additional problem instances were obtained as provided in Table
6. Confirming earlier findings, Policy HEALS outperforms other policies with probability
( HEALSWinP p ) = 0.37. The second best policy, Policy HEAL, has probability 0.27 of performing
best. This is followed by Policy HRCS with a probability of performing best of only 0.08. Note
that the FEMA policy would outperform other policies with only probability 0.003. One might
also notice that the LRCS policy performs better than other policies 5.9% of the time.
Table 6 Relative Probability of Policies kp Performing the Best
HEALS HEAL HRCS LRCS HLRCS RCS FALS FAL
( )kWinP p 0.376 0.27 0.077 0.059 0.057 0.047 0.029 0.028
HE FALR FAST LST FEMA FATT NW CS
( )kWinP p 0.026 0.009 0.009 0.006 0.003 0.001 0.001 0
Figure 4 CDF of Total Number of Survivors
0
0.1
0.2
0.3
0.4
0.5
0.6
0.7
0.8
0.9
1
20
0
22
0
24
0
26
0
28
0
30
0
32
0
34
0
36
0
38
0
40
0
42
0
44
0
46
0
48
0
50
0
52
0
54
0
56
0
58
0
60
0
62
0
64
0
66
0
68
0
70
0
72
0
74
0
76
0
78
0
80
0
82
0
84
0
86
0
88
0
90
0
CU
MU
LATI
VE P
ROBA
BILI
TY
TOTAL NUMBER OF SURVISORS
HEAL HEALS HRCS HLRCS LRCS FALS
28

Using the same set of 5 replications of 3,000 problem instances, the cumulative
distribution function (CDF) of the number of survivors was computed for the five best policies
along with the best FEMA adjusted policy, FALS. Results are shown in Figure 4. Policies
HEALS and HEAL stochastically dominate the other 4 policies, as their CDFs are completely to
the right of the CDFs for the other policies.
Assessing the policies on time-averaged number of worksites waiting in queue
In addition to total number of survivors, time-averaged number of worksites waiting in queue is
studied. The D&D method is applied once more to choose the best policy with respect to this
second performance measure. The distributions of this second performance measure over the
many replications and policies were tested and were found to be normally distributed for every
policy as required by the methodology. Results are provided in Table 7 for an assumed
confidence interval of 95% and indifference zone of 2 worksites.
Table 7 D&D Ranking Results for Time-average Number of Worksites Waiting in the Queue kAP 1
iX (40) 2is (40) iN 2
i iX (N - 40) 1iw 2iw i iX (N )
LST 7 3 41 7 1.131 -0.131 7
LRCS 8 3 41 8 1.084 -0.084 8
FAST 9 3 41 9 1.040 -0.040 9
CS 12 4 56 11 0.709 0.291 11
FAL 12 4 63 11 0.632 0.368 11
FATT 12 4 58 11 0.690 0.310 11
FEMA 12 4 59 11 0.678 0.322 11
FALR 12 4 63 11 0.635 0.365 11
NW 12 4 62 11 0.645 0.355 12
HRCS 12 4 53 11 0.751 0.249 12
HE 12 4 55 11 0.724 0.276 12
29

HEAL 12 4 61 11 0.654 0.346 12
RCS 12 4 60 11 0.668 0.332 12
FALS 15 5 72 14 0.552 0.448 14
HEALS 16 5 80 14 0.503 0.497 15
HLRCS 16 5 81 15 0.494 0.506 16
Three policies (LST, LRCS, and FAST) were found to perform best with respect to this
second performance measure. All three policies prioritize worksites based on estimated service
times. Policy LST gives higher priority to worksites for which shorter service times are expected.
In addition to allocating higher priority based on lower expected services times, the LRCS policy
also includes the impact of change of rate in survival likelihood function on priority scores. The
FAST policy is equivalent to the FEMA policy, but is rescaled to capture the benefits of lower
service times. Only the LRCS policy performs among the best with respect to both performance
measures. Likewise, the HEALS, HEAL, HLRCS and HRCS, all of which account for estimated
number of live entrapped victims, perform among the worst under the second performance
measure.
In circumstances where the worksites are similar in terms of use, material and likely
damage, the probability of a given number of survivors at each worksite will be similar. In such
cases, it would be best to follow a policy that performs well in terms of minimizing the time-
averaged number of worksites in queue. The LRCS policy offers advantages under both
performance considerations.
30

Figure 5 CDF Time-Averaged Number of Worksites Waiting in the Queue
The CDFs associated with the best performing policies given the time-averaged number
of worksites waiting in queue were computed on the 5 replications of 3,000 problem instances
mentioned above. The CDFs are graphed in Figure 5. The LST policy stochastically dominates
the other considered policies. While both FEMA-based policies have the worst performance in
these experiments, the FALS policy is noticeably suboptimal.
6.2 Policy Performance Compared with Decision Approach
In the previous section, the performance of 16 policies is assessed. The best of these policies
would, using the D&D estimate, save as many as 575 people (Table 1) in the context of the case
study. While this policy produces significantly more survivors, if there might exist an alternative
policy that would produce even better results is not known. Thus, an upper bound on policy
performance can be obtained by determining the optimal number that can be saved given
available resources and other problem properties (e.g. survival function rates of decline), as well
as perfect knowledge of the problem characteristics. That is, this number is determined a
00.10.20.30.40.50.60.70.80.9
1
1 2 3 4 5 6 7 8 9 1 0 1 1 1 2 1 3 1 4 1 5 1 6 1 7 1 8 1 9 2 0 2 1 2 2 2 3 2 4 2 5
CU
MU
LATI
VE P
ROBA
BILI
TY
TIME-AVERAGE NUMBER OF WORKSITES WAITING IN THE QUEUE
LST LRCS FAST FALS
31

posteriori assuming perfect knowledge of the situation in hindsight. The optimal achievable
number will not likely follow from a single prioritization scheme.
To determine the a posteriori optimal deployment of teams to worksites so as to
maximize the number of survivors, the USAR team deployment problem with perfect
information is modeled herein as a multi-team extension of the Multiple Tour Maximum
Collection Problem with Time-Dependent Rewards (MTMCPTD). The MTMCPTD is a
generalization of the team orienteering problem, a comprehensive review of which can be found
in Vansteenwegen et al. (2011). It was introduced in Tang and Miller-Hooks (2007) in the
context of the scheduling planned maintenance tasks to be performed by a single technician over
a multi-day planning horizon for a company with geographically distributed equipment. Since
they showed that the MTMCPTD is NP-hard, a tabu search heuristic embedded in an adaptive
memory procedure and run over a rolling horizon was proposed. The procedure was shown to
obtain near-optimal solutions on a real-world case study through the use of theoretical bounds.
This procedure was extended to multiple agents (i.e. teams) for use herein and was employed to
solve the USAR team deployment problem over 10 Haitian problem instances.
The first 24 hours of the rescue mission were simulated. Table 8 displays the average
total number of survivors produced under each policy and a percentage difference from the a
posteriori optimal number of survivors that could be obtained under perfect information and
using a decision approach rather than a single policy. Using the existing FEMA policy, 50.7% of
the optimal a posteriori number of survivors is achieved. Employing Policy HEALS (highest
number of live entrapped victims adjusted for loss rate and lowest service time) increases this
performance by 35.7 percentage points to achieve 86% of optimality. On average, incorporating
the impact of decreasing survival likelihood, with its degree of change over time, during the
32
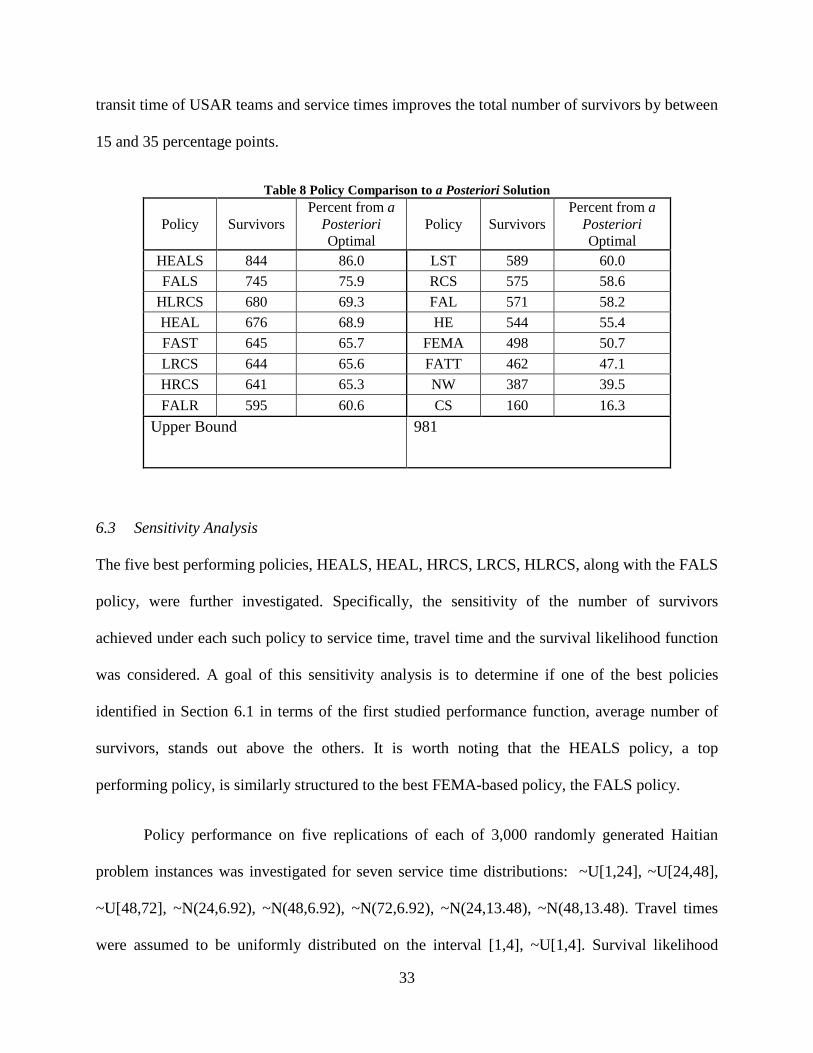
transit time of USAR teams and service times improves the total number of survivors by between
15 and 35 percentage points.
Table 8 Policy Comparison to a Posteriori Solution
Policy Survivors Percent from a
Posteriori Optimal
Policy Survivors Percent from a
Posteriori Optimal
HEALS 844 86.0 LST 589 60.0 FALS 745 75.9 RCS 575 58.6
HLRCS 680 69.3 FAL 571 58.2 HEAL 676 68.9 HE 544 55.4 FAST 645 65.7 FEMA 498 50.7 LRCS 644 65.6 FATT 462 47.1 HRCS 641 65.3 NW 387 39.5 FALR 595 60.6 CS 160 16.3
Upper Bound 981
6.3 Sensitivity Analysis
The five best performing policies, HEALS, HEAL, HRCS, LRCS, HLRCS, along with the FALS
policy, were further investigated. Specifically, the sensitivity of the number of survivors
achieved under each such policy to service time, travel time and the survival likelihood function
was considered. A goal of this sensitivity analysis is to determine if one of the best policies
identified in Section 6.1 in terms of the first studied performance function, average number of
survivors, stands out above the others. It is worth noting that the HEALS policy, a top
performing policy, is similarly structured to the best FEMA-based policy, the FALS policy.
Policy performance on five replications of each of 3,000 randomly generated Haitian
problem instances was investigated for seven service time distributions: ~U[1,24], ~U[24,48],
~U[48,72], ~N(24,6.92), ~N(48,6.92), ~N(72,6.92), ~N(24,13.48), ~N(48,13.48). Travel times
were assumed to be uniformly distributed on the interval [1,4], ~U[1,4]. Survival likelihood
33

functions were presumed to be negative exponentially distributed with rate 90%. Setting the rate
parameter of the distribution function to 90% infers survival of at most 10% of live entrapped
victims by the end of the first 24 hours.
Figure 6 Sensitivity Analysis of Policy Performance under Alternative Service Time Distributions
Figure 6 shows the relative probability of performing the best, kWinP (AP ) . This
probability is based on the frequency with which the studied policy outperforms all other
considered policies under each service time distribution.
The results indicate that the HEALS policy (highest number of live entrapped victims
adjusted for loss rate and lowest service time) outperforms other policies under all but one
studied service time distribution: ~N(48,6.92). The HEAL policy performs best under this
service time distribution and second best in all other cases. Moreover, increasing the mean
service time from 12 to 24 or 48 hours under a uniform distribution improves the relative
0
0.1
0.2
0.3
0.4
0.5
0.6
0.7
0.8
0.9
1
~U[1, 24] ~U[24, 48] ~U[48, 72] ~N(24, 6.92) ~N(48, 6.92) ~N(72, 6.92) ~N(24, 13.48) ~N(48, 13.48)
RELA
TIVE
PRO
BABI
LITY
OF
PERF
ORM
ING
THE
BEST
HEAL HRCS HLRCS HEALS LRCS FALS
34

probability of being the best for Policy HEAL. The relative improved performance of the
HEALS policy compared with the HEAL policy is even greater under normally distributed
service times, which in comparison to uniformly distributed service times has a peak and
generally lower variance, but the general relative performance differences between all studied
policies are minor. As mean service time increases, the difference in performance between
HEAL and HEALS policies diminishes. The relative performance of the HLRCS policy
improves with increased variance in service time.
The impact of changing the rate in the survival likelihood functions on the performance
of the studied policies is investigated further under uniform service and travel time distributions,
~U[1,24] and ~U[1,4], respectively. The rate was varied between a 90% and 20% in the first 24
hours. Results of these runs are given in Figure 7.
From the figure, it can be observed that the lower the rate (i.e. closer to 20%) the better
the relative performance of the HEALS policy. At the highest rate (90%), performance of the
HEAL policy is nearly as good as that of the HEALS policy. This observation suggests that
under conditions with higher survival likelihood and lower rate of change in this likelihood, it is
more important to include service time in the prioritization. That is, priority should be given to
those worksites with low service times. In conditions where rate of survival is dropping quickly,
those worksites with more live entrapped victims should have the highest priority.
35

Figure 7 Sensitivity to Reduction in Survival Likelihood Rates Given by Reduction in First 24 Hours
Figure 8 Sensitivity to Travel Times
0.00
0.10
0.20
0.30
0.40
0.50
0.60
0.70
0.80
0.90
1.00
90% Reduction 75% Reduction 50% Reduction 20% Reduction
RELA
TIVE
PRO
BABI
LITY
OF
PERF
ORM
ING
THE
BEST
HEAL HRCS HLRCS HEALS LRCS FALS
0.00
0.05
0.10
0.15
0.20
0.25
0.30
0.35
0.40
0.45
~U [1,4] ~U [0.2,2] ~U [1,9] ~N(2.5,1)
RELA
TIVE
PRO
BABI
LITY
OF
PERF
ORM
ING
THE
BEST
HEAL HRCS HLRCS HEALS LRCS FALS
36

Finally, given a service time distribution that is ~U[1,24] and negative exponentially
distributed survival likelihood function with rate 90%, policy performance in terms of number of
survivors under varying travel time distributions was studied. Results from these experiments,
given in Figure 8, suggest that changes in travel time mean, variance and distribution have little
effect on the relative probability of performing the best, kWinP (AP ) , among considered policies.
Again, policy HEALS outperforms other policies.
6.4 Further Investigation of Policy FALS
The FALS policy was further investigated through parameterizing its numerator and
denominator: ( ) /jifi i it tt itP r Sl Sα β
+− ⋅∆ . Five replications of 1,000 problem instances were
completed for varying values of the parameters. Considering four different service time
distributions, (~U[1, 48], ~U[0,3], ~N(24, .6.92) and ~U[L,U] for integer L between 5 and 8
hours and 8U L= + ). While for a few settings of α and β (e.g. 1.3, 1.8α β= = ) a statistically
significant difference in performance was noted at a 95% confidence interval, the actual
difference in number of survivors is trivial (e.g. an increase of less than one to perhaps two
survivors).
37

7 . Conclusions and Extensions
The problem of optimally deploying USAR teams to worksites in a disaster region requires quick
evaluation of the disaster scene and rapid decision-making on the deployment of limited
resources. These allocation decisions directly affect the number of people who can be extricated
and, therefore, the number to survive. In this work, the idea of implementing a single policy for
allocating USAR teams to worksites is explored. The use of a single policy is particularly
pertinent in real-time operations and requires a minimal level of on-site, real-time computation.
Moreover, prioritization based on a single policy reduces confusion that can arise in such
difficult, emergency-related situations.
In this paper, this allocation of limited emergency resources to worksites is
conceptualized as a M/G/c priority and preemptive spatially distributed queueing system with
roving servers. Sixteen policies were proposed for operating the queueing system. These policies
provide a mechanism for prioritization of worksites (e.g. collapsed buildings) in the field. The
policies were tested on thousands of randomly generated problem instances developed on a real-
world based case study application.
Of the 16 considered policies, seven policies were found to be promising under two
selected performance measures, two of which, specifically HEALS and LRCS policies, were
particularly notable. The first of these two policies prioritizes based on the lowest service time
and highest number of live entrapped victims adjusted for losses while waiting for the USAR
teams to arrive. The second ranks the worksites based on shorter service time and higher rate of
change in survival likelihood. As time passes, survival likelihood diminishes. Thus, effectively,
these factors together provide a measure of life expectancy.
38

A comparison between Policies HEAL and HEALS shows that service time alone is not
enough. Better policies give priority to worksites with larger numbers of live entrapped victims
and, therefore, possible survivors. Further comparison of the HE and HEAL policies shows the
added improvement of considering loss in number of live entrapped victims during the time it
takes to travel to the worksite and set up needed equipment. That is, the number of live entrapped
victims at the worksites should be estimated from the time when USAR teams begin the actual
rescue work rather than when deployment decisions are made.
Alternative approaches to this problem of real-time USAR team deployment might be
considered. In particular, methods that view the problem as an online routing problem may be
useful. Consider, for example, the Online Traveling Salesperson Problem (OTSP). The objective
of the OTSP is to minimize the total waiting time of a select subset of customers who are chosen
to be served while simultaneously minimizing penalties incurred from rejecting other customers.
Jaillet and Lu (2011) introduced a polynomial time algorithm for an offline version of this
problem. They further developed an optimal c-competitive online algorithm for requests on a
metric space where c is found to be approximately 2.28. This is a difficult problem class for
which solutions can be obtained under restrictive assumptions, including the omission of
preemption and priorities based on factors other than time of arrival to the system.
The well-known Online K-server Problem on a metric space may also have some
applicability here (Borodin and El-Yaniv, 1998). This problem seeks to minimize the total
distance that servers must travel from one customer to the next to serve all incoming requests.
While algorithms exist for several variants of this problem, e.g. the Work Function Online
Algorithm, no algorithm has been developed that considers real-world complexities, such as
prioritization, preemption and that not all customers can be served in the planning horizon. The
39

advantage of these approaches is that they can model dynamic worksite arrivals; however,
neither modeling approach considers the effects of time evolution on problem characteristics,
including service times and potential rewards received from serving customer locations.
Acknowledgements: This work was funded through the Mid-Atlantic University Transportation
Center (MAUTC). The second author was partially supported by the I-95 Corridor Coalition
Fellowship. This support is gratefully acknowledged, but implies no endorsement of the findings.
40

8 . References
1. Borodin A., El-Yaniv R., Online Computation and Competitive Analysis, 1998,
Cambridge, U.K.: Cambridge UP.
2. Boyaci, B., Geroliminis, N. “Extended Hypercube Models for Large Scale Spatial
Queueing Systems,” Urban Transportation System Laboratory, STRC 2011.
3. Caminoschile, 2014:
https://maps.google.com/maps/ms?ie=UTF8&hl=es&oe=UTF8&msa=
0&msid=113716870702282583875.000480af8bc480bc2b82c&z=6. Retrieved on
6/11/14.
4. Chen L., Miller-Hooks E., “Optimal Team Deployment in Urban Search and Rescue,”
Transportation Research Part B: Methodological, 46(8), 2012, 984–999.
5. Coburn, A., Pomonis, A., Sakai, S., Spence, R., “Assessing human casualties caused by
building collapse in earthquakes,” In: Summaries of the International Conference on the
Impact of Natural Disasters, 1991, University of California, Los Angeles, USA.
6. CRED, http://www.emdat.be/natural-disasters-trends. Retrieve on 1/20/2014.
7. Federal Emergency Management Agency (FEMA), “About Urban Search and Rescue.”
Online: http://www.fema.gov/urban-search-rescue. Retrieved on September 24, 2013.
8. National Urban Search and Rescue (US&R) Response System Field Operations Guide,
2003, US&R-2-FG.
9. Fiedrich F., Gehbauer F., Rickers U., “Optimized Resource Allocation for Emergency
Response after Earthquake Disasters,” Safety Science 35(1), 2000, 41-57.
10. Frolova, N., Larionov, V., Bonnin, J., “Earthquake Casualties Estimation in Emergency
Mode,” Human Casualties in Earthquakes Progress in Modelling and Mitigation, New
York, NY: Springer, 2011, 107-123. 41

11. Kleinrock L., Queueing Systems, Volume 1: Theory, 1976, Wiley.
12. Koike Y., Ide O., Takashani R., Bas M., Yagci M.O., “The Study on a Disaster
Prevention/Mitigation Basic Plan in Istanbul Part 2- Evaluation of Urban Vulnerability.
13th World Conference on Earthquake Engineering, 2004, Vancouver, B.C., Paper No.
1361.
13. Laporte G., “Fifty years of vehicle routing,” Transportation Science, 43(4), 2009, 408-
416.
14. Larson, R., “Approximating the performance of urban emergency service systems,”
Operations Research, 23 (5), 1975, 845–868.
15. Larson, R., Odoni A., Urban Operations Research, 1981, Prentice-Hall, Englewood
Cliffs, N.J.
16. Margesson, R., Taft-Morales M., “Haiti earthquake: crisis and response,” Congressional
Research Service, 2010, R41023
17. Ramezankhani A., Najafiyazdi M., “A system dynamics approach on post-disaster
management: a case study of Bam earthquake,” Proc., International Conference of the
System Dynamics Society, 2008, 20-24.
18. Tang H., Miller-Hooks E., Tomastik R., “Scheduling technicians for planned
maintenance of geographically distributed equipment,” Transportation Research Part E,
43(5), 2007, 591-609.
19. Vansteenwegen P., Wouter S., Dirk Van O, "The Orienteering Problem: A
Survey," European Journal of Operational Research, 209(1), 2011, 1-10.
42