dynamics in logistics growing dynamic confronts the area of logistics with completely new...
TRANSCRIPT

Dynamics in Logistics
Hans-Jörg Kreowski � Bernd Scholz-Reiter �Klaus-Dieter ThobenEditors
Dynamics in Logistics
Second International Conference,LDIC 2009, Bremen, Germany, August 2009Proceedings
123
ISBN 978-3-642-11995-8 e-ISBN 978-3-642-11996-5
DOI 10.1007/978-3-642-11996-5
Springer Heidelberg Dordrecht London New York
Library of Congress Control Number: 2010936697
� Springer-Verlag Berlin Heidelberg 2011
This work is subject to copyright. All rights are reserved, whether the whole or part of the material isconcerned, specifically the rights of translation, reprinting, reuse of illustrations, recitation, broadcast-ing, reproduction on microfilm or in any other way, and storage in data banks. Duplication of thispublication or parts thereof is permitted only under the provisions of the German Copyright Law ofSeptember 9, 1965, in its current version, and permission for use must always be obtained fromSpringer. Violations are liable to prosecution under the German Copyright Law.
The use of general descriptive names, registered names, trademarks, etc. in this publication does notimply, even in the absence of a specific statement, that such names are exempt from the relevantprotective laws and regulations and therefore free for general use.
Cover design: eStudio Calamar S.L., Girona
Printed on acid-free paper
Springer is part of Springer Science+Business Media (www.springer.com)
EditorsProf. Dr. Hans-Jörg KreowskiFB Mathematik und InformatikAG Theoretische InformatikUniversität BremenLinzer Str. 9a28359 BremenGermanye-mail: [email protected]
Prof. Dr. Bernd Scholz-ReiterBIBA GmbHBremer Institut für Produktion
und Logistik GmbHUniversität BremenHochschulring 2028359 BremenGermanye-mail: [email protected]
Dr. Klaus-Dieter ThobenBIBA GmbHBremer Institut für Produktion
und Logistik GmbHUniversität BremenHochschulring 2028359 BremenGermanye-mail: [email protected]
Preface of the Editors
LDIC 2009 was the second International Conference on Dynamics in Logisticsheld in Bremen in August 2009. As the first conference in 2007, it was organizedby the Research Cluster for Dynamics in Logistics (LogDynamics) at the BIBA(Bremer Institut für Produktion und Logistik GmbH), which is a scientificengineering research institute affiliated to the University of Bremen.
The scope of the conference was concerned with the identification, analysis,and description of the dynamics of logistic processes and networks. The spectrumreached from the planning and modelling of processes over innovative methodslike autonomous control and knowledge management to the new technologiesprovided by radio frequency identification, mobile communication, and network-ing. The growing dynamic confronts the area of logistics with completely newchallenges: It must become possible to rapidly and flexibly adapt logistic processesand networks to continuously changing conditions. LDIC 2009 provided a forumfor the discussion of advances in that matter. The conference addressed scientistsin logistics, operations research, and computer science and aimed at bringingtogether both researchers and practitioners interested in dynamics in logistics.
The proceedings of LDIC 2009 consist of 48 contributions. The first paper wasinvited, the others selected by a strong reviewing process. The volume is organizedinto the following six subject areas: Mathematical Modelling in Transport andProduction Logistics with ten papers, Routing, Collaboration, and Control withnine papers, Information, Communication, Autonomy, Adaption and Cognitionwith seven papers, Radio Frequency Identification with eight papers, ProductionLogistics with six papers, and Ports, Container Terminals, Regional Logistics andServices with eight papers.
We would like to thank the members of the program and organizationcommittee and the secondary reviewers Christoph Angerer, Eleonora Bottani,Zeng-Yu Cai, Nick Chung, Gianluigi Ferrari, Christian Gorldt, Nicolau Gualda,Harry Halfar, Tilo Hamann, Carl Hans, Bernd Hellingrath, Karl Hribernik,Michael Huhns, Jens Kamenik, Hamid Reza Karimi, Thorsten Klaas-Wissing,Renate Klempien-Hinrichs, Sabine Kuske, Björn Kvarnström, Xue Li, GerbenMeyer, Dennis Ommen, Jürgen Sauer, Jörn Schönberger, Steffen Sowade, Thomas
v

Suding, Hauke Tönnies, and Shu-Jen Wang for their help in the selection process.We are also grateful to Martina Cornels, Renate Klempien-Hinrichs, JakubPiotrowski, Ingrid Rügge, Jörn Schönberger, Aleksandra Slaby, Tobias Wardenand several other colleagues for their support in the local organization and for thetechnical assistance in running the conference system. Special thanks go to MarcusSeifert for organizing the doctoral workshop of LDIC 2009. We are particularlyindebted to Caroline von Totth for her support in editing the volume and in carefulunification of the print files of all the contributions. Moreover, we would like toacknowledge the financial support by the BIBA, the Research Cluster forDynamics in Logistics (LogDynamics), the Nolting-Hauff Stiftung, the Center forComputing and Communication Technologies (TZI), and the University ofBremen. Finally, we appreciate once again the excellent cooperation with theSpringer-Verlag.
Bremen, March 2010 Hans-Jörg KreowskiBernd Scholz-Reiter
Klaus-Dieter Thoben
vi Preface of the Editors

Committees
Program
Neil A. Duffie, Madison (Wisconsin, USA)Kai Furmans, Karlsruhe (Germany)Axel Hahn, Oldenburg (Germany)Bill C. Hardgrave, Arkansas (USA)Bonghee Hong, Pusan (Korea)Kap Hwan Kim, Pusan (Korea)Paul George Maropoulos, Bath (United Kingdom)Dirk Mattfeld, Braunschweig (Germany)Antônio G.N. Novaes, Florianópolis (Brazil)Kulwant Pawar, Nottingham (United Kingdom)Mykhailo Postan, Odessa (Ukraine)Antonio Rizzi, Parma (Italy)Janat Shah, Bangalore (India)Wilfried Sihn, Wien (Austria)Alexander Smirnov, St. Petersburg (Russian Federation)Wolfgang Stölzle, St. Gallen (Switzerland)
Organisation
Martina CornelsSergey DashkovskiyCarmelita GörgHans-Dietrich HaasisMichael HülsmannHerbert KopferJakub Piotrowski
vii

Ingrid RüggeMarcus SeifertAleksandra SlabyHauke TönniesDieter UckelmannKatja Windt
viii Committees

Contents
Part I Mathematical Modeling in Transport andProduction Logistics
Structural Properties of Third-Party Logistics Networks . . . . . . . . . . 3Dieter Armbruster, M. P. M. Hendriks, Erjen Lefeber and Jan T. Udding
Development of a Computational System to Determine the OptimalBus-stop Spacing in order to Minimize the Travel Timeof All Passengers . . . . . . . . . . . . . . . . . . . . . . . . . . . . . . . . . . . . . . . . 15Homero F. Oliveira, Mirian B. Gonçalves, Eduardo S. Cursi andAntonio G. Novaes
Some Remarks on Stability and Robustness of Production NetworksBased on Fluid Models . . . . . . . . . . . . . . . . . . . . . . . . . . . . . . . . . . . 27Bernd Scholz-Reiter, Fabian Wirth, Sergey Dashkovskiy,Michael Schönlein, Thomas Makuschewitz and Michael Kosmykov
Online Optimization with Discrete Lotsizing Production andRolling Horizons . . . . . . . . . . . . . . . . . . . . . . . . . . . . . . . . . . . . . . . . 37Wilhelm Dangelmaier and Bastian Degener
Dynamic Vehicle Routing in Over Congested Urban Areas . . . . . . . . . 49Antonio G. N. Novaes, Enzo M. Frazzon and Paulo J. Burin
Serving Multiple Urban Areas with StochasticCustomer Requests . . . . . . . . . . . . . . . . . . . . . . . . . . . . . . . . . . . . . . 59Stephan Meisel, Uli Suppa and Dirk Mattfeld
Stability Analysis of Large Scale Networks of AutonomousWork Systems with Delays . . . . . . . . . . . . . . . . . . . . . . . . . . . . . . . . 69H. R. Karimi, S. Dashkovskiy and N. A. Duffie
ix
Local Input-to-State Stability of Production Networks . . . . . . . . . . . . 79Sergey Dashkovskiy, Michael Görges and Lars Naujok
An Approach to Model Reduction of Logistic NetworksBased on Ranking . . . . . . . . . . . . . . . . . . . . . . . . . . . . . . . . . . . . . . . 91Bernd Scholz-Reiter, Fabian Wirth, Sergey Dashkovskiy,Michael Kosmykov, Thomas Makuschewitz and Michael Schönlein
Optimization of Spare Parts Lot Size for Supply ofEquipment’s Park . . . . . . . . . . . . . . . . . . . . . . . . . . . . . . . . . . . . . . . 105Iryna Morozova, Mykhaylo Postan and Lyudmyla Shyryaeva
Part II Routing, Collaboration and Control
Weighted Multiplicative Decision Function for DistributedRouting in Transport Logistics . . . . . . . . . . . . . . . . . . . . . . . . . . . . . 117Bernd-Ludwig Wenning, Henning Rekersbrink, Andreas Timm-Giel andCarmelita Görg
Distributed Decision Making in Combined Vehicle Routingand Break Scheduling . . . . . . . . . . . . . . . . . . . . . . . . . . . . . . . . . . . . 125Christoph Manuel Meyer, Herbert Kopfer,Adrianus Leendert Kok and Marco Schutten
Dynamic Routing Applied to Mobile Field Service . . . . . . . . . . . . . . . 135Auro C. Raduan and Nicolau D. F. Gualda
Intelligent Agent Control and Coordination with User-ConfigurableKey Performance Indicators . . . . . . . . . . . . . . . . . . . . . . . . . . . . . . . 145Florian Pantke
Stockout Costs in Logistics Unconsidered . . . . . . . . . . . . . . . . . . . . . . 161Henner Gärtner, Rouven Nickel and Peter Nyhuis
Performance Measurement for Interorganisational Collaborationsof SMEs . . . . . . . . . . . . . . . . . . . . . . . . . . . . . . . . . . . . . . . . . . . . . . 169Yilmaz Uygun and Andreas Schmidt
On the Formation of Operational Transport Collaboration Systems. . . 191Melanie Bloos and Herbert Kopfer
x Contents

Adaptive RBAC in Complex Event-Driven BPM Systems . . . . . . . . . . 203Bernardo N. Yahya and Hyerim Bae
A Preliminary Investigation on a Bottleneck Concept inManufacturing Control . . . . . . . . . . . . . . . . . . . . . . . . . . . . . . . . . . . 213Bernd Scholz-Reiter, Katja Windt and Huaxin Liu
Part III Information, Communication, Autonomy,Adaption and Cognition
Synchronization of Material and Information Flows in IntermodalFreight Transport: An Industrial Case Study . . . . . . . . . . . . . . . . . . . 227Jannicke Baalsrud Hauge, Valentina Boschian and Paolo Pagenelli
EURIDICE: Platform Architecture in Logistics for ‘‘The Internetof Things’’. . . . . . . . . . . . . . . . . . . . . . . . . . . . . . . . . . . . . . . . . . . . . 235Jens Schumacher, Manfred Gschweidl and Mathias Rieder
Initial Benefits of Using Intelligent Cargo Technology in FreshFishing Logistics Chain . . . . . . . . . . . . . . . . . . . . . . . . . . . . . . . . . . . 245Donatella Vedovato, Tatjana Bolic, Marco Della Puppaand Marco Mazzarino
Autonomous Co-operation of ‘‘Smart-Parts’’: Contributions andLimitations to the Robustness of Complex AdaptiveLogistics Systems. . . . . . . . . . . . . . . . . . . . . . . . . . . . . . . . . . . . . . . . 255Michael Hülsmann, Benjamin Korsmeier, Christoph Illigen andPhilip Cordes
Decentralisation and Interaction Efficiency in CooperatingAutonomous Logistics Processes. . . . . . . . . . . . . . . . . . . . . . . . . . . . . 269Arne Schuldt
Design Aspects of Cognitive Logistic Systems . . . . . . . . . . . . . . . . . . . 279Carsten Beth, Jens Kamenik, Dennis Ommen and Axel Hahn
Autonomous Units for Solving the Traveling SalespersonProblem Based on Ant Colony Optimization . . . . . . . . . . . . . . . . . . . 289Sabine Kuske, Melanie Luderer and Hauke Tönnies
Contents xi
Part IV Radio Frequency Identification
Dynamic Management of Adaptor Threads for SupportingScalable RFID Middleware . . . . . . . . . . . . . . . . . . . . . . . . . . . . . . . . 301Chungkyu Park, Junho Lee, Wooseok Ryu, Bonghee Hong andHeung Seok Chae
Tag-to-Tag Mesh Network Using Dual-Radio RFID Systemfor Port Logistics . . . . . . . . . . . . . . . . . . . . . . . . . . . . . . . . . . . . . . . 311Jinhwan Kim, Hyocheol Jeong, Myungjae Kim, Haosong Gou,Munseok Choi and Younghwan Yoo
Automation of Logistic Processes by Means of Locating andAnalysing RFID-Transponder Data . . . . . . . . . . . . . . . . . . . . . . . . . . 323Bernd Scholz-Reiter, Wolfgang Echelmeyer, Harry Halfar andAnne Schweizer
Auto-Triggering of RFID-based Logistic Process inInter-Workflow Using Complex Event . . . . . . . . . . . . . . . . . . . . . . . . 329Hyerim Bae and Yeong-Woong Yu
Selectivity of EPC Data for Continuous Query Processing on RFIDStreaming Events . . . . . . . . . . . . . . . . . . . . . . . . . . . . . . . . . . . . . . . 341Mikyung Choi, Byungjo Chu, Gihong Kim and Bonghee Hong
Criticality Based Decentralised Decision Procedures forManufacturing Networks Exploiting RFID and Agent Technology . . . 351Hermann Küehnle, Arndt Lüeder and Michael Heinze
The Application of the EPCglobal Framework Architecture toAutonomous Control in Logistics . . . . . . . . . . . . . . . . . . . . . . . . . . . . 365Karl A. Hribernik, Carl Hans and Klaus-Dieter Thoben
Design of Middleware Architecture for Active Sensor Tags. . . . . . . . . 375Haipeng Zhang, Bonghee Hong and Wooseok Ryu
Part V Production Logistics
Investigation of the Influence of Capacities and Layout ona Job-Shop-System’s Dynamics . . . . . . . . . . . . . . . . . . . . . . . . . . . . . 389Bernd Scholz-Reiter, Christian Toonen and Jan Topi Tervo
xii Contents
Modelling Packaging Systems in the Furniture Industry . . . . . . . . . . . 399Dennis Reinking and Hans Brandt-Pook
Monitoring Methodology for Productive Arrangements(Supply Chain) . . . . . . . . . . . . . . . . . . . . . . . . . . . . . . . . . . . . . . . . . 409Breno Barros Telles do Carmo, Marcos Ronaldo Albertin,Dmontier Pinheiro Aragão Jr. and Nadja G. S. Dutra Montenegro
Complexity-Based Evaluation of Production Strategies UsingDiscrete-Event Simulation . . . . . . . . . . . . . . . . . . . . . . . . . . . . . . . . . 423Reik Donner, Uwe Hinrichs, Christin Schicht and Bernd Scholz-Reiter
Converting Knowledge into Performance Within GlobalProduction and Logistic Systems . . . . . . . . . . . . . . . . . . . . . . . . . . . . 433Enzo Morosini Frazzon and Bernd Scholz-Reiter
Dynamic Scheduling of Production and Inter-FacilitiesLogistic Systems . . . . . . . . . . . . . . . . . . . . . . . . . . . . . . . . . . . . . . . . 443Bernd Scholz-Reiter, Antônio G. N. Novaes, Thomas Makuschewitzand Enzo Morosini Frazzon
Part VI Ports, Container Terminals, Regions and Services
How can Electronic Seals Contribute to the Efficiency ofGlobal Container System? . . . . . . . . . . . . . . . . . . . . . . . . . . . . . . . . . 457Kateryna Daschkovska and Bernd Scholz-Reiter
Resolution of the Berth Allocation Problem through a HeuristicModel Based on Genetic Algorithms . . . . . . . . . . . . . . . . . . . . . . . . . 469Vanina Macowski Durski Silva, Antônio G. Novaes andAntônio Sérgio Coelho
Development of a Genetic Algorithm for the MaritimeTransportation Planning of Car Carriers . . . . . . . . . . . . . . . . . . . . . . 481Jae Un Jung, Moo Hong Kang, Hyung Rim Choi, Hyun Soo Kim,Byung Joo Park and Chang Hyun Park
A Model of Wireless Sensor Networks Using Opportunistic Routingin Logistic Harbor Scenarios . . . . . . . . . . . . . . . . . . . . . . . . . . . . . . . 489Vo Que Son, Bernd-Ludwig Wenning, Andreas Timm-Giel andCarmelita Görg
Contents xiii
Logistics Service Providers in Brazil: A Comparison BetweenDifferent Developed Regions . . . . . . . . . . . . . . . . . . . . . . . . . . . . . . . 501Mônica Maria Mendes Luna, Carlos Ernani Fries andDmontier Pinheiro Aragão Júnoir
Adapting Dynamic Logistics Processes and Networks: AdvantagesThrough Regional Logistics Clusters . . . . . . . . . . . . . . . . . . . . . . . . . 513Ralf Elbert, Hans-Dietrich Haasis, Robert Schönbergerand Thomas Landwehr
Quotation Behaviour of Profit Centres for Offers onDynamic Logistic Services . . . . . . . . . . . . . . . . . . . . . . . . . . . . . . . . . 529Bernd Pokrandt, Marcus Seifert and Stefan Wiesner
Long Haul Trucks Dynamic Assignment with Penalties . . . . . . . . . . . 539Antonio Martins Lima Filho and Nicolau D. Fares Gualda
xiv Contents

Part IMathematical Modeling in Transport
and Production Logistics
Structural Properties of Third-PartyLogistics Networks
Dieter Armbruster, M. P. M. Hendriks, Erjen Lefeberand Jan T. Udding
1 Introduction
Third party logistic providers are the middle men between producers and theircustomers. They typically have contracts with a producer to take over whatever isproduced in a certain factory during a certain time window and to provide allcustomers with the goods that they require. In that way, third party logistic pro-viders relieve both the customer and the producer from keeping large inventoriesto balance fluctuations in production and demand. Simultaneously, the third partylogistic provider assumes the distribution risk, both in terms of aggregatingshipments from and to different sources and for delays in the actual deliveries.
The logistic network and flows resulting from such a business model aresignificantly different from a usual supply network. In particular, there is only ageneral framework specifying the location and number of producers as well astheir average production rate and the location, number and demand rate of theircustomers. In contrast to a supply or a distribution network, there are no demandsfunneled up the supply chain from the customer to the producer. Here, producersrequest pickup of finished goods and customers request delivery at a certain time
D. Armbruster (&)School of Mathematical and Statistical Sciences, Arizona State University, Tempe, USAe-mail: [email protected]
D. Armbruster, M. P. M. Hendriks, E. Lefeber and J. T. UddingDepartment of Mechanical Engineering, Eindhoven University of Technology,Eindhoven, The Netherlandse-mail: [email protected]
E. Lefebere-mail: [email protected]
J. T. Uddinge-mail: [email protected]
H.-J. Kreowski et al. (eds.), Dynamics in Logistics,DOI: 10.1007/978-3-642-11996-5_1, � Springer-Verlag Berlin Heidelberg 2011
3
and it is the job of the third party logistic provider to store excess production anddeliver requests on time. While there are long term contractual obligations toservice specific producers and their customers, the actual quantities fluctuatestochastically and are only known a few days ahead of actual delivery. A typicalscenario is the just in time (JIT) production common in the automobile industry.Parts are produced by a big plastics company at different locations throughoutEurope and needed at different assembly plants in Europe. Neither the plasticsproducer nor the assembly factory keep any sizeable inventory—however thecustomers expect delivery JIT for assembly. Keeping the right size inventory andshipping on time is the business of the third party provider.
There are three management levels to operate a third party logistic provider:
1. At the strategic level the number of warehouses, their geographic location andthe geographic range of the logistic network have to be determined.
2. At the tactical level transportation links between the established set ofcustomers, producers and warehouses are set up.
3. At the operational level size and direction of shipments are established.
These three levels correspond to different timescales—warehouses and geo-graphic operations correspond to long term plans and investments, the operationallevel covers day to day operations and the tactical level lives on a monthly toyearly timescale.
The current paper is specifically concerned with the tactical level. We assumethat the strategic decisions have been made and we assume a fixed set of ware-houses, producers and customers. We are studying the network of links. Inparticular, we focus on the influence of the operational level on the networkstructure, i.e. we are interested to determine the topology of the network as afunction of the operational parameters.
We will study the influence of the following operational parameters on thetactical logistics networks:
• Cost of delivery at the wrong time. Typically there are contractual penalties forearly or late delivery.
• The actual transportation costs—we assume costs that are linear in the amountthat is shipped.
• Variation in demand and production.
To determine the network structure we develop an optimization scheme thatoptimizes the operational level. Given a network structure, transportation costcoefficients, missed delivery penalties and given stochastic production and demandrates over a time interval, we will determine the optimal allocation of shipments todirect shipping and to warehousing. We then repeat the optimization for a networkwith a smaller number of links and continue this process until the costs for thelogistic provider go up significantly. Establishing transportation links is costly: localshippers have to be contracted, customs and other licensing issues may arise, etc.A reduction in the number of links reduces the complexity of the network and withthat the complexity of the organizational task of the third party logistic provider.
4 D. Armbruster et al.
In addition reducing the number of links pushes the flow of goods into the remaininglinks leading to thicker flows which lead to economy of scales (more fully loadedtrucks or railroad wagons). In principle, the economy of scales and the costs ofestablishing links could be put into a cost function and an optimal link structurecould be derived. However, the resulting optimization scheme will becomeextremely complicated and very hard to solve for any reasonable size network.In addition, the structural costs of establishing a link are very hard to quantify.
Our study shows:
• The cost of operating a third party logistic network can be quantified andoptimized.
• A heuristics is developed that reduces the number of links based on their usage.• As the number of links in a network is reduced the cost of running the operation
on the network stays almost constant. Most links are redundant and can bedeleted without any influence on the operation of the network until a criticalnetwork size and structure is reached. At that point the operational cost explodeby several orders of magnitude reminiscent of a physical phase transition. Hencethere exists a network with a very limited number of links that has close tooptimal operational cost called the reduced network.
• The reduced network is largely insensitive to variations in the production andthe demand rate.
• The parameters of the operational cost function determine the topologicalstructure of the reduced network. In particular, JIT shipping requires direct linksbetween some producers and some customers whereas time insensitive deliv-eries lead to a network where all links go through warehouses.
This paper gives a short summary of our work: details on the connectionbetween the heuristics and exact optimization via a branch and bound algorithm,about the relationship between continuous production flows and transportation viatrucks leading to a stepwise cost function, on extensions to more than one productflow and other issues can be found in Hendriks et al. (2008).
2 Related Approaches
Some related work focuses on optimizing the strategic level: for instanceMeepetchdee and Shah (2007) determines the optimal number and location ofwarehouses, given the location of a plant producing one type of product and giventhe number and location of the customers. Results show that there is a tradeoffbetween the robustness of the network and its efficiency and its complexity(Cordeau et al. 2008). Typical studies investigating supply chain policies placeorders to manufacturing facilities to keep inventory positions in warehouses at adesired level and to satisfy customer demand (Kwon et al. 2006; Hax and Candea1984; Wasner and Zapfel 2004). While the decision space on an operational levelin a supply chain network is crucially different from the decision space for a third
Structural Properties of Third-Party Logistics Networks 5
party logistic provider, some of the approaches are similar to ours. For instanceTsiakis et al. (2001) studies the strategic design of a multi-echelon, multi-productsupply chain network under demand uncertainty. The objective is to minimize totalcosts taking infrastructure as well as operational costs into consideration. A finiteset of demand scenarios is generated and the objective function is expanded byadding weighted costs for each of the possible scenarios. A process very similar toour heuristic process is employed in Kwon et al. (2006) to determine the numberand locations of transshipment hubs in a supply chain network as a function of theproduct flows. The costs of operational activities in a network in which allpotential hubs are present are minimized. Deleting one hub at a time the decreasein cost is determined and the hub which causes the largest decrease is deleted fromthe network. This process is continued until deleting a hub does not significantlyaffect the costs.
The dependency of the operational costs in a multi-echelon supply chain on thenumber of warehouses connected to each customer is studied in Cheung andPowell (1996). In a standard distribution network, each customer desires to beconnected to one warehouse for practical reasons. The study suggests that largeimprovements are made when a portion of the customers is served by twowarehouses (and the rest by one). An interesting recommendation for futureresearch which we pick up in this paper, is to investigate the sensitivity of theoptimal network to the ratio of different operating costs.
The most interesting work on optimizing the operations of a third party logisticprovider is Topaloglu (2005). Here a company owns several production plants andhas to distribute its goods to different regional markets. In each time period, arandom (uncontrollable) amount of goods becomes available at each of theseplants. Before the random amount of the customers becomes available, thecompany has to decide which proportion of the goods should be shipped directlyand which proportion should be held at the production plants. Linear costs areassigned to transportation, storage and backlog. A look-ahead mechanism isintroduced by using approximations of the value function and improving theseapproximations using samples of the random quantities. It is numerically shownthat the method yields high quality solutions. Again it is found that improvementsfor the operational costs are made when a part of the customers is served by twoplants, while the other part is served by one.
3 Methodology
To fix ideas we consider the graph in Fig. 1: production facilities supply goods andpush them into the network while customers have a demand for them. Goods canbe either sent directly from manufacturer(s) to customer(s) or stored temporarily inwarehouses. We do not allow shipments from one warehouse to another.
We consider the following problem: given m production facilities for the sameproduct, n warehouses, c customers and their spatial location, and given a time series
6 D. Armbruster et al.

of daily production and daily demands at each location over a time period T,determine a network topology such that both, the costs of operating the network, andthe number of links are close to minimal. We assume the total supply to be equal tothe total demand over the time period T. The time series for production and demandare fixed and randomly generated. However, they are only known to the third partylogistic provider (the optimization scheme) over a time horizon S where S � T.
We will set up a linear programming (LP) scheme, which describes the flowsthrough such a logistics network for a fixed topology. The decision variables ofthis model are the flows each day through each of the links. The modeling is indiscrete time (days) and is based on the following conservation laws:
• Every day the production at each factory has to be distributed among the links,connected to that particular factory.
• The storage level in a warehouse is updated daily, dependent on incoming andoutgoing flows. Flows going through a warehouse incur a delay: productsarriving in a warehouse at a certain time instance are shipped out 1 day later.
An objective function is constructed by assigning costs per unit of goods perday for transportation, storage and early and late delivery. The amount of goods,which are not delivered to a certain customer at a certain time instance, is added tothe original demand of that particular customer for the next time instance.The conservation laws are equality constraints for this optimization problem. Sinceforecasts of supplies and demands are available over the time horizon S, routingdecisions are based on this time horizon. This leads to a model predictive control(MPC) scheme with receding time horizon which is executed each day during the
Fig. 1 A typical smalllogistic network
Structural Properties of Third-Party Logistics Networks 7
time period T to determine the most cost-effective routing schedule for the givenperiod T and the fixed network topology.
Since the number of possible topologies grows very large when realistic valuesfor m, n and c are considered, we propose a heuristic to determine the network thathas the lowest number of links while still generating a close to optimal schedule.
4 Optimization Scheme for the Operational Level
Let k = 0, 1, 2, 3… represent time in days, ui,j(k) is the amount of goodstransported from node i to node j on day k, and wp(k) is the inventory position inwarehouse p on day k. Although the total supply on day k can differ from thetotal demand on day k, we require that the following conservation law holds forperiod T:
XT
k¼0
Xm
i¼1
MiðkÞ ¼XT
k¼0
Xc
j¼1
CjðkÞ: ð1Þ
Here Mi(k) is the production of supplier i on day k and Cj(k) is the demand ofcustomer j on day k. This assumption implies that the total amount of goodsproduced and consumed over the time period T is balanced. In addition
MiðkÞ ¼X
j2Si
uijðkÞ; ð2Þ
where the set Si contains the indices of all the nodes to which manufacturingfacility i is connected. A similar constraint exists for the warehouse:
wpðkÞ ¼ wp�1ðkÞ þX
i2Ip
uijðk � 1Þ �X
j2Op
upjðkÞ; ð3Þ
where the set Ip contains the indices of all the suppliers of warehouse p and Op
contains the indices of all the nodes that are its customers. The total cost A(u)(k) ofoperating the logistic enterprise at day k for the flows uij(k) represented byu consists of the sum of the transportation costs, the warehouse costs and thebacklog costs
AðuÞðkÞ ¼Xc
j¼1
bjB2j ðkÞ þ
X
i;j2U
aijuijðkÞ þX
p2W
spwpðkÞ; ð4Þ
where bj is the backlog cost per item per day for customer j, aij represents the unitcost of transportation from location i to location j, and sp is the unit cost per day ofstoring an item in warehouse p. Bj(k) is the backlog at customer j on day k given by
BjðkÞ ¼ DjðkÞ �X
i2Qj
uijðkÞ ð5Þ
8 D. Armbruster et al.
where Qj is the set of all nodes connecting to customer j and
DjðkÞ ¼ CjðkÞ þ Bjðk � 1Þ: ð6Þ
Hence old backlog is added to the original customer demand. Note that we arepenalizing early and late delivery equally which is most certainly not the case inreality but makes our calculations much easier.
Equation (4) reflects the cost on 1 day. However, forecasts of supplies anddemands are available over a time horizon of length S and hence routing decisionsshould be made based on the time interval [k,k ? S]. To do this we use MPC withrolling horizon (MPC) (Garcia et al. 1989) and have the following cost function:
minuðkÞ;...;uðkþS�1Þ
XS�1
q¼0
AðuÞðk þ qÞ ð7Þ
subject to all the previous constraints over the time interval [k,k ? S].The above MPC determines the optimal routing schedule for day k. Subse-
quently the MPC for day k ? 1 is executed, rolling the time horizon forward. Tofind the most cost-effective routing schedule for the time period T thus entailssolving the optimization problem (Eq. 7) T times leading to a total minimal costover that time period.
5 Optimization Scheme for the Network Topology
The MPC presented in the previous section uses a fixed topology to make the bestoperational decisions given a set of time series for supply and demand. For smallenough networks we can now change the network topology and determine the bestnetwork for the optimal operational decisions. A branch and bound method isdescribed in Hendriks et al. (2008). However, since the problem has integer statevariables (i.e. whether a link exists or not) we can only solve rather smallproblems. We therefore introduce the following heuristics:
• Start with a fully connected network and run the MPC.• Until the network is minimally connected (i.e. each supplier has at least one
customer, each customer has at least one supplier), do:
– delete all links whose total flow over the time period T is below a threshold.– Run the MPC for the truncated network.
Plot the costs of the optimal operation against the number of deleted links.Figure 2 shows a typical result for a network of 8 suppliers, 4 warehouses and
75 customers over a time interval of T = 100 and a horizon of S = 3. Theoperating costs for the optimal operations are minimal for the fully connectednetwork, since we do not figure in the economics of scale. Typically about 95% ofthe links can be deleted without changing the operational cost. At some critical
Structural Properties of Third-Party Logistics Networks 9
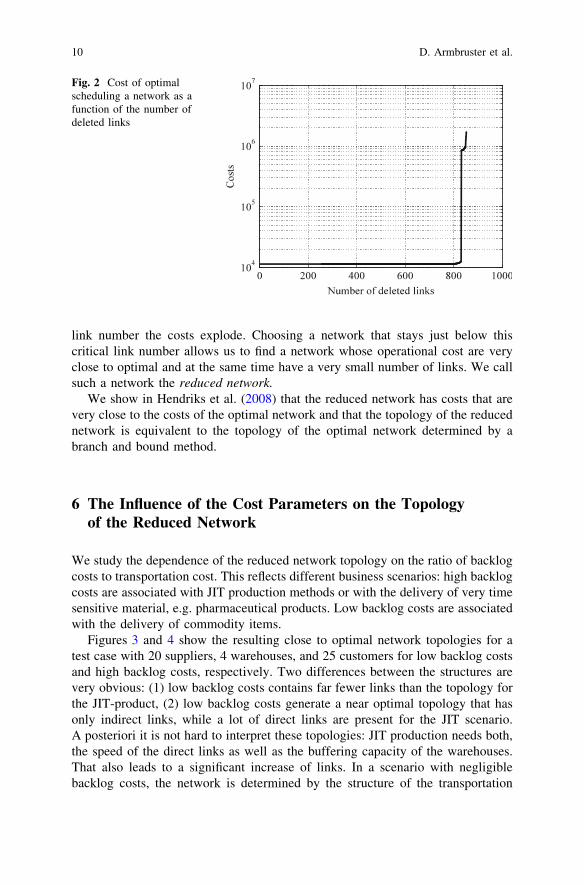
link number the costs explode. Choosing a network that stays just below thiscritical link number allows us to find a network whose operational cost are veryclose to optimal and at the same time have a very small number of links. We callsuch a network the reduced network.
We show in Hendriks et al. (2008) that the reduced network has costs that arevery close to the costs of the optimal network and that the topology of the reducednetwork is equivalent to the topology of the optimal network determined by abranch and bound method.
6 The Influence of the Cost Parameters on the Topologyof the Reduced Network
We study the dependence of the reduced network topology on the ratio of backlogcosts to transportation cost. This reflects different business scenarios: high backlogcosts are associated with JIT production methods or with the delivery of very timesensitive material, e.g. pharmaceutical products. Low backlog costs are associatedwith the delivery of commodity items.
Figures 3 and 4 show the resulting close to optimal network topologies for atest case with 20 suppliers, 4 warehouses, and 25 customers for low backlog costsand high backlog costs, respectively. Two differences between the structures arevery obvious: (1) low backlog costs contains far fewer links than the topology forthe JIT-product, (2) low backlog costs generate a near optimal topology that hasonly indirect links, while a lot of direct links are present for the JIT scenario.A posteriori it is not hard to interpret these topologies: JIT production needs both,the speed of the direct links as well as the buffering capacity of the warehouses.That also leads to a significant increase of links. In a scenario with negligiblebacklog costs, the network is determined by the structure of the transportation
Fig. 2 Cost of optimalscheduling a network as afunction of the number ofdeleted links
10 D. Armbruster et al.
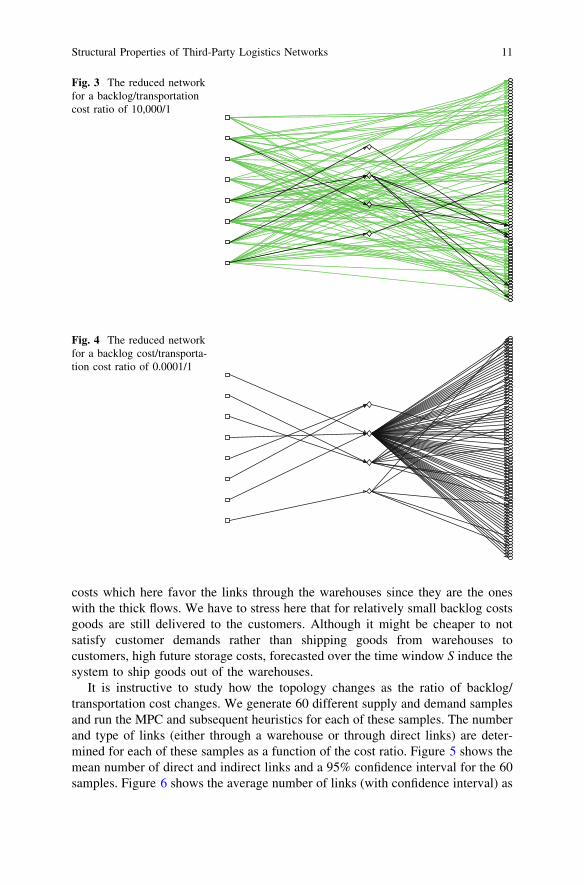
costs which here favor the links through the warehouses since they are the oneswith the thick flows. We have to stress here that for relatively small backlog costsgoods are still delivered to the customers. Although it might be cheaper to notsatisfy customer demands rather than shipping goods from warehouses tocustomers, high future storage costs, forecasted over the time window S induce thesystem to ship goods out of the warehouses.
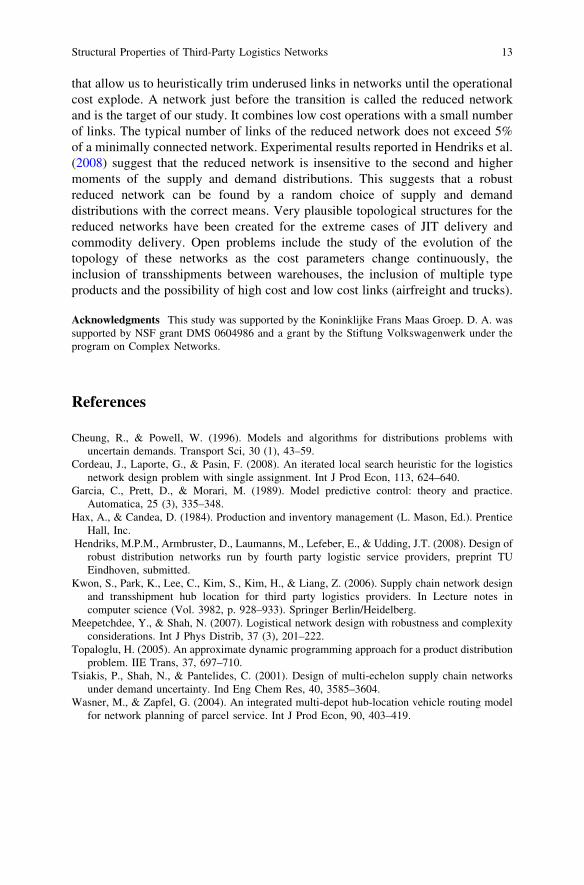
It is instructive to study how the topology changes as the ratio of backlog/transportation cost changes. We generate 60 different supply and demand samplesand run the MPC and subsequent heuristics for each of these samples. The numberand type of links (either through a warehouse or through direct links) are deter-mined for each of these samples as a function of the cost ratio. Figure 5 shows themean number of direct and indirect links and a 95% confidence interval for the 60samples. Figure 6 shows the average number of links (with confidence interval) as
Fig. 3 The reduced networkfor a backlog/transportationcost ratio of 10,000/1
Fig. 4 The reduced networkfor a backlog cost/transporta-tion cost ratio of 0.0001/1
Structural Properties of Third-Party Logistics Networks 11
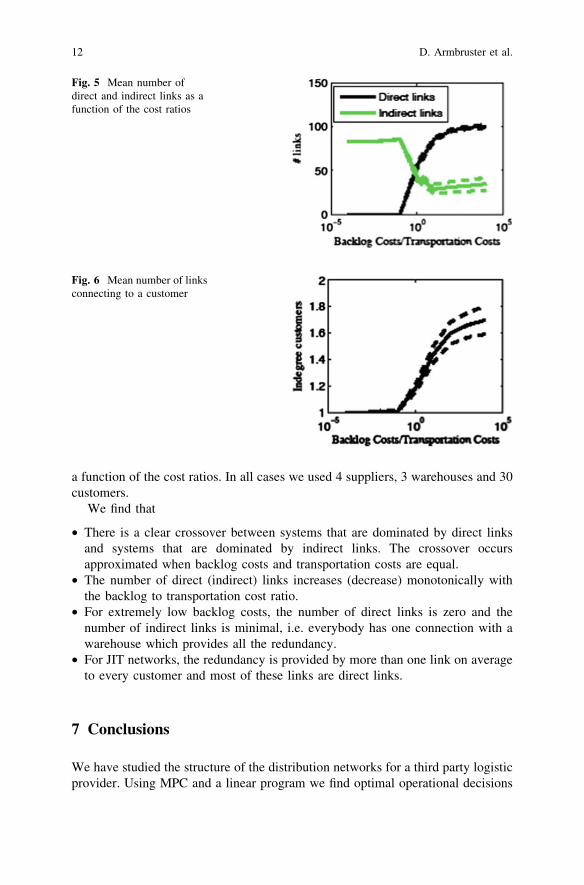
a function of the cost ratios. In all cases we used 4 suppliers, 3 warehouses and 30customers.
We find that
• There is a clear crossover between systems that are dominated by direct linksand systems that are dominated by indirect links. The crossover occursapproximated when backlog costs and transportation costs are equal.
• The number of direct (indirect) links increases (decrease) monotonically withthe backlog to transportation cost ratio.
• For extremely low backlog costs, the number of direct links is zero and thenumber of indirect links is minimal, i.e. everybody has one connection with awarehouse which provides all the redundancy.
• For JIT networks, the redundancy is provided by more than one link on averageto every customer and most of these links are direct links.
7 Conclusions
We have studied the structure of the distribution networks for a third party logisticprovider. Using MPC and a linear program we find optimal operational decisions
Fig. 5 Mean number ofdirect and indirect links as afunction of the cost ratios
Fig. 6 Mean number of linksconnecting to a customer
12 D. Armbruster et al.
that allow us to heuristically trim underused links in networks until the operationalcost explode. A network just before the transition is called the reduced networkand is the target of our study. It combines low cost operations with a small numberof links. The typical number of links of the reduced network does not exceed 5%of a minimally connected network. Experimental results reported in Hendriks et al.(2008) suggest that the reduced network is insensitive to the second and highermoments of the supply and demand distributions. This suggests that a robustreduced network can be found by a random choice of supply and demanddistributions with the correct means. Very plausible topological structures for thereduced networks have been created for the extreme cases of JIT delivery andcommodity delivery. Open problems include the study of the evolution of thetopology of these networks as the cost parameters change continuously, theinclusion of transshipments between warehouses, the inclusion of multiple typeproducts and the possibility of high cost and low cost links (airfreight and trucks).
Acknowledgments This study was supported by the Koninklijke Frans Maas Groep. D. A. wassupported by NSF grant DMS 0604986 and a grant by the Stiftung Volkswagenwerk under theprogram on Complex Networks.
References
Cheung, R., & Powell, W. (1996). Models and algorithms for distributions problems withuncertain demands. Transport Sci, 30 (1), 43–59.
Cordeau, J., Laporte, G., & Pasin, F. (2008). An iterated local search heuristic for the logisticsnetwork design problem with single assignment. Int J Prod Econ, 113, 624–640.
Garcia, C., Prett, D., & Morari, M. (1989). Model predictive control: theory and practice.Automatica, 25 (3), 335–348.
Hax, A., & Candea, D. (1984). Production and inventory management (L. Mason, Ed.). PrenticeHall, Inc.
Hendriks, M.P.M., Armbruster, D., Laumanns, M., Lefeber, E., & Udding, J.T. (2008). Design ofrobust distribution networks run by fourth party logistic service providers, preprint TUEindhoven, submitted.
Kwon, S., Park, K., Lee, C., Kim, S., Kim, H., & Liang, Z. (2006). Supply chain network designand transshipment hub location for third party logistics providers. In Lecture notes incomputer science (Vol. 3982, p. 928–933). Springer Berlin/Heidelberg.
Meepetchdee, Y., & Shah, N. (2007). Logistical network design with robustness and complexityconsiderations. Int J Phys Distrib, 37 (3), 201–222.
Topaloglu, H. (2005). An approximate dynamic programming approach for a product distributionproblem. IIE Trans, 37, 697–710.
Tsiakis, P., Shah, N., & Pantelides, C. (2001). Design of multi-echelon supply chain networksunder demand uncertainty. Ind Eng Chem Res, 40, 3585–3604.
Wasner, M., & Zapfel, G. (2004). An integrated multi-depot hub-location vehicle routing modelfor network planning of parcel service. Int J Prod Econ, 90, 403–419.
Structural Properties of Third-Party Logistics Networks 13

Development of a Computational Systemto Determine the Optimal Bus-stopSpacing in order to Minimize the TravelTime of All Passengers
Homero F. Oliveira, Mirian B. Gonçalves, Eduardo S. Cursiand Antonio G. Novaes
1 Introduction
One of the main concerns regarding urban planning nowadays is public trans-portation. The great number of vehicles in the main cities has been causing manyproblems, from infrastructure (number of vehicles over street capability), troughsafety (high accident rates) and environmental issues (high pollution rates), amongothers. In infrastructure, one of the problems caused by the large number ofvehicles on the streets is the travel time between two locations.
These problems aggravate specially in big cities, where traffic jams havealready become part of the urban landscape.
However, one of the main aspects to be considered in a public transportationsystem is the travel time of the passenger using a bus line. The number of stopsaffects the total travel time deeply. In this manner, the number stops must bechosen very carefully, in a way that the bus lines become more appealing to the
H. F. Oliveira (&)Universidade Estadual do Oeste do Paraná–Campus de Toledo, Caixa Postal 520,Toledo, Paraná, CEP 85903-000, Brazile-mail: [email protected]
M. B. Gonçalves and A. G. NovaesDepartamento de Engenharia de Produção e Sistemas, Universidade Federal de SantaCatarina–UFSC, Florianópolis, SC, Brazil
M. B. Gonçalvese-mail: [email protected]
A. G. Novaese-mail: [email protected]
E. S. CursiLaboratoire de Mécanique de Rouen (LMR), Institut National des Sciences Appliquéesde Rouen–INSA Rouen, 76801 Saint-Étienne-du-Rouvray Cedex, Francee-mail: [email protected]
H.-J. Kreowski et al. (eds.), Dynamics in Logistics,DOI: 10.1007/978-3-642-11996-5_2, � Springer-Verlag Berlin Heidelberg 2011
15
users. With a large number of stops, the user walks very little, but it makes the triptoo long and unpleasant for those who travel a long distance in that line. On theother hand, too few stops make the trip faster, but the passengers also have to walkmore to get to the bus-stop, as well as to the final destination.
Ammons (2001) studied various spacing patterns between bus-stops around theworld and concluded that the average spacing is from 200 to 600 m in urban areas.Reilly (1997) noticed that the European traffic departments have different stan-dards to determine the spacing between bus-stops. In Europe, there are 2–3 stopsper kilometer, which means that the spacing is from 330 to 500 m, in opposition toUnited States standards, where the stops are spaced from 160 to 250 m.
These studies show that the distance between stops does not follow a scientificprocedure, or even based on predefined methodological studies. According toKehoe (2004), in many routes along the USA, the bus-stops were defined troughtime, as a result of user’s requests to authorities and/or bus companies. Because thestops were based on citizen’s needs, altering the distance between stops becomes acomplicated process, for the population has already grown accustomed to theoriginal spacing.
These remarks lead to the following question:How will the ideal number of stops be determined in order to optimize the line
for the users?To answer this question we combined the concepts of non-linear programming
(Frielander 1994) and Voronoi diagram. Voronoi diagrams has been around for atleast four centuries, and many relevant material can be found in many areas, suchas anthropology, archeology, astronomy, biology, cartography, chemistry, com-putational geometry, ecology, geography, geology, marketing, meteorology,operations research, physics, remote sensing, statistics, and urban and regionalplanning (Novaes 2000).
The concept of Voronoi Diagram is very simple. Given a finite set of distinct,isolated points in a continuous space, we associate all locations in that space withthe closest member of the point set. The result is a partitioning of the space in a setof regions where each region is related to only one of the points of the original set.
Since the 1970s, algorithms for computing Voronoi diagrams of geometricprimitives have been developed in computational geometry and related areas. Thereare several ways to construct a Voronoi diagram. One of the most practical is theincremental method, described in Novaes (2000). This method is also one ofthe most powerful in the subject of numerical robustness. The total time complexityfor this method is of O(n2). However, the average time complexity can be decreasedto O(n) by the use of special data structures as described in Novaes (2000), p. 264.
2 Concepts of Voronoi Diagram
In this section we will define the main concepts and some properties of VoronoiDiagrams. The concepts presented in this section were based in Okabe et al.(1992).
16 H. F. Oliveira et al.
2.1 Definition of a Planar Ordinary Voronoi Diagram
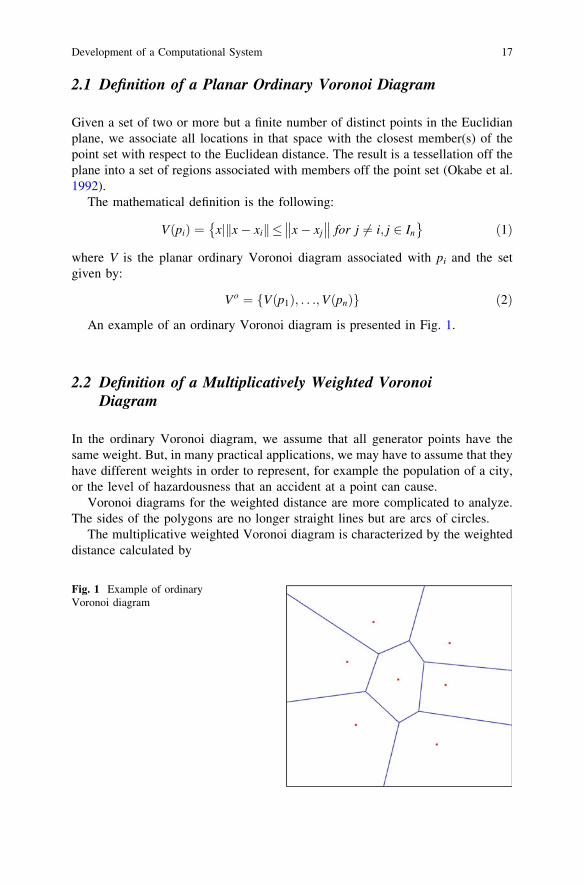
Given a set of two or more but a finite number of distinct points in the Euclidianplane, we associate all locations in that space with the closest member(s) of thepoint set with respect to the Euclidean distance. The result is a tessellation off theplane into a set of regions associated with members off the point set (Okabe et al.1992).
The mathematical definition is the following:
VðpiÞ ¼ xj x� xik k� x� xj
�� �� for j 6¼ i; j 2 In
� �ð1Þ
where V is the planar ordinary Voronoi diagram associated with pi and the setgiven by:
Vo ¼ Vðp1Þ; . . .;VðpnÞf g ð2Þ
An example of an ordinary Voronoi diagram is presented in Fig. 1.
2.2 Definition of a Multiplicatively Weighted VoronoiDiagram
In the ordinary Voronoi diagram, we assume that all generator points have thesame weight. But, in many practical applications, we may have to assume that theyhave different weights in order to represent, for example the population of a city,or the level of hazardousness that an accident at a point can cause.
Voronoi diagrams for the weighted distance are more complicated to analyze.The sides of the polygons are no longer straight lines but are arcs of circles.
The multiplicative weighted Voronoi diagram is characterized by the weighteddistance calculated by
Fig. 1 Example of ordinaryVoronoi diagram
Development of a Computational System 17
dmwðp; piÞ ¼1wijjx� xijj; wi [ 0 ð3Þ
where wi is the weight associated with each point i. After a few steps of calcu-lation, we obtain a bisector that is defined by
bðpi; pjÞ ¼ xj x� w2i
w2i � w2
j
xj þw2
j
w2i � w2
j
xi
�����
����� ¼wiwj
w2i � w2
j
xj � xi
�� ��( )
ð4Þ
This bisector is the set of points that satisfy the condition that the distance fromp to the point defined by
w2i xj
w2i � w2
j
�w2
j xi
w2i � w2
j
ð5Þ
is constant. The bisector is a circle in R2. So, the dominance region of pi over pj
with the weighted distance is written by:
Domðpi; pjÞ ¼ x :1wijjx� xijj �
1wjjjx� xjjj
� �; i 6¼ j ð6Þ
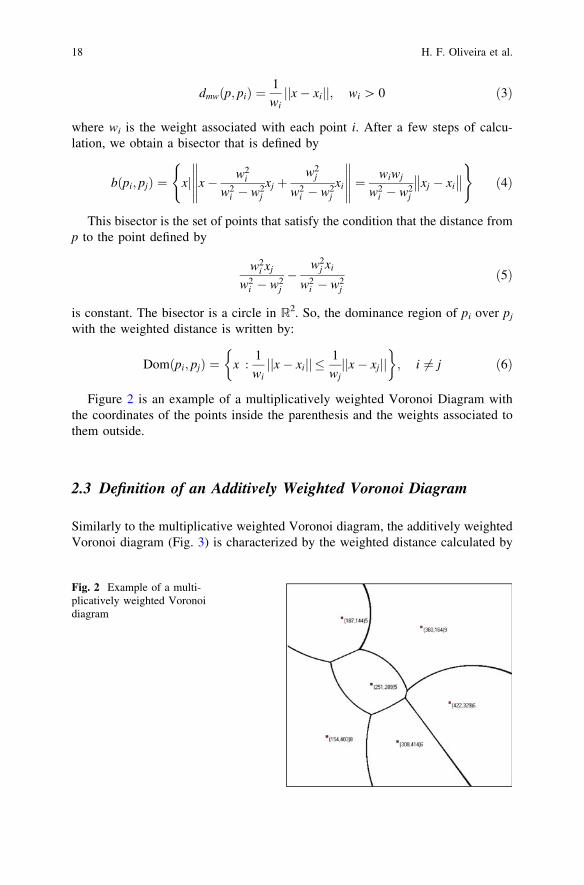
Figure 2 is an example of a multiplicatively weighted Voronoi Diagram withthe coordinates of the points inside the parenthesis and the weights associated tothem outside.
2.3 Definition of an Additively Weighted Voronoi Diagram
Similarly to the multiplicative weighted Voronoi diagram, the additively weightedVoronoi diagram (Fig. 3) is characterized by the weighted distance calculated by
Fig. 2 Example of a multi-plicatively weighted Voronoidiagram
18 H. F. Oliveira et al.