dynamics of seeded aβ -fibril growth from atomistic ... · pdf filedynamics of seeded...
TRANSCRIPT

Dynamics of Seeded Aβ40-Fibril Growth from Atomistic MolecularDynamics Simulations: Kinetic Trapping and Reduced Water Mobilityin the Locking StepNadine Schwierz,*,† Christina V. Frost,‡ Phillip L. Geissler,† and Martin Zacharias‡
†Chemistry Department, University of California, Berkeley, California 94720, United States‡Physik Department, Technische Universitat Munchen, 85748 Garching, Germany
*S Supporting Information
ABSTRACT: Filamentous β-amyloid aggregates are crucial for thepathology of Alzheimer’s disease. Despite the tremendous biomedicalimportance, the molecular pathway of growth propagation is notcompletely understood and remains challenging to investigate bysimulations due to the long time scales involved. Here, we apply extensiveall-atom molecular dynamics simulations in explicit water to obtain freeenergy profiles and kinetic information from position-dependent diffusionprofiles for three different Aβ9−40-growth processes: fibril elongation bysingle monomers at the structurally unequal filament tips and association oflarger filament fragments. Our approach provides insight into the molecularsteps of the kinetic pathway and allows close agreement with experimentalbinding free energies and macroscopic growth rates. Water plays a decisive role, and solvent entropy is identified as the maindriving force for assembly. Fibril growth is disfavored energetically due to cancellation of direct peptide−peptide interactions andsolvation effects. The kinetics of growth is consistent with the characteristic dock/lock mechanism, and docking is at least 2orders of magnitude faster. During initial docking, interactions are mediated by transient non-native hydrogen bonds, whichefficiently catch the incoming monomer or fragment already at separations of about 3 nm. In subsequent locking, the dynamics ismuch slower due to formation of kinetically trapped conformations caused by long-lived non-native hydrogen bonds. Fibrilgrowth additionally requires collective motion of water molecules to create a dry binding interface. Fibril growth is furtherretarded due to reduced mobility of the involved hydration water, evident from a 2-fold reduction of the diffusion coefficient.
■ INTRODUCTION
Self-assembly of peptides into ordered amyloid fibrils isassociated with several neurodegenerative diseases includingParkinson’s, Huntington’s and Alzheimer’s disease.1−3 InAlzheimer’s disease, the key component of the pathologicalaggregates is the so-called Aβ peptide resulting from thecleavage of the amyloid precursor protein, with Aβ1−40 beingthe most abundant isoform. Despite the tremendousbiomedical importance of amyloid fibrils, the molecularmechanism and the dynamic pathway involved in theirformation has remained elusive and challenging to investigatein experiments and simulations. At the same time, thequantitative understanding of the mechanism driving thetransition from monomer to fibril is essential for an efficientdesign of tailored drugs.The characteristic cross-β structure of Aβ1−40 fibrils has been
resolved by NMR experiments4,5 and the structural stability ofthe fibrils has been characterized.6,7 For several subfragments ofthe Aβ1−40 peptide, the formation of stable amyloid fibrils hasbeen observed, including Aβ9−40 which lacks the first 8 N-terminal residues.7 The formation of Aβ fibrils involves anucleation step and a subsequent elongation process in whichAβ monomers are added to the fibril tips. The elongation
process has been studied intensively in kinetic experiments.8−16
On the basis of these experimental results, a two-stepelongation process has been suggested.8,10,17 It involves rapidassociation of the unstructured monomer to the fibril(docking), followed by significantly slower conformationalrearrangements to precisely accommodate the monomer intothe underlying ordered fibril structure (locking). The seconddistinct mechanism that is essential for controlling the kineticsof growth is fibril breakage, which increases the number of endsacting as new elongation sites.18,19 The design of inhibitors offibril formation, as well as the design of fibril based materials,requires a detailed understanding of the mechanism of fibrilpropagation at atomic detail.To complement kinetic experiments, molecular simulations
are well suited to provide insight into the role of sequence,water and specific interactions underlying the elementarykinetic steps in the aggregation pathway. However, due to theslow time scales involved in fibril association and especially indissociation in combination with large system sizes, simulationsof the full kinetic pathway in all-atom resolution and with
Received: August 17, 2015
Article
pubs.acs.org/JACS
© XXXX American Chemical Society A DOI: 10.1021/jacs.5b08717J. Am. Chem. Soc. XXXX, XXX, XXX−XXX
explicit water are tremendously challenging. For example,experiments indicate that the time scale for Aβ monomerdissociation from fibrils occurs on the order of seconds toseveral minutes.8,10,11 Still, significant insight into themechanism of fibril formation can be gained from coarse-grained20−22 and implicit water simulations23,24 as well as fromatomistic simulations of short fragments of the Aβ peptide andother proteins.17,25,26 In order to overcome the computationaltime scale limit, hybrid-approaches with a united atomrepresentation of the peptides and a coarse-grained model ofthe solvent have been employed.27 Implicit solvent simu-lations24 and hybrid-approaches27 allow extensive sampling;however, the role of solvent molecules for the associationapproach and the balance between (solvent) entropic andenergetic contributions to amyloid formation may not beaccurately represented. Alternatively, it is also possible toemploy advanced sampling techniques like transition pathsampling,28 or combine simulations with experimental dataobtained from two-dimensional spectroscopy.29
In the present study, we use extensive atomistic simulationsin explicit solvent and a two-step approach to resolve boththermodynamic and kinetic aspects of fibril growth. This allowsus to investigate the elementary steps of different fibril growthprocesses with atomistic resolution and to gain insight into thedynamic pathway, using the Aβ9−40 peptide as a model system.In the first step of our approach, we calculate the free energyprofile for fibril elongation by a single monomer at the twoasymmetric filament tips and for the association of two largerfibril fragments. We further characterize the molecular stepsunderlying the free energy profiles by elucidating associatedconformational changes, formation and breakage of native andnon-native hydrogen bonds and analyzing the role of watermolecules involved in the assembly process. During the initialdocking phase, the approaching monomer or fragment starts tointeract with the filament already at a peptide-tip distance >2.5nm. These initial interactions are mediated by transient, mostlynon-native hydrogen bonds and other non-native contacts.Formation of such contacts is possible due to the largeconformational flexibility of the peptides.The forces driving filament formation are investigated in a
detailed enthalpy/entropy decomposition. Surprisingly, thecalculations indicate that filament elongation is overallenergetically disfavored but favored entropically, despite thelarge reduction of possible peptide conformational freedomupon association. However, monomer binding to the filamenttip has also a substantial influence on the aqueous solventstructure, resulting in a dominant role of solvent entropy as themain driving force for assembly.In the second step of our approach, we extract kinetic
information from our simulations by determining the position-dependent diffusion profile of the approaching monomer orfibril fragment. Starting in the initial docking phase, thediffusivity rapidly decreases upon further approach to thebound state, thus limiting the speed of the growth process. Inour theoretical framework, a combination of diffusion and freeenergy profile uniquely determines the dynamics of fibrilgrowth and allow us to estimate kinetic rates. The dissociationrates calculated from our approach agree well with experimentalresults and the predicted kinetic pathway is consistent with thedock/lock mechanism suggested from kinetic experiments. Adetailed analysis of the motion of water molecules close to thebinding site reveals a 2-fold reduction of water mobilityindicating a substantial contribution of water-mediated
interactions to the association process. Finally, we elucidatethe molecular mechanism underlying the slow dynamics in thelimiting locking step.
■ METHODSAtomistic Model and Simulation Setup. In this work, we study
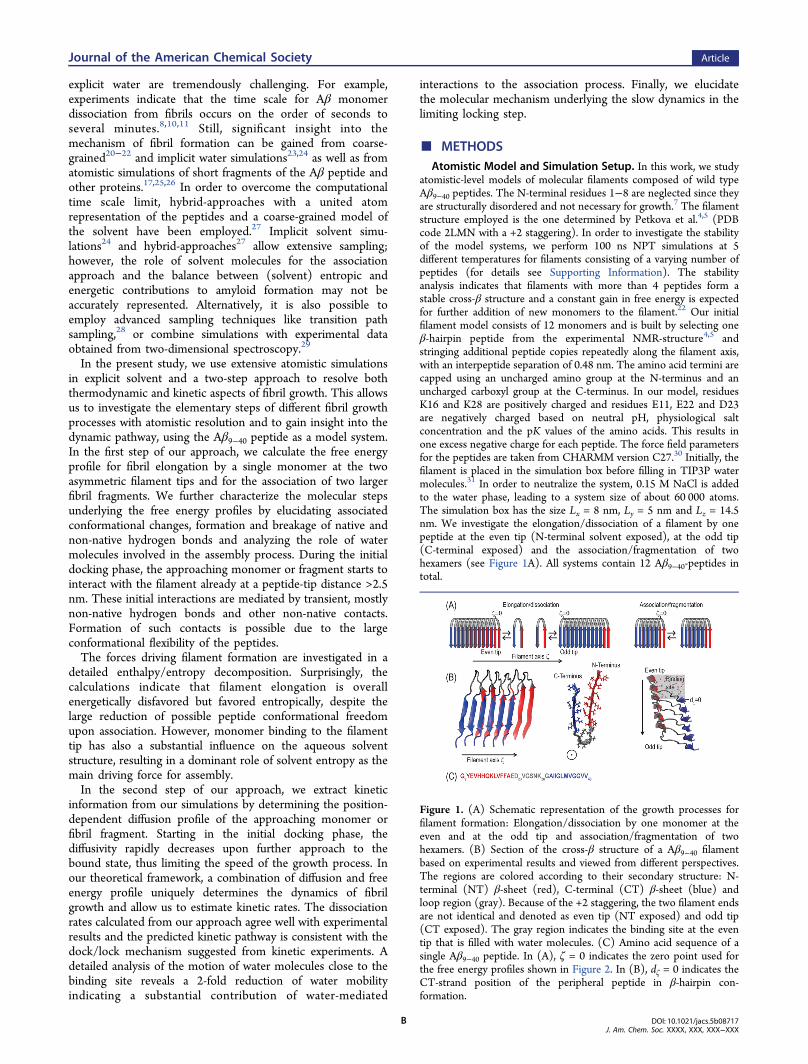
atomistic-level models of molecular filaments composed of wild typeAβ9−40 peptides. The N-terminal residues 1−8 are neglected since theyare structurally disordered and not necessary for growth.7 The filamentstructure employed is the one determined by Petkova et al.4,5 (PDBcode 2LMN with a +2 staggering). In order to investigate the stabilityof the model systems, we perform 100 ns NPT simulations at 5different temperatures for filaments consisting of a varying number ofpeptides (for details see Supporting Information). The stabilityanalysis indicates that filaments with more than 4 peptides form astable cross-β structure and a constant gain in free energy is expectedfor further addition of new monomers to the filament.22 Our initialfilament model consists of 12 monomers and is built by selecting oneβ-hairpin peptide from the experimental NMR-structure4,5 andstringing additional peptide copies repeatedly along the filament axis,with an interpeptide separation of 0.48 nm. The amino acid termini arecapped using an uncharged amino group at the N-terminus and anuncharged carboxyl group at the C-terminus. In our model, residuesK16 and K28 are positively charged and residues E11, E22 and D23are negatively charged based on neutral pH, physiological saltconcentration and the pK values of the amino acids. This results inone excess negative charge for each peptide. The force field parametersfor the peptides are taken from CHARMM version C27.30 Initially, thefilament is placed in the simulation box before filling in TIP3P watermolecules.31 In order to neutralize the system, 0.15 M NaCl is addedto the water phase, leading to a system size of about 60 000 atoms.The simulation box has the size Lx = 8 nm, Ly = 5 nm and Lz = 14.5nm. We investigate the elongation/dissociation of a filament by onepeptide at the even tip (N-terminal solvent exposed), at the odd tip(C-terminal exposed) and the association/fragmentation of twohexamers (see Figure 1A). All systems contain 12 Aβ9−40-peptides intotal.
Figure 1. (A) Schematic representation of the growth processes forfilament formation: Elongation/dissociation by one monomer at theeven and at the odd tip and association/fragmentation of twohexamers. (B) Section of the cross-β structure of a Aβ9−40 filamentbased on experimental results and viewed from different perspectives.The regions are colored according to their secondary structure: N-terminal (NT) β-sheet (red), C-terminal (CT) β-sheet (blue) andloop region (gray). Because of the +2 staggering, the two filament endsare not identical and denoted as even tip (NT exposed) and odd tip(CT exposed). The gray region indicates the binding site at the eventip that is filled with water molecules. (C) Amino acid sequence of asingle Aβ9−40 peptide. In (A), ζ = 0 indicates the zero point used forthe free energy profiles shown in Figure 2. In (B), dζ = 0 indicates theCT-strand position of the peripheral peptide in β-hairpin con-formation.
Journal of the American Chemical Society Article
DOI: 10.1021/jacs.5b08717J. Am. Chem. Soc. XXXX, XXX, XXX−XXX
B

To monitor the progress in binding, we use the separationcoordinate ζ, defined by the center of mass distance along the filamentaxis between the monomer (hexamer) and the first peptide at therespective filament tip. The motion of the monomer and hexamerperpendicular to ζ remains unrestrained. Positional restraints areapplied to the last peptide at the filament tip where the elongationprocess takes place. These restraints prevent twisting motions, therebymimicking larger filaments with a structurally stable binding site.In order to generate starting conformations for the umbrella
sampling simulations, an additional idealized U-shaped monomer orhexamer is placed into the simulation box and aligned along thefilament axis using an initial separation of n × dn + d0, where n is thewindow number, dn the window spacing and d0 = 0.48 nm the initialpeptide separation in the NMR structure. We choose this lateraldisplacement method to generate the umbrella starting conformationssince the commonly used pulling algorithm requires breaking ofhydrogen-bonds in adjacent β-sheets. In order to generate usefulstarting conformations, very small pulling velocities (v≪ 0.1 m/s) andlong subsequent equilibration would be necessary.32 On the otherhand, the β-hairpin conformation of the monomer used here providesa useful starting conformation since it is suggested to be an on-pathway intermediate structure.27
The molecular dynamics simulations at fixed particle number N,pressure P and temperature T are performed using the Gromacssimulation package, version 4.6.1.33 Periodic boundary conditions areapplied and the particle-mesh Ewald method is used for the periodictreatment of Coulomb interactions. The bonds to hydrogen atoms areconstrained by the LINCS algorithm34 and a 2 fs time step is used. Toequilibrate the system, we first perform an energy minimization withthe steepest descent algorithm. We employ a 200 ps NVT and NPTsimulation as pre-equilibration using the Berendsen scheme. In theproduction run, we perform umbrella sampling simulations with 33windows along the filament axis, employing Nose−Hoover temper-ature coupling with a time constant of τT = 0.5 s−1 and isotropicParrinello−Rahman pressure coupling with a time constant of τp = 5s−1. We use a window width of 0.1 nm for the separation range ζ < 2nm, and 0.2 nm for larger distances. For all windows, an umbrella forceconstant of kζ = 1000 kJ/(mol nm2) is used. For elongation at the oddtip and fragmentation, umbrella simulations are performed for 100 nsper window.In order to test the convergence of the potentials of mean force
(PMF), the elongation simulations at the even filament tip have anextended duration of 150 ns in each window. The simulation data aredivided into two blocks and the PMFs are calculated separately fromeach block. The resulting PMFs are in good agreement and the errorsamount to ±2.2 kBT for elongation at the even tip, ± 3 kBT forelongation at the odd tip and ±2.9 kBT for fragmentation. Theconvergence of the umbrella simulations is discussed in greater detailin the Supporting Information. The PMFs are calculated using theweighted histogram analysis method,35 discarding the first 10 ns forequilibration.Thermodynamic Analysis. Conformational transitions are
quantified using different order parameters: The distance root-mean-square deviation (dRMSD) is calculated for all Cα atoms with respectto the idealized β-hairpin conformation of bound monomers. Tomeasure the compactness of the monomer, the radius of gyration RG iscalculated with respect to the center of mass of the molecule. Bothorder parameters are calculated as average over the last 50 ns in eachumbrella window, and error bars correspond to standard deviations.Changes in secondary structure including the content of β-sheet andcoil structure are calculated using the DSSP algorithm.36
The stability of the cross-β structure upon fragmentation isquantified using the nematic order parameter P2.
37 P2 is calculatedusing the Wordom analysis package.38 For the N-terminal (NT), theatom vector corresponds to the Cα atom vector between residues 17and 21. For the C-terminal (CT), it corresponds to the vector betweenresidues 32 and 36, similar to a work of Buchete and co-workers.6 Thetwo peripheral monomers are omitted from analysis due toconsiderable conformational fluctuations.
The structures resulting from the umbrella simulations are clusteredusing the average-linkage algorithm and the dRMSD of all Cα atomsafter removing rotation and translation with respect to the heavyatoms as the distance for the analysis. The average-linkage algorithm isused for clustering, as it was shown to be one of the most usefulalgorithms for analyzing molecular dynamics trajectories.39 Thesimulation snapshots depict the conformation that corresponds tothe representative of the largest cluster. For the analysis of hydrogenbonds, the standard hydrogen bond definition of Gromacs is used. Itcorresponds to a donor−acceptor distance <0.35 nm and donor-hydrogen-acceptor angle <30°.33
The azimuthal reorientation correlation of the peptide during theumbrella sampling simulations is investigated using the Gromacsgprincipal tool. In each frame, the principle components of themonomer’s moment of inertia tensor are calculated and the orientationof the major axis with respect to a fibril associated axis is used forcalculating time fluctuations and autocorrelation functions.
The total enthalpy and its individual contributions due to peptide−peptide, peptide−solvent and solvent−solvent interactions areextracted as time averages for each umbrella window, discarding thefirst 50 ns for equilibration. In order to obtain the enthalpy differencebetween the bound and the unbound state, the windows are splitaccordingly, neglecting the intermediate region. Hereby, we define thebound region for peptide-fibril separations <0.65 nm and the unboundregion for separations >3.2 nm. The average energy of each state isthen calculated as a weighted average over all bound and unboundconformations. Statistical uncertainties are determined using the errorestimate method.40 Insight into the various energetic contributionsstemming from interactions of peptide (P) and solvent (S) can begained from the simulations. In a simulation rerun, the system isdivided into the individual components and the energies of theindividual groups are calculated. The individual contributions sum upto the total enthalpy according to H ≈ UPP + USS + UPS + pV. Thesmall group of ions is omitted from analysis. Note that a furtherdecomposition of the pV contribution is not feasible. However, itmakes up only an negligibly small contribution of about 0.1 kBT to thetotal enthalpy difference. Further information on the energydecomposition is provided in the Supporting Information.
Additional unbiased 300 ns simulations are performed to analyzethe motion of the water molecules in the cavity of the filament. Thelateral diffusion coefficient is calculated from the mean squaredisplacement of the x- and y-coordinates of the water oxygens (seeSupporting Information for details).
Position-Dependent Diffusion Profile. In the following, wemodel the dynamics of fibril growth as diffusion in a one-dimensionalfree energy profile. We assume that the stochastic time evolution of thepeptide-filament separation coordinate ζ is given by the one-dimensional Fokker−Planck (FP) equation41
ζζ
ζζ
ζ∂∂
Ψ = ∂∂
∂∂
Ψβ ζ β ζ−
tt D e t e( , ) ( ) ( , )G G( ) ( )
(1)
where Ψ(ζ, t) is the probability distribution of the separation ζbetween peptide and fibril at time t, D(ζ) is the position-dependentdiffusion profile, G(ζ) is the free energy profile along ζ calculated fromumbrella sampling simulations and β = 1/kBT. Note that as aconsequence of the projection of the high dimensional dynamics ontoour one-dimensional separation coordinate, the diffusion coefficientD(ζ) depends on the value of ζ. Changes in the diffusion coefficientare therefore a signature of the degrees of freedom perpendicular to ζthat influence the kinetics.
For a sufficiently narrow harmonic umbrella potential, the position-dependent diffusion profile can be calculated directly from thesimulation data in each umbrella window42,43
ζ σ ζτ
=D( )( )2
(2)
where σ2(ζ) = ⟨ζ2⟩ − ⟨ζ⟩2 is the variance and τ is the integratednormalized autocorrelation function C(t) = ⟨ζ(t)ζ(0)⟩ − ⟨ζ(t)⟩⟨ζ-(0)⟩/σ2(ζ). From a simulation trajectory with n data points ζi, the
Journal of the American Chemical Society Article
DOI: 10.1021/jacs.5b08717J. Am. Chem. Soc. XXXX, XXX, XXX−XXX
C
average separation ζ = ∑ζi/n is used to replace ⟨ζ⟩. Note that theestimation of ⟨ζ⟩, C(t) and τ is only reliable if C(t) vanishes on timescales shorter than the simulation time. Under this assumption τ canbe calculated from44
τ σ ζσ ζ
≈ − Δ⎡⎣⎢
⎤⎦⎥
nt
( )( )
1 /22
2(3)
where Δt is the time interval between the data points. A reliablemethod to calculate the variance of the average separation σ2(ζ) isblock averaging developed by Petersen and co-workers.44 Alternatively,σ2(ζ) can be calculated from the error estimate method assuming adouble exponential decay of the correlation function.40 The differencebetween the error estimate method and the result from blockaveraging using 4 data blocks is used to determine the error of D(ζ).Further details on the calculation of σ2(ζ) and the correlation functionare given in the Supporting Information.In general, our two-step approach allows us to separate effects
arising from the curvature in the free energy profile and the localdiffusion coefficient. Note also that the diffusion coefficient could inprinciple be calculated from the variance σ2(Δt) ≈ 2D(ζ)Δt after ashort time Δt. However, for the one-dimensional Fokker−Planckequation to be valid, the projected dynamics has to be Markovian, i.e.,without memory. In order to minimize possible errors due to memoryeffects, we use the full data set of trajectories (100 ns per window) forcalculating D(ζ).Rescaling of the Free Energy Profile. Using a combination of
free energy and diffusion profiles results in a kinetic quasi-universality.Specifically, the Fokker−Planck equation (eq 1) is invariant underrescaling of the coordinate q = q(ζ), provided that the functions Ψ, Gand D are rescaled simultaneously.45−47 Conversely, a constantdiffusion profile D(ζ ) = D0 can be obtained by choosing
∫ζ ζ ζ= ′ ′ζ
ζq D D( ) d / ( )0
0 (4)
and rescaling the free energy profile G(q) = G(ζ) − ln(D(ζ)/D0)/2β.With this rescaling, regions in which the kinetics along the originalseparation coordinate ζ are slow become stretched in the rescaledcoordinate q(ζ). More importantly, the rescaled free energy profilenow contains the full information on the kinetics and may showintermediate states that remained hidden in the original coordinate ζ.Binding Free Energy, Mean First Passage Time and Rate
Constants. We consider the binding process F + P ↔ FP of afilament (F) and peptide (P) in dilute solution. Its equilibrium stateobeys a law of mass action
=k[FP]
[F][P]EQ (5)
where [i] denotes the concentration of species i. The equilibriumconstant kEQ for peptide binding can be computed from simulationsthrough the reversible work function w(x,y,ζ) for the vector separationbetween filament and peptide (with Cartesian components ζ, x, andy):48
∫ ∫ ∫ ζ θ ζ= β ζ−k x y e x yd d d ( , , )w x yEQ
( , , )b (6)
where we have set w = 0 at infinite separation. The characteristicfunction θb(x,y,ζ) is unity for values of x, y, and ζ corresponding to thebound state, and vanishes otherwise. Provided that w(x,y,ζ) possessesa deep minimum at contact and decays over microscopic length scales(as confirmed by simulation results described later), the detailedchoice of θb(x,y,ζ) is unimportant. We require only that the volume inwhich θb = 1 encompasses typical fluctuations of the bound state, andthat it be microscopic in scale. With this freedom, we make theconvenient choice that θb = 1 only when −Lx/2 < x < Lx/2, −Ly/2 < y< Ly/2, and ζB < ζ < ζS, where ζB is the separation at minimum G(ζ)and ζS is the smallest separation for which G(ζ) ≈ 0. This volumespans the lateral dimensions of our simulation cell and includes all
points at which w(x,y,ζ) is appreciably nonzero. The calculation of kEQthen reduces to a simple integral,
∫ ζζζ
=ζ
ζk L L
PP
d( )( )x y
SEQ
sim
simB
S
(7)
of the separation probability distribution Psim(ζ) obtained fromsimulations within our microscopic cell. We discuss this distribution interms of the corresponding free energy profile G(ζ) = kBT ln [Psim(ζ)/Psim(ζS)] for reversible changes in peptide-filament separation. Tofacilitate comparison with experiments, we compute as well a freeenergy of binding,
Δ =G k T c kln[ ]Bind B0
EQ (8)
whose value depends on the arbitrary choice of standard stateconcentration c0. Consistent with experimental reports, we choose c0 =1 mol/L = (1.661 nm3)−1. The binding and unbinding rate constantsfor a monomer or hexamer at the filament tip can be related to thedynamics of ζ at microscopically small separation. Specifically, thesekinetic parameters are determined by waiting times for binding andescape when ζ is confined to the interval ζB < ζ < ζS. For the diffusivedynamics of eq 1 subject to these boundary conditions, the mean firstpassage time τub for unbinding (i.e., the average time required fortrajectories initiated at ζ = ζB to first reach ζS) is given by49
∫ ∫τ ζζ
ζ= ′′
″ζ
ζ β ζ
ζ
ζβ ζ
′ ′− ″e
Ded
( )d
GG
ub
( )( )
B
S
B (9)
The mean first passage time τb for binding can similarly be determinedas
∫ ∫τ ζζ
ζ= ′′
″ζ
ζ β ζ
ζ
ζβ ζ
′
′
− ″eD
ed( )
dG
Gb
( )( )
B
S S
(10)
From these microscopic mean first passage times and the equilibriumconstant (eq 7), we can identify microscopic rate constants for bindingand unbinding valid for reaction within a small cage of radius ζSaround the filament
τ= =+k k k k
1;off
micro
ub
microEQ off
micro
(11)
The concentration [Fj] of fibrils of length j is expected to follow aphenomenological rate equation
= − + + −+ + + −F
tk M F k F k M F k F
d[ ]
d[ ][ ] [ ] [ ][ ] [ ]j
j j j joff 1 1 off
(12)
In order to establish a connection between the experimentallyaccessible macroscopic rates k+ and koff and the microscopic ratesbased on first passage times, we must account for the time-dependentspatial distribution of the peptides. By balancing the flux of peptides atsteady state, we can derive expressions for the overall rate constants k+and koff
50
=+
=+
π ζ π ζ
++
+ +k
kk
k
1;
1kD
kD
micro
4
offoffmicro
4S S
micro micro
(13)
In the limit k+micro ≪ 4πDζS, i.e., if the binding of the peptide is much
slower than the rate of filament-peptide encounters, the overall rate isgiven by k = kmicro. In the limit k+
micro ≫ 4πDζS, i.e., if the binding is fastcompared to the encounter rate by diffusion, the rate is diffusioncontrolled. The overall rate is then given by k = 4πDζS. Table 1 lists allcomputed rates including the diffusion limit for Aβ9−40 filament growthby addition of a single monomer or by the association of two hexamerfragments. Note that we neglect the diffusion of the fibril for monomerbinding (D corresponds to the calculated diffusion coefficient for asingle monomer in bulk). For fragmentation D is the sum of diffusioncoefficients of the two hexamer fragments in bulk.
In general, the kinetics of fibril growth can be modeled using amaster equation description, in which the fibers can undergo end-to-
Journal of the American Chemical Society Article
DOI: 10.1021/jacs.5b08717J. Am. Chem. Soc. XXXX, XXX, XXX−XXX
D

end association, elongation, fragmentation, and primary nucleation. Toensure that the entropy production rate is finite, any consistent modelfor growth must consider all possible reaction pathways that lead tothe formation of fibrils of a certain length together with their reverseprocesses to obey detailed balance.19 The requirement to satisfydetailed balance allows us to determine the rate of primary nucleationto be kn[M]nc based on the rates of elongation and fragmentationobtained from our simulations according to19
= kk
kk
2( )n
noff
EQEQ
c
(14)
From experimental data, the reaction order for nucleation has beenestimated as nc = 2,14 a value we adopt as well for the purpose ofcomparison. Here, kEQ is the equilibrium constant for association/fragmentation of large filament fragments.
■ RESULTS AND DISCUSSIONThe present study focuses on the three different growthprocesses that are relevant for the kinetics of Aβ9−40 filamentsgrowth propagation: the elongation by a single monomer at thetwo structurally different filament tips and the association oftwo hexamers (see illustration in Figure 1A). The filamentstructure exhibits a U-shaped, strand−loop−strand (β-hairpin)conformation characteristic for Aβ fibrils4,5 and is illustrated inFigure 1B. According to its secondary structure, each peptide isdivided into three regions: The N-terminal (NT) β-strandincluding the central hydrophobic region L17-A21, the loopregion including the D23-K28 salt-bridge, and the C-terminal(CT)β-strand. Because of the internal +2 staggering of the β-sheet, the two filament ends are not identical: On one tip, theNT region is left unpaired and solvent exposed (even tip); atthe other tip, the CT region is left unpaired (odd tip). In thefollowing, “filament” refers to structures with peptides arrangedin one molecular layer along the filament axis (see Figure 1).“Fibril” refers to structures consisting of two or more filamentsarranged in several layers.In the following sections, we first present the free energy
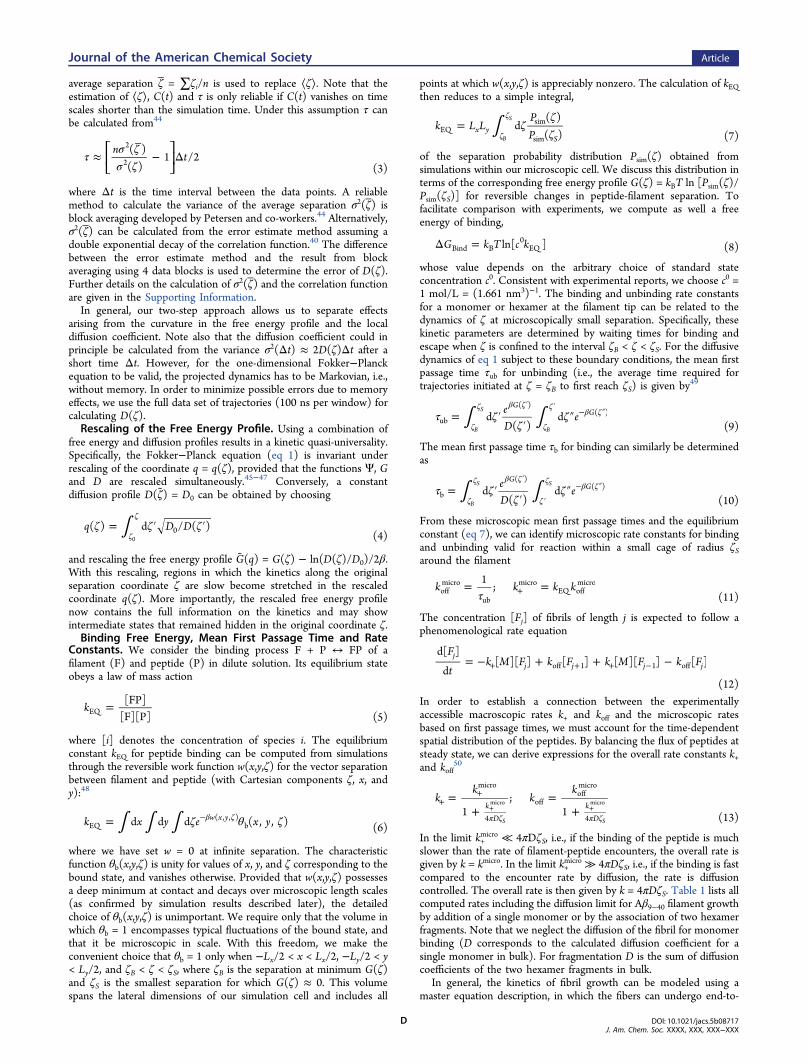
profiles for filament growth by monomer addition at bothfilament ends and by association of larger fragments. Theunderlying structural transitions are then characterized byanalyzing the conformational changes, the formation andbreakage of native and non-native hydrogen bonds as well asthe collective motion of water molecules to create a dry bindinginterface upon assembly. The forces driving filament formationare subsequently analyzed in an energy/entropy decomposi-tion. Finally, we present the calculated diffusion profiles andrescaled free energy profiles, which contain the full kineticinformation and reveal characteristics of the dock/lockmechanism.Free Energy Profile for Filament Growth. Figure 2
shows the free energy profile G(ζ) for the three different
growth processes along the peptide-filament separation ζ: Forfilament elongation by a Aβ monomers at the even and oddfibril tip (Figure 2A, B) and for association of two hexamers(Figure 2C). The binding affinities are calculated from theequilibrium constants (eq 7, 8), adopting the standard stateconvention c0 = 1 mol/L. The calculated binding affinitiesamount to 22.8 ± 2.2 kBT and 24.9 ± 3 kBT for filamentelongation at the even and odd tip, respectively. Within theestimated error, the results agree with the expectation that bothfree energy changes should be identical since initial and finalstates of the association process at either tip are identical. Thecalculated affinities are more favorable, but still comparable tothe experimental value of 15.2 kBT
11 and match theexperimental value much more closely than previous all-atomsimulations (85.2 kBT).
51 An analysis of the orientational androtational correlation of the monomer relative to the fibril tipreveals sampling of a large variety of relative geometries andrapid rotation of the monomer compared to the time scale ofthe umbrella sampling simulations (Supporting Information,Figure S6).For association of two hexamers, the calculated binding
affinity for this process is significantly larger (47.3 ± 2.9 kBT)compared to monomer association at the filament tips.For all three association processes, the free energy profiles
can be divided into three regions: The locked region in whichpredominantly native hydrogen bonds are formed, anintermediate region in which docking occurs by the formationof non-native hydrogen bonds, and the unbound region. Thelatter corresponds to the absence of interactions between themonomer/hexamer and filament at large distances, resulting ina constant profile within statistical noise (ζ > ζS). In thedocking region, the profiles decrease continuously as themonomer/hexamer approaches the filament (ζS > ζ > ζC). ζCindicates the crossover from the fast docking to the muchslower locking and will be discussed in detail further below.Finally, at small separations, all free energy profiles show apronounced minimum at the peptide−peptide (or hexamer−hexamer) separation found in the NMR structure4,5 (ζB = 0.48nm for elongation and ζB = 1.59 nm for fragmentation).
Structural Transitions in Filament Growth. Duringfilament growth by elongation, the incoming monomer has toundergo a conformational transition from the partiallydisordered state in bulk to the strand−loop−strand β-hairpinconformation in the bound state. In order to fit accurately ontothe filament template, native hydrogen bonds must be formedbetween monomer and filament tip, while non-native hydrogenbonds have to be broken. Typical conformations along the freeenergy profile obtained from a cluster analysis for the threedifferent growth processes are shown in Figure 2A−C. Inagreement with experimental kinetic studies,16 our results show
Table 1. Equilibrium Constant kEQ, Macroscopic Rates koff and k+, Nucleation Rate kn and Microscopic Unbinding τub andBinding Times τb for Aβ9−40 Filament Growth by Addition of a Single Monomer to the Even and Odd Filament Tip or by theAssociation of Two Hexamer Fragmentsa
koff [s−1] k+ [M
−1 s−1] kEQ [M−1] kn [M−1 s−1] τub [s] τb [s]
monomereven tip 1.7 · 10−1 1.5 · 109 8.7 · 109 2.6 · 10−3 4.67 9.9 · 10−6
odd tip 4.9 · 10−2 3.3 · 109 6.7 · 1010 4.4 · 10−2 10.62 2.3 · 10−6
hexamer 1.8 · 10−13 1.9 · 109 1.0 · 1022 − 3 · 1012 1.4 · 10−6
aThe rates are calculated according to eq 11 and 13 with microscopic interaction range ζS = 3.0 nm (monomer) or ζS = 3.8 nm (hexamer) and D =0.0003 nm/ps2 (monomer) and D = 2 × 0.00007 nm/ps2 (hexamer). The diffusion limit for monomer addition is 6.8 · 109 and 4.0 · 109 M−1 s−1 forhexamer association.
Journal of the American Chemical Society Article
DOI: 10.1021/jacs.5b08717J. Am. Chem. Soc. XXXX, XXX, XXX−XXX
E
a wide spectrum of structures the monomer adopts duringdocking (snapshots in Figure 2A, B). Besides non-nativecontacts formed by 1−2 hydrogen bonds, (snapshot 6 in Figure2A), short β-sheets with several non-native hydrogen bondsbetween the accessible filament tip and the monomer areobserved to be a common structural motif upon docking(snapshot 5 in Figure 2A and snapshot 6 in Figure 2B). Varioustypes of β-sheets are observed for the incoming monomer,including parallel and antiparallel as well as in and out ofregister β-sheets. During the simulations in the intermediateregion (0.6−0.8 nm), a non-native hairpin structure isobserved, consisting of correctly paired NT-strands of filamenttip and monomer (parallel, almost in register) and a non-native,antiparallel beta-sheet between the NT- and CT-strand of theincoming monomer (Supporting Information, Figure S7). Avery similar intermediate hairpin structure has been found inprevious implicit solvent simulation studies.24
In the case of elongation at the even tip, initial contactspreferentially involve the CT strand of the monomer and thecentral hydrophobic region of the exposed N-terminal of thefilament tip (vice versa for elongation at the odd tip). Thisagrees with the major pathway from recent studies using acoarse-grained hybrid-resolution model.27 Note that in coarse-grained models, hydrogen bond formation is not included andwe will discuss the important details on hydrogen bondformation in more detail further below.During locking, the bound β-hairpin conformation initiates in
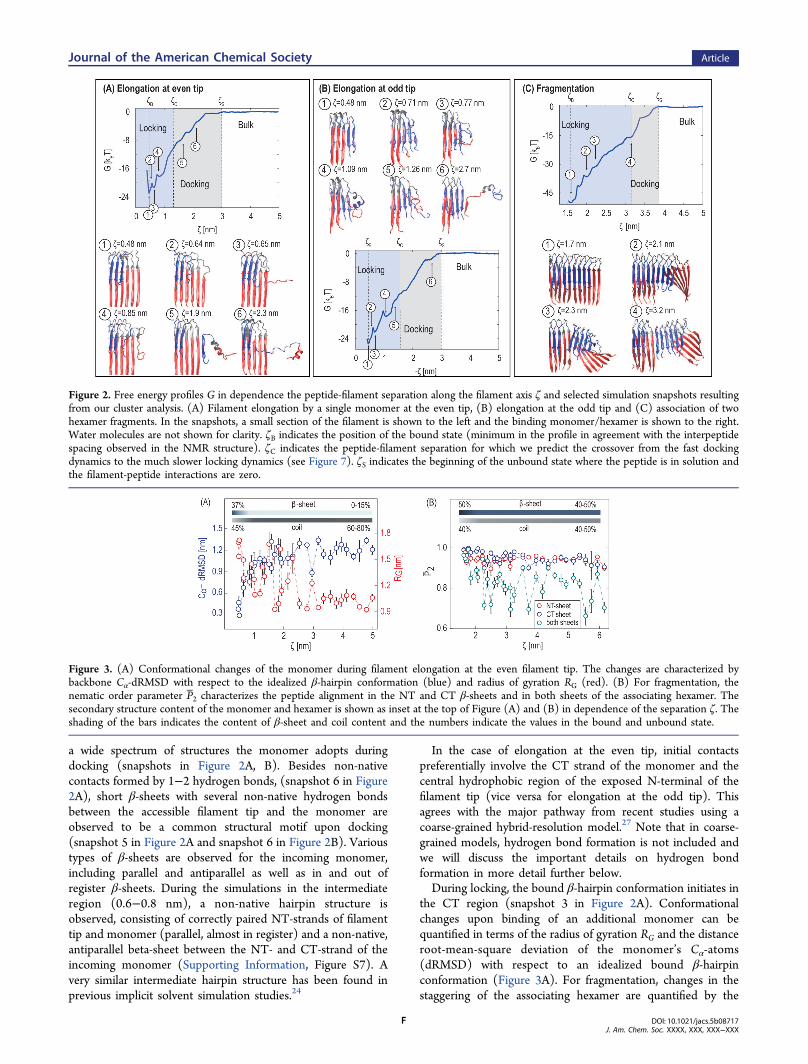
the CT region (snapshot 3 in Figure 2A). Conformationalchanges upon binding of an additional monomer can bequantified in terms of the radius of gyration RG and the distanceroot-mean-square deviation of the monomer’s Cα-atoms(dRMSD) with respect to an idealized bound β-hairpinconformation (Figure 3A). For fragmentation, changes in thestaggering of the associating hexamer are quantified by the
Figure 2. Free energy profiles G in dependence the peptide-filament separation along the filament axis ζ and selected simulation snapshots resultingfrom our cluster analysis. (A) Filament elongation by a single monomer at the even tip, (B) elongation at the odd tip and (C) association of twohexamer fragments. In the snapshots, a small section of the filament is shown to the left and the binding monomer/hexamer is shown to the right.Water molecules are not shown for clarity. ζB indicates the position of the bound state (minimum in the profile in agreement with the interpeptidespacing observed in the NMR structure). ζC indicates the peptide-filament separation for which we predict the crossover from the fast dockingdynamics to the much slower locking dynamics (see Figure 7). ζS indicates the beginning of the unbound state where the peptide is in solution andthe filament-peptide interactions are zero.
Figure 3. (A) Conformational changes of the monomer during filament elongation at the even filament tip. The changes are characterized bybackbone Cα-dRMSD with respect to the idealized β-hairpin conformation (blue) and radius of gyration RG (red). (B) For fragmentation, thenematic order parameter P2 characterizes the peptide alignment in the NT and CT β-sheets and in both sheets of the associating hexamer. Thesecondary structure content of the monomer and hexamer is shown as inset at the top of Figure (A) and (B) in dependence of the separation ζ. Theshading of the bars indicates the content of β-sheet and coil content and the numbers indicate the values in the bound and unbound state.
Journal of the American Chemical Society Article
DOI: 10.1021/jacs.5b08717J. Am. Chem. Soc. XXXX, XXX, XXX−XXX
F
nematic order parameter within each β-sheet and between thetwo sheets (Figure 3B). These order parameters arecomplemented by information on the secondary structurecontent in the bound and unbound state (top of Figure 3A, B).An analysis of types of secondary structures sampled along themonomer-filament separation coordinate indicates that coiledand bend secondary structure dominate in the intermediate andbulk distance range with small and fluctuating amounts of β andα helical conformations (Supporting Information, Figure S8).Monomeric Aβ in bulk can hence be regarded as a disordered,highly flexible peptide without a well-defined three-dimensionalstructure, but with a preference for some conformations. Thesefindings are in agreement with experimental studies whichclassify monomeric Aβ as a partially disordered peptide with acollapsed structure52(see minimum in RG and maximum in coilcontent in secondary structure in Figure 3A).The calculated bulk values of RG around 0.9−1.1 nm are in
good agreement with the range of 0.9−1.2 nm obtained fromvarious simulation studies using different force fields.53−55
Furthermore, the simulated RG agrees with the hydrodynamicradius of 0.9 ± 0.1 nm obtained from single-moleculefluorescence.56 In the intermediate region, the initially compactmonomer unfolds and forms non-native hydrogen bonds withthe filament (increase in RG). In the bound state, the monomeradopts a β-hairpin conformation, evident from the minimum inCα-dRMSD, the maximum in RG, and increase in β-sheetcontent (Figure 3A). The analysis of umbrella samplingwindows reveals sampling of a broad distribution of dRMSD,RG and monomer end-to-end distances in the intermediate andbulk regions indicating that a broad variety of conformations issampled in these regions (Supporting Information, Figure S9).Very similar distributions are obtained from simulations withdifferent monomeric starting conformations (β-hairpin withstagger 0 or 1 instead of 2, see Supporting Information, Figure
S10 and S11). The conformational changes of the monomer atthe odd tip are essentially identical (data not shown).The situation is different for the assembly of two hexamers,
since the two hexamer fragments maintain their cross-βstructure in the growth process, evident from the constant β-sheet content and constant P2 within the NT- and CT-sheet(Figure 3B) or snapshot 4 in Figure 2C. However, the NT andCT regions slide against each other, resulting in a loss of the +2staggering and a decrease in the total P2 (Figure 3B).Compared to protofilament elongation, the minor loss ofconformational entropy upon fragment association maycontribute to the significantly larger binding free energy. Forthe monomer (hexamer), the largest changes in theconformation occur at a short separation around ζc ∼ 1.3 (ζc∼ 2.3 nm) between peptide and filament where the nativehydrogen bonds start to form. The increased disorder aroundthe fibril breakage site has been quantified in terms of adRMSD per monomer from the bound conformation andshows decreasing disorder of monomers with decreasing thedistance from the break site (see Supporting Information,Figure S12). Similar results have been obtained in previoussimulation studies.57,58
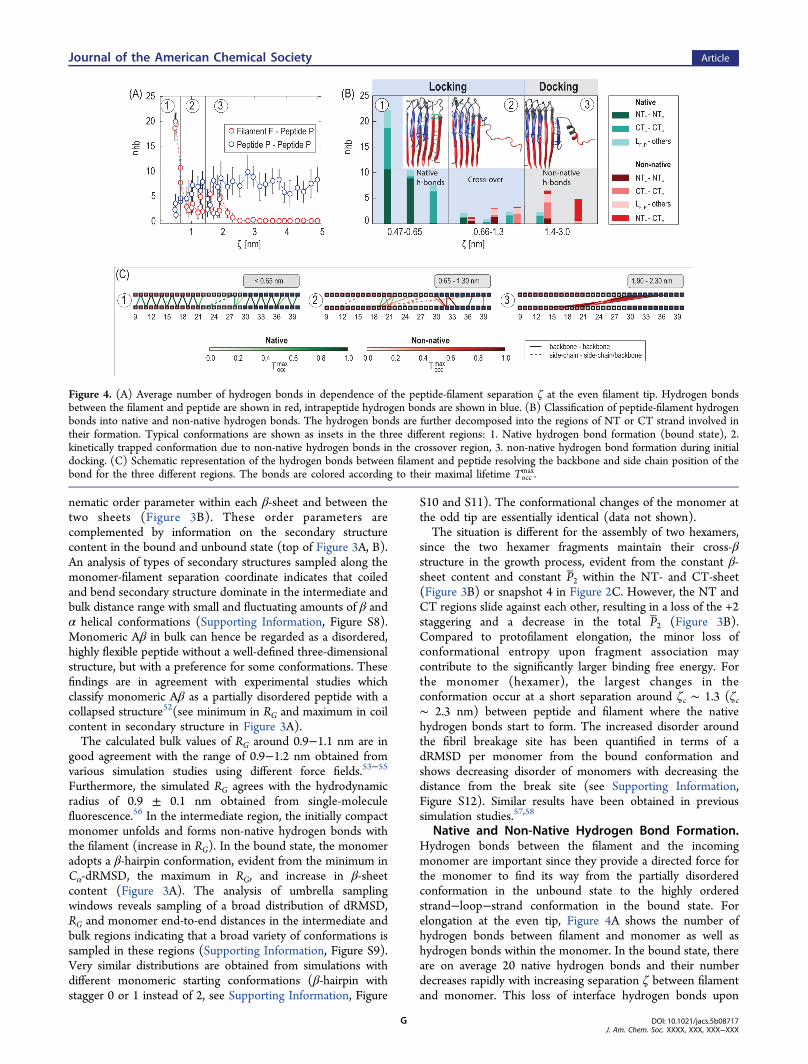
Native and Non-Native Hydrogen Bond Formation.Hydrogen bonds between the filament and the incomingmonomer are important since they provide a directed force forthe monomer to find its way from the partially disorderedconformation in the unbound state to the highly orderedstrand−loop−strand conformation in the bound state. Forelongation at the even tip, Figure 4A shows the number ofhydrogen bonds between filament and monomer as well ashydrogen bonds within the monomer. In the bound state, thereare on average 20 native hydrogen bonds and their numberdecreases rapidly with increasing separation ζ between filamentand monomer. This loss of interface hydrogen bonds upon
Figure 4. (A) Average number of hydrogen bonds in dependence of the peptide-filament separation ζ at the even filament tip. Hydrogen bondsbetween the filament and peptide are shown in red, intrapeptide hydrogen bonds are shown in blue. (B) Classification of peptide-filament hydrogenbonds into native and non-native hydrogen bonds. The hydrogen bonds are further decomposed into the regions of NT or CT strand involved intheir formation. Typical conformations are shown as insets in the three different regions: 1. Native hydrogen bond formation (bound state), 2.kinetically trapped conformation due to non-native hydrogen bonds in the crossover region, 3. non-native hydrogen bond formation during initialdocking. (C) Schematic representation of the hydrogen bonds between filament and peptide resolving the backbone and side chain position of thebond for the three different regions. The bonds are colored according to their maximal lifetime Tocc
max.
Journal of the American Chemical Society Article
DOI: 10.1021/jacs.5b08717J. Am. Chem. Soc. XXXX, XXX, XXX−XXX
G
dissociation is partially compensated by the gain in intrapeptidehydrogen bonds. Because of the partially disordered characterof the Aβ peptide in bulk, these intrapeptide hydrogen bondsshow larger fluctuations compared to the interface hydrogenbonds (see the larger standard deviations in Figure 4A).In Figure 4B, the hydrogen bonds formed at certain
separations between filament and monomer are furtherclassified into native (green) and non-native (red) hydrogenbonds. At intermediate separations between monomer andfilament (1.3 < ζ < 3 nm), predominantly non-native hydrogenbonds are formed. During the initial docking step, these non-native contacts arise mainly between backbone residues in theCT region of the monomer and those in the centralhydrophobic region (CHC) of the exposed NT region of thefilament (see inset of Figure 4B, region 3). With decreasingseparation between filament and peptide, more native hydrogenbonds are formed in the crossover region (0.66 nm < ζ < 1.3nm). Here, the CT region of the peptide is already correctlyfolded and stabilized by native hydrogen bonds. However, theNT region of the peptide is kinetically trapped due to severalnon-native contacts (see inset of Figure 4B, region 2). In orderto reach the correctly folded bound state these non-nativecontacts have to be broken. Breaking these non-native contactsin the crossover region takes considerably longer compared tothe docking region and the simulations indicate that the lifetimeof individual hydrogen bonds can exceed a hundred nano-seconds (Figure 4C). This kinetic trapping of intermediateconformations has important consequences for filament growthsince it drastically slows down the kinetics at short separationsbetween filament and peptide as we will discuss in more detailfurther below.The situation is similar for elongation at the odd tip and
similar sequence regions are involved in the formation of non-native hydrogen bonds. For elongation at the odd tip, however,the non-native hydrogen bonds are formed between the CHCregion of the NT of the monomer and the exposed CT of thefilament (see Supporting Information, Figure S13). Forfragmentation, initial interactions involve the solvent exposedparts of the two hexamers, for example the NT region of thehexamer to the left and the CT of the hexamer to the right(snapshot 4 in Figure 2C).For the even tip, Figure 4C gives a schematic representation
of the backbone position or side chain involved in the hydrogenbond formation for three different separations. The majority ofnative and non-native hydrogen bonds corresponds tobackbone hydrogen bonds (solid lines). Side chain hydrogenbonds arise between charged or polar amino acids, in particularbetween residues D23 and K28, which corresponds to the firststable native hydrogen bond formed in the crossover region(dashed green line in Figure 4C2). The predominance ofbackbone hydrogen bonds indicates a general, sequenceindependent mechanism of fibril growth. Even the first non-native hydrogen bonds formed during docking correspond tobackbone hydrogen bonds and may thus hint at the dock/lockmechanism being a general feature of amyloid formation. At thesame time, the first non-native contacts preferentially involvethe CHC region of NT-strands and the mainly hydrophobicCT-strands, indicating a sequence-modulated propensity offibril formation. These findings are in agreement withexperiments observing a reduced fibril formation aftersubstituting the CHC region by hydrophilic amino acids.59,60
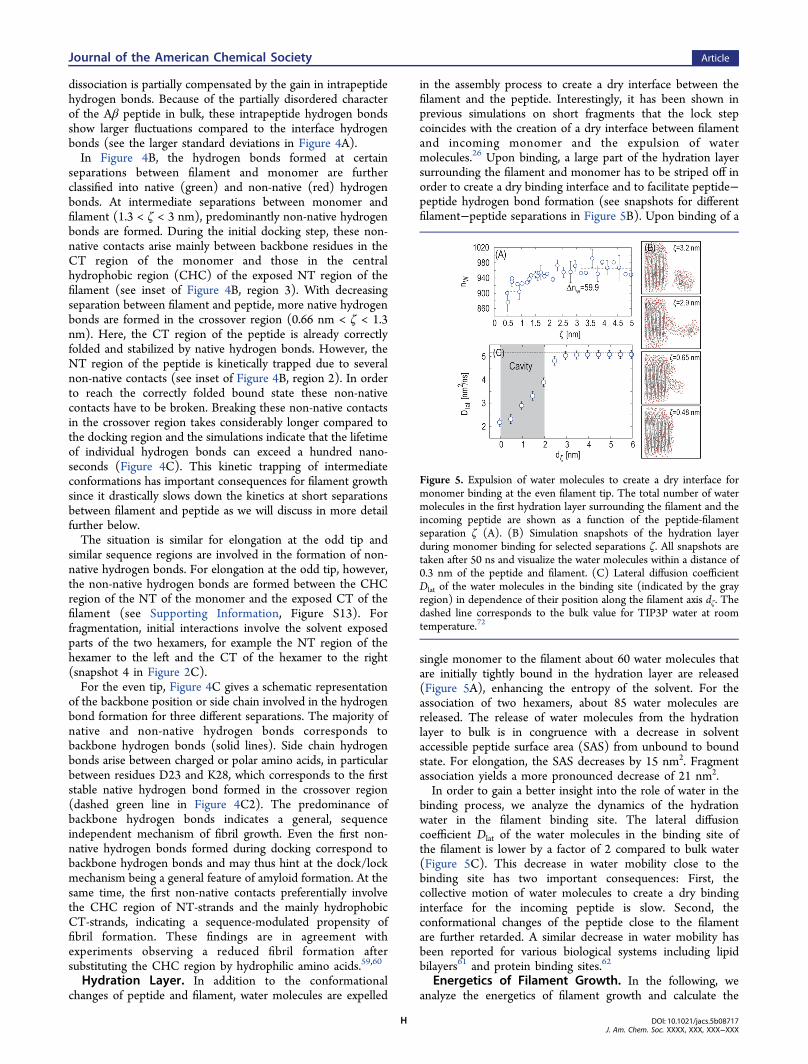
Hydration Layer. In addition to the conformationalchanges of peptide and filament, water molecules are expelled
in the assembly process to create a dry interface between thefilament and the peptide. Interestingly, it has been shown inprevious simulations on short fragments that the lock stepcoincides with the creation of a dry interface between filamentand incoming monomer and the expulsion of watermolecules.26 Upon binding, a large part of the hydration layersurrounding the filament and monomer has to be striped off inorder to create a dry binding interface and to facilitate peptide−peptide hydrogen bond formation (see snapshots for differentfilament−peptide separations in Figure 5B). Upon binding of a
single monomer to the filament about 60 water molecules thatare initially tightly bound in the hydration layer are released(Figure 5A), enhancing the entropy of the solvent. For theassociation of two hexamers, about 85 water molecules arereleased. The release of water molecules from the hydrationlayer to bulk is in congruence with a decrease in solventaccessible peptide surface area (SAS) from unbound to boundstate. For elongation, the SAS decreases by 15 nm2. Fragmentassociation yields a more pronounced decrease of 21 nm2.In order to gain a better insight into the role of water in the
binding process, we analyze the dynamics of the hydrationwater in the filament binding site. The lateral diffusioncoefficient Dlat of the water molecules in the binding site ofthe filament is lower by a factor of 2 compared to bulk water(Figure 5C). This decrease in water mobility close to thebinding site has two important consequences: First, thecollective motion of water molecules to create a dry bindinginterface for the incoming peptide is slow. Second, theconformational changes of the peptide close to the filamentare further retarded. A similar decrease in water mobility hasbeen reported for various biological systems including lipidbilayers61 and protein binding sites.62
Energetics of Filament Growth. In the following, weanalyze the energetics of filament growth and calculate the
Figure 5. Expulsion of water molecules to create a dry interface formonomer binding at the even filament tip. The total number of watermolecules in the first hydration layer surrounding the filament and theincoming peptide are shown as a function of the peptide-filamentseparation ζ (A). (B) Simulation snapshots of the hydration layerduring monomer binding for selected separations ζ. All snapshots aretaken after 50 ns and visualize the water molecules within a distance of0.3 nm of the peptide and filament. (C) Lateral diffusion coefficientDlat of the water molecules in the binding site (indicated by the grayregion) in dependence of their position along the filament axis dζ. Thedashed line corresponds to the bulk value for TIP3P water at roomtemperature.72
Journal of the American Chemical Society Article
DOI: 10.1021/jacs.5b08717J. Am. Chem. Soc. XXXX, XXX, XXX−XXX
H
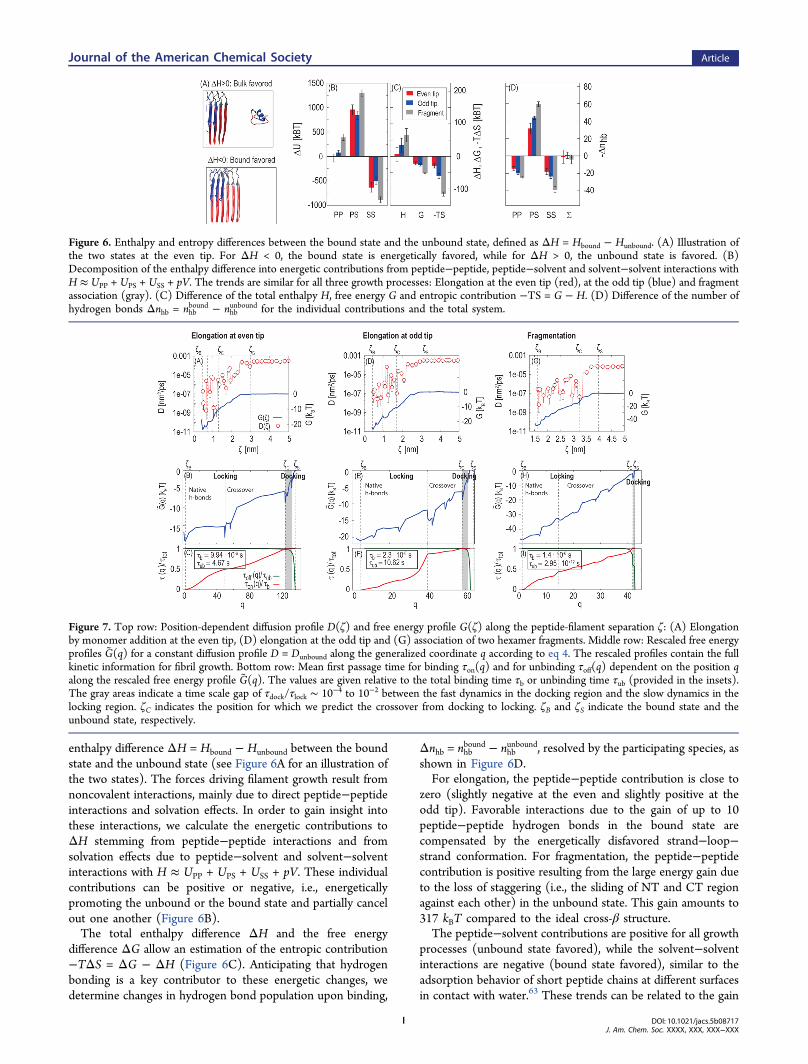
enthalpy difference ΔH = Hbound − Hunbound between the boundstate and the unbound state (see Figure 6A for an illustration ofthe two states). The forces driving filament growth result fromnoncovalent interactions, mainly due to direct peptide−peptideinteractions and solvation effects. In order to gain insight intothese interactions, we calculate the energetic contributions toΔH stemming from peptide−peptide interactions and fromsolvation effects due to peptide−solvent and solvent−solventinteractions with H ≈ UPP + UPS + USS + pV. These individualcontributions can be positive or negative, i.e., energeticallypromoting the unbound or the bound state and partially cancelout one another (Figure 6B).The total enthalpy difference ΔH and the free energy
difference ΔG allow an estimation of the entropic contribution−TΔS = ΔG − ΔH (Figure 6C). Anticipating that hydrogenbonding is a key contributor to these energetic changes, wedetermine changes in hydrogen bond population upon binding,
Δnhb = nhbbound − nhb
unbound, resolved by the participating species, asshown in Figure 6D.For elongation, the peptide−peptide contribution is close to
zero (slightly negative at the even and slightly positive at theodd tip). Favorable interactions due to the gain of up to 10peptide−peptide hydrogen bonds in the bound state arecompensated by the energetically disfavored strand−loop−strand conformation. For fragmentation, the peptide−peptidecontribution is positive resulting from the large energy gain dueto the loss of staggering (i.e., the sliding of NT and CT regionagainst each other) in the unbound state. This gain amounts to317 kBT compared to the ideal cross-β structure.The peptide−solvent contributions are positive for all growth
processes (unbound state favored), while the solvent−solventinteractions are negative (bound state favored), similar to theadsorption behavior of short peptide chains at different surfacesin contact with water.63 These trends can be related to the gain
Figure 6. Enthalpy and entropy differences between the bound state and the unbound state, defined as ΔH = Hbound − Hunbound. (A) Illustration ofthe two states at the even tip. For ΔH < 0, the bound state is energetically favored, while for ΔH > 0, the unbound state is favored. (B)Decomposition of the enthalpy difference into energetic contributions from peptide−peptide, peptide−solvent and solvent−solvent interactions withH ≈ UPP + UPS + USS + pV. The trends are similar for all three growth processes: Elongation at the even tip (red), at the odd tip (blue) and fragmentassociation (gray). (C) Difference of the total enthalpy H, free energy G and entropic contribution −TS = G − H. (D) Difference of the number ofhydrogen bonds Δnhb = nhb
bound − nhbunbound for the individual contributions and the total system.
Figure 7. Top row: Position-dependent diffusion profile D(ζ) and free energy profile G(ζ) along the peptide-filament separation ζ: (A) Elongationby monomer addition at the even tip, (D) elongation at the odd tip and (G) association of two hexamer fragments. Middle row: Rescaled free energyprofiles G(q) for a constant diffusion profile D = Dunbound along the generalized coordinate q according to eq 4. The rescaled profiles contain the fullkinetic information for fibril growth. Bottom row: Mean first passage time for binding τon(q) and for unbinding τoff(q) dependent on the position qalong the rescaled free energy profile G(q). The values are given relative to the total binding time τb or unbinding time τub (provided in the insets).The gray areas indicate a time scale gap of τdock/τlock ∼ 10−4 to 10−2 between the fast dynamics in the docking region and the slow dynamics in thelocking region. ζC indicates the position for which we predict the crossover from docking to locking. ζB and ζS indicate the bound state and theunbound state, respectively.
Journal of the American Chemical Society Article
DOI: 10.1021/jacs.5b08717J. Am. Chem. Soc. XXXX, XXX, XXX−XXX
I
of peptide−solvent hydrogen bonds in the unbound state andthe gain of water−water hydrogen bonds in the bound state(Figure 6D). For fragment association, the peptide−solventand solvent−solvent contributions are larger compared to theelongation results since association involves a larger number ofreleased hydration molecules.In general, the individual energetic contributions are much
larger than the resulting total enthalpy change due to thecompensation of solvent and peptide interactions. Moreover,the change in total average number of hydrogen bonds betweenbound and unbound state is about zero (see Figure 6D). Thisalmost perfect compensatory hydrogen bond mechanism hasalso been reported in simulation studies on amyloid formationof short model peptides.64,65
To summarize, filament growth by monomer addition orassociation of larger fragments is always favored (ΔG < 0). Theindividual energetic contributions of peptide and solvent to thetotal enthalpy and to the total number of hydrogen bondslargely cancel out. Therefore, direct peptide-filament andpeptide self-interactions (summarized in UPP) and solvationeffects (included in UPS and USS) are important and have to betaken into account to quantitatively describe fibril growth.Coarse-grained or implicit solvent model might thereforepredict a too strong energetic preference for assembly andentropic contributions are hidden in effective solute−solventinteraction terms. Overall, our results reveal that elongation andassociation are slightly disfavored by enthalpy (ΔH ≳ 0).Filament elongation and association are therefore driven byentropy, which becomes evident from the large gain of entropyin the bound state (−TΔS < 0) in Figure 6C. This result seemssurprising at first, since the transition of a disordered monomerin bulk to an ordered fibrillar conformation is associated with areduction of the monomer’s degrees of freedom and hence aloss of entropy. This loss of peptide entropy, however, isovercompensated by the gain of solvent entropy. The latter isrelated to the release of about 60 water molecules (85 forfragmentation) that are initially tightly bound in the firsthydration layer around peptide and filament. As a consequenceof an entropy driven assembly process, we predict astabilization of the bound state with increasing the temperature.This prediction is in agreement with recent experimentalresults, which predict a shift toward the bound state indicatedby an eight times higher equilibrium constant at 37 °Ccompared to 24 °C for Aβ1−40.
16
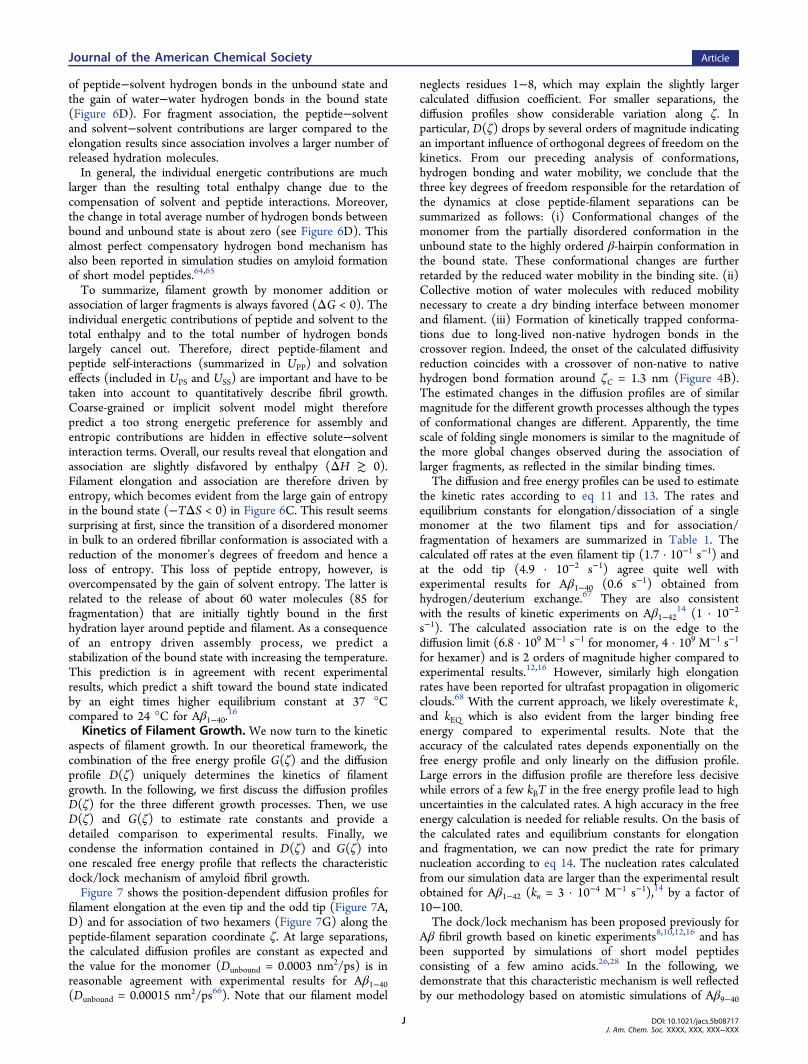
Kinetics of Filament Growth. We now turn to the kineticaspects of filament growth. In our theoretical framework, thecombination of the free energy profile G(ζ) and the diffusionprofile D(ζ) uniquely determines the kinetics of filamentgrowth. In the following, we first discuss the diffusion profilesD(ζ) for the three different growth processes. Then, we useD(ζ) and G(ζ) to estimate rate constants and provide adetailed comparison to experimental results. Finally, wecondense the information contained in D(ζ) and G(ζ) intoone rescaled free energy profile that reflects the characteristicdock/lock mechanism of amyloid fibril growth.Figure 7 shows the position-dependent diffusion profiles for
filament elongation at the even tip and the odd tip (Figure 7A,D) and for association of two hexamers (Figure 7G) along thepeptide-filament separation coordinate ζ. At large separations,the calculated diffusion profiles are constant as expected andthe value for the monomer (Dunbound = 0.0003 nm2/ps) is inreasonable agreement with experimental results for Aβ1−40(Dunbound = 0.00015 nm2/ps66). Note that our filament model
neglects residues 1−8, which may explain the slightly largercalculated diffusion coefficient. For smaller separations, thediffusion profiles show considerable variation along ζ. Inparticular, D(ζ) drops by several orders of magnitude indicatingan important influence of orthogonal degrees of freedom on thekinetics. From our preceding analysis of conformations,hydrogen bonding and water mobility, we conclude that thethree key degrees of freedom responsible for the retardation ofthe dynamics at close peptide-filament separations can besummarized as follows: (i) Conformational changes of themonomer from the partially disordered conformation in theunbound state to the highly ordered β-hairpin conformation inthe bound state. These conformational changes are furtherretarded by the reduced water mobility in the binding site. (ii)Collective motion of water molecules with reduced mobilitynecessary to create a dry binding interface between monomerand filament. (iii) Formation of kinetically trapped conforma-tions due to long-lived non-native hydrogen bonds in thecrossover region. Indeed, the onset of the calculated diffusivityreduction coincides with a crossover of non-native to nativehydrogen bond formation around ζC = 1.3 nm (Figure 4B).The estimated changes in the diffusion profiles are of similarmagnitude for the different growth processes although the typesof conformational changes are different. Apparently, the timescale of folding single monomers is similar to the magnitude ofthe more global changes observed during the association oflarger fragments, as reflected in the similar binding times.The diffusion and free energy profiles can be used to estimate
the kinetic rates according to eq 11 and 13. The rates andequilibrium constants for elongation/dissociation of a singlemonomer at the two filament tips and for association/fragmentation of hexamers are summarized in Table 1. Thecalculated off rates at the even filament tip (1.7 · 10−1 s−1) andat the odd tip (4.9 · 10−2 s−1) agree quite well withexperimental results for Aβ1−40 (0.6 s−1) obtained fromhydrogen/deuterium exchange.67 They are also consistentwith the results of kinetic experiments on Aβ1−42
14 (1 · 10−2
s−1). The calculated association rate is on the edge to thediffusion limit (6.8 · 109 M−1 s−1 for monomer, 4 · 109 M−1 s−1
for hexamer) and is 2 orders of magnitude higher compared toexperimental results.12,16 However, similarly high elongationrates have been reported for ultrafast propagation in oligomericclouds.68 With the current approach, we likely overestimate k+and kEQ which is also evident from the larger binding freeenergy compared to experimental results. Note that theaccuracy of the calculated rates depends exponentially on thefree energy profile and only linearly on the diffusion profile.Large errors in the diffusion profile are therefore less decisivewhile errors of a few kBT in the free energy profile lead to highuncertainties in the calculated rates. A high accuracy in the freeenergy calculation is needed for reliable results. On the basis ofthe calculated rates and equilibrium constants for elongationand fragmentation, we can now predict the rate for primarynucleation according to eq 14. The nucleation rates calculatedfrom our simulation data are larger than the experimental resultobtained for Aβ1−42 (kn = 3 · 10−4 M−1 s−1),14 by a factor of10−100.The dock/lock mechanism has been proposed previously for
Aβ fibril growth based on kinetic experiments8,10,12,16 and hasbeen supported by simulations of short model peptidesconsisting of a few amino acids.26,28 In the following, wedemonstrate that this characteristic mechanism is well reflectedby our methodology based on atomistic simulations of Aβ9−40
Journal of the American Chemical Society Article
DOI: 10.1021/jacs.5b08717J. Am. Chem. Soc. XXXX, XXX, XXX−XXX
J
peptides. To gain insight into the full kinetic pathway of Aβ-fibril growth by monomer addition or hexamer assembly, wecondense all kinetic information into one general free energyprofile G(q). So far, all the kinetic information is contained inthe peptide-filament separation ζ, the free energy profile G(ζ)and the diffusion profile D(ζ). However, by choosing anappropriate transformation for all three and exploiting thekinetic quasi-universality of the Fokker−Planck equation, thekinetics of fibril growth remains unchanged.46 For convenience,we choose the transformation such that the diffusion profilebecomes constant, D = Dunbound (eq 4). Therewith, regions ofpeptide-filament separations in which the dynamics is slow arestretched in the generalized coordinate q and previously hiddenbarriers appear in the rescaled free energy profile G(q) thatcontains all the kinetic information on fibril growth.Figure 7 shows the rescaled free energy profiles and the mean
first passage times for binding τon(q) and for unbinding τoff(q)as a function of the generalized coordinate q, relative to thetotal binding time τb or unbinding time τub. The values for τband τub are provided explicitly for all three growth processes(insets in Figure 7C, F, I and Table 1). At large separationsbetween a single monomer and the even filament tip, therescaled free energy profile changes rapidly at large q,corresponding to fast dynamics in the initial docking phase(Figure 7B). The fast dynamics during docking is also reflectedin the insignificant amount of the total binding time used forthe docking step (Figure 7C). Beyond the docking region, atthe crossover point ζC, the rescaled free energy is rather flat andthe binding time increases monotonically. Consequently, thedynamics in the locking step is much slower compared to theinitial fast docking. The gray regions in Figure 7 indicate a timescale gap of τdock/τlock ∼ 10−4 to 10−2 between the initial fastchanges in the docking region relative to the slow changes inthe subsequent locking region in agreement with previousresults.27 The situation is similar for fibril growth by elongationof a single monomer at the other fibril tip and also for theassociation of larger filament fragments: All three growthprocesses show the characteristic dock/lock mechanism and atime scale gap of several orders in magnitude. The results showthat the crossover from docking to locking occurs around apeptide-filament separation of ζC = 1.3 nm (even tip), ζC = 1.7nm (odd tip), and ζC = 3.2 nm (hexamer). Interestingly, thebinding times τb for fibril growth by a single monomer aresimilar to that of a hexamer fragment (inset of Figure 7). It islikely that the preordering of the binding interfaces, whichfavors fast association, compensates for the larger size of thehexamers, which slows down diffusion. The results for thedifferent fibril tips indicate a slightly preferred growth at theodd fibril tip that might lead to unidirectional growth ofamyloid fibrils similar to insulin fibrils.69 In contrast to thesimilar binding times, the unbinding time for two fragments issignificantly larger compared to a single monomer. On thecontrary this means that once a fibril is assembled, fibrilbreakage is extremely rare and the fully assembled fibrils do notserve as a reservoir for oligomers.
■ CONCLUSIONThe dynamic pathway and the molecular mechanism ofamyloid fibril formation is still not completely understood,while of great importance for the design of drug molecules thatinterfere with the process. Using Aβ9−40 peptides as a modelsystem, we systematically investigate the three growth processesthat determine the kinetics of fibril growth: Elongation by a
single monomer at the structurally unequal filament tips andthe association of two larger filament fragments. Applyingextensive MD simulations with explicit water provides insightinto the molecular steps and driving forces underlying amyloidgrowth and allows us to extract kinetic information includingmacroscopic growth rates.The free energy profiles underlying fibril growth indicate an
onset of interactions already at monomer-filament separations>2.5 nm that efficiently catch the approaching monomer orfragment and guide it toward a docking regime of association.The initial interactions involve mainly transient non-nativehydrogen bonds and are possible due to the high conforma-tional flexibility of Aβ peptides. Following initial docking, theassociation process is characterized by a continuous drop in freeenergy upon further distance decrease toward the fully boundstate. This decrease in free energy is accompanied by acontinuous increase of native hydrogen bonds at the cost ofnon-native hydrogen bonds. This detailed insight into the roleof hydrogen bond formation in amyloid growth has not beenfeasible from coarse-grained simulations and elucidates thefundamental role of hydrogen bonds to mediate initialinteractions, to guide the peptide to the ordered strand−loop−strand conformation in the bound state and to kineticallytrap intermediate states.To yield converged results for the free energy profiles, we
propagate much longer trajectories compared to previousexplicit solvent MD simulations51 which allow us to achieve amuch closer agreement with experimental binding free energies.These long simulations are necessary to sample the largeconformational space of the partially disordered Aβ-peptide andto account for the slow relaxation in the binding process. Thedock-lock binding mechanism and conformational intermedi-ates like a non-native hairpin structure are in good agreementwith implicit and coarse-grained simulations,24,27 providingfurther confidence in our results.The binding free energy of two ordered hexamer fragments is
much larger compared to a single monomer. Therefore, ligandswith conformational freedom as restricted as filament fragmentscould be effective competitors for Aβ monomers and couldform the basis of amyloid inhibitor design.70 The free energyfor the assembly of two hexamer fragments demonstrates thatpartial disruptions of the filament are possible at relativelymodest changes of free energy, especially in the N-terminalregion. Hence, small drug molecules could intercalate into afilament, partially disrupting its cohesion and in turn hinderingfurther filament growth.The energetic and entropic forces driving filament formation
reveal that filament elongation is overall energeticallydisfavored. Moreover, an energetic decomposition reveals anear cancellation of individual contributions. Direct peptide−peptide interactions and solvation effects are therefore equallyimportant and essential to quantitatively describe fibril growth,limiting the predictive power of implicit solvent and coarse-grained simulations. Overall, fibril formation is driven byentropy due to the increase of solvent entropy upon monomeror fragment binding to the filament tip, overcompensating thereduction of conformational entropy of the binding partners.The entropic preference of filament formation explains theobserved increase of the amyloid stability with temperature.16
Atomistic level investigation of Aβ40 fibril growth remainstremendously challenging with current technologies due to thelarge system sizes and long time scales involved. To overcomethe computational time scale limit, we extract kinetic
Journal of the American Chemical Society Article
DOI: 10.1021/jacs.5b08717J. Am. Chem. Soc. XXXX, XXX, XXX−XXX
K
information from our simulations by calculating the position-dependent diffusion profile for the approaching monomer orfragment. In our theoretical framework, we combine thedetailed information contained in the diffusion profile and thefree energy profile to describe the dynamics of fibril growth.The resulting dynamic pathway reveals that the initial dockingis much faster compared to the subsequent locking inagreement with experimental predictions.8 For fibril growth,both by single monomers and by association of largerfragments, the locking step is at least 2 orders of magnitudeslower compared to docking. The significant retardation of thegrowth dynamics during locking at close separations betweenincoming peptide and filament arises in part from long-livednon-native hydrogen bonds, resulting in kinetically trappedintermediate states. Fibril growth additionally requires thecollective motion of up to 85 water molecules to create a drybinding interface. This hydration water is much less mobilethan molecules in bulk, as evidenced by a 2-fold decrease in thediffusion coefficient, resulting in a slow expulsion of water uponassembly and a retardation of conformational changes close tothe binding site. Therewith, water plays a decisive role inamyloid formation as entropic driving force and due to itsinfluence on the growth dynamics.Still, the slowest time scale in the locking step is most likely
connected to the long time it takes to break several non-nativehydrogen bonds, which can be on the order of 10 μs to 1 ms inpeptide bundles.71
■ ASSOCIATED CONTENT*S Supporting InformationThe Supporting Information is available free of charge on theACS Publications website at DOI: 10.1021/jacs.5b08717.
Further discussions of fibril stability, potentials of meanforce, energy decomposition, diffusion coefficients, andconformational changes. (PDF)
■ AUTHOR INFORMATIONCorresponding Author*[email protected]
NotesThe authors declare no competing financial interest.
■ ACKNOWLEDGMENTSWe acknowledge financial support from SFB1035, project B02.NS thanks the Alexander von Humboldt Foundation forfinancial support. The Leibniz Rechenzentrum Munich isacknowledged for supercomputing access (pr84ko). Thisresearch used resources of the National Energy ResearchScientific Computing Center, a DOE Office of Science UserFacility supported by the Office of Science of the U.S.Department of Energy under Contract No. DE-AC02-05CH11231.
■ REFERENCES(1) Dauer, W.; Przedborski, S. Neuron 2003, 39, 889−909.(2) DiFiglia, M.; Sapp, E.; Chase, K.; Davies, S.; Bates, G.; Vonsattel,J.; Aronin, N. Science 1997, 277, 1990−1993.(3) Hardy, J.; Selkoe, D. J. Science 2002, 297, 353−356.(4) Petkova, A. T.; Ishii, Y.; Balbach, J. J.; Antzutkin, O. N.; Leapman,R. D.; Delaglio, F.; Tycko, R. Proc. Natl. Acad. Sci. U. S. A. 2002, 99,16742−16747.
(5) Petkova, A.; Leapman, R.; Guo, Z.; Yau, W.; Mattson, M.; Tycko,R. Science 2005, 307, 262−265.(6) Buchete, N.-V.; Tycko, R.; Hummer, G. J. Mol. Biol. 2005, 353,804−821.(7) Buchete, N.-V.; Hummer, G. Biophys. J. 2007, 92, 3032−3039.(8) Esler, W. P.; Stimson, E. R.; Jennings, J. M.; Vinters, H. V.;Ghilardi, J. R.; Lee, J. P.; Mantyh, P. W.; Maggio, J. E. Biochemistry2000, 39, 6288−6295.(9) Kusumoto, Y.; Lomakin, A.; Teplow, D. B.; Benedek, G. B. Proc.Natl. Acad. Sci. U. S. A. 1998, 95, 12277−12282.(10) Cannon, M. J.; Williams, A. D.; Wetzel, R.; Myszka, D. G. Anal.Biochem. 2004, 328, 67−75.(11) O’Nuallain, B.; Shivaprasad, S.; Kheterpal, I.; Wetzel, R.Biochemistry 2005, 44, 12709−12718.(12) Ban, T.; Yamaguchi, K.; Goto, Y. Acc. Chem. Res. 2006, 39, 663−670.(13) Cohen, S. I. A.; Linse, S.; Luheshi, L. M.; Hellstrand, E.; White,D. A.; Rajah, L.; Otzen, D. E.; Vendruscolo, M.; Dobson, C. M.;Knowles, T. P. J. Proc. Natl. Acad. Sci. U. S. A. 2013, 110, 9758−9763.(14) Meisl, G.; Yang, X.; Hellstrand, E.; Frohm, B.; Kirkegaard, J. B.;Cohen, S. I. A.; Dobson, C. M.; Linse, S.; Knowles, T. P. J. Proc. Natl.Acad. Sci. U. S. A. 2014, 111, 9384−9389.(15) Buell, A. K.; Dhulesia, A.; White, D. A.; Knowles, T. P. J.;Dobson, C. M.; Welland, M. E. Angew. Chem., Int. Ed. 2012, 51, 5247−5251.(16) Qiang, W.; Kelley, K.; Tycko, R. J. Am. Chem. Soc. 2013, 135,6860−6871.(17) O’Brien, E. P.; Okamoto, Y.; Straub, J. E.; Brooks, B. R.;Thirumalai, D. J. Phys. Chem. B 2009, 113, 14421−14430.(18) Oosawa, F.; Kasai, M. J. Mol. Biol. 1962, 4, 10.(19) Michaels, T. C. T.; Knowles, T. P. J. J. Chem. Phys. 2014, 140,214904.(20) Wu, C.; Shea, J.-E. Curr. Opin. Struct. Biol. 2011, 21, 209−220.(21) Fawzi, N. L.; Kohlstedt, K. L.; Okabe, Y.; Head-Gordon, T.Biophys. J. 2008, 94, 2007−2016.(22) Fawzi, N. L.; Okabe, Y.; Yap, E.-H.; Head-Gordon, T. J. Mol.Biol. 2007, 365, 535−550.(23) Takeda, T.; Klimov, D. K. Biophys. J. 2009, 96, 442−452.(24) Gurry, T.; Stultz, C. M. Biochemistry 2014, 53, 6981−6991.(25) Santini, S.; Mousseau, N.; Derreumaux, P. J. Am. Chem. Soc.2004, 126, 11509−11516.(26) Nguyen, P. H.; Li, M. S.; Stock, G.; Straub, J. E.; Thirumalai, D.Proc. Natl. Acad. Sci. U. S. A. 2007, 104, 111−116.(27) Han, W.; Schulten, K. J. Am. Chem. Soc. 2014, 136, 12450−12460.(28) Schor, M.; Vreede, J.; Bolhuis, P. G. Biophys. J. 2012, 103,1296−1304.(29) Lam, A. R.; Rodriguez, J. J.; Rojas, A.; Scheraga, H. A.;Mukamel, S. J. Phys. Chem. A 2013, 117, 342−350.(30) Bjelkmar, P.; Larsson, P.; Cuendet, M. A.; Hess, B.; Lindahl, E. J.Chem. Theory Comput. 2010, 6, 459−466.(31) Jorgensen, W. L.; Chandrasekhar, J.; Madura, J. D.; Impey, R.W.; Klein, M. L. J. Chem. Phys. 1983, 79, 926−935.(32) Erbas, A.; Horinek, D.; Netz, R. R. J. Am. Chem. Soc. 2012, 134,623−630.(33) Van Der Spoel, D.; Lindahl, E.; Hess, B.; Groenhof, G.; Mark, A.E.; Berendsen, H. J. C. J. Comput. Chem. 2005, 26, 1701−1718.(34) Darden, T.; York, D.; Pedersen, L. J. Chem. Phys. 1993, 98,10089−10092.(35) Kumar, S.; Rosenberg, J. M.; Bouzida, D.; Swendsen, R. H.;Kollman, P. A. J. Comput. Chem. 1995, 16, 1339−1350.(36) Kabsch, W.; Sander, C. Biopolymers 1983, 22, 2577−2637.(37) Cecchini, M.; Rao, F.; Seeber, M.; Caflisch, A. J. Chem. Phys.2004, 121, 10748−10756.(38) Seeber, M.; Felline, A.; Raimondi, F.; Muff, S.; Friedman, R.;Rao, F.; Caflisch, A.; Fanelli, F. J. Comput. Chem. 2011, 32, 1183−1194.(39) Shao, J.; Tanner, S. W.; Thompson, N.; Cheatham, T. E. J.Chem. Theory Comput. 2007, 3, 2312−2334.
Journal of the American Chemical Society Article
DOI: 10.1021/jacs.5b08717J. Am. Chem. Soc. XXXX, XXX, XXX−XXX
L
(40) Hess, B. J. Chem. Phys. 2002, 116, 209.(41) Hanggi, P.; Borkovec, M. Rev. Mod. Phys. 1990, 62, 251−341.(42) Hummer, G. New J. Phys. 2005, 7, 34−34.(43) Zhu, F.; Hummer, G. J. Chem. Theory Comput. 2012, 8, 3759−3768.(44) Flyvbjerg, H.; Petersen, H. G. J. Chem. Phys. 1989, 91, 461.(45) Rhee, Y. M.; Pande, V. S. J. Phys. Chem. B 2005, 109, 6780−6786.(46) Hinczewski, M.; von Hansen, Y.; Dzubiella, J.; Netz, R. R. J.Chem. Phys. 2010, 132, 245103.(47) Best, R. B.; Hummer, G. Proc. Natl. Acad. Sci. U. S. A. 2010, 107,1088−1093.(48) Chandler, D. Introduction to Modern Statistical Mechanics;Oxford University Press: New York, 1987.(49) Weiss, G. H. First Passage Time Problems in Chemical Physics;Advances in Chemical Physics; John Wiley & Sons, Inc.: Hoboken, NJ,1967; Vol. 13.(50) Houston, P. L. Chemical Kinetics and Reaction Dynamics; CourierCorporation, 2012.(51) Lemkul, J. A.; Bevan, D. R. J. Phys. Chem. B 2010, 114, 1652−1660.(52) Frieden, C. Protein Sci. 2007, 16, 2334−2344.(53) Raffa, D. F.; Rauk, A. J. Phys. Chem. B 2007, 111, 3789−3799.(54) Massi, F.; Peng, J. W.; Lee, J. P.; Straub, J. E. Biophys. J. 2001,80, 31−44.(55) Baumketner, A.; Bernstein, S. L.; Wyttenbach, T.; Bitan, G.;Teplow, D. B.; Bowers, M. T.; Shea, J. E. Protein Sci. 2006, 15, 420−428.(56) Nag, S.; Sarkar, B.; Bandyopadhyay, A.; Sahoo, B.; Sreenivasan,V. K. A.; Kombrabail, M.; Muralidharan, C.; Maiti, S. J. Biol. Chem.2011, 286, 13827−13833.(57) Solar, M.; Buehler, M. J. Nanotechnology 2014, 25, 105703.(58) Paparcone, R.; Buehler, M. J. Biomaterials 2011, 32, 3367−3374.(59) Hamley, I. W. Chem. Rev. 2012, 112, 5147−5192.(60) Hilbich, C.; Kisters-Woike, B.; Reed, J.; Masters, C. L.;Beyreuther, K. J. Mol. Biol. 1992, 228, 460−473.(61) von Hansen, Y.; Gekle, S.; Netz, R. R. Phys. Rev. Lett. 2013, 111,118103.(62) Nibali, V. C.; Havenith, M. J. Am. Chem. Soc. 2014, 136, 12800−12807.(63) Schwierz, N.; Horinek, D.; Liese, S.; Pirzer, T.; Balzer, B. N.;Hugel, T.; Netz, R. R. J. Am. Chem. Soc. 2012, 134, 19628−19638.(64) Narayanan, C.; Dias, C. L. J. Chem. Phys. 2013, 139, 115103.(65) Su, Z.; Dias, C. L. J. Phys. Chem. B 2014, 118, 10830−10836.(66) Tseng, B. P.; Esler, W. P.; Clish, C. B.; Stimson, E. R.; Ghilardi,J. R.; Vinters, H. V.; Mantyh, P. W.; Lee, J. P.; Maggio, J. E.Biochemistry 1999, 38, 10424−10431.(67) Sanchez, L.; Madurga, S.; Pukala, T.; Vilaseca, M.; Lopez-Iglesias, C.; Robinson, C. V.; Giralt, E.; Carulla, N. J. Am. Chem. Soc.2011, 133, 6505−6508.(68) Ogi, H.; Fukukshima, M.; Hamada, H.; Noi, K.; Hirao, M.; Yagi,H.; Goto, Y. Sci. Rep. 2014, 4, 6960.(69) Heldt, C. L.; Zhang, S.; Belfort, G. Proteins: Struct., Funct., Genet.2011, 79, 92−98.(70) Kapurniotu, A. Angew. Chem., Int. Ed. 2011, 50, 11293−11294.(71) Erbas, A.; Netz, R. R. Biophys. J. 2013, 104, 1285−1295.(72) Mahoney, M.; Jorgensen, W. J. Chem. Phys. 2001, 114, 363−366.
Journal of the American Chemical Society Article
DOI: 10.1021/jacs.5b08717J. Am. Chem. Soc. XXXX, XXX, XXX−XXX
M