e appendix - uni-halle.de · e-3 table e1: test compounds for the determination of the coefficients...
TRANSCRIPT

E-1
E APPENDIX
E.1 Experimental
E.1.1 Materials
E.1.1.1 Guanine derivatives
The guanine derivatives ACV (9-(2-hydroxyethoxymethyl)guanine), NAcACV (N2-acetylacyclovir), OAcACV (O-acetylacyclovir), diAcACV (N2, O-diacetylacyclovir), DCV (2-amino-9-(2-hydroxyethoxymethyl)-9H-purine) and OAcDCV (O-acetyldeoxyacyclovir) weresynthesised at the National Institute of Chemistry (Ljubljana, Slovenia) as described254 andkindly donated for this study. They were stored in dry atmosphere in order to neglect watertraces which could influence the tautomeric equilibrium.
E.1.1.2 Amino acid and oligopeptide derivatives
The amino acid and peptide derivatives, Ac-Ala-OMe, Ac-Phe-OMe, Ac-Val-OMe, Ac-Ala-Ala-OMe, Ac-Ala-Ala-Ala-OMe, Ac-Ala-Ala-Ala-Ala-OMe, were purchased fromBACHEM Biochemica (Heidelberg). Their enantiomeric purity was higher than 99 %. N-methyl acetamide was received from ALDRICH. The substances were stored in a refrigeratorand dried before use in a desiccator filled with molecular sieve.
The tripeptide and dipeptide derivatives were synthesised according to the HOBt/DCCmethod in the group of C. Griehl (Department of Biotechnology and Applied Food, TechnicalUniversity Köthen); The purity of the compounds was tested chromatographically andexceeded a diastereoisomeric purity of 95%. Other physical characteristics are describedelsewhere165
The functional groups at the N- and C- terminal end were blocked by protecting groups ofthe peptide chemistry. The Z (benzyloxycarbonyl), Ac (acetyl) and the Boc (tert.butyloxycarbonyl) residues were used for the protection of the N- terminal site. The acidicfunction was blocked by ester residues which were either methyl (OMe), ethyl (OEt), tert.butyl (OtBu) or benzyl (OBzl) esters. Polar side chain groups such as OH and NH2 functionswere in selected cases protected by methoxy, benzoxy or benzylamine residues.
E.1.1.3 Ureido sugar derivatives
The compounds used in this study were synthesised in the group of A. Temeriusz,Department of Chemistry, Warsaw University, according to a procedure describedelsewhere255, 256. They were dried over molecular sieves and dissolved in methanol at aconcentration of 0.01 mol/l for the HPLC measurements. The chromatogram of the substancesdid not show an indication for impurities higher than 1%.
E.1.1.4 Phospholipids
As models for the phospolipid membrane 1.2-dihexadecyl-sn-glycero-3-phosphoryl choline(DHPC) and 1.2-dimyristoyl-sn-glycero-3-phosphoryl choline (DMPC) were purchased fromBACHEM Biochemica. 1.2-dipalmitoyl sn-glycero-3-phospho choline (DPPC) was availablefrom FLUKA as its monohydrate.

E-2
E.1.1.5 Alcohols and diols
The monomeric alcohols propan-1-ol (RIEDEL DE HAEN), propan-2-ol (MERCK) and n-hexan-1-ol (REACHIM) were purchased in the highest possible grade (spectr. grade) andstored over molecular sieves. Furthermore, the diols propan-1.2-diol (FLUKA), propan-1.3-diol, butan-1.4-diol, pentan-1.5-diol (MERCK, pro analysis) and hexan-1.6-diol were used inthis study. As cyclic proton donor compounds with two functional OH groups cis-cyclohexan-1.2-diol and trans- cyclohexan-1.2-diol and the racemic cyclohexan-1.4-diol purchased fromFLUKA were tested.
The proton acceptor compounds were pyridine, 2.4-lutidine and 2.4.6-collidine werefreshly distilled under vacuum immediately before use.
The hydrogen bonding behaviour of amino acid, dipeptide and tripeptide derivatives withalcohols was investigated in methylene chloride solutions. The alcohols were 1.1.1.3.3.3-hexafluoropropanol (MERCK, spectr. grade) and phenol (FLUKA).
E.1.1.6 Solvents
For the HPLC measurements the standard organic phase was acetonitrile (RATHBURN,Walkerburn, UK)). The aqueous phase was a 0.05 molar ammonium acetate buffer solution ofa pH of 7.4 (FISON, Loughborough, UK). In selected experiments the HPLC solventsmethanol and 1.1.1-trifluoroethanol (FISHER CHEMICALS, Loughborough, UK) were usedas organic modifier.
Solvents in the NMR spectroscopic experiments were D2O (ALDRICH), CDCl3 (MERCK)and DMSO-d6 (ALDRICH) of the highest available grade. The percentage of water in sealedbottle of DMSO-d6 was less than 0.01%.
Solvents for IR and UV/VIS spectroscopy were methylene chloride (FLUKA), acetonitrile(FLUKA, 190 super purity solvent, ROMIL pure chemistry), carbon tetrachloride (ALDRICH)were kept over molecular sieves.
E.1.2 HPLC measurement
A Hewlett-Packard 1090 series high performance liquid chromatograph was used. Dataacquisition and processing were performed on a Viglen IBM compatible PC with HPChemstation software (HEWLETT-PACKARD, Amsterdam, The Netherlands). The systemwas set up with a low pressure pump and an autosampler. The solutions (3, 5 or 10ml) wereinjected onto the HPLC system twice. The injected volume varied according to the sample’sproperty to absorb in the UV region of the array detector.
According to their solubility ca. 1mg of the sample was dissolved in a 1:1 mixture ofAcN/buffer. More polar compounds such as the ureido sugar derivatives and peptides withpolar side chain residues were dissolved in methanol. The concentration of the peptidesolution was ca. 0.005 to 0.01 mol/l. As a standard set-up the signals at 215, 230 and 245 nmwere monitored. The average retention time was used for further analysis.
E.1.2.1 Test compounds for the characterisation of the chromatographic systems
The 30 test compounds given in table E1 are used for the calibration of thechromatographic system. For these compounds the solute descriptors are known. They wereselected to represent a wide variety of solute properties from the UCL database. The boldwritten compounds built the standard set which were injected as a mixture for the calibrationof the CHI value.

E-3
Table E1: Test compounds for the determination of the coefficients and their descriptors74
Name R2 p2H åa2
H åb2H Vx
Paracetamol 1.06 1.78 1.09 0.81 1.172
Acetanilide 0.87 1.40 0.50 0.67 1.137
Acetophenone 0.82 1.01 0.00 0.48 1.014
Propiophenone 0.80 0.95 0.00 0.51 1.155
Butyrophenone 0.80 0.95 0.00 0.51 1.296
Valerophenone 0.80 0.95 0.00 0.50 1.437
Hexanophenone 0.72 0.95 0.00 0.50 1.578
Heptanophenone 0.72 0.95 0.00 0.50 1.718
Octanophenone 0.72 0.95 0.00 0.50 1.859
4-Iodophenone 1.38 1.22 0.68 0.20 1.033
Dibenzothiophene 1.96 1.31 0.00 0.20 1.379
4-Chlorophenol 0.92 1.08 0.67 0.20 0.898
4-Cyanophenol 0.94 1.63 0.80 0.29 0.930
Benzamide 0.99 1.5 0.49 0.67 0.973
Caffeine 1.50 1.6 0.00 1.33 1.363
Indasole 1.20 1.22 0.53 0.35 0.905
Anisole 0.71 0.75 0.00 0.29 0.916
Benzonitrile 0.74 1.11 0.00 0.33 0.871
Chlorobenzene 0.72 0.65 0.00 0.07 0.839
Naphthalene 1.34 0.92 0.00 0.20 1.085
Dinitrobenzene 1.13 1.63 0.00 0.46 1.065
Phenol 0.81 0.89 0.60 0.30 0.775
Trifluoromethylphenol 0.43 0.87 0.72 0.09 0.969
Toluene 0.60 0.52 0.00 0.14 0.857
Corticosterone 1.86 3.43 0.40 1.63 2.739
Aniline 0.96 0.96 0.26 0.41 0.816
Testosterone 1.54 2.59 0.32 1.19 2.383
Hydrocortisone-21-acetate 1.89 3.67 0.43 1.90 3.095
p-Toluidine 0.92 0.95 0.23 0.45 0.957
m-Nitroaniline 1.20 1.71 0.40 0.35 0.990

E-4
E.1.2.2 Chromatographic columns
Table E2 and E3 give the parameters of all chromatographic systems tested in the course ofour investigations. For the determination of the CHI values finally the five systems in table E2were chosen.
Table E2: HPLC columns used for the isocratic measurements and for the descriptordetermination
Name Abbreviation Particle size Column dimension Supplier
ODS2-IK5 Inertsil In 5 µm 150x4.6 mm A
Prodigy ODS2 Pro 5 µm 150x4.6 mm D
Novapak-CN CN 4 µm 75x3.9 mm B
RexChrom IAM PC2 IAM 12 µm 150x4.6 mm H
Nucleodex b PM CD 5 µm 200x2.6 mm H
Supplier:A: CAPITAL HPLC, Broxburn, UK.B: WATERS CHROMATOGRAPHY, Watford, UKC: SUPELCO, UK.D: PHENOMENEX UK, Macclesfield, UK.E: PHASE SEPARATIONS, Deeside, UKF: BIOTAGE UK, Division of Dyax Hertford, UKG: POLEMER LABORATORIES, Separation Science Division, Stratton, UK.H: FISHER SCHIENTIFIC UK, Loughborough, UK
Table E3: HPLC columns for the selection of appropriate coefficients for further studies
Name Abbreviation Particle size Column dimension Suppliera
Luna ODS Luna1 5 µm 150x4.60mm D
Luna ODS Luna2 5 µm 50x4.60mm D
Symmetry C18 SY 3.5 µm 50x4.6 mm B
NovaPak RP NRP 4 µm 75x3.9 mm B
Supelcosil ABZ ABZ 3 µm 33x4.6 mm C
Selectosil RP SRP 5 µm 150x4.6 mm D
Sherisorb ODS1 OD1 5 µm 150x4.6 mm E
Unisphere-C18 BRP 8 µm 100x4.6 mm F
Unisphere PBD BPB 8 µm 100x4.6 mm F
Asahipak ODP APO 5 µm 150x4.6 mm D
RPS 40 POL 8 µm 50x4.6 mm G
Novapak Phenyl NPH 4 µm 75x3.9 mm B
Diol-YC5 Inertsil Indiol 5 µm 150x4.6 mm A
Selectosil-diol Sdiol 5 µm 150x4.6 mm D
Nucleosil NH2 NH2 5 µm 150x4.6 mm F
aFor supplier code see above

E-5
E.1.2.3 Isocratic Measurements
The determination of j0 is based on isocratic measurements which was done for thecompounds of the standard set (bold written compounds in table E1) and selected amino acidand peptide derivatives on the chromatographic systems listed in table E2. For these columnsa low rate of 1.5 ml/min. can be realised except for the permethylated b- cyclodextrine phase(CD) which worked at a flow rate was 1ml/min.
In the isocratic experiment the concentration on acetonitrile was increased in 5 % steps.The experiment started with a calibration time of 5 min. to allow an adjustment of the
column to the solvent mixture. The, the sample was injected and the chromatogram wasrecorded over 25 min. at constant solvent mixture. A washing time of 5 min with pureacetonitrile guaranteed that the sample was completely removed from the stationary phasebefore a new cycle was started.
For these measurements the temperature was kept constant at 25 °C.The retention factor k can be calculated according to eq. E1:
kt t
tR=
−1 0
0
[E1]
Plotting logk vs. the concentration of the organic modifier gives a function which allows alinear regression analysis. The intercept of the regression line is defined as logk0. Logk0 andthe slope S are needed to calculate j0 according to equation 6.
Temperature dependent measurements were performed on the Luna ODS column (Luna1)at 25 and 40 °C which were kept constant with the help of a column thermostat at a flow rateof 1 ml/min.
E.1.2.4 Linear gradient measurements
E.1.2.4.1 Variation of the gradient time
To test the influence of the gradient time on the curving different gradient measurementswere performed using the standard set and the ODS2-IK (In) column. The followingexperiments were performed:
A) 0.0-0.5 min. 0% AcN0.5-2.5 min. 100% AcN2.5-3.5 min. 100% AcN3.5-3.7 min. 0 % AcN3.7-5.0 min 0 % AcN
B) 0.0-0.5 min. 0% AcN0.5-4.0 min. 100% AcN4.0-5.0 min. 100% AcN5.0-5.2 min. 0 % AcN5.2-7.5 min 0 % AcN

E-6
C) 0.0-5.0 min. 0% AcN5.0-30.5 min. 100% AcN30.5-35.0 min. 100% AcN35.0-40 min. 0 % AcN40-45 min 0 % AcN
The correlation factors show that the best correlation was received from experiment Bwhich was chosen for the CHI determination.
Table E4: Test of the influence of the gradient time tG on the curving (Inertsil)
Gradient experiment r2 Slope A Intercept B
A) 0.9612 49.645 -107.47
B) 0.9843 31.105 -73.231
C) 0.9715 4.8457 -15.497
E.1.2.4.2 Effect of the linear gradient on the bandwidth
A linear gradient elution was performed varying the composition of the organic modifierfrom 0 to 100 % over a gradient time of 2.5, 3.5, 5.5, 7.5, 10, 15, 30, 45, 60 and 90 min. Thecolumn temperature was kept constant at 25 °C (±0.5 K). Thus, the retention times andbandwidths vary less than 1% and 5%, respectively. The bandwidth of the signals wasdetermined automatically with the help of the HP ChemStation software.
E.1.2.4.3 Effect of organic modifier
Different solvents were used as organic modifiers; such as AcN, MeOH and TFE. In allexperiments the aqueous phase was 0.05 molar ammonium acetate buffer (pH 7.4).
A short ODS column (Luna2) allowed a flow rate of 2 ml/min still giving well resolvedsignals for the standard set. Using a gradient time of 2.5 min. leads to similar results asreceived for the Luna1 column. The retention times used for the plot in Fig. 11 are given intable A6.
E.1.2.5 Calculation of CHI
The calculation of the CHI values for all compounds is based on the correlation of theretention times tR measured under linear gradient conditions and the isocratically determinedj0 of the standard set (table E2)70. Performing a linear regression of j0 vs. tR of thecompounds of the standard set gives the parameters A and B in eq. E2:
ϕ0 = ⋅ +A t BRS [E2]
These parameters were then used to calculate the CHI values for the test compounds or forthe peptide derivatives according to equation E3.
CHI A t BRx= ⋅ + [E3]
Hence, the CHI value should be similar in the magnitude as j0 but it is measured undergradient conditions.

E-7
E.1.2.6 Determination of the coefficients characterising the chromatographic partitioningsystem
Based on this correlation the CHI values for the 30 test compounds (table E1) with knowndescriptors were determined and are given in table A5. The multiple regression analysiscarried out using the Drugidea TM software package (CHEMICRO Ltd., Budapest, Hungary)and the SmartWare II (INFORMIX Software Inc.) gives the coefficients c, r, s, a, b and n(table 5) which characterise the partitioning system. The determination of the CHI values forthe 30 test compounds was done for all chromatographic systems listed in table E2 and E3.Based on the variety of the column parameters the five columns in table E2 were selected forthe peptide studies.
The CHI values for peptide derivatives are in part discussed in the results. Further datanecessary for the deduction of fragmental descriptors are given in table A7.
The CHI values of the ureido sugars are given table A10.
E.1.2.7 Determination of solute descriptors
Vx and R2 were calculated with a self-made software routine257. The calculation of theexcess molar refraction R2 is based on the refractive index which is an additive property andcan be approximated from substructure using the ACD/Chem Sketch software258.
With known values for Vx and R2 the equation system eq. 7 is reduced to three unknownparameters. Using the solver function in EXCEL (MICROSOFT OFFICE 97) the best fittingresults for p2H, åa2
H and åb2H can be found.
The descriptors for the peptide derivatives are discussed in the main part of the thesis.Additional experimental data are given in table A8 and A9.
The experimentally determined descriptors of the ureido sugar derivatives can be found intable A10.
E.1.2.8 Calculation of the fragmental CHI values and fragmental descriptors
Based on the additivity concept the CHI value or the descriptor of a tripeptide of thegeneral formula X-1Xaa-2Xaa-3Xaa-Y should be the sum of the contributions of thefragmental data of X, 1Xaa, 2Xaa, 3Xaa and Y. Hence, we can built an equation system for allinvestigated tripeptides which will find the minimum of the least square sum with the help ofthe solver function in EXCEL (MICROSOFT OFFICE 97).
E.1.3 Infrared measurementsWith the exception of the phospholipid-peptide mixtures the studies were performed on the
FTIR spectrometers IFS 25 and IFS 66 (BRUKER). The irradiation was produced by globar; atraditional DTGS was used as a detector. The interferogram was transformed by phasecorrection, zero filling factor 2. The sample spectra were recorded in the absorbance modeusing the pure solvent as a background. In general the resolution was 2 cm-1. In selected casesthe NH region of the ureido sugars the resolution was enhanced on 0.25 cm-1 which can berealised on the IFS 66. The number of the accumulated scans varied between 32 and 100 butwas constant within a group of measurements. To reduce the H2O concentration in theinstruments they were permanently purged with dry air.
The thickness of the IR cell and concentration was adapted to the absorption characteristicof each sample solutions.

E-8
E.1.3.1 Temperature measurements
Usually the measurements were performed at 25 °C. For the intermolecular association ofalcohols and diols the temperature was varied in the range of 5 to 30 °C which was realised bya sample holder purged with thermostated water received from a cryostat. The accuracy of thetemperature can be given in ±0.2 K in the sample cell which was permanently controlled by anexternal thermocouple.
The intramolecular hydrogen bond behaviour was tested on selected substances between 0and 50 °C and -15 to 30 °C for the ureido sugar derivatives and the diols, respectively, usingthe variable temperature cell P/N 21500 (GRASEBY SPECAC). The cooling agent was amethanol/dry ice mixture. The accuracy of the temperature was checked by a separatethermocouple and did not exceed the chosen temperature by more than ± 0.2 K. Thetemperature was varied in 5 K steps with a 5 min delay before the measurement in order toallow the temperature adjustment. The measurements were performed in a 1 mm NaCl cell oran CaF2 cell for low temperature studies.
The temperature variations for the study of the intramolecular association behaviour of thepeptide derivatives were realised using a temperature device equipped with Peltier coolingelements. Spectra at -10, -5, 15, 25 and 40 °C were recorded in solutions of carbontetrachloride using a 3mm NaCl cell.
E.1.3.2 Solvent effect on the conformers
E.1.3.2.1 Peptide investigation
Methylene chloride solutions of peptide concentration of 0.003 to 0.009 mol/l aresufficiently transparent in the NH and amide I region also when a NaCl cell of 3mm thicknesswas used. The solutions of the polar solvents (HFiP, D2O and DMSO-d6) were performed in aCaF2 cell (0.114 mm). The concentration was accordingly higher and varied between 0.03 and0.09 mol/l.
Some dipeptide and tripeptide derivatives were found to be sufficiently soluble in apolarsolvents as carbon tetrachloride. At concentrations of 0.002 for the dipeptide and 0.005 mol/lfor the tripeptide derivatives no intermolecular hydrogen bonds were observed.
The region of the ester carbonyl and the amide I and II vibration was cut from the wholespectra. A two-point base line correction was applied.
E.1.3.2.1.1 Phospholipid:peptide mixtures
Measurements were performed on a Vector 22 FTIR spectrometer (BRUKER) using athermostated out-of-compartment overhead ATR unit. The heating and cooling curves werecontrolled by the instrument’s computer. Ca. 0.7 mg of the compounds were dissolved in100ml of a mixture of CHCl3:MeOH (1:1). In the mixtures of DHPC and the tripeptidederivative the stochiometric amount of the peptide was added to the phospholipid solution.Then, the reaction vessel was sonicated for 10 minutes at a temperature above the phasetransition temperature of the lipid. The solution was slowly spread on a trapezoid-shapedZnSe-ATR crystal (dimensions: 72x10x6mm, face angle J=45°) which was mounted in theATR unit (GRASEBY SPECAC). The lower part of the compartment could be cooled orheated by an agent continuously flowing from a cryostat which allowed a temperaturevariation between -14 and 85 °C. A separate thermocouple showed that the temperature in thecrystal was constant after a delay of 3 min. tolerating a temperature gradient of ±0.1 K. Thesubstance multilayer on the crystal surface was always higher than the penetration depth of theevanescent wave. Then, the upper side of the ATR plate was covered with a self-built cell

E-9
which allowed purging the crystal with dry nitrogen or covering the material with ca. 0.5 mlD2O in order to guarantee full hydration.
E.1.3.2.2 Ureido sugar derivatives
Infrared spectra of different ureido sugars were recorded as CHCl3 solutions inconcentrations of ca. 0.001 mol/l. A NaCl cell with a thickness of 3mm was used for allinvestigations.
E.1.3.3 Intermolecular association behaviour
E.1.3.3.1 Alcohol-amine associates
A CaF2 cell of the thickness 3mm was used for these studies. The alcohol solutions inmethylene chloride were sufficiently diluted (ca 0.03 mol/l) in order to avoid intermolecularassociation. In order to form the associate complex the proton acceptor compounds wereadded to the alcohol solution. Hence, the amine concentration varied between 0.02 and 1.0mol/l. Particular attention was taken in the region of low amine concentration by checking theconcentration by an internal signal of the pyridines.
The alcohol and the amine complexes were investigated at 12 and 32 °C which wasrealised in a water cooled sample holder purged with thermostated water.
The procedure was as follows: At first the alcohol solution was recorded at bothtemperatures. Then, the amine was added and the measurements were repeated beginning atlow temperatures.
E.1.3.3.2 Alcohol-peptide associates
Investigations at 25 °C were performed using a 3mm NaCl. The procedure of themeasurements was similar as described for alcohol-amine associates: The alcohol dissolved inmethylene chloride (0.01- 0.005 mol/l) were recorded without proton acceptor compounds andwith different amounts of the peptide compound. The peptide concentration varied in therange of 0.005 to 0.05 mol/l. As a measure for the association the integral absorbance between3655 and 3480 cm-1, and 3635 and 3525 cm-1, for HFiP and phenol, respectively, was taken asa measure for the free OH species. Furthermore, the signals of the acceptor functions wereused to calculate the equilibrium constant after a peakfitting procedure was applied to thecomplex band profile.
E.1.3.4 Band deconvolution and peakfitting
There are two general approaches in the analysis of complex band profiles namely the banddeconvolution and the peakfitting method.
The identification of the number of overlapping bands can be done with the deconvolutionmethod implemented in the OPUS software package (BRUKER) which narrows the bandwidth using Lorentzian band profiles. In the literature the difficulties of this technique arewidely discussed259, 260, 261, 262. On the example of Z-Val-Val-Val-OMe we tested the influenceof the deconvolution factor on the ratio of the integral intensity of the bands always keeping inmind that no overcompensation occurs.

E-10
0
5
10
15
20
25
30
0
1000
2000
5000
7000
1000
0
1500
0
Deconvolution Factor
Inte
gral
Fig. E3: Effect of the deconvolution factor on the ratio of the integral intensities of thedeconvoluted bands of Z-Val-Val-Val-OMe in the region between 1800 and 1600 cm-1
At a deconvolution factor of 0 we have plotted the integrals received from peakfitting ofthe original spectra. Our tests showed that the intensity ratios of the fitted signals is the sameas the ratio of the deconvoluted signals of the pure tripeptide solutions.
Hence for a quantitative analysis we have taken the number of signals from thedeconvolution using a deconvolution factor of 2000 and applied a peakfitting procedure on theoriginal data in the baseline corrected IR region between 1800 and 1600 cm-1.
Here we have to chose between two different software packages: the peakfit functionimplemented in the OPUS software allowing a simulation with Gauss-Lorentzian sumfunctions and the „Peakfit-program for non linear curve fitting“, Vs. 4.0 and Vs. 5.0(JANDEL SCIENTIFIC) which has a higher variety of functions to simulate IR band profiles.With the exception of the studies of the intramolecular association behaviour of the peptidederivatives (Pearson function) and the ureido sugar derivatives (Voigt functions), Gauss-Lorentzian sum function were used in the fitting procedure. A Levenberg-Marquardtprocedure was followed to receive a coincidence between experimental and fitted band profilewith r2 ³0.9995. The band maxima and the integral areas were taken as a measure in thediscussion.
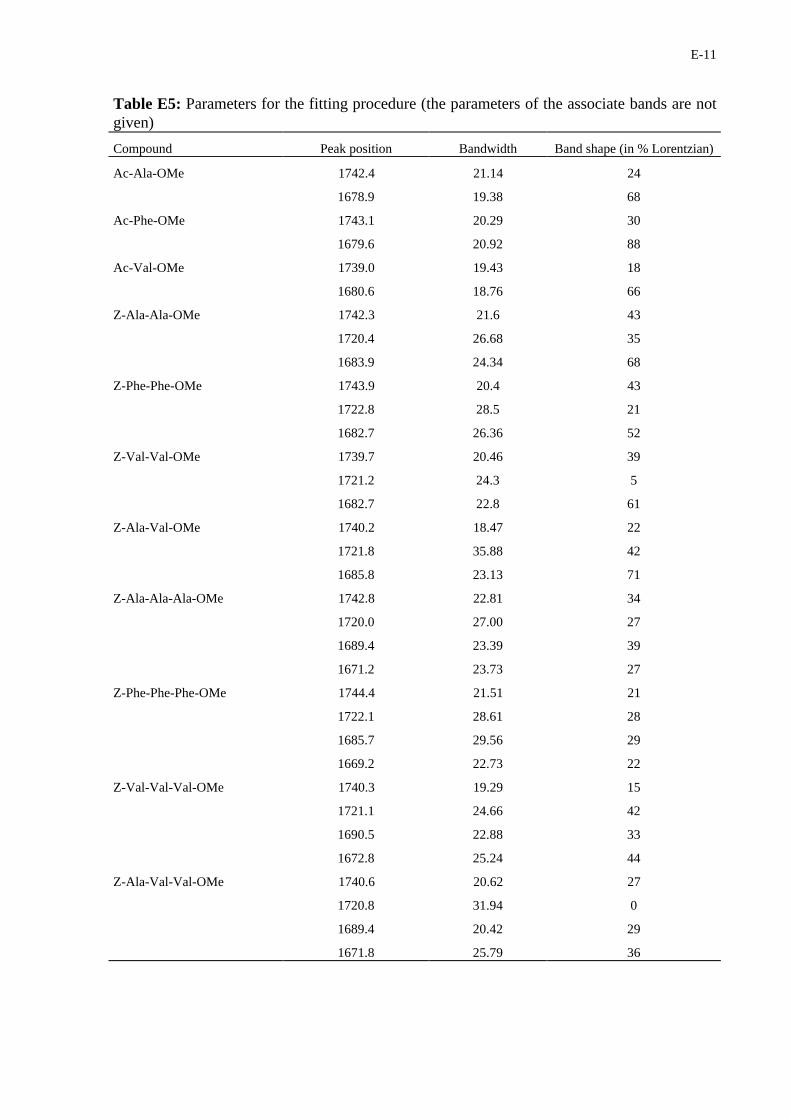
In order to study the intermolecular association the acceptor compounds were recorded atdifferent concentrations. The peakfitting approach was applied only allowing the bandintensity to vary. The parameters of the fitted Gauss-Lorentzian sum functions are given intable E5.
The integral intensities were plotted vs. the concentration. The linear regression of thecurves of gives the integral molar extinction coefficients. In the presence of the alcohol twoadditional signals were introduced but for the non-associated signals the band profile was keptunchanged. (Table E5)
E-11
Table E5: Parameters for the fitting procedure (the parameters of the associate bands are notgiven)
Compound Peak position Bandwidth Band shape (in % Lorentzian)
Ac-Ala-OMe 1742.4 21.14 24
1678.9 19.38 68
Ac-Phe-OMe 1743.1 20.29 30
1679.6 20.92 88
Ac-Val-OMe 1739.0 19.43 18
1680.6 18.76 66
Z-Ala-Ala-OMe 1742.3 21.6 43
1720.4 26.68 35
1683.9 24.34 68
Z-Phe-Phe-OMe 1743.9 20.4 43
1722.8 28.5 21
1682.7 26.36 52
Z-Val-Val-OMe 1739.7 20.46 39
1721.2 24.3 5
1682.7 22.8 61
Z-Ala-Val-OMe 1740.2 18.47 22
1721.8 35.88 42
1685.8 23.13 71
Z-Ala-Ala-Ala-OMe 1742.8 22.81 34
1720.0 27.00 27
1689.4 23.39 39
1671.2 23.73 27
Z-Phe-Phe-Phe-OMe 1744.4 21.51 21
1722.1 28.61 28
1685.7 29.56 29
1669.2 22.73 22
Z-Val-Val-Val-OMe 1740.3 19.29 15
1721.1 24.66 42
1690.5 22.88 33
1672.8 25.24 44
Z-Ala-Val-Val-OMe 1740.6 20.62 27
1720.8 31.94 0
1689.4 20.42 29
1671.8 25.79 36

E-12
Table E6: Integral molar extinction coefficients received from linear regression analysis of the fitted spectra (1800-1600 cm-1) and from theintegral of the NH band [in l/mol*mm]
Substance nNH nEster nAc/Z nPeptideI nPeptideII
eint. r2e int. r2
e int. r2e int. r2
eint. r2
Ac-Ala-OMe 358 0.9923 1028 0.9807 1631 0.9799
Ac-Val-OMe 356 0.9927 1018 0.9945 1722 0.9945
Ac-Phe-OMe 372 0.9923 1055 0.9914 1885 0.9921
Z-Ala-Ala-OMe 664 0.9904 1425 0.9748 1503 0.9717 1895 0.9883
Z-Val-Val-OMe 730 0.9966 1333 0.9963 1206 0.9971 1800 0.9978
Z-Ala-Val-OMe 680 0.997 801 0.995 2043 0.9978 1636 0.9949
Z-Phe-Phe-OMe 775 0.9819 1181 0.9916 1467 0.9936 1782 0.9819
Z-Ala-Ala-Ala-OMe 826 0.9971 1212 0.9971 1521 0.9963 1296 0.9970 1715 0.9930
Z-Val-Val-Val-OMe 829 0.9942 909 0.9827 1478 0.984 533 0.9474 2193 0.987
Z-Ala-Val-Val-OMe 887 0.9936 959 0.9914 1553 0.9918 1056 0.9845 1856 0.9984
Z-Phe-Phe-Phe-OMe 960 0.9556 1093 0.9666 1408 0.9693 1623 0.9687 1182 0.9556

E-13
E.1.4 NIR measurementsOur IFS 66 can be adapted to the near infrared region. For the measurement of the overtone
signal of the NH function the globar is still delivers sufficient irradiation which can bedetected with the DTGS detector. For the absorbance spectra 100 scans were accumulated.The solutions were measured in a 2 cm quartz cell using the pure solvent as backgroundspectra.
E.1.5 VCD measurementsThe measurements and calculations were performed in the group of L. A. Nafie and T. B.
Freedman at the University of Syracuse. Solutions of the diastereoisomers of Z-Ala-Phe-Val-OMe in carbon tetrachloride (ALDRICH, reagent grade, stored over molecular sieves) wereprepared at concentrations of ca. 0.002 mol/l. The solutions were recorded in the COstretching region using a BaF2 cell with 5 mm spacers. All studies were performed at -5, 5 and25 °C. The IR and VCD spectra were recorded on a NICOLET MAGNA 850 FTIRspectrometer equipped with an accessory VCD bench at a resolution of 4 cm-1263. IRmeasurements consisted of 32 scans. VCD measurements were collected in simultaneousrapid-scan mode (10 000 scans, 3.75 hours) and have been corrected for baseline artefacts bysubtraction of solvent VCD spectra.
E.1.6 Quantum mechanical calculationsTwo general quantum mechanical approaches were applied for the geometry optimisation
of molecules:· Semiempirical approach (AM1) uses on standard parameterisation of bond length and
angles. The Austin Model (AM1)264 has given reliable results for the optimisation ofcompounds with intramolecular hydrogen bonds. The AM1 method is implemented inthe HYPRCHEM package (Vs. 4.5) which was used for the geometry optimisation ofthe guanine derivatives and the ureido sugar derivatives.
· Ab initio calculations were carried out on the model compound MeOCO-Ala-Ala-NMe(LL) using the Hartree-Fock 6-31G(d) level of Gaussian 98 (Gaussian Inc. Pittsburgh,PA). These calculations were performed by T. B. Freedman at the University ofSyracuse and were the requirement for the calculation of VCD spectra using magneticfield perturbation calculations (MFP) of the VCD intensities265, 266, 267.
E.1.6.1 Guanine derivatives
Due to the ethoxy chain the number of conformers received by rotation of this functionwould be relatively large. Thus, to start with we have taken the structures which were knownto be preferred from previous results44 of a force field calculation. In fact, backfoldedconformation was the most stable arrangement. A number of starting conformations wascreated recognising the possible occurrence of intramolecular hydrogen bond formation basedon the backfolded conformer. As a result the differences of the total energies and the netcharges of the atoms were discussed in comparison to the NMR results.
E.1.6.2 Ureido sugar derivatives
The energy optimisation of the N-(2-amino-2-deoxy-b-D-glucopyranoside)-N’-carbamoyl-L-amino acid and dipeptide esters was performed with the help of the semi-empirical AM1calculation method implemented in the HYPERCHEM program package. Therefore, a numberof initial conformations was created recognising the occurrence of possible intramolecularhydrogen bonds. The energy optimisation was performed without any restrictions regardingdihedral angles.

E-14
E.1.7 UV/VIS measurementsA double beam UV/VIS spectrometer Lambda 16 (PERKIN ELMER) was used for the
recording of the UV/VIS spectra in the region between 500 and 190 nm. A slit width of 2 nmand recording speed of 120 nm/min was used as experimental parameters. Solutions of thecompounds in H2O, methylene chloride and acetonitrile solutions were measured in a 1cmquartz cell using the pure solvents as reference probes. The concentrations wereapproximately 10-6 mol/l.
E.1.8 CD measurementsUsing a J720 spectropolarimeter (JASCO) the solutions of Ac-Val-OMe, Z-Val-Val-OMe,
Z-Val-Val-Val-OMe and Z-Val-D-Val-Val-OMe were investigated between 180 and 260 nmin different solutions and in dependence of the temperature. The cell length of the quartz cell(QS, HELLMA) was 0.0096 cm. At a resolution of 0.1 nm and a band width of 1.0 nm thespectra were scanned with a speed of 10 nm/min. The sensitivity of the detector was 20 mdeg.Four scans were accumulated for each spectrum. Measurements of the AcN and HFiPsolutions were performed at 10, 20, 30 and 40 °C. Due to the absorbance of the solvent in thefar UV the methylene chloride solutions were recorded in the region between 210 and 260 nmat 10, 15, 20 and 25 °C. The temperature in the cell which was put into a thermostated sampleholder was checked with a external thermocouple. The temperature accuracy was ±0.2 K. Theconcentration of the solution was ca. 0.005 mol/l in order to guarantee similar condition as inthe IR spectra. It was interesting to study the effect of small amounts of HFiP on theconformational behaviour of the peptides. Therefore, the compounds were dissolved inacetonitrile and methylene chloride solutions containing ca. 0.01 to 0.005 mol/l HFiP. In thesecases the HFiP solutions were recorded as background spectra, otherwise the pure solventswere used.
E.1.9 NMR-measurementsE.1.9.1 Standard measurements
1H NMR spectra of the saturated D2O solutions were recorded on a 500 MHz and on a 400MHz NMR spectrometer (VARIAN). 32 scans were accumulated for the 1H NMR spectra at atemperature of 27 °C for routine measurements, Otherwise, the number of scans was chosenaccording to the sensitivity of the sample. In selected cases 1H/13C correlation experiments(COSY and NOESY) of the DMSO-d6 solutions were performed to support the assignment ofthe signals.
E.1.9.2 Temperature measurements
1H NMR spectra of the ureido sugar derivatives were recorded on a VARIAN Unity Plus500 MHz spectrometer equipped with a variable temperature probe. The concentration of theureido glucoside derivatives dissolved in CDCl3 and in DMSO-d6 was chosen similarly to theIR experiment. The temperature was varied in the range between 25 and 60 °C in 5 K steps.
E.1.9.3 H/D exchange experiements
The H/D exchange measurements were performed in CDCl3 and followed the proceduredescribed. During the experiment the temperature was kept constant at 25 °C.
E.1.9.4 HFiP titration
The peptide derivatives were dissolved in CDCl3 at concentrations of 0.008 to 0.01 mol/l.1ml of the solution was filled in a 5 mm NMR tube. The recording of the 1H NMR signalswas done on a 400 MHz NMR spectrometer (VARIAN). Generally, 32 scans were

E-15
accumulated at a temperature of 27 °C. Then, defined amount of HFiP were added to thesolution in the NMR tube. The carefully mixed solution was then recorded again. Theprocedure was repeated until 110 ml of HFiP were in total added to the peptide solution. Thepositions of the NH and the CaH were used to monitor the association and conformationalvariation.
E.1.10 Diffusion experiments
Measurements were performed on the diastereoisomers of Z-Ala-Phe-Val-OMe usingadequate concentrations as were used for the determination of the intramolecular association.Infrared spectroscopy was herein used for the concentration determination. The diffusionapparatus (Fig. E2) followed the method described by Anderson268 and, thus, will be onlydescribed shortly: A capillary tube of a diameter of 1 mm and a volume of 0.4 ml was filledwith the peptide solution using a syringe and placed vertically in a 50 ml vessel containing thepure solvent. The capillary was left for defined times in the solvent reservoir and was thenremoved and the concentration was determined IR spectroscopically. 15 hours were chosen asthe duration of the experiments in carbon tetrachloride. After 60 min. the peptideconcentration in the capillary was significantly decreased. Special care was taken to keep thetemperature of the diffusion vessel and the solutions constant at 25 °C (±0.5 K). Preliminarytests have shown that in the time intervals chosen for the experiments the decrease of theconcentration is linearly. Hence the diffusion rate v can be calculated from Dc/Dt (Table A15).
The integrals of the free NH and NHC5 stretching vibration were used as a measure of thepeptide concentration for toluene and carbon tetrachloride solutions, respectively. In carbontetrachloride the CH stretching vibrations of the compounds are accessible and can be used asinternal standard for the concentrations.
Fig. E2: Diffusion apparatus by Anderson

E-16
E.2 Additional data
In this part additional data are summarised which were used to create the plots, to receiveequilibrium constants or fragmental values. To differentiate these tables and plots fromprevious data they were indicated by the letter „A“. The tables are ordered according to theiroccurrences in the text.
Table A1: LogPOct values determined experimentally and calculated by the Rekker methodfor ACV and DCV derivatives44
Compound logP (exp) logP (calc)
ACV -1.56 -1.55
NAcACV -1.30 -1.26
OAcACV -1.08 -0.58
diAcACV -0.83 -0.29
DCV -1.08 -1.05
OAcDCV -0.61 -0.08
Table A2: Linear regression parameters for the CHI determination based on the j0 values ofthe standard set
Chromatographic column r2 Slope A Intercept B
IAM 0.9958 27.626 -66.585
CD 0.9934 37.878 -104.34
CN 0.9951 23.012 -19.164
Pro 0.9843 30.454 -66.992
E-17
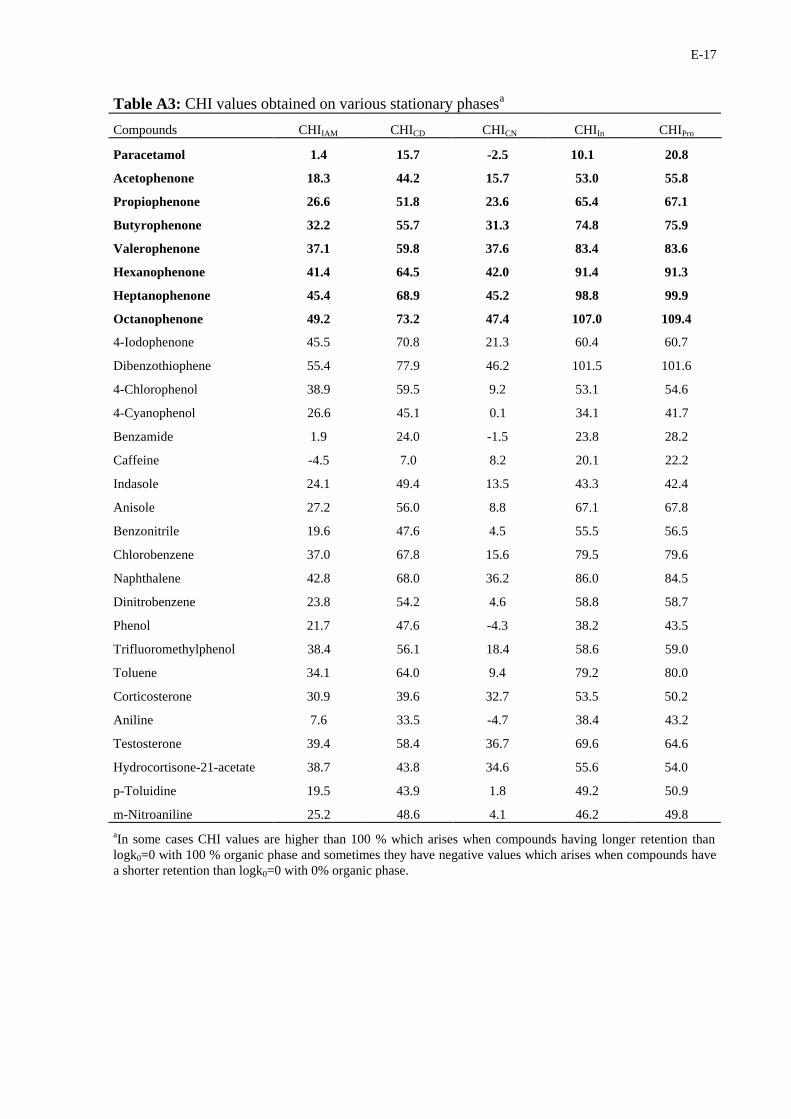
Table A3: CHI values obtained on various stationary phasesa
Compounds CHIIAM CHICD CHICN CHIIn CHIPro
Paracetamol 1.4 15.7 -2.5 10.1 20.8
Acetophenone 18.3 44.2 15.7 53.0 55.8
Propiophenone 26.6 51.8 23.6 65.4 67.1
Butyrophenone 32.2 55.7 31.3 74.8 75.9
Valerophenone 37.1 59.8 37.6 83.4 83.6
Hexanophenone 41.4 64.5 42.0 91.4 91.3
Heptanophenone 45.4 68.9 45.2 98.8 99.9
Octanophenone 49.2 73.2 47.4 107.0 109.4
4-Iodophenone 45.5 70.8 21.3 60.4 60.7
Dibenzothiophene 55.4 77.9 46.2 101.5 101.6
4-Chlorophenol 38.9 59.5 9.2 53.1 54.6
4-Cyanophenol 26.6 45.1 0.1 34.1 41.7
Benzamide 1.9 24.0 -1.5 23.8 28.2
Caffeine -4.5 7.0 8.2 20.1 22.2
Indasole 24.1 49.4 13.5 43.3 42.4
Anisole 27.2 56.0 8.8 67.1 67.8
Benzonitrile 19.6 47.6 4.5 55.5 56.5
Chlorobenzene 37.0 67.8 15.6 79.5 79.6
Naphthalene 42.8 68.0 36.2 86.0 84.5
Dinitrobenzene 23.8 54.2 4.6 58.8 58.7
Phenol 21.7 47.6 -4.3 38.2 43.5
Trifluoromethylphenol 38.4 56.1 18.4 58.6 59.0
Toluene 34.1 64.0 9.4 79.2 80.0
Corticosterone 30.9 39.6 32.7 53.5 50.2
Aniline 7.6 33.5 -4.7 38.4 43.2
Testosterone 39.4 58.4 36.7 69.6 64.6
Hydrocortisone-21-acetate 38.7 43.8 34.6 55.6 54.0
p-Toluidine 19.5 43.9 1.8 49.2 50.9
m-Nitroaniline 25.2 48.6 4.1 46.2 49.8
aIn some cases CHI values are higher than 100 % which arises when compounds having longer retention thanlogk0=0 with 100 % organic phase and sometimes they have negative values which arises when compounds havea shorter retention than logk0=0 with 0% organic phase.

E-18
Table A4: Retention times tR at different gradient times tG, They were used for the CHIdetermination (see table 8) [in min.]
tR at tG [min] 2.5 3.5 5.5 7.5 10 15 30 45 60 90
Ac-Ala-OMe 3.635 3.854 4.212 4.501 4.834 5.303 6.402 7.307 7.856 9.222
Ac-D-Ala-OMe 3.632 3.847 4.211 4.507 4.829 5.314 6.423 7.302 7.891 9.178
Z-Ala-Ala-OMe 4.270 4.823 5.841 6.774 7.864 9.828 14.947 19.523 23.583 30.922
Z-Ala-Ala-Ala-OMe 4.094 4.611 5.558 6.424 7.446 9.277 14.116 18.469 22.394 29.370
Ac-Phe-OMe 4.147 4.652 5.563 6.392 7.348 9.033 13.356 17.151 20.466 26.878
Z-Phe-OMe 4.104 4.584 5.460 6.234 7.089 8.622 12.469 15.695 18.976 24.442
Z-Phe-Phe-OMe 5.048 5.821 7.316 8.760 10.504 13.768 22.750 31.049 39.110 54.384
Z-Phe-Phe-Phe-OMe 5.150 5.950 7.506 9.023 10.885 14.380 24.070 33.124 41.877 58.609
Ac-Val-OMe 3.880 4.288 4.983 5.580 6.247 7.376 10.157 12.468 14.511 18.075
Z-Val-Val-OMe 4.846 5.551 6.903 8.176 9.696 12.516 20.128 27.107 33.742 46.162
Z-Val-Val-Val-OMe 4.824 5.532 6.893 8.180 9.719 12.606 20.416 27.646 34.549 47.489
Z-Val-D-Val-Val-OMe 4.914 5.635 7.023 8.341 9.923 12.873 20.912 28.353 35.443 48.811
100/tG 40 28.57 18.18 13.33 10.00 6.67 3.33 2.22 1.67 1.11
1/100/tG 0.025 0.035 0.055 0.075 0.1 0.15 0.3 0.45 0.6 0.9
Table A5: Retention times tR and bandwidth w for the phenylalanyl derivatives in dependenceof tG taken for the 230 nm reference band [in min.]
Ac-Phe-OMe Z-Phe-OMe Z-Phe-Phe-OMe Z-Phe-Phe-Phe-OMe
tG tR w tR w tR w tR w
2.5 4.147 0.0501 4.104 0.0729 5.046 0.0991 5.15 0.052
3.5 4.653 0.0394 4.584 0.0455 5.821 0.0692 5.95 0.0543
5.5 5.562 0.0443 5.459 0.0595 7.316 0.0891 7.505 0.062
7.5 6.391 0.047 6.234 0.0621 8.759 0.1025 9.025 0.0691
10 7.344 0.0537 7.089 0.0924 10.501 0.0508 10.887 0.0635
15 9.033 0.0556 8.622 0.0591 13.766 0.0589 14.375 0.0584
30 13.355 0.0744 12.47 0.0906 22.747 0.0858 24.063 0.0848
45 15.692 0.1456 15.692 0.1456 31.053 0.1065 33.119 0.1063
60 20.46 0.1107 18.993 0.1787 39.039 0.1321 41.897 0.1364
90 26.9 0.1462 24.422 0.2143 54.369 0.1756 58.578 0.1717

E-19
Table A6: Effect of the organic modifier on the retention time tR measured on a ODS columnLuna2 [in min.]
Substance organic modifier
j0 AcN MeOH TFE
Ac-Ala-OMe 28.03 1.2235 1.401 1.444
Ac-D-Ala-OMe 27.77 1.2265 1.407 1.45075
Z-Ala-Ala-OMe 60.39 2.001 2.444 2.3795
Z-Ala-Ala-Ala-OMe 55.79 1.917 2.436 2.38835
Ac-Phe-OMe 56.98 1.8705 2.329 2.976
Z-Phe-OMe 56.62 1.822 2.2865 2.393
Z-Phe-Phe-OMe 78.36 2.644 2.974 3.179
Z-Phe-Phe-Phe-OMe 80.34 2.744 3.0805 3.4515
Ac-Val-OMe 47.33 1.591 1.999 2
Z-Val-Val-OMe 73.96 2.444 2.823 2.977
Z-Val-Val-Val-OMe 73.55 2.466 2.9085 3.02
Z-Val-D-Val-Val-OMe 75.36 2.5005 2.946 3.076

E-20
Table A7: Additional CHI values for peptide derivatives used for the calculation ofdescriptors
Compounds CHI CD CHI IAM CHI CN CHI Pro CHI In
Z-Ala-D-Trp-Val-OMe 45.78 29.01 44.52 64.84 61.80
Z-Ala-D-Phe-Val-OMe 42.65 26.10 43.44 65.63 65.54
Z-Ala-D-Met-Val-OMe 37.55 23.20 40.12 62.21 58.81
Z-Ala-D-Leu-Val-OMe 38.94 24.44 42.16 67.95 63.99
Z-Ala-D-Tyr-Val-OMe 38.12 24.32 39.21 54.81 50.99
Z-Ala-D-Val-Val-OMe 36.53 22.72 39.47 62.86 72.63
Z-Ala-D-His-Val-OMe 74.48 30.65 34.91 60.50 62.22
Z-Ala-D-Glu-Val-OMe 28.51 39.90 32.11 48.06 48.09
Z-Ala-D-Ser-Val-OMe 26.68 18.47 31.39 45.88 41.44
Z-Ala-D-Asn-Val-OMe 23.89 17.18 30.87 42.05 37.58
Z-Ala-D-Tyr(OB)-Val-OMe 51.29 32.60 49.23 78.86 77.45
Z-Ala-D-Lys(NZ)-Val-OMe 47.28 29.97 46.50 73.89 72.07
Z-Ala-D-Asp(OB)-Val-OMe 44.83 27.91 45.61 71.20 69.22
Z-Ala-D-Ser(OB)-Val-OMe 43.54 27.85 44.98 70.64 68.44
Z-Ala-D-Arg(Tos)-Val-OMe 42.58 29.48 43.30 62.01 61.94
Z-Ala-L-Val-Gly-OEt 31.53 17.72 - 53.30 48.00
Z-D-Ala-Gly-Val-OMe 30.36 19.06 - 51.83 45.54
Z-Ala-D-Val-Gly-OEt 32.04 18.26 33.02 52.51 48.56
Z-Ala-D-Val-Ala-OMe 30.91 17.68 - 53.92 48.25
Z-Gly-Ala-Gly-OMe 23.65 8.71 19.38 41.67 41.53
Z-Gly-L-Ala-Val-OMe 30.41 17.93 31.77 - 44.69
Z-Gly-L-Ala-Phe-OMe 37.88 24.33 38.95 55.92 52.08
Z-Gly-D-Ala-Phe-OMe 37.44 23.81 39.21 55.88 51.66
Z-Gly-L-Phe-Gly-OEt 38.76 24.25 - 57.48 52.63
Z-Gly-D-Phe-Gly-OEt 38.73 24.00 38.80 55.99 52.45
Z-Ala-Val-Tyr-OMe 34.29 26.34 39.31 57.82 57.75
Z-Ala-Val-Pro-OMe 35.98 13.50 35.43 58.69 -
Z-Ala-D-Val-Leu-OMe 39.09 25.22 42.16 68.04 64.20
Z-Leu-Val-Val-OMe 38.24 23.08 42.80 74.40 71.12
Z-Ala-Val-Val-OBzl 47.34 29.50 47.00 74.74 72.63
Z-Ala-D-Val-Val-OBzl 47.36 30.49 47.24 76.94 72.63
Z-Ala-Val-Val-OBu 42.84 27.35 44.51 75.58 73.32
Z-Ala-Phe-Val-OBu 47.34 30.79 48.61 81.32 79.29
Boc-Ala-Phe-Val-OMe 36.53 22.33 39.54 - 62.36
Boc-Ala-Pro-Val-OMe 24.11 8.50 27.40 55.08 54.98

E-21
(Table 7, continued)
Z-Ala-Val-OMe 36.51 21.08 33.38 58.92 55.47
Z-Ala-Phe-OMe 47.27 29.15 41.34 57.54 67.29
Z-Phe-Val-OMe 51.56 32.19 46.00 75.24 75.01
Z-Ala-Ser-OMe 58.31 9.87 47.92 42.52 42.33
Z-Ala-Trp-OMe 51.24 32.50 43.09 65.64 65.56
Table A8: Additional experimental descriptors received from the CHI values, The descriptorsof the tripeptide derivatives were used for the calculation of fragmental descriptors
Compound R2 p2H åa2
H åb2H Vx
Z-Ala-L-Val-Gly-OEt 1.138 4.78 0.29 1.77 3.169
Z-Ala-D-Val-Gly-OEt 1.138 4.48 0.35 1.81 3.169
Z-Ala-D-Val-Ala-OMe 1.123 4.70 0.28 1.79 3.169
Z-Gly-Ala-Gly-OMe 1.195 3.72 0.08 1.68 2.605
Z-Gly-L-Ala-Val-OMe 1.141 4.03 0.50 1.80 3.028
Z-Gly-D-Ala-Phe-OMe 1.856 5.09 0.31 1.88 3.354
Z-Gly-L-Ala-Phe-OMe 1.856 5.11 0.32 1.86 3.354
Z-Gly-L-Phe-Gly-OEt 1.872 5.51 0.25 1.79 3.354
Z-Gly-D-Phe-Gly-OEt 1.872 5.19 0.31 1.85 3.354
Z-Ala-Val-Phe-OMe 1.807 6.18 0.16 1.95 3.776
Z-Ala-Val-Leu-OMe 1.096 5.31 0.21 1.87 3.591
Z-Ala-Val-Tyr-OMe 2.047 6.16 0.34 2.12 3.835
Z-Ala-Val-Pro-OMe 1.482 5.30 0.00 1.84 3.342
Z-Ala-D-Val-Leu-OMe 1.096 5.25 0.20 1.86 3.591
Z-Leu-Val-Val-OMe 1.064 5.95 0.00 1.97 3.873
Z-Ala-Val-Val-OBzl 1.766 6.91 0.03 1.95 4.058
Z-Ala-D-Val-Val-OBzl 1.766 6.91 0.02 1.94 4.058
Z-Ala-Val-Val-OBu 1.083 6.03 0.07 1.89 3.873
Z-Ala-Phe-Val-OBu 1.768 7.09 0.00 1.98 4.199
Boc-Ala-Phe-Val-OMe 1.096 5.32 0.18 1.90 3.591
Boc-Ala-Pro-Val-OMe 0.792 4.37 0.00 1.89 3.157
Z-Ala-Val-OMe 0.969 3.15 0.23 1.50 2.630
Z-Ala-Phe-OMe 1.670 4.35 0.13 1.50 2.956
Z-Phe-Val-OMe 1.640 5.00 0.08 1.54 3.238
Z-Ala-Ser-OMe 1.215 3.62 0.32 1.25 2.407
Z-Ala-Trp-OMe 2.549 5.42 0.14 1.60 3.186

E-22
Table A9: Dipeptide descriptors predicted from fragmental descriptors
Compound R2 p2H åa2
H åb2H Vx
Z-Ala-Ala-OMe 1.042 3.62 0.12 1.17 2.313
Z-Val-Val-OMe 0.986 4.91 0.09 1.24 2.877
Z-Phe-Phe-OMe 2.426 7.11 0.03 1.44 3.529
Z-Ala-Phe-OMe 1.734 5.37 0.08 1.31 2.921
Z-Phe-Val-OMe 1.706 6.01 0.06 1.34 3.203
Z-Ala-Ser-OMe 1.263 3.63 0.45 1.34 2.372
Z-Ala-Trp-OMe 2.587 6.17 0.08 1.43 3.151
Table A10: CHI values of the ureido sugar derivatives used for the calculation of thedescriptors
Compound CHIIAM CHICD CHICN CHIIn CHIPro
-Gly-OEt -9.26 24.82 17.37 49.28 65.36
-Ala-OEt 2.21 35.18 24.11 52.88 67.36
-L-Val-OEt 11.15 42.88 33.49 60.98 72.94
-D-Val-OEt 23.38 27.23 21.96 53.83 67.93
-Leu-OEt 17.20 48.51 37.02 66.15 75.32
-Ile-OEt 17.43 48.78 37.14 66.04 75.30
-Phe-OMe 18.44 51.95 39.03 66.01 73.59
-Gly-Ala-OEt -8.45 22.60 33.65 48.55 64.80
-Ala-Gly-OEt -15.89 20.64 20.29 47.45 64.06
-Ala-Ala-OEt -6.64 24.35 25.00 50.37 65.86
-Gly-Val-OEt 10.67 34.99 33.15 55.76 69.31
-Val-Gly-OBzl 3.51 30.51 31.08 52.65 67.60
-Leu-Gly-OEt 9.76 36.27 33.30 56.77 69.86
-Gly-Phe-OBzl 16.65 44.54 37.25 57.28 70.40
-Phe-Gly-OEt 16.40 46.48 37.55 59.24 71.48
-Ala-Phe-OBzl 28.94 64.03 45.29 71.03 78.73
-Gly-Val-OBzl 16.69 44.50 36.73 57.17 70.39

E-23
Table A11: Descriptors of the ureido sugars- experimentally derived and calculated
experimentally determined descriptors predicted descriptors
Compound R2 p2H åa2
H åb2H Vx R2 p2
H åa2H åb2
H Vx
-Gly-OEt 0.871 5.56 0.00 1.72 3.167 0.935 6.11 0.20 1.53 3.150
-Ala-OEt 0.854 5.99 0.00 1.64 3.307 0.912 6.34 0.12 1.56 3.291
-L-Val-OEt 0.846 6.64 0.00 1.66 3.589 0.884 6.99 0.10 1.60 3.572
-D-Val-OEt 0.846 6.05 0.12 1.82 3.589 0.889 6.94 0.12 1.61 3.572
-Leu-OEt 0.859 6.78 0.00 1.65 3.730 0.889 7.16 0.13 1.65 3.713
-Ile-OEt 0.859 6.79 0.00 1.64 3.730 0.908 6.76 0.08 1.65 3.787
-Phe-OMe 1.624 7.23 0.00 1.67 3.774 1.611 7.74 0.03 1.70 3.758
-Gly-Ala-OEt 1.114 5.82 0.00 2.18 3.705 1.038 6.34 0.24 2.11 3.723
-Ala-Gly-OEt 1.114 6.73 0.00 2.06 3.705 1.038 6.34 0.24 2.11 3.723
-Ala-Ala-OEt 1.098 7.15 0.00 1.99 3.846 1.016 6.58 0.16 2.15 3.864
-Gly-Val-OEt 1.1 7.16 0.00 1.99 3.987 1.010 6.99 0.23 2.15 4.005
-Val-Gly-OBzl 1.886 8.68 0.00 2.28 4.453 1.691 8.42 0.15 2.25 4.472
-Leu-Gly-OEt 1.099 7.61 0.00 2.02 4.127 1.015 7.16 0.25 2.20 4.146
-Gly-Phe-OBzl 2.694 10.16 0.00 2.23 4.779 2.411 9.52 0.12 2.35 4.798
-Phe-Gly-OEt 1.906 8.69 0.00 1.98 4.313 1.730 8.09 0.20 2.25 4.331
-Ala-Phe-OBzl 2.688 10.96 0.00 1.96 4.920 2.388 9.76 0.04 2.39 4.939
-Gly-Val-OBzl 1.886 9.03 0.00 2.07 4.453 1.691 8.42 0.15 2.25 4.472

E-24
Table A10: Hydrogen bond acidity and basicity of proton bases and acids and the equilibriumconstant for the association in methylene chloride166, 269, 270. (First column indicates thegrouping of the compounds)
Acid Base a2H
b2H
a2H*b2
H logK
A p-Fluorophenol Tetrahydrothiophene 0.629 0.2644 0.1663 -0.15
A p-Fluorophenol Dioxane 0.629 0.475 0.2988 0.51
A p-Fluorophenol THF 0.629 0.51 0.3208 0.75
A HFP THF 0.771 0.51 0.3932 1.61
B p-Fluorophenol 4-Nitroanisol 0.629 0.345 0.2170 -0.39
B p-Fluorophenol Diethylcarbonate 0.629 0.45 0.2830 0.22
B p-Fluorophenol N.N dimethylthioacetamide 0.629 0.4922 0.3096 0.48
B p-Fluorophenol Anthrone 0.629 0.506 0.3183 0.37
B p-Fluorophenol Diphenylsulfone 0.629 0.512 0.3220 0.22
B p-Fluorophenol N.N-dimethylmethanesulfonamide 0.629 0.517 0.3252 0.32
B p-Fluorophenol Cyclohexanone 0.629 0.523 0.3290 0.59
B p-Fluorophenol Xanthone 0.629 0.531 0.3340 0.6
B p-Fluorophenol Triethylphosphine sulfide 0.629 0.552 0.3472 0.63
B p-Fluorophenol DMF 0.629 0.6628 0.4169 1.3
B p-Fluorophenol Formamide 0.629 0.6628 0.4169 0.97
B p-Fluorophenol DMF 0.629 0.663 0.4170 1.18
B p-Fluorophenol Diphenyl sulfoxid 0.629 0.666 0.4189 1.17
B p-Fluorophenol Benzamide 0.629 0.674 0.4239 1.02
B 1-Naphthol Tetramethylurea 0.608 0.743 0.4517 1.41
B p-Fluorophenol Acetamide 0.629 0.7297 0.4590 1.24
B p-Fluorophenol Trimethylphosphate 0.629 0.7616 0.4790 1.42
B p-Fluorophenol DMSO 0.629 0.774 0.4868 1.57
B p-Fluorophenol Dibutyl sulfoxid 0.629 0.7851 0.4938 1.73
B HFiP N-Methylacetamide 0.771 0.72 0.5551 2.62
B p-Fluorophenol Triphenylphosphineoxide 0.629 0.919 0.5780 2.07
B p-Fluorophenol Hexamethylphosphotriamide 0.629 1 0.629 2.53
B p-Fluorophenol Triphenylarsine oxide 0.629 1.027 0.6460 2.94
C TFPE Z-Phe-OMe 0.733 0 0.12
C TFPE Z-Val-OMe 0.733 0.5206 0.3816 0.09
C HFiP Acetone 0.771 0.497 0.3832 1.20
C HFiP Z-Val-OMe 0.771 0
C HFiP Ac-Ala-OMe 0.771 0.698 0.538 2.11
B HFiP N.N-Dimethylacetate 0.771 0.78 0.601 2.96
B p-Fluorophenol Trimethylphosphine oxide 0.629 0.9801 0.616 2.07
TFPE= 2-phenyl-1.1.1-trifluoroethanol

E-25
Table A13: Integral molar extinction coefficients of selected tripeptide derivatives dissolvedin methylene chloride [in l/mol*mm]
Substance eMol
at -10 °C at -5 °C at 15 °C at 25 °C
Z-Phe-Ala-Val-OMe 22.13 21.71 20.3 19.58
Z-Ala-Phe-Val-OMe
LLL 22.66 22.36 21.00 20.39
LDL 22.15 22.04 21.04 20.11
DLL 22.13 22.02 20.9 20.52
Z-Ala-Phe-Val-OtBu 22.21 21.92 20.48 20.08
Z-Ala-Leu-Val-OMe
LLL 23.61 23.29 22.26 21.41
LDL 23.23 23.38 21.77 21.09
Table A14: Normalised integral molar extinction coefficients of selected tripeptidederivatives dissolved in carbon tetrachloride used for the approximation of the intramolecularequilibrium constant K [in l/mol*mm]
Substance eNorm
at -10 °C at -5 °C at 15 °C at 25 °C at 40 °C
Z-Phe-Ala-Val-OMe 18.10 18.45 18.68 18.45 17.91
Z-Ala-Phe-Val-OMe
LLL 6.63 7.01 10.43 12.21 12.57
LDL 7.41 7.99 10.23 10.91 11.59
DLL 6.70 6.74 10.41 12.05 13.24
Z-Ala-Phe-Val-OtBu 7.22 7.70 10.43 12.21 12.57
Z-Ala-Leu-Val-OMe
LLL 5.86 6.17 9.74 11.37 12.86
LDL 6.97 7.63 9.43 10.03 10.60
a eNorm was received by dividing the integral absorbance by d*c. If no intramolecular association occurs like in Z-Phe-Ala-Val-OMe similiar values would be expected also for the other compounds. The loss of eNorm representsthe concentration of the associated NH functions.

E-26
Table A15: Differences in the peptide concentration Dc after diffusion measured on theintensity decrease of the NHC5 and CH2 signals [in 10-5 mol/l]
Carbon tetrachloride Toluene
Substance NHC5: Dc (after 15 h) CH2 as: Dc (after 15 h) NH: Dc (after 60 min.)
Z-Phe-Ala-Val-OMe 20.81 18.9 -
Z-Ala-Phe-Val-OMe
LLL 8.96 7.29 46.79
LDL 15.94 17.76 57.76
DLL 7.77 6.8 42.21
Z-Ala-Leu-Val-OMe
LLL 17.66 17.87 123.43
LDL 14.68 16.63 79.0
DLL 15.97 12.09 79.7
Table A16: Hydrogen bond basicity scales b2H and åb2
H received from different methods
Substance åb2H (HPLC) åb2
H
(peptide fragment)åb2
H (UCL) b2H(OH) b2
H(sum)
Ac-Ala-OMe 1.10 0.59 1.04 0.69 0.64
Ac-Phe-OMe 0.62 0.72 1.09 0.69 0.64
Ac-Val-OMe 0.91 0.62 1.06 0.69 0.64
Z-Ala-Ala-OMe 0.90 1.18 1.65 0.69 0.52
Z-Phe-Phe-OMe 1.16 1.44 1.75 0.68 0.53
Z-Val-Val-OMe 0.97 1.24 1.69 0.69 0.55
Z-Ala-Val-OMe 1.50 1.21 0.68 0.57
Z-Ala-Ala-Ala-OMe 1.28 1.77 2.26 0.78 0.60
Z-Phe-Phe-Phe-OMe 1.61 2.16 2.4 0.72 0.60
Z-Val-Val-Val-OMe 1.33 1.86 2.31 0.72 0.60
Z-Ala-Val-Val-OMe 1.87 1.83 0.75 0.60
with Phenol
Ac-Val-OMe 0.91 0.62 1.06 0.77 0.71
Z-Val-Val-OMe 0.97 1.24 1.69 0.72 0.50
Z-Val-Val-Val-OMe 1.33 1.86 2.31 0.74 0.69