e. coli bacteria tmdl for the sheyenne river in nelson and
TRANSCRIPT

E. coli Bacteria TMDL for the
Sheyenne River in Nelson and
Griggs Counties, North Dakota
Final: August 2012
Prepared for:
US EPA Region 8
1595 Wynkoop Street
Denver, CO 80202-1129
Prepared by:
Michael J. Hargiss
Environmental Scientist
North Dakota Department of Health
Division of Water Quality
Gold Seal Center, 4th Floor
918 East Divide Avenue
Bismarck, ND 58501-1947
North Dakota Department of Health
Division of Water Quality

E. coli Bacteria TMDL for the Sheyenne River
in Nelson and Griggs Counties, North Dakota
Jack Dalrymple, Governor
Terry Dwelle, M.D., State Health Officer
North Dakota Department of Health
Division of Water Quality
Gold Seal Center, 4th Floor
918 East Divide Avenue
Bismarck, ND 58501-1947
701.328.5210

Sheyenne River E. coli Bacteria TMDL Final: August 2012
Page ii of iii
1.0 INTRODUCTION AND DESCRIPTION OF THE WATERSHED 1
1.1 Clean Water Act Section 303 (d) Listing Information 2
1.2 Ecoregions 3
1.3 Land Use 4
1.4 Climate and Precipitation 5
1.5 Available Data 6
1.5.1 E. coli Bacteria Data 6
1.5.2 Hydraulic Discharge 7
2.0 WATER QUALITY STANDARDS 8
2.1 Narrative North Dakota Water Quality Standards 8
2.2 Numeric North Dakota Water Quality Standards 8
3.0 TMDL TARGETS 9
3.1 Sheyenne River Target Reductions in E. coli Bacteria Concentrations 9
4.0 SIGNIFICANT SOURCES 9
4.1 Point Source Pollution Sources 9
4.2 Nonpoint Source Pollution Sources 10
5.0 TECHNICAL ANALYSIS 10
5.1 Mean Daily Stream Flow 11
5.2 Flow Duration Curve Analysis 11
5.3 Load Duration Analysis 12
5.4 Loading Sources 14
6.0 MARGIN OF SAFETY AND SEASONALITY 16
6.1 Margin of Safety 16
6.2 Seasonality 16
7.0 TMDL 16
8.0 ALLOCATION 17
8.1 Livestock Management Recommendations 18
8.2 Other Recommendations 19
9.0 PUBLIC PARTICIPATION 20
10.0 MONITORING 21
11.0 TMDL IMPLEMENTATION STRATEGY 21
12.0 REFERENCES 22

Sheyenne River E. coli Bacteria TMDL Final: August 2012
Page iii of iii
List of Figures
1. Middle Sheyenne River Sub-basin and Sheyenne River Watershed in North Dakota 1
2. Sheyenne River TMDL Listed Segment 3
3. Level IV Ecoregions in the Sheyenne River Watershed 4
4. Land Use in the Sheyenne River Watershed 5
5. Monthly Precipitation for the NDAWN Weather Station Located Near McHenry, ND 6
6. E. coli Bacteria Sample Site 380009 and USGS Gage Station 05057000 Located on the
Sheyenne River Near Cooperstown, ND 7
7. Mean Annual Discharge for USGS Gaging Station 05057000 Located on the
Sheyenne River Near Cooperstown, ND 11
8. Flow Duration Curve for Monitoring Station 380009 Located on the Sheyenne River
Near Cooperstown, ND 13
9. E. coli Bacteria Load Duration Curve for Monitoring Station 380009 Located on the
Sheyenne River Near Cooperstown, ND 14
List of Tables
1. General Characteristics of the Sheyenne River Watershed 1
2. Sheyenne River Section 303(d) Listing Information for Assessment Unit ID
ND-090200203-001-S_00 2
3. Summary of E. coli Bacteria Data for Site 380009 7
4. North Dakota E. coli Bacteria Water Quality Standards for Class IA Streams 9
5. Nonpoint Sources of Pollution and Their Potential to Pollute at a Given Flow Regime 15
6. TMDL Summary for the Sheyenne River 17
7. E. coli Bacteria TMDL (107 CFU/day) for the Sheyenne River Assessment Unit ID
ND-09020203-001-S_00 as Represented by Site 380009 17
8. Management Practices and Flow Regimes Affected by Implementation of BMPs 18
9. Bacterial Water Quality Response to Four Grazing Strategies 19
10. Relative Gross Effectiveness of Confined Livestock Control Measures 20
Appendices
A. E. coli Bacteria Data Collected for Site 380009 (2001-2010)
B. Flow Duration Curve for Site 380009
C. Load Duration Curve, Estimated Load, TMDL Target, and Percent Load Reduction
Required for Site 380009
D. US EPA Region 8 TMDL Review and Comments
E. NDDoH Response to Comments

Sheyenne River E. coli Bacteria TMDL Final: August 2012
Page 1 of 22
1.0 INTRODUCTION AND DESCRIPTION OF THE WATERSHED
The Middle Sheyenne River sub-basin (09020203) collectively covers approximately 2,005
square miles (1,283,384 acres) and is located within seven counties (Barnes, Benson, Eddy,
Foster, Griggs, Nelson, Steele, and Stutsman Counties) (Table 1 and Figure 1). For the purposes
of this TMDL, the impaired stream segment is located in Griggs, Nelson, and Steele counties that
comprise a watershed area of approximately 412,887 acres. The Sheyenne River impaired
stream segment lies within the level III Northern Glaciated Plains (46) ecoregion.
Table 1. General Characteristics of the Sheyenne River Watershed.
Legal Name Sheyenne River
Stream Classification Class IA
Major Drainage Basin Red River of the North
8-Digit Hydrologic Unit 09020203
Counties Nelson and Griggs Counties
Level III Ecoregion Northern Glaciated Plains (46)
Watershed Area (acres) 412,887
Figure 1. Middle Sheyenne River Sub-basin and Sheyenne River Watershed in North
Dakota.

Sheyenne River E. coli Bacteria TMDL Final: August 2012
Page 2 of 22
1.1 Clean Water Act Section 303(d) Listing Information
Based on the 2012 Section 303 (d) List of Impaired Waters Needing TMDLs (NDDoH,
2012), the North Dakota Department of Health has identified a 93.81 mile segment of the
Sheyenne River from the Tolna Dam outlet (ND-09020203-020-S) downstream to Lake
Ashtabula as not supporting recreational uses due to Escherichia coli bacteria (E. coli) (Table
2 and Figure 2).
Table 2. Sheyenne River Section 303(d) Listing Information for Assessment Unit ID
ND-090200203-001-S_00 (NDDoH, 2012).
Assessment Unit ID ND-09020203-001-S_00
Waterbody
Description
Sheyenne River from Tolna Dam outlet (ND-09020203-020-
S) downstream to Lake Ashtabula.
Size 93.81 miles
Designated Use Recreation
Use Support Not Supporting
Impairment E. coli Bacteria
TMDL Priority High
Sheyenne River E. coli Bacteria TMDL Final: August 2012
Page 3 of 22
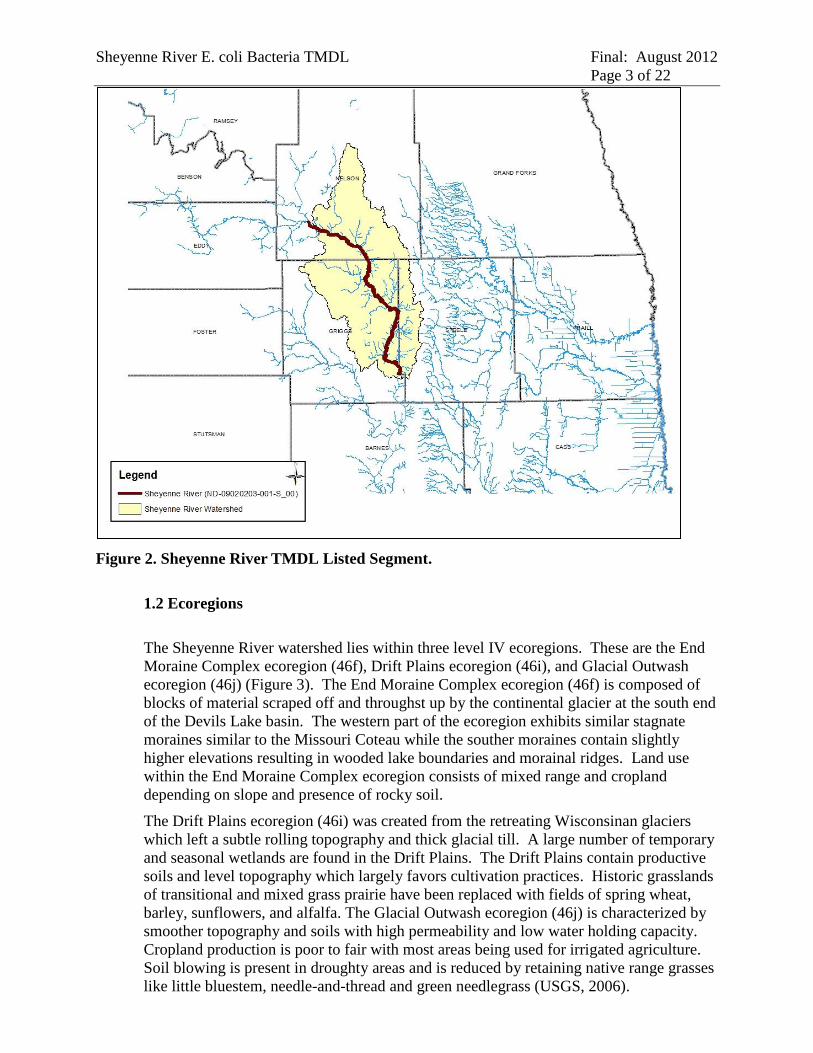
Figure 2. Sheyenne River TMDL Listed Segment.
1.2 Ecoregions
The Sheyenne River watershed lies within three level IV ecoregions. These are the End
Moraine Complex ecoregion (46f), Drift Plains ecoregion (46i), and Glacial Outwash
ecoregion (46j) (Figure 3). The End Moraine Complex ecoregion (46f) is composed of
blocks of material scraped off and throughst up by the continental glacier at the south end
of the Devils Lake basin. The western part of the ecoregion exhibits similar stagnate
moraines similar to the Missouri Coteau while the souther moraines contain slightly
higher elevations resulting in wooded lake boundaries and morainal ridges. Land use
within the End Moraine Complex ecoregion consists of mixed range and cropland
depending on slope and presence of rocky soil.
The Drift Plains ecoregion (46i) was created from the retreating Wisconsinan glaciers
which left a subtle rolling topography and thick glacial till. A large number of temporary
and seasonal wetlands are found in the Drift Plains. The Drift Plains contain productive
soils and level topography which largely favors cultivation practices. Historic grasslands
of transitional and mixed grass prairie have been replaced with fields of spring wheat,
barley, sunflowers, and alfalfa. The Glacial Outwash ecoregion (46j) is characterized by
smoother topography and soils with high permeability and low water holding capacity.
Cropland production is poor to fair with most areas being used for irrigated agriculture.
Soil blowing is present in droughty areas and is reduced by retaining native range grasses
like little bluestem, needle-and-thread and green needlegrass (USGS, 2006).

Sheyenne River E. coli Bacteria TMDL Final: August 2012
Page 4 of 22
Figure 3. Level IV Ecoregions in the Sheyenne River Watershed.
1.3 Land Use
The Sheyenne River watershed encompasses 412,887 acres in Griggs, Nelson, and Steele
Counties, North Dakota. According to National Agricultural Statistics Service (NASS)
2007 land cover data, the dominant land use in the watershed is agriculture with 55
percent used for cropland, 33 percent grassland/pasture, and the remaining 12 percent a
combination of water, wetlands, or developed/open space (Figure 4). The dominant
crops grown in the watershed are spring wheat, soybeans, corn, and sunflowers.

Sheyenne River E. coli Bacteria TMDL Final: August 2012
Page 5 of 22
Figure 4. Land Use in the Sheyenne River Watershed (NASS, 2006).
1.4 Climate and Precipitation
Precipitation data for the Sheyenne River was obtained from the North Dakota
Agricultural Weather Network (NDAWN) station located near McHenry, ND on the west
side of the watershed. Figure 5 shows monthly precipitation data averaged for the years
of 1996 to 2008 compared to the precipitation totals for each month during 2009 and
2010. Snowfall data had not been converted into precipitation for the months of January
through March and November through December for the years 1996 to 2010, so those
months do not appear in Figure 5.

Sheyenne River E. coli Bacteria TMDL Final: August 2012
Page 6 of 22
Figure 5. Monthly Precipitation for the NDAWN Weather Station Located Near
McHenry, ND.
1.5 Available Data
1.5.1 E. coli Bacteria Data
E. coli bacteria samples were collected at one location within the TMDL listed stream
reach (ND-09020203-001-S_00) (Figure 6). The monitoring site, 380009, is located on
the Sheyenne River 4.5 miles east of Cooperstown, ND. Site 380009 was monitored
weekly or when flow conditions were present during the recreation season (May-
September) in 2009 and 2010. The monitoring station was sampled by the North Dakota
State Water Commission and Garrison Diversion Conservancy District as part of the
Upper Sheyenne River Water Quality and Watershed Assessment Project.
Monitoring site 380009 has also been an ambient monitoring site for the North Dakota
Department of Health (NDDoH) for a number of years. E. coli bacteria samples for
monitoring site 380009 were also collected by the NDDoH every six weeks during the
recreational season of 2001-2010.
Table 3 provides a summary of E. coli geometric mean concentrations, the percentage of
samples exceeding 409 CFU/100mL for each month and the recreational use assessment
by month. The geometric mean E. coli bacteria concentration and the percent of samples
over 409 CFU/100ml was calculated for each month (May-September) using those
samples collected during each month from 2001-2010.

Sheyenne River E. coli Bacteria TMDL Final: August 2012
Page 7 of 22
Table 3. Summary of E. coli Bacteria Data for Site 380009 (Data Collected in 2001-2010).
380009
Recreational Season May June July August September
Number of Samples 10 10 16 18 13
Geometric Mean 24 31 55 60 143
% Exceeded 409 CFU/100 mL 0% 0% 0% 0% 23%
Recreational Use Assessment FS FS FS FS NS
FS – Fully Supporting; FSbT- Fully Supporting but Threatened; NS – Not Supporting; INSFD – Insufficient Data
Analysis of E. coli bacteria data collected at site 380009 from 2001-2010, demonstrated
that the months of May, June, July, and August were fully supporting the recreation use
(Table 3). Based on the geometric mean and percent exceeded calculations for the month
of September, recreation use was not supporting (Table 3). Data used for this analysis is
provided in Appendix A.
1.5.2 Hydraulic Discharge
Daily stream discharge values were collected at one stream location within the Sheyenne
River watershed. This location was at the United States Geological Survey (USGS)
gaging station located on Sheyenne River near Cooperstown, ND (05057000) (Figure 6).
The USGS station has operated continuously since 1944 and is collocated with the
NDDoH monitoring location 380009.
Figure 6. E. coli Bacteria Sample Site 380009 and USGS Gage Station 05057000
Located on the Sheyenne River Near Cooperstown, ND.

Sheyenne River E. coli Bacteria TMDL Final: August 2012
Page 8 of 22
2.0 WATER QUALITY STANDARDS
The Clean Water Act requires that Total Maximum Daily Loads (TMDLs) be developed for
waters on a state's Section 303(d) list. A TMDL is defined as “the sum of the individual
wasteload allocations for point sources and load allocations for non point sources and natural
background” such that the capacity of the waterbody to assimilate pollutant loadings is not
exceeded. The purpose of a TMDL is to identify the pollutant load reductions or other actions
that should be taken so that impaired waters will be able to attain water quality standards.
TMDLs are required to be developed with seasonal variations and must include a margin of
safety that addresses the uncertainty in the analysis. Separate TMDLs are required to address
each pollutant or cause of impairment, which in this case is E. coli bacteria.
2.1 Narrative North Dakota Water Quality Standards
The North Dakota Department of Health has set narrative water quality standards that
apply to all surface waters in the State. The narrative general water quality standards are
listed below (NDDoH, 2011).
All waters of the State shall be free from substances attributable to municipal,
industrial, or other discharges or agricultural practices in concentrations or
combinations that are toxic or harmful to humans, animals, plants, or resident
aquatic biota.
No discharge of pollutants, which alone or in combination with other substances
shall:
a. Cause a public health hazard or injury to environmental resources;
b. Impair existing or reasonable beneficial uses of the receiving water; or
c. Directly or indirectly cause concentrations of pollutants to exceed
applicable standards of the receiving waters.
In addition to the narrative standards, the NDDoH has set biological goal for all surface
waters in the state. The goal states “the biological condition of surface waters shall be
similar to that of sites or waterbodies determined by the department to be regional
reference sites” (NDDoH, 2011).
2.2 Numeric North Dakota Water Quality Standards
The Sheyenne River is a Class IA stream. The NDDoH definition of a Class IA stream is
shown below (NDDoH, 2011).
Class IA- The quality of the waters in this class shall be the same as the quality of class I
streams, except that where natural conditions exceed Class I criteria for municipal and
domestic use, the availability of softening or other treatment methods may be considered
in determining whether ambient water quality meets the drinking water requirements of
the department.
Table 4 provides a summary of the numeric E. coli bacteria criteria which applies to
Class IA streams. The E. coli bacteria standard applies only during the recreation season
from May 1 to September 30.

Sheyenne River E. coli Bacteria TMDL Final: August 2012
Page 9 of 22
Table 4. North Dakota E. coli Bacteria Water Quality Standards
for Class IA Streams.
Parameter Standard
Geometric Mean1
Maximum2
E. coli Bacteria 126 CFU/100 mL 409 CFU/100 mL 1 Expressed as a geometric mean of representative samples collected during any consecutive 30-day period.
2 No more than 10 percent of samples collected during any consecutive 30-day period shall individually exceed the standard.
3.0 TMDL TARGETS
A TMDL target is the value that is measured to judge the success of the TMDL effort. TMDL
targets must be based on state water quality standards, but can also include site specific values
when no numeric criteria are specified in the standard. The following TMDL target for the
Sheyenne River is based on the NDDoH water quality standard for E. coli bacteria.
3.1 Sheyenne River Target Reductions in E. coli Bacteria Concentrations
The Sheyenne River is impaired because of E. coli bacteria. The Sheyenne River is
classified as not supporting recreational beneficial uses because of E. coli bacteria counts
exceeding the North Dakota water quality standard. The North Dakota water quality
standard for E. coli bacteria is a geometric mean concentration of 126 CFU/100 mL
during the recreation season from May 1 to September 30. Thus, the TMDL target for
this report is 126 CFU/100 mL. In addition, no more than ten percent of samples
collected for E. coli bacteria should exceed 409 CFU/100 mL.
While the standard is intended to be expressed as a 30-day geometric mean, for purposes
of these TMDLs, the target is based on an E. coli concentration of 126 CFU/100 mL
expressed as a daily average based on individual grab samples. Expressing the target in
this way will ensure the TMDL will result in both components of the standard being met
and recreational uses are restored.
4.0 SIGNIFICANT SOURCES
4.1 Point Source Pollution Sources
There are no known point sources that discharge directly to the TMDL listed segment of
the Sheyenne River. There are, however, three municipalities, Cooperstown, Aneta and
McVille, which are located in the contributing watershed of the TMDL listed reach.
Each of these municipalities has wastewater stabilization ponds that have the capability
of discharging. The city of Cooperstown discharges to an unnamed tributary to the
Sheyenne River at a location which is approximately 7 miles upstream from its
confluence with the Sheyenne River. The city of Cooperstown has discharged 14 times
during the last 10 years (2002-2011) with each discharge lasting an average of 6 days
(range 3-8 days) and each discharge totaling an average of 25.7 million gallons. The city
of Aneta discharges to Pickerel Lake Creek at a location which is approximately 17 miles
from its confluence with the Sheyenne River. In the last 10 years, the city of Aneta has
only discharged only 5 times, once each in 2002, 2004, 2005, 2008 and 2010. Each
discharge was for an average of 6.8 days and 7.6 million gallons. The city of McVille’s
waste water stabilization pond has the capability to discharge to McVille Coulee at a
location approximately 4.15 miles upstream from its confluence with the Sheyenne River.
In the last 10 years there have been no discharges from McVille’s wastewater treatment

Sheyenne River E. coli Bacteria TMDL Final: August 2012
Page 10 of 22
facility. There are currently no effluent limits for bacteria in the NDPDES permits for
these facilities.
There are seven known animal feeding operations (AFOs) in the contributing watershed
of the Sheyenne River. The seven AFOs in the Sheyenne River watershed include four
small (0-300 animal units (AUs)) AFOs and three medium (301-999 AUs) AFOs which
have a permit to operate. All seven AFOs are zero discharge facilities and are not deemed
a significant point source of E. coli bacteria loadings to the Sheyenne River.
4.2 Nonpoint Source Pollution Sources
The TMDL listed segment of the Sheyenne River is experiencing E. coli bacteria
pollution from nonpoint sources in the watersheds. Livestock production is not the
dominant agricultural practice in the watershed but livestock grazing and watering in
proximity to the Sheyenne River is common along the TMDL listed segment.
The northeast section of North Dakota typically experiences long duration or intense
precipitation during the early summer months. These storms can cause overland flooding
and rising river levels. Due to the close proximity of livestock grazing and watering to
the river, it is likely that this contributes E. coli bacteria to the Sheyenne River.
These assessments are supported by the load duration curve analysis (Section 5.3) which
shows exceedences of the E. coli bacteria standard occurring during high and moist
condition flow regimes.
Wildlife may also contribute to the E. coli bacteria found in the water quality samples,
but most likely in a lower concentration. Wildlife are nomadic with fewer numbers
concentrating in a specific area, thus decreasing the probability of their contribution of
fecal matter in significant quantities.
Septic system failure might also contribute to the E. coli bacteria in the water quality
samples. Failures can occur for several reasons, although the most common reason is
improper maintenance (e.g. age, inadequate pumping). Other reasons for failure include
improper installation, location, and choice of the system. Harmful household chemicals
can also cause failure by killing the bacteria that digest the waste. While the number of
systems that are not functioning properly is unknown, it is estimated that 28 percent of
the systems in North Dakota are failing (EPA, 2002).
5.0 TECHNICAL ANALYSIS
In TMDL development, the goal is to define the linkage between the water quality target and the
identified source or sources of the pollutant (i.e., E. coli bacteria) to determine the load reduction
needed to meet the TMDL target. To determine the cause and effect relationship between the
water quality target and the identified source, the “load duration curve” methodology was used.
The loading capacity or TMDL is the amount of a pollutant (e.g., E. coli bacteria) a waterbody
can receive and still meet and maintain water quality standards and beneficial uses. The
following technical analysis addresses the E. coli bacteria reductions necessary to achieve the
water quality standards target for E. coli bacteria of 126 CFU/100 mL with an explicit margin of
safety of 10 percent.

Sheyenne River E. coli Bacteria TMDL Final: August 2012
Page 11 of 22
5.1 Mean Daily Stream Flow
Daily stream discharge values were collected at one stream location within the Sheyenne
River watershed. This location was at the USGS gage station located near Cooperstown,
N.D (05057000). The USGS station has operated continuously since1944 and is
collocated with the NDDoH monitoring location 380009. For the purposes of this
assessment report, the last twenty years (1990-2010) of historical discharge records will
be used to describe the hydrology of the Sheyenne River watershed. This block of time
should account for wet and dry cycles through the hydrological history of USGS gage
station 05057000. From 1990 to 1992, the annual mean discharge of the Sheyenne River
near Cooperstown, ND was very low most likely due to drought conditions in the late
1980’s. Then in 1993-2001 the mean annual discharge fluctuated from average to above
average flows most likely due to a wet cycle, then dropped significantly from 2002
through 2008 (Figure 7). In 2009 and 2010, the discharge was 2.8 to 3.2 times higher
than the average annual discharge of 1990-2010 which was calculated at 184 cfs. This
can be attributed to record snowfalls and above average spring rains that were present all
across North Dakota.
Figure 7. Mean Annual Discharge at the USGS Gaging Station 05057000 Located on the
Sheyenne River Near Cooperstown, ND.
In northeastern North Dakota, rain events are variable generally occurring during the
months of April through August. Rain events can be sporadic and heavy or light,
occurring over a short duration. Precipitation events of large magnitude, occurring at a
faster rate than absorption, contribute to high runoff events. These events are represented
by runoff in the high flow regime. The medium flow regime is represented by runoff that
contributes to the stream over a longer duration. The low flow regime is characteristic of
drought or precipitation events of small magnitude and do not contribute to runoff.
5.2 Flow Duration Curve Analysis
The flow duration curve serves as the foundation for the load duration curve used in the
TMDL. Flow duration curve analysis looks at the cumulative frequency of historic flow
data over a specified time period. A flow duration curve relates flow (expressed as mean
Average Annual
Discharge=184 cfs
Sheyenne River E. coli Bacteria TMDL Final: August 2012
Page 12 of 22
daily discharge) to the percent of time those mean daily flow values have been met or
exceeded. The use of “percent of time exceeded” (i.e., duration) provides a uniform
scale ranging from 0 to 100 percent, thus accounting for the full range of stream flows for
the period of record. Low flows are exceeded most of the time, while flood flows are
exceeded infrequently (EPA, 2007).
A basic flow duration curve runs from high to low (0 to 100 percent) along the x-axis
with the corresponding flow value on the y-axis (Figure 8). Using this approach, flow
duration intervals are expressed as a percentage, with zero corresponding to the highest
flows in the record (i.e., flood conditions) and 100 to the lowest flows in the record (i.e.,
drought). Therefore, as depicted in Figure 8, a flow duration interval of 25 percent,
associated with a stream flow of 222 cfs, implies that 25 percent of all observed mean
daily discharge values equal or exceed 222 cfs.
Once the flow duration curve is developed for the stream site, flow duration intervals can
be defined which can be used as a general indicator of hydrologic condition (i.e. wet vs
dry conditions and to what degree). These intervals (or zones) provide additional insight
about conditions and patterns associated with the impairment (E. coli bacteria in this
case) (EPA, 2007). As depicted in Figure 8, the flow duration curve for site 380009,
representing TMDL segment ND-09020203-001-S, was divided into four zones, one
representing high flows (0-20 percent), another for moist conditions (20-50 percent), one
for dry conditions (50-93 percent) and one for low flows (93-99 percent). Based on the
flow duration curve analysis, no flow occurred 1 percent of the time (99 to100 percent).
These flows intervals were defined by examining the range of flows for the site for the
period of record and then by looking for natural breaks in the flow record based on the
flow duration curve plot (Figure 8). A secondary factor in determining the flow intervals
used in the analysis is the number of E. coli bacteria observations available for each flow
interval.
5.3 Load Duration Analysis
An important factor in determining NPS pollution loads is variability in stream flows and
loads associated with high and low flow. To better correlate the relationship between the
pollutant of concern and the hydrology of the Section 303(d) TMDL listed segment, a
load duration curve was developed for the Sheyenne River. The load duration curve for
the impaired reach was derived using the E. coli bacteria TMDL target of 126 CFU/100
mL and the flows generated as described in Sections 5.1 and 5.2.
Observed in-stream E. coli bacteria data obtained from monitoring site 380009 from
2001-2010 (Appendix A) were converted to a pollutant load by multiplying E. coli
bacteria concentrations by the mean daily flow and a conversion factor. These loads are
plotted against the percent exceeded of the flow on the day of sample collection (Figure
9). Points plotted above the 126 CFU/100 mL target curve exceed the State water quality
target. Points plotted below the curve are meeting the State water quality target of 126
CFU/100 mL.

Sheyenne River E. coli Bacteria TMDL Final: August 2012
Page 13 of 22
Figure 8. Flow Duration Curve for Monitoring Station 380009 Located on the
Sheyenne River Near Cooperstown, ND.
For each flow interval or zone, a regression relationship was developed between the
samples which occur above the TMDL target (126 CFU/100 mL) curve and the
corresponding percent exceeded flow. The load duration curve for site 380009 depicting
a regression relationship for each flow interval is provided in Figure 9.
The regression lines for the high and moist condition flow regimes for site 380009 were
then used with the midpoint of the percent exceeded flow for that interval to calculate the
existing E. coli bacteria load for that flow interval. For example, in the example provided
in Figure 9, the regression relationship between observed E. coli bacteria loading and
percent exceeded flow for the moist and dry condition flow intervals are:
E. coli bacteria load (expressed as 107 CFUs/day) = antilog (Intercept + (Slope*Percent
Exceeded Flow))
Where the midpoint of the high interval from 0 to 20 percent is 10 percent, the existing E.
coli bacteria load is:
E. coli bacteria load (107 CFUs/day) = antilog (6.00 + (-4.31*0.10))
= 369,185 x 107 CFUs/day

Sheyenne River E. coli Bacteria TMDL Final: August 2012
Page 14 of 22
Where the midpoint of the moist condition interval from 20 to 50 percent is 35 percent,
the existing E. coli bacteria load is:
E. coli bacteria load (107 CFUs/day) = antilog (5.66 + (-1.88*0.35))
= 100,372 x 107 CFUs/day
The midpoint for the flow intervals is also used to estimate the TMDL target load. In the
case of the previous examples, the TMDL target load for the midpoints of 10 and 35
percent exceeded flow derived from the 126 CFU/100 mL TMDL target curves are
161,708 x 107 CFUs/day, and 44,397 x 10
7 CFUs/day, respectively.
Figure 9. E. coli Bacteria Load Duration Curve for Monitoring Station 380009
Located on the Sheyenne River near Cooperstown, ND (The curve reflects flows from
1990-2010).
5.4 Loading Sources
The load reductions needed for the Sheyenne River E. coli bacteria TMDL can generally
be allotted to nonpoint sources, rather than from point sources. As described in Section
4.1, Point Source Pollution Sources, there are no point sources which discharge directly
to the TMDL listed segment of the Sheyenne River and only three potential point sources
in the TMDL listed segment’s contributing watershed. Of these three, only the cities of
Aneta and Cooperstown have discharged in the last 10 years. Further, the city of
Cooperstown discharges to an unnamed tributary at a point 7 miles upstream from the
Sheyenne River and Aneta discharges to Pickerel Lake Creek at a point 17 miles
upstream from the Sheyenne River. The other potential discharger, the city of McVille,

Sheyenne River E. coli Bacteria TMDL Final: August 2012
Page 15 of 22
has not discharged in at least 10 years. Due to the limited nature of these discharges and,
more importantly, their distance to the Sheyenne River, they are not believed to be a
significant contributor of E. coli bacteria to the Sheyenne River. For these reasons, no
waste load allocation will be provided in the TMDL.
Based on the data available, the general focus of best management practices (BMPs) and
load reductions for the listed waterbody should be on riparian grazing adjacent to or in
close proximity to the Sheyenne River.
Significant sources of E. coli bacteria loading were defined as nonpoint source pollution
originating from livestock. One of the more important concerns regarding nonpoint
sources is variability in stream flows. Variable stream flows often cause different source
areas and loading mechanisms to dominate (Cleland, 2003). As previously described,
two flow regimes (i.e., high and moist conditions) were selected to represent the
hydrology of the listed segment on the Sheyenne River (Figure 9). The two flow regimes
were used for site 380009 because samples indicated exceedences of the water quality
standard during periods of high to moderate flows.
By relating runoff characteristics to each flow regime one can infer which sources are
most likely to contribute to E. coli bacteria loading. Animals grazing in the riparian area
contribute E. coli bacteria by depositing manure where it has an immediate impact on
water quality. Due to the close proximity of manure to the stream or by direct deposition
in the stream, riparian grazing impacts water quality at high flow or under moist and dry
conditions (Table 5). In contrast, intensive grazing of livestock in the upland and not in
the riparian area has a high potential to impact water quality at high flows and under
moist conditions impact at moderate flows (Table5). Exclusion of livestock from the
riparian area eliminates the potential of direct manure deposit and therefore is considered
to be of high importance at all flows. However, intensive grazing in the upland creates
the potential for manure accumulation and availability for runoff at high flows and a high
potential for E. coli bacteria contamination.
Table 5. Nonpoint Sources of Pollution and Their Potential to Pollute at a Given
Flow Regime.
Nonpoint Sources
Flow Regime
High Flow Moist
Conditions
Dry
Conditions
Riparian Area Grazing (Livestock) H H H
Animal Feeding Operations H M L
Manure Application to Crop and
Range Land
H M L
Intensive Upland Grazing (Livestock) H M L
Note: Potential importance of nonpoint source area to contribute E. coli bacteria loads under a given flow regime. (H: High; M: Medium; L: Low)

Sheyenne River E. coli Bacteria TMDL Final: August 2012
Page 16 of 22
6.0 MARGIN OF SAFETY AND SEASONALITY
6.1 Margin of Safety
Section 303(d) of the Clean Water Act and the U.S. Environmental Protection Agency
(EPA) regulations require that “TMDLs shall be established at levels necessary to attain
and maintain the applicable narrative and numerical water quality standards with seasonal
variations and a margin of safety which takes into account any lack of knowledge
concerning the relationship between effluent limitations and water quality.” The margin
of safety (MOS) can be either incorporated into conservative assumptions used to
develop the TMDL (implicit) or added to a separate component of the TMDL (explicit).
To account for the uncertainty associated with known sources and the load reductions
necessary to reach the TMDL target of 126 CFU/100 mL, a ten percent explicit margin of
safety was used for this TMDL. The MOS was calculated as ten percent of the TMDL.
In other words, ten percent of the TMDL is set aside from the load allocation as a MOS.
6.2 Seasonality
Section 303(d)(1)(C) of the Clean Water Act and associated regulations require that a
TMDL be established with seasonal variations. The Sheyenne River TMDL addresses
seasonality because the flow duration curve was developed using 20 years of USGS gage
data encompassing all 12 months of the year. Additionally, the water quality standard is
seasonally based on the recreation season from May 1 to September 30 and controls will
be designed to reduce E. coli bacteria loads during the seasons covered by the standard.
7.0 TMDL
Table 6 provides an outline of the critical elements of the bacteria TMDL for the TMDL listed
segment. A TMDL for the Sheyenne River (ND-090200203-001-S_00) is summarized in Table
7. The TMDL provides a summary of average daily loads by flow regime necessary to meet the
water quality target (i.e. TMDL). The TMDL for the segment and flow regime provide an
estimate of the existing daily load, an estimate of the average daily loads necessary to meet the
water quality target (i.e. TMDL load). The TMDL load includes a load allocation from known
nonpoint sources and a 10 percent margin of safety.
It should be noted that the TMDL loads, load allocations, and the MOS are estimated based on
available data and reasonable assumptions and are to be used as a guide for implementation. The
actual reduction needed to meet the applicable water quality standards may be higher or lower
depending on the results of future monitoring.
TMDL = LC = WLA + LA + MOS
where
LC = loading capacity, or the greatest loading a waterbody can receive without
violating water quality standards;
WLA = wasteload allocation, or the portion of the TMDL allocated to existing or future
point sources;

Sheyenne River E. coli Bacteria TMDL Final: August 2012
Page 17 of 22
LA = load allocation, or the portion of the TMDL allocated to existing or future non-
point sources;
MOS = margin of safety, or an accounting of the uncertainty about the relationship
between pollutant loads and receiving water quality. The margin of safety can be
provided implicitly through analytical assumptions or explicitly by reserving a
portion of the loading capacity.
Table 6. TMDL Summary for the Sheyenne River.
Category Description Explanation
Beneficial Use Impaired Recreation Contact Recreation (i.e. swimming,
fishing)
Pollutants E. coli Bacteria See Section 2.1
E. coli TMDL Target 126 CFU/100 mL Based on the current state water
quality standard for E. coli bacteria.
Significant Sources Nonpoint Sources No contributing Point Sources in
Subwatershed
Margin of Safety (MOS) Explicit 10%
Table 7. E. coli Bacteria TMDL (107 CFU/day) for the Sheyenne River Assessment Unit ID
ND-09020203-001-S_00 as Represented by Site 380009.
Flow Regime
High Flow Moist
Conditions
Dry
Conditions Low Flow
Existing Load 369,185 100,372
TMDL 161,708 44,397 10,7911
2,6211
WLA 0 0 No Reduction
Necessary
No Reduction
Necessary LA 145,537 39,957
MOS 16,170.8 4,439.7 1TMDL load is provided as a guideline for watershed management and BMP implementation.
8.0 ALLOCATION
Since there are no known point source discharges to the TMDL listed Sheyenne River segment,
the entire E. coli bacteria load for this TMDL was allocated to nonpoint sources in the
watersheds. The entire nonpoint source load is allocated as a single load because there is not
enough detailed source data to allocate the load to individual uses (e.g., animal feeding, septic
systems, riparian grazing, waste management).
To achieve the TMDL targets identified in the report, it will require the wide spread support and
voluntary participation of landowners and residents in the watershed. The TMDLs described in
this report are a plan to improve water quality by implementing best management practices
through non-regulatory approaches. BMPs are methods, measures, or practices that are
determined to be a reasonable and cost effective means for a land owner to meet nonpoint source
pollution control needs,” (EPA, 2001). This TMDL plan is put forth as a recommendation for
what needs to be accomplished for the Sheyenne River and associated watershed to restore and
maintain its recreational uses. Water quality monitoring should continue in order to measure
BMP effectiveness and determine through adaptive management if loading allocation
recommendations need to be adjusted.

Sheyenne River E. coli Bacteria TMDL Final: August 2012
Page 18 of 22
Nonpoint source pollution is the sole contributor to elevated E. coli bacteria levels in the
Sheyenne River watershed. The E. coli bacteria samples and load duration curve analysis of the
impaired reach identified the high and moist condition flow regimes for ND-09020203-001-S as
the time of E. coli bacteria exceedences for the 126 CFU/100 mL target. To reduce NPS
pollution for the high and moderate flow regimes, specific BMPs are described in Section 8.1
and Table 8 that will mitigate the effects of E. coli bacteria loading to the impaired reaches.
Controlling nonpoint sources is an immense undertaking requiring extensive financial and
technical support. Provided that technical/financial assistance is available to stakeholders, these
BMPs have the potential to significantly reduce E.coli bacteria loading to Sheyenne River. The
following sections describe in detail those BMPs that will reduce E. coli bacteria levels in
Sheyenne River.
Table 8. Management Practices and Flow Regimes Affected by Implementation of
BMPs.
Management Practice
Flow Regime and Expected Reduction
High Flow-
70%
Moderate
Flow-80%
Low Flow-
74%
Livestock Exclusion From Riparian Area X X X
Water Well and Tank Development X X X
Prescribed Grazing X X X
Waste Management System X X
Vegetative Filter Strip X
Septic System Repair X X
8.1 Livestock Management Recommendations
Livestock management BMPs are designed to promote healthy water quality and riparian
areas through management of livestock and associated grazing land. Fecal matter from
livestock, erosion from poorly managed grazing, land and riparian areas can be a
significant source of E. coli bacteria loading to surface water. Precipitation, plant cover,
number of animals, and soils are factors that affect the amount of bacteria delivered to a
waterbody because of livestock. These specific BMPs are known to reduce nonpoint
source pollution from livestock. These BMPs include:
Livestock exclusion from riparian areas- This practice is established to remove livestock
from grazing riparian areas and watering in the stream. Livestock exclusion is
accomplished through fencing. A reduction in stream bank erosion can be expected by
minimizing or eliminating hoof trampling. A stable stream bank will support vegetation
that will hold banks in place and serve a secondary function as a filter from nonpoint
source runoff. Added vegetation will create aquatic habitat and shading for
macroinvertebrates and fish. Direct deposit of fecal matter into the stream and stream
banks will be eliminated as a result of livestock exclusion by fencing.
Water well and tank development- Fencing animals from stream access requires and
alternative water source. Installing water wells and tanks satisfies this need. Installing
water tanks provides a quality water source and keeps animals from wading and
defecating in streams. This will reduce the probability of pathogenic infections to
livestock and the public.

Sheyenne River E. coli Bacteria TMDL Final: August 2012
Page 19 of 22
Prescribed grazing- This practice is used to increase ground cover and ground stability by
rotating livestock throughout multiple fields. Grazing with a specified rotation minimizes
overgrazing and resulting erosion. The Natural Resource Conservation Service (NRCS)
recommends grazing systems to improve and maintain water quality and quantity.
Duration, intensity, frequency, and season of grazing can be managed to enhance
vegetation cover and litter, resulting in reduced runoff, improved infiltration, increased
quantity of soil water for plant growth, and better manure distribution and increased rate
of decomposition, (NRCS, 1998). In a study by Tiedemann et al. (1988), as presented by
EPA (1993), the effects of four grazing strategies on bacteria levels in thirteen watersheds
in Oregon were studied during the summer of 1984. Results of the study (Table 9)
showed that when livestock are managed at a stocking rate of 19 acres per animal unit
month, with water developments and fencing, bacteria levels were reduced significantly.
Table 9. Bacterial Water Quality Response to Four Grazing Strategies (Tiedemann
et al., 1988).
Grazing Strategy Geometric Mean
Bacteria Count
Strategy A: Ungrazed 40/L
Strategy B: Grazing without management for livestock
distribution; 20.3 ac/AUM. 150/L
Strategy C: Grazing with management for livestock distribution:
fencing and water developments; 19.0 ac/AUM 90/L
Strategy D: Intensive grazing management, including practices to
attain uniform livestock distribution and improve
forage production with cultural practices such as
seeding, fertilizing, and forest thinning; 6.9 ac/AUM
950/L
Waste management system- Waste management systems can be effective in controlling
up to 90 percent of bacteria loading originating from confined animal feeding areas
(Table 8). A waste management system is made up of various components designed to
control nonpoint source pollution from concentrated animal feeding operations (CAFOs)
and animal feeding operations (AFOs). Diverting clean water from the feeding area and
containing dirty water from the feeding area in a pond are typical practices of a waste
management system. Manure handling and application of manure is designed to be
adaptive to environmental, soil, and plant conditions to minimize the probability of
contamination of surface water.
8.2 Other Recommendations
Vegetative filter strip- Vegetated filter strips are used to reduce the amount of sediment,
particulate organics, dissolved contaminants, nutrients, and in the case of this TMDL, E.
coli bacteria to streams. The effectiveness of filter strips and other BMPs in removing E.
coli bacteria is quite successful. Results from a study by Pennsylvania State University
(1992) as presented by EPA (1993) (Table 10), suggest that vegetative filter strips are
capable of removing up to 55 percent of bacteria loading to rivers and streams (Table 10).
The ability of the filter strip to remove contaminants is dependent on field slope, filter
strip slope, erosion rate, amount and particulate size distribution of sediment delivered to
the filter strip, density and height of vegetation, and runoff volume associated with
erosion producing events (NRCS, 2001).

Sheyenne River E. coli Bacteria TMDL Final: August 2012
Page 20 of 22
Table 10. Relative Gross Effectivenessa of Confined Livestock Control Measures
(Pennsylvania State University, 1992).
Practiceb Category
Runoffc
Volume
Totald
Phosphorus
(%)
Totald
Nitrogen
(%)
Sediment
(%)
Fecal
Bacteria
(%)
Animal Waste Systeme
- 90 80 60 85
Diversion Systemf
- 70 45 NA NA
Filter Stripsg
- 85 NA 60 55
Terrace System - 85 55 80 NA
Containment Structuresh
- 60 65 70 90 NA = Not Available. a Actual effectiveness depends on site-specific conditions. Values are not cumulative between practice categories.
b Each category includes several specific types of practices.
c - = reduction; + = increase; 0 = no change in surface runoff. d Total phosphorus includes total and dissolved phosphorus; total nitrogen includes organic-N, ammonia-N, and nitrate-N.
e Includes methods for collecting, storing, and disposing of runoff and process-generated wastewater.
f Specific practices include diversion of uncontaminated water from confinement facilities. g Includes all practices that reduce contaminant losses using vegetative control measures.
h Includes such practices as waste storage ponds, waste storage structures, waste treatment lagoons.
Septic System – Septic systems provide an economically feasible way of disposing of
household wastes where other means of waste treatment are unavailable (e.g., public or
private treatment facilities). The basis for most septic systems involves the treatment and
distribution of household wastes through a series of steps involving the following:
1. A sewer line connecting the house to a septic tank
2. A septic tank that allows solids to settle out of the effluent
3. A distribution system that dispenses the effluent to a leach field
4. A leaching system that allows the effluent to enter the soil
Septic system failure occurs when one or more components of the septic system do not
work properly and untreated waste or wastewater leaves the system. Wastes may pond in
the leach field and ultimately run off directly into nearby streams or percolate into
groundwater. Untreated septic system waste is a potential source of nutrients (nitrogen
and phosphorus), organic matter, suspended solids, and fecal bacteria. Land application
of septic system sludge, although unlikely, may also be a source of contamination.
Septic system failure can occur for several reasons, although the most common reason is
improper maintenance (e.g. age, inadequate pumping). Other reasons for failure include
improper installation, location, and choice of system. Harmful household chemicals can
also cause failure by killing the bacteria that digest the waste. While the number of
systems that are not functioning properly is unknown, it is estimated that 28 percent of
the systems in North Dakota are failing (EPA, 2002).
9.0 PUBLIC PARTICIPATION
To satisfy the public participation requirements of this TMDL, a letter was sent to the following
participating agencies notifying them that the draft report was available for review and public
comment. Those included in the mailing were as follows:
Griggs and Nelson County Water Resource Boards;
Griggs and Nelson County Soil Conservation Districts ;
Natural Resource Conservation Service (State Office); and
Sheyenne River E. coli Bacteria TMDL Final: August 2012
Page 21 of 22
U.S. Environmental Protection Agency, Region VIII
In addition to notifying specific agencies of this draft TMDL report’s availability, the report was
posted on the North Dakota Department of Health, Division of Water Quality web site at
http://www.ndhealth.gov./WQ/SW/Z2 TMDL/TMDLs Under PublicComment/B Under Public
Commment.html . A 30 day public notice soliciting comment and participation was also
published in the Griggs County Courier and the Lakota American.
Comments were only received from US EPA Region 8, which were provided as part of their
normal public notice review (Appendix D). The NDDoH’s response to these comments are
provided in Appendix E.
10.0 MONITORING
As stated previously, it should be noted that the TMDL loads, load allocations, and the MOS are
estimated based on available data and reasonable assumptions and are to be used as a guide for
implementation. The actual reduction needed to meet the applicable water quality standards may
be higher or lower depending on the results of future monitoring.
Specifically, monitoring will be conducted for the variable that is currently causing impairments
to the beneficial uses of the waterbody (i.e., E. coli bacteria). Once a watershed restoration plan
(e.g. 319 PIP) is implemented, monitoring will be conducted in the stream beginning two years
after implementation and extending five years after the implementation project is complete.
11.0 TMDL IMPLEMENTATION STRATEGY
Implementation of TMDLs is dependent upon the availability of Section 319 NPS funds or other
watershed restoration programs (e.g. USDA EQIP), as well as securing a local project sponsor
and the required matching funds. Provided these three requirements are in place, a project
implementation plan (PIP) is developed in accordance with the TMDL and submitted to the
North Dakota Nonpoint Source Pollution Task Force and EPA for approval. The implementation
of the BMPs contained in the NPS PIP is voluntary. Therefore, success of any TMDL
implementation project is ultimately dependent on the ability of the local project sponsor to find
cooperating producers.
Monitoring is an important and required component of any PIP. As a part of the PIP, data are
collected to monitor and track the effects of BMP implementation as well as to judge overall
project success. Quality Assurance Project Plans (QAPPs) detail the strategy of how, when and
where monitoring will be conducted to gather the data needed to document the TMDL
implementation goal(s). As data are gathered and analyzed, watershed restoration tasks are
adapted to place BMPs where they will have the greatest benefit to water quality.

Sheyenne River E. coli Bacteria TMDL Final: August 2012
Page 22 of 22
12.0 REFERENCES
Cleland. 2003. TMDL Development from the “Bottom Up” – Part III: Duration Curves and
Wet Weather Assessment. America’s Clean Water Foundation, Washington, D.C.
EPA. 1993. Guidance Specifying Management Measures for Sources of Nonpoint Pollution in
Coastal Waters. EPA 840-B-92-002. U.S. Environmental Protection Agency, Office of Water,
Washington, D.C.
EPA. 2001. Protocol for Developing Pathogen TMDLs. EPA 841-R-00-002. U.S.
Environmental Protection Agency, Office of Water, Washington, D.C.
EPA. 2002. Onsite Wastewater Treatment Systems Manual. EPA/625/R-00/008. U. S.
Environmental Protection Agency. Office of Water, Office of Research and Development.
EPA. 2007. An Approach for Using Load Duration Curves in the Development of TMDLs.
EPA-841-B-07-006. U.S. Environmental Protection Agency, Office of Water, Washington, DC.
Available at http://www.epa.gov/owow/tmdl/techsupp.html
NDAWN. 2012. McHenry, North Dakota Weather Station. North Dakota Agriculture Weather
Network. North Dakota State University, Fargo, North Dakota. Available at
http://ndawn.ndsu.nodak.edu/index.html
NDDoH. 2012. North Dakota 2012 Integrated Section 305(b) Water Quality Assessment
Report and Section 303(d) List of Waters Needing Total Maximum Daily Loads. North Dakota
Department of Health, Division of Water Quality. Bismarck, North Dakota.
NDDoH. 2011. Standards of Quality for Waters of the State. Chapter 33-16-02 of the North
Dakota Century Code. North Dakota Department of Health, Division of Water Quality.
Bismarck, North Dakota.
NRCS. 1998. Natural Resources Conservation Service Practice Specification 528. USDA-
Natural Resources Conservation Service, North Dakota. Available at http://efotg.nrcs.usda.gov
NRCS. 2001. Natural Resources Conservation Service Practice Specification 393 – Filter Strip
(Acres) [Online]. USDA – Natural Resources Conservation Service, North Dakota. Available at
http://www.nd.nrcs.usda.gov/resources/section4/standards/Section4.html.
Pennsylvania State University. 1992. Nonpoint Source Database. Pennsylvania State
University, Department of Agricultural and Biological Engineering, University Park, PA.
Tiedemann, A.R., D.A. Higgins, T.M. Quigley, H.R. Sanderson, and C. C. Bohn.1988. Bacterial
Water Quality Responses to Four Grazing Strategies – Comparison with Oregon Standards.
USGS. 2006. Ecoregions of North Dakota and South Dakota. United States Geological Survey.
Available at http://www.npwrc.usgs.gov/resource/habitat/ndsdeco/nodak.html.

Appendix A
E. coli Bacteria Data Collected for Site 380009
(2001-2010)

05-May-09 10 03-Jun-09 10 08-Jul-09 50 03-Aug-09 60 02-Sep-09 560
13-May-09 30 10-Jun-09 10 13-Jul-09 10 13-Aug-09 130 09-Sep-09 870
20-May-09 20 15-Jun-09 20 22-Jul-09 70 18-Aug-09 50 09-Sep-09 770
27-May-09 30 17-Jun-09 40 27-Jul-09 20 25-Aug-09 120 15-Sep-09 150
25-May-10 10 23-Jun-09 60 28-Jul-09 50 03-Aug-10 40 23-Sep-09 210
21-May-01 90 30-Jun-09 10 06-Jul-10 80 10-Aug-10 220 29-Sep-09 110
28-May-03 10 3-Jun-02 110 14-Jul-10 60 17-Aug-10 50 08-Sep-10 360
19-May-04 10 29-Jun-04 60 20-Jul-10 30 24-Aug-10 70 21-Sep-10 50
31-May-06 40 28-Jun-07 40 21-Jul-10 40 31-Aug-10 270 30-Sep-10 90
23-May-07 90 4-Jun-08 60 27-Jul-10 180 31-Aug-10 250 24-Sep-01 120
9-Jul-01 30 13-Aug-01 120 16-Sep-02 50
8-Jul-02 170 12-Aug-02 30 30-Sep-03 40
8-Jul-03 210 19-Aug-03 30 4-Sep-07 20
11-Jul-05 300 11-Aug-04 50
12-Jul-06 20 24-Aug-05 10
14-Jul-08 30 24-Aug-06 30
1-Aug-07 30
27-Aug-08 20
N 10 10 16 18 13
Geomean 24 31 55 60 143
% Exceed 409 CFU/100 mL 0% 0% 0% 0% 23%
Recrea tiona l Use Assessment
September
Fully Supporting Fully Supporting Fully Supporting Fully Supporting Not Supporting
May June July August

Appendix B
Flow Duration Curve for Site 380009

Site 380009

Appendix C
Load Duration Curve, Estimated Load, TMDL Target, and
Percent Load Reduction Required for Site 380009

380009 Sheyenne River near Cooperstown, ND
Median Percentile Existing TMDL Days Existing TMDL Percent Reduction
High 10.00% 369185.34 161708.20 73.00 26950530.16 11804698.67 56.20%
Moist 35.00% 100372.21 44396.53 109.50 10990756.93 4861420.24 55.77%
Total 183 37941287 16666119 56.07%
Load (107 CFUs/Day) Load (10
7 CFUs/Period)

Appendix D
US EPA Region 8 TMDL Review and Comments

EPA REGION 8 TMDL REVIEW FORM AND DECISION DOCUMENT
TMDL Document Info:
Document Name: E. coli Bacteria TMDL for the Sheyenne River in Nelson
and Griggs Counties, North Dakota
Submitted by: Mike Ell, North Dakota Department of Health
Date Received: July 16, 2012
Review Date: August 16, 2012
Reviewer: Vern Berry, US Environmental Protection Agency
Rough Draft / Public Notice /
Final Draft?
Public Notice
Notes:
Reviewers Final Recommendation(s) to EPA Administrator (used for final draft review only):
Approve
Partial Approval
Disapprove
Insufficient Information
Approval Notes to the Administrator:
This document provides a standard format for EPA Region 8 to provide comments to state
TMDL programs on TMDL documents submitted to EPA for either formal or informal review.
All TMDL documents are evaluated against the TMDL review elements identified in the
following 8 sections:
1. Problem Description
a. ... TMDL Document Submittal
b. Identification of the Waterbody, Impairments, and Study Boundaries
c. Water Quality Standards
2. Water Quality Target
3. Pollutant Source Analysis
4. TMDL Technical Analysis
a. Data Set Description
b. Waste Load Allocations (WLA)
c. Load Allocations (LA)
d. Margin of Safety (MOS)
e. Seasonality and variations in assimilative capacity
5. Public Participation
6. Monitoring Strategy
7. Restoration Strategy
8. Daily Loading Expression
Under Section 303(d) of the Clean Water Act, waterbodies that are not attaining one or more
water quality standard (WQS) are considered “impaired.” When the cause of the impairment is
determined to be a pollutant, a TMDL analysis is required to assess the appropriate maximum
allowable pollutant loading rate. A TMDL document consists of a technical analysis conducted
to: (1) assess the maximum pollutant loading rate that a waterbody is able to assimilate while
maintaining water quality standards; and (2) allocate that assimilative capacity among the known

sources of that pollutant. A well written TMDL document will describe a path forward that may
be used by those who implement the TMDL recommendations to attain and maintain WQS.
Each of the following eight sections describes the factors that EPA Region 8 staff considers
when reviewing TMDL documents. Also included in each section is a list of EPA’s review
elements relative to that section, a brief summary of the EPA reviewer’s findings, and the
reviewer’s comments and/or suggestions. Use of the verb “must” in this review form denotes
information that is required to be submitted because it relates to elements of the TMDL required
by the CWA and by regulation. Use of the term “should” below denotes information that is
generally necessary for EPA to determine if a submitted TMDL is approvable.
This review form is intended to ensure compliance with the Clean Water Act and that the
reviewed documents are technically sound and the conclusions are technically defensible.

1. Problem Description
A TMDL document needs to provide a clear explanation of the problem it is intended to address.
Included in that description should be a definitive portrayal of the physical boundaries to which
the TMDL applies, as well as a clear description of the impairments that the TMDL intends to
address and the associated pollutant(s) causing those impairments. While the existence of one or
more impairment and stressor may be known, it is important that a comprehensive evaluation of
the water quality be conducted prior to development of the TMDL to ensure that all water quality
problems and associated stressors are identified. Typically, this step is conducted prior to the
303(d) listing of a waterbody through the monitoring and assessment program. The designated
uses and water quality criteria for the waterbody should be examined against available data to
provide an evaluation of the water quality relative to all applicable water quality standards. If, as
part of this exercise, additional WQS problems are discovered and additional stressor pollutants
are identified, consideration should be given to concurrently evaluating TMDLs for those
additional pollutants. If it is determined that insufficient data is available to make such an
evaluation, this should be noted in the TMDL document.
1.1 TMDL Document Submittal
When a TMDL document is submitted to EPA requesting review or approval, the submittal
package should include a notification identifying the document being submitted and the purpose
of the submission.
Review Elements:
Each TMDL document submitted to EPA should include a notification of the document
status (e.g., pre-public notice, public notice, final), and a request for EPA review.
Each TMDL document submitted to EPA for final review and approval should be
accompanied by a submittal letter that explicitly states that the submittal is a final TMDL
submitted under Section 303(d) of the Clean Water Act for EPA review and approval. This
clearly establishes the State's/Tribe's intent to submit, and EPA's duty to review, the TMDL
under the statute. The submittal letter should contain such identifying information as the
name and location of the waterbody and the pollutant(s) of concern, which matches similar
identifying information in the TMDL document for which a review is being requested.
Recommendation:
Approve Partial Approval Disapprove Insufficient Information N/A
Summary: The notification of the availability of the public notice draft TMDL document was
submitted to EPA via a letter received on July 16, 2012. The letter includes the details of the
public notice, explains how to obtain a copy of the TMDL, and requests the submittal of
comments to NDDoH by August 20, 2012.
Comments: No comments.

1.2 Identification of the Waterbody, Impairments, and Study Boundaries
The TMDL document should provide an unambiguous description of the waterbody to which the
TMDL is intended to apply and the impairments the TMDL is intended to address. The
document should also clearly delineate the physical boundaries of the waterbody and the
geographical extent of the watershed area studied. Any additional information needed to tie the
TMDL document back to a current 303(d) listing should also be included.
Review Elements:
The TMDL document should clearly identify the pollutant and waterbody segment(s) for
which the TMDL is being established. If the TMDL document is submitted to fulfill a
TMDL development requirement for a waterbody on the state’s current EPA approved
303(d) list, the TMDL document submittal should clearly identify the waterbody and
associated impairment(s) as they appear on the State's/Tribe's current EPA approved 303(d)
list, including a full waterbody description, assessment unit/waterbody ID, and the priority
ranking of the waterbody. This information is necessary to ensure that the administrative
record and the national TMDL tracking database properly link the TMDL document to the
303(d) listed waterbody and impairment(s).
One or more maps should be included in the TMDL document showing the general location
of the waterbody and, to the maximum extent practical, any other features necessary and/or
relevant to the understanding of the TMDL analysis, including but not limited to: watershed
boundaries, locations of major pollutant sources, major tributaries included in the analysis,
location of sampling points, location of discharge gauges, land use patterns, and the location
of nearby waterbodies used to provide surrogate information or reference conditions. Clear
and concise descriptions of all key features and their relationship to the waterbody and water
quality data should be provided for all key and/or relevant features not represented on the
map
If information is available, the waterbody segment to which the TMDL applies should be
identified/geo-referenced using the National Hydrography Dataset (NHD). If the boundaries
of the TMDL do not correspond to the Waterbody ID(s) (WBID), Entity ID information or
reach code (RCH_Code) information should be provided. If NHD data is not available for
the waterbody, an alternative geographical referencing system that unambiguously identifies
the physical boundaries to which the TMDL applies may be substituted.
Recommendation:
Approve Partial Approval Disapprove Insufficient Information
Summary:
Physical Setting and Listing History:
The impaired stream segment included in this TMDL document is the Sheyenne River from Tolna
Dam outlet (ND-09020203-020-S_00) downstream to Lake Ashtabula (93.81 miles; ND-
09020203-001-S_00). This impaired stream segment lies within the Middle Sheyenne River sub-
basin (HUC 09020203) in east-central North Dakota and is part of the larger Red River of the
North drainage basin. The impaired segment is located in Nelson and Griggs Counties which
cover a watershed area of approximately 412,887 acres. This segment of the Sheyenne River is
listed as impaired for E. coli bacteria and is a high priority for TMDL development.

CHAPTER 33-16-02.1, Appendix 1 of the North Dakota Century Code assigns the following
classifications for the stream segment of the Sheyenne River included in this TMDL document.
All tributaries not specifically mentioned in Appendix 1 are classified as Class III streams.
Segment ND-09020203-001-S_00 of the Sheyenne River is a Class IA stream.
Impairment status:
The 2012 North Dakota Integrated Report identifies this segment of the Sheyenne River as not
supporting the following beneficial uses:
Stream Segment Designated Use /
Support Status
Impairment
Cause
TMDL
Priority
Sheyenne River
ND-09020203-002-S_00
Recreation /
Not Supporting
Escherichia
coli
High
Comments: No comments.
1.3 Water Quality Standards
TMDL documents should provide a complete description of the water quality standards for the
waterbodies addressed, including a listing of the designated uses and an indication of whether the
uses are being met, not being met, or not assessed. If a designated use was not assessed as part
of the TMDL analysis (or not otherwise recently assessed), the documents should provide a
reason for the lack of assessment (e.g., sufficient data was not available at this time to assess
whether or not this designated use was being met).
Water quality criteria (WQC) are established as a component of water quality standard at levels
considered necessary to protect the designated uses assigned to that waterbody. WQC identify
quantifiable targets and/or qualitative water quality goals which, if attained and maintained, are
intended to ensure that the designated uses for the waterbody are protected. TMDLs result in
maintaining and attaining water quality standards by determining the appropriate maximum
pollutant loading rate to meet water quality criteria, either directly, or through a surrogate
measurable target. The TMDL document should include a description of all applicable water
quality criteria for the impaired designated uses and address whether or not the criteria are being
attained, not attained, or not evaluated as part of the analysis. If the criteria were not evaluated
as part of the analysis, a reason should be cited (e.g. insufficient data were available to determine
if this water quality criterion is being attained).
Review Elements:
The TMDL must include a description of the applicable State/Tribal water quality standard,
including the designated use(s) of the waterbody, the applicable numeric or narrative water
quality criterion, and the anti-degradation policy. (40 C.F.R. §130.7(c)(1)).

The purpose of a TMDL analysis is to determine the assimilative capacity of the waterbody
that corresponds to the existing water quality standards for that waterbody, and to allocate
that assimilative capacity between the identified sources. Therefore, all TMDL documents
must be written to meet the existing water quality standards for that waterbody (CWA
§303(d)(1)(C)). Note: In some circumstances, the load reductions determined to be
necessary by the TMDL analysis may prove to be infeasible and may possibly indicate that
the existing water quality standards and/or assessment methodologies may be erroneous.
However, the TMDL must still be determined based on existing water quality standards.
Adjustments to water quality standards and/or assessment methodologies may be evaluated
separately, from the TMDL.
The TMDL document should describe the relationship between the pollutant of concern and
the water quality standard the pollutant load is intended to meet. This information is
necessary for EPA to evaluate whether or not attainment of the prescribed pollutant loadings
will result in attainment of the water quality standard in question.
If a standard includes multiple criteria for the pollutant of concern, the document should
demonstrate that the TMDL value will result in attainment of all related criteria for the
pollutant. For example, both acute and chronic values (if present in the WQS) should be
addressed in the document, including consideration of magnitude, frequency and duration
requirements.
Recommendation:
Approve Partial Approval Disapprove Insufficient Information
Summary: The Sheyenne River stream segment addressed by this TMDL document is impaired
based on E. coli concentrations impacting the recreational uses. This stream segment is given a
classification of Class IA as defined by the NDDoH.
Class IA - The quality of the waters in this class shall be the same as the quality of class
I streams, except that where natural conditions exceed Class I criteria for municipal
and domestic use, the availability of softening or other treatment methods may be
considered in determining whether ambient water quality meets the drinking water
requirements of the department.
Numeric criteria for E. coli in North Dakota, Class IA streams have been established and are
presented in the excerpted Table 4 shown below. The E. coli bacteria standard applies only
during the recreation season from May 1 to September 30. Discussion of additional applicable
water quality standards for this stream segment can be found on pages 8 – 9 of the TMDL
document.
Table 4. North Dakota Bacteria Water Quality Standards for Class IA Streams.
Parameter Standard
Geometric Mean1
Maximum2
E. coli Bacteria 126 CFU/100 mL 409 CFU/100 mL 1 Expressed as a geometric mean of representative samples collected during any consecutive 30-day period.
2 No more than 10 percent of samples collected during any consecutive 30-day period shall individually exceed the standard.
Comments: No comments.

2. Water Quality Targets
TMDL analyses establish numeric targets that are used to determine whether water quality
standards are being achieved. Quantified water quality targets or endpoints should be provided
to evaluate each listed pollutant/water body combination addressed by the TMDL, and should
represent achievement of applicable water quality standards and support of associated beneficial
uses. For pollutants with numeric water quality standards, the numeric criteria are generally used
as the water quality target. For pollutants with narrative standards, the narrative standard should
be translated into a measurable value. At a minimum, one target is required for each
pollutant/water body combination. It is generally desirable, however, to include several targets
that represent achievement of the standard and support of beneficial uses (e.g., for a sediment
impairment issue it may be appropriate to include a variety of targets representing water column
sediment such as TSS, embeddedness, stream morphology, up-slope conditions and a measure of
biota).
Review Elements:
The TMDL should identify a numeric water quality target(s) for each waterbody pollutant
combination. The TMDL target is a quantitative value used to measure whether or not the
applicable water quality standard is attained. Generally, the pollutant of concern and the
numeric water quality target are, respectively, the chemical causing the impairment and the
numeric criteria for that chemical (e.g., chromium) contained in the water quality standard.
Occasionally, the pollutant of concern is different from the parameter that is the subject of
the numeric water quality target (e.g., when the pollutant of concern is phosphorus and the
numeric water quality target is expressed as a numerical dissolved oxygen criterion). In
such cases, the TMDL should explain the linkage between the pollutant(s) of concern, and
express the quantitative relationship between the TMDL target and pollutant of concern. In
all cases, TMDL targets must represent the attainment of current water quality standards.
When a numeric TMDL target is established to ensure the attainment of a narrative water
quality criterion, the numeric target, the methodology used to determine the numeric target,
and the link between the pollutant of concern and the narrative water quality criterion should
all be described in the TMDL document. Any additional information supporting the numeric
target and linkage should also be included in the document.
Recommendation:
Approve Partial Approval Disapprove Insufficient Information
Summary: The water quality target for this TMDL is based on the numeric water quality
standards for E. coli bacteria established to protect the recreational beneficial uses for the
stream segment of the Sheyenne River above Lake Ashtabula. The E. coli standards are
expressed in coliform forming units (cfu) per 100 milliliters (mL) of the water sample. The E.
coli target for the impaired segment is: 126 cfu/100 mL during the recreation season from May 1
to September 30. While the standard is intended to be expressed as the 30-day geometric mean,
the target for the stream segment was used to compare to values from single grab samples. This
ensures that the reductions necessary to achieve the target will be protective of both the acute
(single sample value) and chronic (geometric mean of 5 samples) standard.
Comments: No comments.

3. Pollutant Source Analysis
A TMDL analysis is conducted when a pollutant load is known or suspected to be exceeding the
loading capacity of the waterbody. Logically then, a TMDL analysis should consider all sources
of the pollutant of concern in some manner. The detail provided in the source assessment step
drives the rigor of the pollutant load allocation. In other words, it is only possible to specifically
allocate quantifiable loads or load reductions to each identified source (or source category) when
the relative load contribution from each source has been estimated. Therefore, the pollutant load
from each identified source (or source category) should be specified and quantified. This may be
accomplished using site-specific monitoring data, modeling, or application of other assessment
techniques. If insufficient time or resources are available to accomplish this step, a
phased/adaptive management approach may be appropriate. The approach should be clearly
defined in the document.
Review Elements:
The TMDL should include an identification of the point and nonpoint sources of the pollutant
of concern, including the geographical location of the source(s) and the quantity of the
loading, e.g., lbs/per day. This information is necessary for EPA to evaluate the WLA, LA
and MOS components of the TMDL.
The level of detail provided in the source assessment should be commensurate with the
nature of the watershed and the nature of the pollutant being studied. Where it is possible to
separate natural background from nonpoint sources, the TMDL should include a description
of both the natural background loads and the nonpoint source loads.
Natural background loads should not be assumed to be the difference between the sum of
known and quantified anthropogenic sources and the existing in situ loads (e.g. measured in
stream) unless it can be demonstrated that the anthropogenic sources of the pollutant of
concern have been identified, characterized, and quantified.
The sampling data relied upon to discover, characterize, and quantify the pollutant sources
should be included in the document (e.g. a data appendix) along with a description of how
the data were analyzed to characterize and quantify the pollutant sources. A discussion of the
known deficiencies and/or gaps in the data set and their potential implications should also be
included.
Recommendation:
Approve Partial Approval Disapprove Insufficient Information
Summary: The TMDL document includes the landuse breakdown for the watershed based on
the 2007 National Agricultural Statistics Service (NASS) data. In 2007, the dominant land use
for the sub-watershed that drains to the listed segment of the Sheyenne River was agriculture,
primarily crop production. Approximately 55 percent of the landuse in the watershed was
cropland, 33 percent was grassland/pastureland, and the remaining 12 percent was wetlands,
developed space, barren or woods. The majority of the crops grown consisted of soybeans,
spring wheat, corn and sunflowers.
Section 4.0, Significant Sources beginning on page 9, provides the pollutant source analysis for
the listed segment of the Sheyenne River. There are no known point source discharges to the
listed segment of the Sheyenne River.
There are seven known animal feeding operations (AFOs) in the contributing watershed of the
Sheyenne River. The seven include four small (0-300 animal units (AUs)) and three medium
(301-999 AUs) AFOs. All seven AFOs have permits to operate, are zero discharge facilities and
are not deemed significant point sources of E. coli bacteria loading to the impaired segment of
the Sheyenne River.
The E. coli bacteria pollution to this segment originates from nonpoint sources in the watershed.
Livestock grazing and watering in proximity to the stream and the contributing tributary
watershed is common. Intense early summer storms can cause overland flooding and rising
river levels. Due to the close proximity of livestock grazing and watering along tributaries in the
watershed, it is likely that runoff from these activities contribute to the E. coli bacteria pollution
in the Sheyenne River watershed.
Wildlife may also contribute to the E. coli bacteria found in the water quality samples, but most
likely in a lower concentration. Wildlife is nomadic with fewer numbers concentrating in a
specific area, thus decreasing the probability of their contribution of fecal matter in significant
quantities.
Septic system failure might also contribute to the E. coli bacteria in the water quality samples.
Failures can occur for several reasons, although the most common reason is improper
maintenance (e.g. age, inadequate pumping). Other reasons for failure include improper
installation, location, and system design. Harmful household chemicals can also cause failure
by killing the bacteria that digest the waste. While the number of systems that are not
functioning properly is unknown, it is estimated that 28 percent of the systems in North Dakota
are failing.
Comments: Section 4.1, Point Source Pollution Sources, says that there are no known point
sources to the listed segment of the Sheyenne River. Based on a review of the available maps of
the watershed, we agree that there don’t seem to be any direct discharges to the mainstem of the
Sheyenne River. However, there appear to be three potential discharges to tributaries that drain
to the listed segment. The towns of Cooperstown, McVille and Aneta appear to have wastewater
treatment systems that potentially discharge to tributaries of the Sheyenne River. We
recommend adding a paragraph to the TMDL document that addresses these potential sources
as well as a rationale of why they are/are not contributors of E. coli loading to the impaired
segment. If it is determined that one or more of the point sources have the potential to contribute
the E. coli loading in the Sheyenne River, then WLAs should be added to the TMDL.
4. TMDL Technical Analysis
TMDL determinations should be supported by an analysis of the available data, discussion of the
known deficiencies and/or gaps in the data set, and an appropriate level of technical analysis.
This applies to all of the components of a TMDL document. It is vitally important that the
technical basis for all conclusions be articulated in a manner that is easily understandable and
readily apparent to the reader.
A TMDL analysis determines the maximum pollutant loading rate that may be allowed to a
waterbody without violating water quality standards. The TMDL analysis should demonstrate an
understanding of the relationship between the rate of pollutant loading into the waterbody and
the resultant water quality impacts. This stressor response relationship between the pollutant
and impairment and between the selected targets, sources, TMDLs, and load allocations needs to
be clearly articulated and supported by an appropriate level of technical analysis. Every effort
should be made to be as detailed as possible, and to base all conclusions on the best available
scientific principles.
The pollutant loading allocation is at the heart of the TMDL analysis. TMDLs apportion
responsibility for taking actions by allocating the available assimilative capacity among the
various point, nonpoint, and natural pollutant sources. Allocations may be expressed in a variety
of ways, such as by individual discharger, by tributary watershed, by source or land use category,
by land parcel, or other appropriate scale or division of responsibility.
The pollutant loading allocation that will result in achievement of the water quality target is
expressed in the form of the standard TMDL equation:
MOSLAsWLAsTMDL
Where:
TMDL = Total Maximum Daily Load (also called the Loading Capacity)
LAs = Load Allocations
WLAs = Wasteload Allocations
MOS = Margin Of Safety
Review Elements:
A TMDL must identify the loading capacity of a waterbody for the applicable pollutant,
taking into consideration temporal variations in that capacity. EPA regulations define
loading capacity as the greatest amount of a pollutant that a water can receive without
violating water quality standards (40 C.F.R. §130.2(f)).
The total loading capacity of the waterbody should be clearly demonstrated to equate back to
the pollutant load allocations through a balanced TMDL equation. In instances where
numerous LA, WLA and seasonal TMDL capacities make expression in the form of an
equation cumbersome, a table may be substituted as long as it is clear that the total TMDL
capacity equates to the sum of the allocations.
The TMDL document should describe the methodology and technical analysis used to
establish and quantify the cause-and-effect relationship between the numeric target and the
identified pollutant sources. In many instances, this method will be a water quality model.

It is necessary for EPA staff to be aware of any assumptions used in the technical analysis to
understand and evaluate the methodology used to derive the TMDL value and associated
loading allocations. Therefore, the TMDL document should contain a description of any
important assumptions (including the basis for those assumptions) made in developing the
TMDL, including but not limited to:
the spatial extent of the watershed in which the impaired waterbody is located and the
spatial extent of the TMDL technical analysis;
the distribution of land use in the watershed (e.g., urban, forested, agriculture);
a presentation of relevant information affecting the characterization of the pollutant of
concern and its allocation to sources such as population characteristics, wildlife
resources, industrial activities etc…;
present and future growth trends, if taken into consideration in determining the
TMDL and preparing the TMDL document (e.g., the TMDL could include the design
capacity of an existing or planned wastewater treatment facility);
an explanation and analytical basis for expressing the TMDL through surrogate
measures, if applicable. Surrogate measures are parameters such as percent fines and
turbidity for sediment impairments; chlorophyll a and phosphorus loadings for excess
algae; length of riparian buffer; or number of acres of best management practices.
The TMDL document should contain documentation supporting the TMDL analysis,
including an inventory of the data set used, a description of the methodology used to analyze
the data, a discussion of strengths and weaknesses in the analytical process, and the results
from any water quality modeling used. This information is necessary for EPA to review the
loading capacity determination, and the associated load, wasteload, and margin of safety
allocations.
TMDLs must take critical conditions (e.g., steam flow, loading, and water quality
parameters, seasonality, etc…) into account as part of the analysis of loading capacity (40
C.F.R. §130.7(c)(1) ). TMDLs should define applicable critical conditions and describe the
approach used to determine both point and nonpoint source loadings under such critical
conditions. In particular, the document should discuss the approach used to compute and
allocate nonpoint source loadings, e.g., meteorological conditions and land use distribution.
Where both nonpoint sources and NPDES permitted point sources are included in the TMDL
loading allocation, and attainment of the TMDL target depends on reductions in the nonpoint
source loads, the TMDL document must include a demonstration that nonpoint source
loading reductions needed to implement the load allocations are actually practicable [40 CFR
130.2(i) and 122.44(d)].
Recommendation:
Approve Partial Approval Disapprove Insufficient Information
Summary: The technical analysis should describe the cause and effect relationship between the
identified pollutant sources, the numeric targets, and achievement of water quality standards. It
should also include a description of the analytical processes used, results from water quality
modeling, assumptions and other pertinent information. The technical analysis for the Sheyenne
River describes how the E. coli loads were derived in order to meet the applicable water quality
standards for the 303(d) impaired stream segment.
The TMDL loads and loading capacities were derived using the load duration curve (LDC)
approach as described in Section 5.0 of the TMDL. To better correlate the relationship between
the pollutant of concern and the hydrology of the Section 303(d) listed waterbody, a LDC was

developed for the Sheyenne River stream segment. Daily stream flow values were collected at
USGS gage station 05057000 located on the Sheyenne River near Copperstown, ND. This gage
station is collocated with the NDDoH monitoring station 380009 where the E. coli water quality
samples were collected.
A LDC was derived for the segment using the daily flow record, the 126 cfu/100 mL TMDL
target (i.e., state water quality standard) and the observed E. coli data collected from the
monitoring station (see Figure 6 of the TMDL document for a map of the monitoring location).
Observed in-stream E. coli bacteria data, obtained from the monitoring station, was converted to
pollutant loads by multiplying E. coli bacteria concentrations by the mean daily flow and a
conversion factor. These loads were plotted against the percent exceeded flow on the day of
sample collection (see Figure 9 in the TMDL document). Points plotted above the 126 cfu/100
mL target curve exceeded the State water quality standard or TMDL target. Points plotted
below the curve are meeting the State water quality standard of 126 cfu/100 mL.
To estimate the required percent reduction in loading needed to achieve the TMDL for the
stream segment, a linear regression line through the E. coli load data above the TMDL curve in
each flow regime was plotted. The required percent reduction needed for the four regimes was
determined using the linear regression line (see Appendix C in the TMDL document).
The LDC represents a flow-variable TMDL target across the flow regimes shown in the TMDL
document. For the Sheyenne River segment covered by the TMDL, the LDC is a dynamic
expression of the allowable daily load for any given daily flow. Loading capacities were derived
from this approach for the listed stream segment at each flow regime. Table 7 shows the loading
capacity load (i.e., TMDL load) for the listed segment of the Sheyenne River.
Comments: No Comments.

4.1 Data Set Description
TMDL documents should include a thorough description and summary of all available water
quality data that are relevant to the water quality assessment and TMDL analysis. An inventory
of the data used for the TMDL analysis should be provided to document, for the record, the data
used in decision making. This also provides the reader with the opportunity to independently
review the data. The TMDL analysis should make use of all readily available data for the
waterbody under analysis unless the TMDL writer determines that the data are not relevant or
appropriate. For relevant data that were known but rejected, an explanation of why the data were
not utilized should be provided (e.g., samples exceeded holding times, data collected prior to a
specific date were not considered timely, etc…).
Review Elements:
TMDL documents should include a thorough description and summary of all available water
quality data that are relevant to the water quality assessment and TMDL analysis such that
the water quality impairments are clearly defined and linked to the impaired beneficial uses
and appropriate water quality criteria.
The TMDL document submitted should be accompanied by the data set utilized during the
TMDL analysis. If possible, it is preferred that the data set be provided in an electronic
format and referenced in the document. If electronic submission of the data is not possible,
the data set may be included as an appendix to the document.
Recommendation:
Approve Partial Approval Disapprove Insufficient Information
Summary: The Sheyenne River TMDL data description and summary are included in the
Available Data section (Section 1.5) and in the data table in Appendix A. Recent water quality
monitoring was conducted from May – September 2009-2010 and included 67 E. coli samples.
The data set also includes approximately 20 years of flow record from USGS gauging station
05057000 (co-located with sampling station 380009). The flow data, the E. coli data and the
TMDL targets, were used to develop the E. coli load duration curve for the listed segment of the
Sheyenne River.
Comments: No Comments.

4.2 Waste Load Allocations (WLA):
Waste Load Allocations represent point source pollutant loads to the waterbody. Point source
loads are typically better understood and more easily monitored and quantified than nonpoint
source loads. Whenever practical, each point source should be given a separate waste load
allocation. All NPDES permitted dischargers that discharge the pollutant under analysis directly
to the waterbody should be identified and given separate waste load allocations. The finalized
WLAs are required to be incorporated into future NPDES permit renewals.
Review Elements:
EPA regulations require that a TMDL include WLAs, which identify the portion of the
loading capacity allocated to individual existing and future point source(s) (40 C.F.R.
§130.2(h), 40 C.F.R. §130.2(i)). In some cases, WLAs may cover more than one discharger,
e.g., if the source is contained within a general permit. If no allocations are to be made to
point sources, then the TMDL should include a value of zero for the WLA.
All NPDES permitted dischargers given WLA as part of the TMDL should be identified in
the TMDL, including the specific NPDES permit numbers, their geographical locations, and
their associated waste load allocations.
Recommendation:
Approve Partial Approval Disapprove Insufficient Information
Summary: Within the drainage area of the listed segment of the Sheyenne River there no known
point source discharges. Therefore, the E. coli WLA for this segment is zero.
There are seven known animal feeding operations (AFOs) in the contributing watershed of the
Sheyenne River. The seven include four small (0-300 animal units (AUs)) and three medium
(301-999 AUs) AFOs. All seven AFOs have permits to operate, are zero discharge facilities and
are not deemed significant point sources of E. coli bacteria loading to the impaired segment of
the Sheyenne River.
Comments: See the comments above in the Source Analysis section on the need to address
potential point source discharges from the towns of Cooperstown, McVille and Aneta.

4.3 Load Allocations (LA):
Load allocations include the nonpoint source, natural, and background loads. These types of
loads are typically more difficult to quantify than point source loads, and may include a
significant degree of uncertainty. Often it is necessary to group these loads into larger categories
and estimate the loading rates based on limited monitoring data and/or modeling results. The
background load represents a composite of all upstream pollutant loads into the waterbody. In
addition to the upstream nonpoint and upstream natural load, the background load often includes
upstream point source loads that are not given specific waste load allocations in this particular
TMDL analysis. In instances where nonpoint source loading rates are particularly difficult to
quantify, a performance-based allocation approach, in which a detailed monitoring plan and
adaptive management strategy are employed for the application of BMPs, may be appropriate.
Review Elements:
EPA regulations require that TMDL expressions include LAs which identify the portion of
the loading capacity attributed to nonpoint sources and to natural background. Load
allocations may range from reasonably accurate estimates to gross allotments (40 C.F.R.
§130.2(g)). Load allocations may be included for both existing and future nonpoint source
loads. Where possible, load allocations should be described separately for natural
background and nonpoint sources.
Load allocations assigned to natural background loads should not be assumed to be the
difference between the sum of known and quantified anthropogenic sources and the existing
in situ loads (e.g., measured in stream) unless it can be demonstrated that the anthropogenic
sources of the pollutant of concern have been identified and given proper load or waste load
allocations.
Recommendation:
Approve Partial Approval Disapprove Insufficient Information
Summary: The TMDL document includes the landuse breakdown for the watershed based on
the 2007 National Agricultural Statistics Service (NASS) data. In 2007, the dominant land use in
the drainage area of the listed segment of the Sheyenne River was agriculture. Approximately 55
percent of the landuse in the watershed was cropland, 33 percent was grassland, pastureland or
conservation reserve program lands and the remaining 12 percent was water, wetlands,
developed space, barren or woods. The majority of the crops grown consist of soybeans, spring
wheat, corn and sunflowers.
The E. coli bacteria loading to this segment originate from nonpoint sources in the watershed.
Intense early summer storms can cause overland flooding and rising river levels. Due to the
close proximity of livestock grazing and watering to the river, it is likely that they contribute to
the E. coli bacteria pollution in the listed segments of the Sheyenne River.
Wildlife and failing septic systems may also contribute to the E. coli bacteria found in the water
quality samples, but most likely in a lower concentration.
By relating runoff characteristics to each flow regime one can infer which sources are most
likely to contribute to E. coli bacteria loading. Animals grazing in the riparian area contribute
E. coli bacteria by depositing manure where it has an immediate impact on water quality. Due
to the close proximity of manure to the stream or by direct deposition in the stream, riparian
grazing impacts water quality at high, moist and dry condition, and low flows. In contrast,
intensive grazing of livestock in the upland and not in the riparian area has a high potential to

impact water quality at high flows and medium impact at moist condition flows. Exclusion of
livestock from the riparian area eliminates the potential of direct manure deposit and, therefore,
is considered to be of high importance at all flows. However, intensive grazing in the upland
creates the potential for manure accumulation and availability for runoff at high flows and a
high potential for E. coli bacteria contamination.
Source specific data are limited so an aggregate LA is assigned to nonpoint sources with a
ranking of important contributors under various flow regimes provided as seen in the following
excerpted table. An aggregate LA for the impaired segment of the Sheyenne River is included in
Table 7 of the TMDL document.
Table 5. Nonpoint Sources of Pollution and Their Potential to Pollute at a Given Flow
Regime.
Nonpoint Sources
Flow Regime
High Flow Moist
Conditions
Dry
Conditions
Riparian Area Grazing (Livestock) H H H
Animal Feeding Operations H M L
Manure Application to Crop and
Range Land
H M L
Intensive Upland Grazing (Livestock) H M L
Note: Potential importance of nonpoint source area to contribute E. coli bacteria loads under a given flow regime. (H:
High; M: Medium; L: Low)
Comments: No comments.

4.4 Margin of Safety (MOS):
Natural systems are inherently complex. Any mathematical relationship used to quantify the
stressor response relationship between pollutant loading rates and the resultant water quality
impacts, no matter how rigorous, will include some level of uncertainty and error. To
compensate for this uncertainty and ensure water quality standards will be attained, a margin of
safety is required as a component of each TMDL. The MOS may take the form of a explicit load
allocation (e.g., 10 lbs/day), or may be implicitly built into the TMDL analysis through the use of
conservative assumptions and values for the various factors that determine the TMDL pollutant
load water quality effect relationship. Whether explicit or implicit, the MOS should be
supported by an appropriate level of discussion that addresses the level of uncertainty in the
various components of the TMDL technical analysis, the assumptions used in that analysis, and
the relative effect of those assumptions on the final TMDL. The discussion should demonstrate
that the MOS used is sufficient to ensure that the water quality standards would be attained if the
TMDL pollutant loading rates are met. In cases where there is substantial uncertainty regarding
the linkage between the proposed allocations and achievement of water quality standards, it may
be necessary to employ a phased or adaptive management approach (e.g., establish a monitoring
plan to determine if the proposed allocations are, in fact, leading to the desired water quality
improvements).
Review Elements:
TMDLs must include a margin of safety (MOS) to account for any lack of knowledge
concerning the relationship between load and wasteload allocations and water quality (CWA
§303(d) (1) (C), 40 C.F.R. §130.7(c)(1) ). EPA's 1991 TMDL Guidance explains that the
MOS may be implicit (i.e., incorporated into the TMDL through conservative assumptions in
the analysis) or explicit (i.e., expressed in the TMDL as loadings set aside for the MOS).
If the MOS is implicit, the conservative assumptions in the analysis that account for the MOS
should be identified and described. The document should discuss why the assumptions are
considered conservative and the effect of the assumption on the final TMDL value
determined.
If the MOS is explicit, the loading set aside for the MOS should be identified. The document
should discuss how the explicit MOS chosen is related to the uncertainty and/or potential
error in the linkage analysis between the WQS, the TMDL target, and the TMDL loading
rate.
If, rather than an explicit or implicit MOS, the TMDL relies upon a phased approach to deal
with large and/or unquantifiable uncertainties in the linkage analysis, the document should
include a description of the planned phases for the TMDL as well as a monitoring plan and
adaptive management strategy.
Recommendation:
Approve Partial Approval Disapprove Insufficient Information
Summary: The Sheyenne River TMDL document includes an explicit MOS for the listed segment
of the stream. The MOS was derived by calculating 10 percent of the loading capacity. The
explicit MOS for the Sheyenne River is included in Table 7 of the TMDL document.
Comments: No comments.

4.5 Seasonality and variations in assimilative capacity:
The TMDL relationship is a factor of both the loading rate of the pollutant to the waterbody and
the amount of pollutant the waterbody can assimilate and still attain water quality standards.
Water quality standards often vary based on seasonal considerations. Therefore, it is appropriate
that the TMDL analysis consider seasonal variations, such as critical flow periods (high flow,
low flow), when establishing TMDLs, targets, and allocations.
Review Elements:
The statute and regulations require that a TMDL be established with consideration of
seasonal variations. The TMDL must describe the method chosen for including seasonal
variability as a factor. (CWA §303(d)(1)(C), 40 C.F.R. §130.7(c)(1) ).
Recommendation:
Approve Partial Approval Disapprove Insufficient Information
Summary: By using the load duration curve approach to develop the TMDL allocations
seasonal variability in fecal coliform loads are taken into account. The highest steam flows
typically occur during late spring, and the lowest stream flows typically occur during the winter
months. The TMDL also considers seasonality because the fecal coliform criteria are in effect
from May 1 to September 30, as defined by the recreation season in North Dakota.
Comments: No comments.
5. Public Participation
EPA regulations require that the establishment of TMDLs be conducted in a process open to the
public, and that the public be afforded an opportunity to participate. To meaningfully participate
in the TMDL process it is necessary that stakeholders, including members of the general public,
be able to understand the problem and the proposed solution. TMDL documents should include
language that explains the issues to the general public in understandable terms, as well as
provides additional detailed technical information for the scientific community. Notifications or
solicitations for comments regarding the TMDL should be made available to the general public,
widely circulated, and clearly identify the product as a TMDL and the fact that it will be
submitted to EPA for review. When the final TMDL is submitted to EPA for approval, a copy of
the comments received by the state and the state responses to those comments should be included
with the document.
Review Elements:
The TMDL must include a description of the public participation process used during the
development of the TMDL (40 C.F.R. §130.7(c)(1)(ii) ).
TMDLs submitted to EPA for review and approval should include a summary of significant
comments and the State's/Tribe's responses to those comments.

Recommendation:
Approve Partial Approval Disapprove Insufficient Information
Summary: The TMDL document includes a summary of the public participation process that
has occurred. It describes the opportunities the public had to be involved in the TMDL
development process. Letters notifying stakeholders of the availability of the draft TMDL
document were mailed to stakeholders in the watershed during public comment. Also, the draft
TMDL document was posted on NDoDH’s Water Quality Division website, and a public notice
for comment was published in local newspapers.
Comments: No comments.
6. Monitoring Strategy
TMDLs may have significant uncertainty associated with the selection of appropriate numeric
targets and estimates of source loadings and assimilative capacity. In these cases, a phased
TMDL approach may be necessary. For Phased TMDLs, it is EPA’s expectation that a
monitoring plan will be included as a component of the TMDL document to articulate the means
by which the TMDL will be evaluated in the field, and to provide for future supplemental data
that will address any uncertainties that may exist when the document is prepared.
Review Elements:
When a TMDL involves both NPDES permitted point source(s) and nonpoint source(s)
allocations, and attainment of the TMDL target depends on reductions in the nonpoint source
loads, the TMDL document should include a monitoring plan that describes the additional
data to be collected to determine if the load reductions provided for in the TMDL are
occurring.
Under certain circumstances, a phased TMDL approach may be utilized when limited
existing data are relied upon to develop a TMDL, and the State believes that the use of
additional data or data based on better analytical techniques would likely increase the
accuracy of the TMDL load calculation and merit development of a second phase TMDL.
EPA recommends that a phased TMDL document or its implementation plan include a
monitoring plan and a scheduled timeframe for revision of the TMDL. These elements would
not be an intrinsic part of the TMDL and would not be approved by EPA, but may be
necessary to support a rationale for approving the TMDL.
http://www.epa.gov/owow/tmdl/tmdl_clarification_letter.pdf
Recommendation:
Approve Partial Approval Disapprove Insufficient Information
Summary: Once a watershed restoration plan (e.g., Section 319 PIP) is developed and
implemented, monitoring will be conducted in the stream beginning two years after
implementation and extending five years after the implementation project is complete.
Comments: No comments.

7. Restoration Strategy
The overall purpose of the TMDL analysis is to determine what actions are necessary to ensure
that the pollutant load in a waterbody does not result in water quality impairment. Adding
additional detail regarding the proposed approach for the restoration of water quality is not
currently a regulatory requirement, but is considered a value added component of a TMDL
document. During the TMDL analytical process, information is often gained that may serve to
point restoration efforts in the right direction and help ensure that resources are spent in the most
efficient manner possible. For example, watershed models used to analyze the linkage between
the pollutant loading rates and resultant water quality impacts might also be used to conduct
“what if” scenarios to help direct BMP installations to locations that provide the greatest
pollutant reductions. Once a TMDL has been written and approved, it is often the responsibility
of other water quality programs to see that it is implemented. The level of quality and detail
provided in the restoration strategy will greatly influence the future success in achieving the
needed pollutant load reductions.
Review Elements:
EPA is not required to and does not approve TMDL implementation plans. However, in
cases where a WLA is dependent upon the achievement of a LA, “reasonable assurance” is
required to demonstrate the necessary LA called for in the document is practicable. A
discussion of the BMPs (or other load reduction measures) that are to be relied upon to
achieve the LA(s), and programs and funding sources that will be relied upon to implement
the load reductions called for in the document, may be included in the
implementation/restoration section of the TMDL document to support a demonstration of
“reasonable assurance”.
Recommendation:
Approve Partial Approval Disapprove Insufficient Information
Summary: Implementation of this TMDL is dependent upon the availability of Section 319 NPS
funds or other watershed restoration programs (e.g. USDA EQIP), as well as securing a local
project sponsor and the required matching funds. Provided these three requirements are in
place, a project implementation plan (PIP) will be developed in accordance with the TMDL and
submitted to the North Dakota Nonpoint Source Pollution Task Force and US EPA for approval.
The implementation of the BMPs contained in the NPS PIP is voluntary. Therefore, success of
any TMDL implementation project is ultimately dependent on the ability of the local project
sponsor to find cooperating producers.
Comments: No comments.

8. Daily Loading Expression
The goal of a TMDL analysis is to determine what actions are necessary to attain and maintain
WQS. The appropriate averaging period that corresponds to this goal will vary depending on the
pollutant and the nature of the waterbody under analysis. When selecting an appropriate
averaging period for a TMDL analysis, primary concern should be given to the nature of the
pollutant in question and the achievement of the underlying WQS. However, recent federal
appeals court decisions have pointed out that the title TMDL implies a “daily” loading rate.
While the most appropriate averaging period to be used for developing a TMDL analysis may
vary according to the pollutant, a daily loading rate can provide a more practical indication of
whether or not the overall needed load reductions are being achieved. When limited monitoring
resources are available, a daily loading target that takes into account the natural variability of the
system can serve as a useful indicator for whether or not the overall load reductions are likely to
be met. Therefore, a daily expression of the required pollutant loading rate is a required element
in all TMDLs, in addition to any other load averaging periods that may have been used to
conduct the TMDL analysis. The level of effort spent to develop the daily load indicator should
be based on the overall utility it can provide as an indicator for the total load reductions needed.
Review Elements:
The document should include an expression of the TMDL in terms of a daily load. However,
the TMDL may also be expressed in temporal terms other than daily (e.g., an annual or
monthly load). If the document expresses the TMDL in additional “non-daily” terms the
document should explain why it is appropriate or advantageous to express the TMDL in the
additional unit of measurement chosen.
Recommendation:
Approve Partial Approval Disapprove Insufficient Information
Summary: The TMDL document for the listed segment of the Sheyenne River includes daily
loads expressed as colony forming units per day. The daily TMDL loads are included in the
TMDL section (i.e., Section 7.0), of the document.
Comments: No comments.

Appendix E
NDDoH Response to Comments

US EPA Region 8 Comment on Section 4.1, Point Source Pollution Sources: There are no
known point sources to the listed segment of the Sheyenne River. Based on a review of the
available maps of the watershed, we agree that there don’t seem to be any direct discharges to the
mainstem of the Sheyenne River. However, there appear to be three potential discharges to
tributaries that drain to the listed segment. The towns of Cooperstown, McVille and Aneta
appear to have wastewater treatment systems that potentially discharge to tributaries of the
Sheyenne River. We recommend adding a paragraph to the TMDL document that addresses
these potential sources as well as a rationale of why they are/are not contributors of E. coli
loading to the impaired segment. If it is determined that one or more of the point sources have
the potential to contribute the E. coli loading in the Sheyenne River, then WLAs should be added
to the TMDL.
Regarding the Waste Load Allocation in the TMDL, EPA also commented with the following:
“see the comments above in the Source Analysis section on the need to address potential point
source discharges from the towns of Cooperstown, McVille and Aneta.”
NDDoH Response: Wording has been added to Section 4.1, Point Source Pollution Sources,
and Section 5.4, Loading Sources, which provides additional rationale for excluding the cities of
McVille, Cooperstown and Aneta from the waste load allocation in the TMDL.