e system - foialts.com – alternative investment ... system ter, 2016 defined contribution...
TRANSCRIPT

Q4 16Period Ending 12.31.16 |
Raleigh, NC 27609
4208 Six Forks Road, Suite 1700
Our mission is to enrich the lives of our clients, colleagues and communities through sound financial advice, integrity, and a commitment to service beyond expectation.
CAPTRUST
QUARTERLY REVIEW
University of Maine System
4th Quarter, 2016
DEFINED CONTRIBUTION
Investment Committee - Defined Contribution Plan - Quarterly Review
12

University of Maine System Defined Contribution Plan
Q4 16Period Ending 12.31.16 |in this review
University of Maine System Defined Contribution Plan
4th Quarter, 2016 Quarterly Review
prepared by:
Section 1
RETIREMENT INDUSTRY UPDATES
Section 2
MARKET COMMENTARY AND REVIEW
Section 3
PLAN INVESTMENT REVIEW
Section 4
FUND FACT SHEETS
Appendix
Senior Vice President | Financial Advisor
Michael S. Pratico
Senior Vice President | Financial Advisor
Barron V. Schmitt
2
Investment Committee - Defined Contribution Plan - Quarterly Review
13
University of Maine System Defined Contribution Plan
Q4 16Period Ending 12.31.16 |section
SECTION 1: RETIREMENT INDUSTRY UPDATES
Industry Updates………………………………………………………………………….………………………….
1: retirement industry updates
3
Investment Committee - Defined Contribution Plan - Quarterly Review
14

Period Ending 12.31.16 | Q4 ’16
MORNINGSTAR ADDS ETFS TO PEER GROUPS Morningstar combined its open-end mutual fund universe with its exchange-traded fund (ETF) universe in November 2016. In the coming months, CAPTRUST will evaluate the impact that the addition of ETFs will have on peer groups and how it might affect our approach to monitoring investment policy statements. To avoid immediate disruption, we will not include ETFs in our calculation of peer group averages, rankings, or investment policy monitor scores starting in the fourth quarter of 2016.
Source: Morningstar Direct. Mutual funds data includes multiple share classes.
Category Name Number of Mutual Funds
Number of ETFs
Percent Increase
Commodities Broad Basket 160 22 14%
Diversified Emerging Mkts 933 67 7%
Foreign Large Value 363 35 10%
Foreign Small/Mid Blend 114 8 7%
Foreign Small/Mid Value 73 9 12%
Healthcare 133 36 27%
Intermediate-Term Bond 1,139 26 2%
Large Blend 1,628 105 6%
Large Growth 1,648 39 2%
Large Value 1,438 68 5%
Mid-Cap Blend 486 37 8%
Mid-Cap Growth 729 24 3%
Mid-Cap Value 471 24 5%
Natural Resources 131 31 24%
Real Estate 294 21 7%
Small Blend 887 30 3%
Small Growth 766 14 2%
Small Value 476 19 4%
Technology 204 47 23%
Utilities 59 13 22%
The chart below shows the increase in peer group size as of 11.30.2016, after inclusion of ETFs. Sector-specific categories such as technology, utilities, and health care are most impacted. Are ETFs part of the opportunity set for institutional investors?
Given their tax status and the prevalence of other low-cost passive products, qualified retirement plans do not meaningfully use ETFs. For participant-directed plans, access to ETFs is a function of recordkeeping platform capabilities, and most platforms are not set up to handle ETF intraday trading and valuation.
How will ETF performance be measured? Is it an appropriate comparison to mutual funds?
ETF performance used for category calculations would be market-return based, not based on the underlying value of an ETF’s holdings. This means returns could be influenced by short-term supply and demand imbalances.
As we evaluate the addition of ETFs, below are several considerations:
How will ETF inclusion in peer groups alter performance and scoring over time?
The ETF universe has grown rapidly since 2009. As a result, ETFs on average tend to have shorter track records than comparable mutual funds. They are also more likely to be passively managed. These factors will make performance comparisons difficult, at least until the two groups more closely resemble each other.
institutional marketplace — industry update
4
Investment Committee - Defined Contribution Plan - Quarterly Review
15

Period Ending 12.31.16 | Q4 ’16
A CRYSTAL BALL AND A COMPASS
• Money leaving defined contribution plans may slow
• Plan sponsor focus shifts more toward retirees in plan
• Plan sponsors add more distribution options to plan designs
• Income and withdrawal solutions garner increasing attention
• Plan sponsors will evolve how they monitor their recordkeepers since many will be giving fiduciary advice to participants
• Plan sponsors begin to consider managed accounts and other QDIA-eligible solutions beyond target date funds
NORTH
• Tighter labor markets cause plan sponsors to consider effectiveness of total retirement benefits
• Plan sponsors increasingly evaluate advice, wellness, and student loan repayment progress
• Beyond changes to defined contribution plans, more sponsors may add nonqualified and cash balance pension plans
• All eyes are on the potential for tax reform to impact individual and plan limits
• If corporate tax rates are lowered as expected, more corporations may add nonqualified deferred compensation plans as the cost of sponsoring them decreases
• Legislative support for open multiple employer plans (MEPs) may pave the way for new private-market solutions designed to improve coverage at work
WEST
• Utilization of passive investments to continue
• Expect more institutionally priced vehicles, such as collective investment trusts (CITs), to be used in qualified plans
• RFP and plan benchmarking activity may increase given the focus on fees in allegations
• Continuation of trend to externalize plan-related fees other than investment fees
• Expect more outsourcing of fiduciary responsibilities, including 3(38)
EAST
SOUTH
The DOL’s Fiduciary Rule
Future Policy Direction Litigation On the Rise
An Improving Economic Environment
• Favorable business conditions, rising rates, and rising PBGC premiums may lead to more pension risk transfers
• Increased need for precision with liability-driven investing strategies
Please visit captrustadvisors.com/discover to access articles, features, and updates for CAPTRUST’s institutional clients.
institutional marketplace — industry update
5
Investment Committee - Defined Contribution Plan - Quarterly Review
16

Period Ending 12.31.16 | Q4 ’16
CAPTRUST LAUNCHES PLAN DESIGN BENCHMARK This past summer, CAPTRUST began aggregating client data on a variety of defined contribution plan design features. Our goal was to construct a resource for clients to benchmark their plan designs and help them ensure their plans remain competitive with those of their peers. Information was collected on nearly 900 plans, making this one of the most diverse, independent data sets in the industry. We will continue to refresh data to provide ongoing benchmarks and updates on the retirement landscape.
Peer group benchmarks available include plan size, number of employees, industry, and plan type.
48%
29%
55%
40%
Percentage of plans offering immediate eligibility into
retirement plan
Percentage of plans allowing Roth contributions
Percentage of plans offering lump sums as the only form of distribution at retirement
Percentage of plans offering automatic enrollment
Did You Know?
899 Total Number of Plans
26 Total Retirement Plan Providers
20+ Plan Design Categories
20 Total Industries Represented
Source: CAPTRUST Research. Plan Design Benchmark 2016
defined contribution marketplace — industry update
6
Investment Committee - Defined Contribution Plan - Quarterly Review
17

Period Ending 12.31.16 | Q4 ’16
FIDUCIARY UPDATE Each quarter, CAPTRUST’s Drew McCorkle highlights court cases with ERISA retirement plan implications and provides an overview of regulatory and legislative updates impacting the retirement industry — most particularly plan sponsors and their participants. Below, we highlight a few of the notable items covered in this quarter’s Fiduciary Update.
CYBERSECURITY ISSUES IN THE RETIREMENT PLAN WORLD
Two recent cybersecurity breaches involving retirement plans highlight the importance of retirement plan fiduciaries understanding the controls and safeguards of their recordkeepers and asset custodians.
• One involved a municipality’s deferred compensation plan suffering $2.6 million of losses from fraudulent participant loans
• The other involved a union pension plan whose servers were hacked and received a ransom request, which fortunately they were able to ignore given rigorous data back-up protocols.
SELECT FEE AND RELATED LITIGATION DEVELOPMENTS
• Moreno v. Deutsche Bank Americas Holdings Corp (S.D. NY 2016) Participants in Deutsche Bank’s 401(k) plan alleged that plan fiduciaries improperly used Deutsche Bank’s own indexed funds rather than much less expensive Vanguard indexed funds. The court allowed the case to continue, saying that such a failure could be inferred from the facts if, “a superior alternative investment was readily apparent such that an adequate investigation would have uncovered that alternative.”
• Tibble v. Edison International (9th Cir 2016) Following the Supreme Court’s groundbreaking decision in this case in 2015, the court of appeals changed course to now allow plan participants to pursue their claims for damages resulting from plan fiduciaries’ failure to routinely monitor share classes of the investments offered in the plan.
• In Re Disney Litigation (C.D. CA 2016) The 401(k) fiduciary committee of Walt Disney Company was sued for including a mutual fund that suffered considerable underperformance attributable to a specific fund holding. The court dismissed the claim and noted that (a) underperformance of an investment alone does not support a claim for breach of fiduciary duty, (b) there was no allegation that the fiduciaries lacked a sufficient review process and, (c) plan fiduciaries have no duty to monitor the underlying investments in a mutual fund.
For access to the full version of this quarter’s Fiduciary Update, visit the Resources section of www.captrustadvisors.com.
LIFETIME INCOME IN QDIAs? “NO” … BUT THERE’S MORE
• In a recent Information Letter, the U.S. Department of Labor addressed the question of whether a Qualified Default Investment Alternative (“QDIA”) could include a particular annuity feature and retain its QDIA status. To qualify as a QDIA, participants must be permitted to transfer assets out of the QDIA no less frequently than once in any three-month period. The particular lifetime income feature reviewed by the DOL included liquidity restrictions longer than the required three-month limit. As a result, the lifetime income feature presented could not be included in an investment solution wishing to receive QDIA protection.
• In a related development, the DOL has included in its regulatory agenda a project to consider the inclusion of lifetime income options in QDIAs. This will begin with a request for information, which could be issued as soon as this spring.
Any case highlights contained here are provided for general information purposes only and do not, and are not intended to, constitute legal advice. You should contact your ERISA counsel to determine how the laws or cases discussed might apply to your plan(s), plan fiduciaries, and/or plan participants.
defined contribution marketplace — industry update
7
Investment Committee - Defined Contribution Plan - Quarterly Review
18
University of Maine System Defined Contribution Plan
Q4 16Period Ending 12.31.16 |section
SECTION 2: MARKET COMMENTARY AND REVIEW
Market Commentary…………………………………………………………………………………………………….
Market Review……………………………………………………………………………………………………………….
Asset Class Returns……………………………………………………………………………………………………..
Index Performance……………………………………………………………………………………………………….
2: market commentary and review
8
Investment Committee - Defined Contribution Plan - Quarterly Review
19

Period Ending 12.31.16 | Q4 ’16
Rising geopolitical risk and the lack of a global leader
• The U.S.’s shift to more unilateral
“America first” policies could negatively affect trade and hurt markets
• A number of events abroad, including European elections and congressional meetings in China, could bring uncertainty and volatility this year
HEADWINDS TAILWINDS
Surging business and consumer confidence
• Higher confidence encourages business spending, capital investment,
and jobs, which would be positive for consumer spending
• A large pickup in business and consumer confidence could unleash “animal spirits,” leading to an upside surprise
ECONOMIC OUTLOOK The global economic picture typically consists of favorable attributes (tailwinds) and challenges (headwinds). Here, we provide our perspective on both and offer our view on which side has the upper hand.
Overall, while the global economy has stabilized and may accelerate due to the prospect of a new policy direction in the U.S., we are mindful of new geopolitical risks. The economic landscape can fluctuate quickly, so we will update you with changes as they occur.
market commentary
Continued U.S. growth with potential positive economic policy changes on the way
• The U.S. economy is experiencing mid- to-late business cycle dynamics with low likelihood of a recession in the near term
• Lighter regulation and lower taxes could serve as a catalyst to extend the current business cycle
High expectations could lead to disappointment
• The market has entered the “show me” stage for campaign promises
and new policies this year
• Downside risks are present given very high market expectations should policies fail to materialize or underwhelm
Relative calm in the global economy
• China’s recent stabilization has reduced headwinds for the moment
as growth prospects continue
• The recession in commodity prices has ended, leading to a recovery in emerging markets
Potential for mid-cycle dynamics to shift to late-cycle too quickly
• An inflation pickup could lead to higher rates, a stronger dollar, and
higher oil prices that tighten financial conditions in the U.S.
• Tighter financial conditions discourage business and consumer spending and could lead to a slowdown in growth
9
Investment Committee - Defined Contribution Plan - Quarterly Review
20

Period Ending 12.31.16 | Q4 ’16
• Buoyed by an improving economy, U.S. stocks notched another quarterly gain, adding to their solid results for the year.
• International stocks slipped in the fourth quarter but eked out a small gain for the year.
• Emerging market stocks fell in the fourth quarter but kept pace with U.S. stocks in 2016 despite the headwinds of a strong U.S. dollar.
• Bonds fell in the fourth quarter as interest rates reached their highest levels in more than a year. They managed a small gain for 2016.
• Real estate slumped in the fourth quarter due to rising interest rates, but finished the year in positive territory.
• Commodities rose again last quarter and finished off a year of strong gains fueled by rising oil and gas prices.
-0.7%
-3.0% -3.1%
-4.1%
2.7%
3.8%
1.5%
2.7%
7.6%
11.6% 11.8% 12.0%
MARKETS CLOSE OUT A GOOD YEAR While the fourth quarter was mixed, all asset classes moved higher last year. In the end, 2016’s headline events and periodic choppiness masked slow-but-steady economic improvement that supported markets and produced solid results for the year.
Asset class returns are represented by the following indexes: U.S. large-cap stocks (S&P 500 Index), international stocks (MSCI EAFE Index), emerging market stocks (MSCI Emerging Markets Index), U.S. bonds (Bloomberg Barclays U.S. Aggregate Bond Index), commodities (Bloomberg Commodity Index), and real estate (Dow Jones U.S. Real Estate Index).
market commentary
Emerging Market Stocks Commodities
Real Estate
U.S. Stocks
International Stocks
U.S. Bonds
2016
Q4
2016
Q4
2016
Q4
2016
Q4
2016
Q4
2016
Q4
10
Investment Committee - Defined Contribution Plan - Quarterly Review
21

Period Ending 12.31.16 | Q4 ’16
FROM SECULAR TO CYCLICAL: RETURN OF THE BUSINESS CYCLE The global economy has been caught in a secular slowdown for the last eight years. Growth stagnated in the U.S. as the consumer paid back debt after years of excess leverage leading up to the financial crisis. As these secular forces abate, the U.S. economy moves toward a more normal state—one where the business cycle plays a more prominent role in portfolio strategy.
Source: CAPTRUST Research
market commentary
Business Cycle Phases
RECOVERY
The early phase of the cycle is characterized by a sharp recovery in economic activity with profits growing rapidly.
Credit returns with accommodative policy.
EXPANSION
As the market moves into the middle part of the business cycle, it enters the expansion phase, where growth peaks as credit growth continues.
The late stage of expansion is marked by the emergence of inflation as growth levels off, with tightening credit conditions and rising wages.
CONTRACTION
Recession marks the contraction period as economic activity falls, profits decline, and credit dries up.
Positive Economic Growth
Negative Economic Growth
China & Japan
Germany
U.K.
U.S.
11
Investment Committee - Defined Contribution Plan - Quarterly Review
22

Period Ending 12.31.16 | Q4 ’16
2003 2004 2005 2006 2007 2008 2009 2010 2011 2012 2013 2014 2015 2016
Small-Cap Growth 48.54%
Mid-Cap Value
23.70%
International Equities 14.02%
International Equities 26.86%
Large-Cap Growth 11.81%
Fixed Income 5.08%
Mid-Cap Growth 46.29%
Small-Cap Growth 29.09%
Fixed Income 7.84%
Mid-Cap Value 18.51%
Small-Cap Growth 43.30%
Mid-Cap Value
14.75%
Large-Cap Growth 5.67%
Small-Cap Value 31.74%
Small-Cap Value
46.03%
Small-Cap Value
22.25%
Mid-Cap Value
12.65%
Small-Cap Value
23.48%
International Equities 11.63%
Cash 1.51%
Large-Cap Growth 37.21%
Mid-Cap Growth 26.38%
Large-Cap Growth 2.64%
Small-Cap Value
18.05%
Mid-Cap Growth 35.74%
Large-Cap Value
13.45%
Fixed Income 0.55%
Mid-Cap Value
20.00%
Mid-Cap Growth 42.71%
International Equities 20.70%
Mid-Cap Growth 12.10%
Large-Cap Value
22.25%
Mid-Cap Growth 11.43%
Small-Cap Value
-28.91%
Small-Cap Growth 34.47%
Mid-Cap Value
24.75%
Large-Cap Value 0.39%
International Equities 17.90%
Small-Cap Value
34.52%
Large-Cap Growth 13.05%
Cash 0.05%
Large-Cap Value 17.34%
International Equities 39.17%
Large-Cap Value
16.49%
Large-Cap Value 7.05%
Mid-Cap Value
20.22%
Fixed Income 7.39%
Large-Cap Value
-36.85%
Mid-Cap Value
34.21%
Small-Cap Value
24.50%
Cash 0.10%
Large-Cap Value 17.51%
Large-Cap Growth 33.48%
Mid-Cap Growth 11.90%
Mid-Cap Growth -0.20%
Small-Cap Growth 11.32%
Mid-Cap Value
38.07%
Mid-Cap Growth 15.48%
Large-Cap Growth 5.26%
Small-Cap Growth 13.35%
Small-Cap Growth 7.05%
Mid-Cap Value
-38.44%
International Equities 32.46%
Large-Cap Growth 16.71%
Mid-Cap Value -1.38%
Mid-Cap Growth 15.81%
Mid-Cap Value
33.46%
Fixed Income 5.97%
International Equities -0.39%
Mid-Cap Growth 7.33%
Large-Cap Value
30.03%
Small-Cap Growth 14.31%
Small-Cap Value 4.71%
Mid-Cap Growth 10.66%
Cash 4.71%
Large-Cap Growth -38.44%
Small-Cap Value
20.58%
Large-Cap Value 15.51%
Mid-Cap Growth -1.65%
Large-Cap Growth 15.26%
Large-Cap Value
32.53%
Small-Cap Growth 5.60%
Small-Cap Growth -1.38%
Large-Cap Growth 7.08%
Large-Cap Growth 29.75%
Large-Cap Growth 6.30%
Small-Cap Growth 4.15%
Large-Cap Growth 9.07%
Large-Cap Value -0.17%
Small-Cap Growth -38.54%
Large-Cap Value
19.69%
International Equities
8.21%
Small-Cap Growth -2.91%
Small-Cap Growth 14.59%
International Equities 23.29%
Small-Cap Value 4.22%
Large-Cap Value
-3.83%
Fixed Income 2.65%
Fixed Income 4.31%
Fixed Income 3.04%
Cash 3.35%
Cash 5.08%
Mid-Cap Value -1.42%
International Equities -43.06%
Fixed Income 5.24%
Fixed Income 5.98%
Small-Cap Value
-5.50%
Fixed Income 4.22%
Cash 0.07%
Cash 0.03%
Mid-Cap Value
-4.78%
International Equities
1.51%
Cash 1.05%
Cash 1.44%
Fixed Income 1.58%
Fixed Income 4.08%
Small-Cap Value
-9.78%
Mid-Cap Growth -44.32%
Cash 0.21%
Cash 0.13%
International Equities -11.73%
Cash 0.11%
Fixed Income -2.02%
International Equities -4.48%
Small-Cap Value -7.47%
Cash 0.33%
Sour
ce: M
arkovProcesses,Inc.,B
loom
berg,M
obius
The information contained in the report is from sources believed to be reliable, but not warranted by CAPTRUST Financial Advisors to be accurate or complete.
asset class returns
Small-Cap Value Stocks (Russell 2000 Value) Large-Cap Value Stocks (Russell 1000 Value) International Equities (MSCI EAFE)
Small-Cap Growth Stocks (Russell 2000 Growth) Mid-Cap Growth Stocks (Russell Mid-Cap Growth Index) Fixed Income (Bloomberg Barclays U.S. Aggregate Bond Index)
Large-Cap Growth Stocks (Russell 1000 Growth) Mid-Cap Value Stocks (Russell Mid-Cap Value Index) Cash (Merrill Lynch 3-Month Treasury Bill)
12
Investment Committee - Defined Contribution Plan - Quarterly Review
23

Period Ending 12.31.16 | Q4 ’16
INDICES Q4 2016 YTD 2016 2015 2014 2013 2012 2011 1 YEAR 3 YEAR 5 YEAR 10 YEAR
S&P 500 3.82% 11.96% 1.38% 13.69% 32.39% 16.00% 2.11% 11.96% 8.87% 14.66% 6.95%
Dow Jones Industrial Average 8.66% 16.50% 0.21% 10.04% 29.65% 10.24% 8.38% 16.50% 8.71% 12.92% 7.52%
NASDAQ Composite 1.34% 7.50% 5.73% 13.40% 38.32% 15.91% -1.80% 7.50% 8.83% 15.62% 8.34%
Russell 1000 3.83% 12.05% 0.92% 13.24% 33.11% 16.42% 1.50% 12.05% 8.59% 14.69% 7.08%
Russell 1000 Growth 1.01% 7.08% 5.67% 13.05% 33.48% 15.26% 2.64% 7.08% 8.55% 14.50% 8.33%
Russell 1000 Value 6.68% 17.34% -3.83% 13.45% 32.53% 17.51% 0.39% 17.34% 8.59% 14.80% 5.72%
Russell Mid Cap Index 3.21% 13.80% -2.44% 13.22% 34.76% 17.28% -1.55% 13.80% 7.92% 14.72% 7.86%
Russell 2000 8.83% 21.31% -4.41% 4.89% 38.82% 16.35% -4.18% 21.31% 6.74% 14.46% 7.07%
Russell 2000 Growth 3.57% 11.32% -1.38% 5.60% 43.30% 14.59% -2.91% 11.32% 5.05% 13.74% 7.76%
Russell 2000 Value 14.07% 31.74% -7.47% 4.22% 34.52% 18.05% -5.50% 31.74% 8.31% 15.07% 6.26%
MSCI Europe, Australia, Far East -0.68% 1.51% -0.39% -4.48% 23.29% 17.90% -11.73% 1.51% -1.15% 7.02% 1.22%
Dow Jones US Real Estate Index -3.11% 7.56% 2.14% 27.24% 1.77% 18.93% 6.05% 7.56% 11.81% 11.09% 3.87%
Bloomberg Barclays Govt Intermediate Bond -2.18% 1.05% 1.18% 2.52% -1.25% 1.73% 6.08% 1.05% 1.58% 1.04% 3.42%
Bloomberg Barclays Corporate IG Bond -2.83% 6.11% -0.68% 7.46% -1.53% 9.82% 8.15% 6.11% 4.23% 4.14% 5.47%
Bloomberg Barclays U.S. Aggregate Bond -2.98% 2.65% 0.55% 5.97% -2.02% 4.22% 7.84% 2.65% 3.03% 2.23% 4.34%
Bloomberg Barclays Intermediate Govt/Credit -2.07% 2.08% 1.07% 3.13% -0.86% 3.89% 5.80% 2.08% 2.09% 1.85% 3.84%
Bloomberg Barclays High Yield 1.75% 17.13% -4.47% 2.45% 7.44% 15.81% 4.98% 17.13% 4.66% 7.36% 7.45%
90-Day US Treasury 0.09% 0.33% 0.05% 0.03% 0.07% 0.11% 0.10% 0.33% 0.14% 0.12% 0.80%
Consumer Price Index (Inflation) 0.05% 2.12% 0.73% 0.76% 1.50% 1.74% 2.96% 2.12% 1.20% 1.37% 1.81%
Manager Universe Q4 2016 YTD 2016 2015 2014 2013 2012 2011 1 YEAR 3 YEAR 5 YEAR 10 YEAR
Average Large-Cap Growth Fund -0.30% 3.17% 3.72% 10.06% 34.39% 15.29% -2.24% 3.17% 5.72% 12.97% 6.94%
Average Large-Cap Blend Fund 3.87% 10.28% -0.88% 11.26% 31.78% 15.08% -0.67% 10.28% 6.79% 13.17% 6.14%
Average Large-Cap Value Fund 6.36% 14.70% -4.05% 10.44% 31.61% 14.70% -0.57% 14.70% 6.81% 13.02% 5.50%
Average Mid-Cap Blend Fund 5.31% 14.17% -4.23% 8.74% 34.06% 16.38% -3.48% 14.17% 5.98% 13.33% 6.83%
Average Small-Cap Value Fund 12.12% 25.68% -6.61% 3.47% 35.90% 16.06% -4.51% 25.68% 6.63% 14.02% 6.86%
Average Small-Cap Blend Fund 9.45% 20.66% -5.19% 4.10% 37.54% 15.30% -3.87% 20.66% 6.00% 13.64% 6.84%
Average Small-Cap Growth Fund 3.35% 11.25% -2.41% 2.56% 41.22% 13.51% -3.28% 11.25% 3.59% 12.29% 7.18%
Average Foreign Fund -2.97% 0.81% -1.15% -4.73% 19.12% 18.03% -13.98% 0.81% -1.81% 5.93% 0.90%
Average Emerging Market Fund -5.41% 8.29% -13.75% -2.78% 0.30% 18.93% -19.52% 8.29% -3.07% 1.83% 1.40%
Average Allocation — 30% to 50% -0.19% 6.59% -2.47% 4.26% 9.12% 10.18% 1.45% 6.59% 2.86% 5.68% 4.26%
Average Allocation — 50% to 70% 1.02% 7.35% -1.83% 6.32% 16.87% 11.93% -0.14% 7.35% 3.89% 8.05% 4.95%
Average Fixed Income Fund -2.04% 3.61% -0.13% 5.25% -0.96% 7.72% 6.35% 3.61% 2.86% 3.05% 3.84%
Average High Yield Bond Fund 1.69% 13.32% -4.07% 1.16% 7.05% 14.76% 2.88% 13.32% 3.27% 6.24% 6.01%
Average Real Estate Fund -2.63% 6.53% 2.41% 28.26% 1.80% 17.57% 7.60% 6.53% 11.78% 10.89% 4.34%
Average Aggressive Growth Fund 0.55% 5.60% 0.14% 6.91% 30.85% 14.24% -5.21% 5.60% 4.11% 11.24% 5.67%
The opinions expressed in this report are subject to change without notice. This material has been prepared or is distributed solely for informational purposes and is not a solicitation or an offer to buy any security or to participate in any investment strategy. The performance data quoted represents past performance and does not guarantee future results. Index averages are provided for comparison purposes only. The information and statistics in this report are from sources believed to be reliable but are not guaranteed to be accurate or complete. CAPTRUST Financial Advisors is an investment adviser registered under the Investment Advisers Act of 1940. Sources: Morningstar Direct, MPI
index performance
13
Investment Committee - Defined Contribution Plan - Quarterly Review
24

University of Maine System Defined Contribution Plan
Q4 16Period Ending 12.31.16 |section
SECTION 3: PLAN INVESTMENT REVIEW
Plan Investment Menu Review…………………………………………………………………………………….
Plan Assets………………..…………………………………………………………………………………………………….
Investment Policy Monitor…………………………………………………………………………………………..
Investment Review Select Commentary…………………………………………………………………..
Investment Performance Summary……………………………………………………………………………
Plan Performance Measurement..……………………………………………………………………………….
3: plan investment review
14
Investment Committee - Defined Contribution Plan - Quarterly Review
25
University of Maine System Defined Contribution Plan
Q4 16Period Ending 12.31.16 |E
XP
EC
TED
RE
TUR
N
EXPECTED RISK
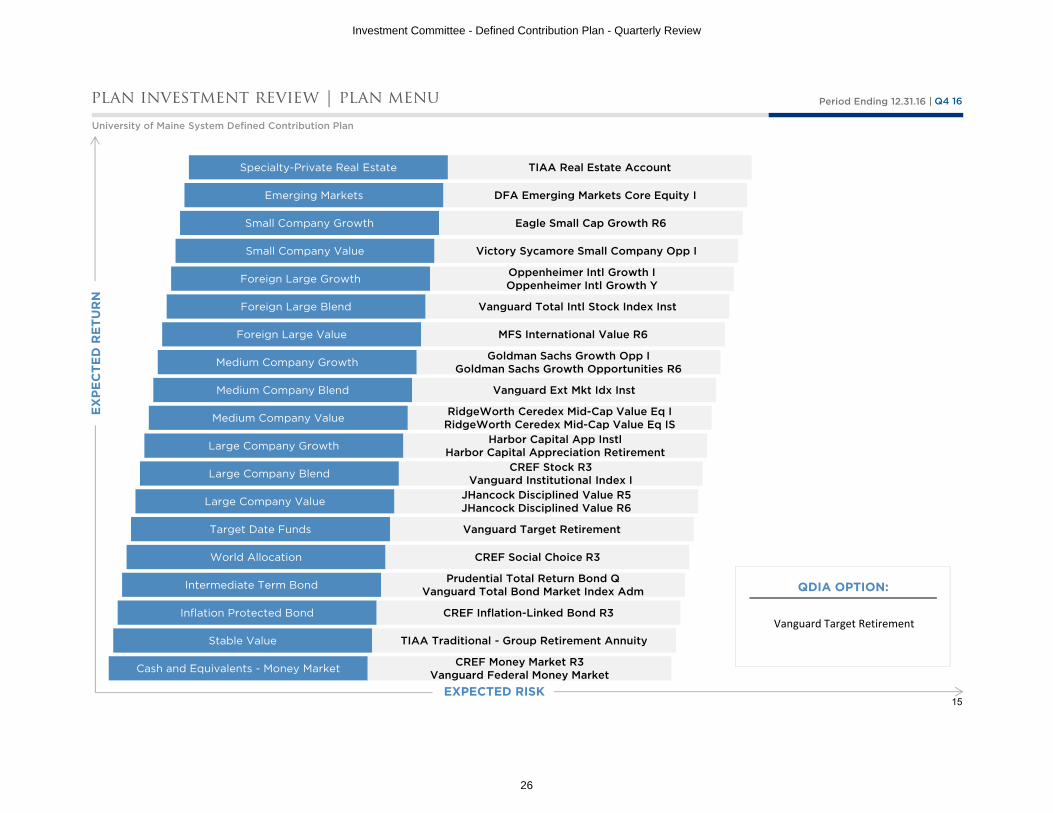
QDIA OPTION:
Vanguard Target Retirement
plan investment review | plan menu
Cash and Equivalents - Money Market CREF Money Market R3Vanguard Federal Money Market
Stable Value TIAA Traditional - Group Retirement Annuity
Inflation Protected Bond CREF Inflation-Linked Bond R3
Intermediate Term Bond Prudential Total Return Bond QVanguard Total Bond Market Index Adm
World Allocation CREF Social Choice R3
Target Date Funds Vanguard Target Retirement
Large Company Value JHancock Disciplined Value R5JHancock Disciplined Value R6
Large Company Blend CREF Stock R3Vanguard Institutional Index I
Large Company Growth Harbor Capital App InstlHarbor Capital Appreciation Retirement
Medium Company Value RidgeWorth Ceredex Mid-Cap Value Eq IRidgeWorth Ceredex Mid-Cap Value Eq IS
Medium Company Blend Vanguard Ext Mkt Idx Inst
Medium Company Growth Goldman Sachs Growth Opp IGoldman Sachs Growth Opportunities R6
Foreign Large Value MFS International Value R6
Foreign Large Blend Vanguard Total Intl Stock Index Inst
Foreign Large Growth Oppenheimer Intl Growth IOppenheimer Intl Growth Y
Small Company Value Victory Sycamore Small Company Opp I
Small Company Growth Eagle Small Cap Growth R6
Emerging Markets DFA Emerging Markets Core Equity I
Specialty-Private Real Estate TIAA Real Estate Account
15
Investment Committee - Defined Contribution Plan - Quarterly Review
26
University of Maine System Defined Contribution Plan
Q4 16Period Ending 12.31.16 |plan investment review | executive asset summary
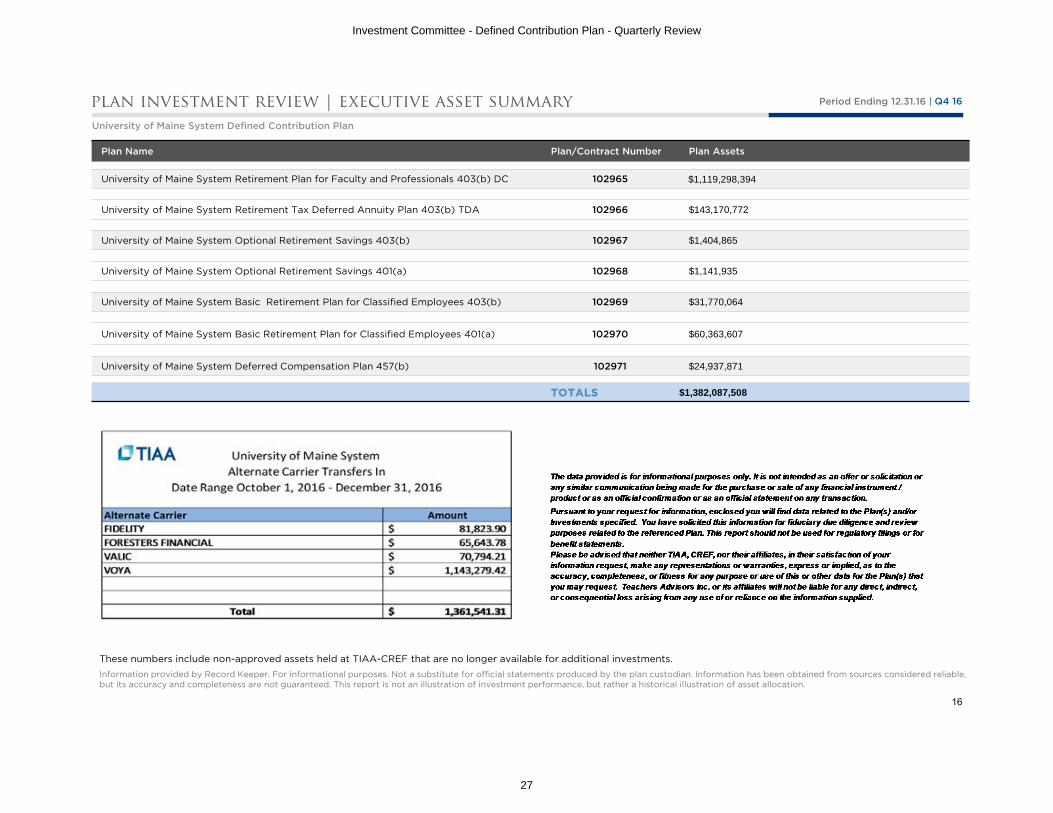
These numbers include non-approved assets held at TIAA-CREF that are no longer available for additional investments.
Information provided by Record Keeper. For informational purposes. Not a substitute for official statements produced by the plan custodian. Information has been obtained from sources considered reliable, but its accuracy and completeness are not guaranteed. This report is not an illustration of investment performance, but rather a historical illustration of asset allocation.
Plan Name Plan/Contract Number Plan Assets
University of Maine System Retirement Plan for Faculty and Professionals 403(b) DC 102965 $1,119,298,394
University of Maine System Retirement Tax Deferred Annuity Plan 403(b) TDA 102966 $143,170,772
University of Maine System Optional Retirement Savings 403(b) 102967 $1,404,865
University of Maine System Optional Retirement Savings 401(a) 102968 $1,141,935
University of Maine System Basic Retirement Plan for Classified Employees 403(b) 102969 $31,770,064
University of Maine System Basic Retirement Plan for Classified Employees 401(a) 102970 $60,363,607
University of Maine System Deferred Compensation Plan 457(b) 102971 $24,937,871
TOTALS $1,382,087,508
16
Investment Committee - Defined Contribution Plan - Quarterly Review
27

Q4 16Period Ending 12.31.16 |plan investment review | asset summary
Information provided by Record Keeper. For informational purposes. Not a substitute for official statements produced by the plan custodian. Information has been obtained from sources considered reliable, but its accuracy and completeness are not guaranteed. This report is not an illustration of investment performance, but rather a historical illustration of asset allocation.
FUND OPTION CURRENT INVESTMENT NAME 12.31.2015 (%) CURRENT (%)
Cash and Equivalents - Money Market CREF Money Market R3 $14,164,451 1.31% $14,999,372 1.34%
Cash and Equivalents - Money Market Vanguard Federal Money Market - - $267,386 0.02%
Stable Value TIAA Traditional - Group Retirement Annuity $428,498,685 39.66% $432,193,984 38.61%
Inflation Protected Bond CREF Inflation-Linked Bond R3 $13,297,121 1.23% $13,858,063 1.24%
Intermediate Term Bond Prudential Total Return Bond Q $11,734,829 1.09% $14,149,830 1.26%
Intermediate Term Bond Vanguard Total Bond Market Index Adm $1,341,165 0.12% $2,605,204 0.23%
World Allocation CREF Social Choice R3 $33,715,372 3.12% $33,960,321 3.03%
Target Date Ret Income Moderate Vanguard Target Retirement Income Inv $2,962,737 0.27% $3,233,146 0.29%
Target Date 2000-2010 Conservative Vanguard Target Retirement 2010 Inv $3,021,249 0.28% $3,431,930 0.31%
Target Date 2015 Moderate Vanguard Target Retirement 2015 Inv $2,069,999 0.19% $3,060,581 0.27%
Target Date 2020 Moderate Vanguard Target Retirement 2020 Inv $5,715,861 0.53% $7,725,120 0.69%
Target Date 2025 Moderate Vanguard Target Retirement 2025 Inv $4,008,839 0.37% $6,639,122 0.59%
Target Date 2030 Conservative Vanguard Target Retirement 2030 Inv $4,003,842 0.37% $7,033,469 0.63%
Target Date 2035 Moderate Vanguard Target Retirement 2035 Inv $4,939,620 0.46% $6,800,551 0.61%
Target Date 2040 Moderate Vanguard Target Retirement 2040 Inv $3,944,074 0.37% $6,019,280 0.54%
Target Date 2045 Moderate Vanguard Target Retirement 2045 Inv $2,744,257 0.25% $4,515,289 0.40%
Target Date 2050 Moderate Vanguard Target Retirement 2050 Inv $1,141,973 0.11% $2,424,692 0.22%
Target Date 2055 Moderate Vanguard Target Retirement 2055 Inv $275,838 0.03% $835,696 0.07%
MARKET VALUE
CONTINUED…
University of Maine System Retirement Plan for Faculty and Professionals 403(b) DC - 102965
17
Investment Committee - Defined Contribution Plan - Quarterly Review
28

Q4 16Period Ending 12.31.16 |plan investment review | asset summary
Information provided by Record Keeper. For informational purposes. Not a substitute for official statements produced by the plan custodian. Information has been obtained from sources considered reliable, but its accuracy and completeness are not guaranteed. This report is not an illustration of investment performance, but rather a historical illustration of asset allocation.
FUND OPTION CURRENT INVESTMENT NAME 12.31.2015 (%) CURRENT (%)
Target Date 2060+ Moderate Vanguard Target Retirement 2060 Inv $41,846 0.00% $67,116 0.01%
Large Company Value JHancock Disciplined Value R5 $16,119,879 1.49% $14,181,918 1.27%
Large Company Value JHancock Disciplined Value R6 - - $3,588,201 0.32%
Large Company Blend CREF Stock R3 $186,157,735 17.23% $185,975,795 16.62%
Large Company Blend Vanguard Institutional Index I $13,125,755 1.21% $22,199,733 1.98%
Large Company Growth Harbor Capital App Instl $11,422,526 1.06% $8,118,755 0.73%
Large Company Growth Harbor Capital Appreciation Retirement - - $651,546 0.06%
Medium Company Value RidgeWorth Ceredex Mid-Cap Value Eq I $6,378,117 0.59% $8,616,407 0.77%
Medium Company Value RidgeWorth Ceredex Mid-Cap Value Eq IS - - $3,180,903 0.28%
Medium Company Blend Vanguard Ext Mkt Idx Inst $8,347,446 0.77% $10,689,096 0.95%
Medium Company Growth Goldman Sachs Growth Opp I $4,065,570 0.38% $4,228,630 0.38%
Medium Company Growth Goldman Sachs Growth Opportunities R6 - - $135,252 0.01%
Foreign Large Value MFS International Value R6 $13,007,295 1.20% $13,142,498 1.17%
Foreign Large Blend Vanguard Total Intl Stock Index Inst $5,586,012 0.52% $7,724,284 0.69%
Foreign Large Growth Oppenheimer Intl Growth I - - $269,188 0.02%
Foreign Large Growth Oppenheimer Intl Growth Y $3,521,204 0.33% $3,897,730 0.35%
Small Company Value Victory Sycamore Small Company Opp I $3,359,711 0.31% $9,044,450 0.81%
Small Company Growth Eagle Small Cap Growth R6 $2,447,719 0.23% $2,178,964 0.19%
MARKET VALUE
CONTINUED…
University of Maine System Retirement Plan for Faculty and Professionals 403(b) DC - 102965
18
Investment Committee - Defined Contribution Plan - Quarterly Review
29

Q4 16Period Ending 12.31.16 |plan investment review | asset summary
Information provided by Record Keeper. For informational purposes. Not a substitute for official statements produced by the plan custodian. Information has been obtained from sources considered reliable, but its accuracy and completeness are not guaranteed. This report is not an illustration of investment performance, but rather a historical illustration of asset allocation.
FUND OPTION CURRENT INVESTMENT NAME 12.31.2015 (%) CURRENT (%)
Emerging Markets DFA Emerging Markets Core Equity I $8,612,652 0.80% $13,477,365 1.20%
Specialty-Private Real Estate TIAA Real Estate Account $47,006,311 4.35% $49,860,728 4.45%
Other Assets Non Approved Funds $157,517,469 14.58% $145,269,885 12.98%
Self-Directed Brokerage Self Directed Accounts $56,047,085 5.19% $49,046,914 4.38%
TOTALS $1,080,344,244 100% $1,119,298,394 100%
MARKET VALUE
University of Maine System Retirement Plan for Faculty and Professionals 403(b) DC - 102965
19
Investment Committee - Defined Contribution Plan - Quarterly Review
30

Q4 16Period Ending 12.31.16 |plan investment review | asset summary
Information provided by Record Keeper. For informational purposes. Not a substitute for official statements produced by the plan custodian. Information has been obtained from sources considered reliable, but its accuracy and completeness are not guaranteed. This report is not an illustration of investment performance, but rather a historical illustration of asset allocation.
FUND OPTION CURRENT INVESTMENT NAME 12.31.2015 (%) CURRENT (%)
Cash and Equivalents - Money Market CREF Money Market R3 $1,270,916 0.99% $1,452,371 1.01%
Cash and Equivalents - Money Market Vanguard Federal Money Market - - $0 0.00%
Stable Value TIAA Traditional - Group Retirement Annuity $46,020,840 36.00% $52,780,394 36.87%
Inflation Protected Bond CREF Inflation-Linked Bond R3 $2,621,377 2.05% $2,479,783 1.73%
Intermediate Term Bond Prudential Total Return Bond Q $2,534,566 1.98% $3,422,343 2.39%
Intermediate Term Bond Vanguard Total Bond Market Index Adm $165,607 0.13% $603,906 0.42%
World Allocation CREF Social Choice R3 $5,196,488 4.07% $5,200,416 3.63%
Target Date Ret Income Moderate Vanguard Target Retirement Income Inv $461,034 0.36% $1,020,550 0.71%
Target Date 2000-2010 Conservative Vanguard Target Retirement 2010 Inv $346,834 0.27% $429,313 0.30%
Target Date 2015 Moderate Vanguard Target Retirement 2015 Inv $342,880 0.27% $761,117 0.53%
Target Date 2020 Moderate Vanguard Target Retirement 2020 Inv $774,231 0.61% $2,149,700 1.50%
Target Date 2025 Moderate Vanguard Target Retirement 2025 Inv $1,256,795 0.98% $1,964,333 1.37%
Target Date 2030 Conservative Vanguard Target Retirement 2030 Inv $660,816 0.52% $1,297,923 0.91%
Target Date 2035 Moderate Vanguard Target Retirement 2035 Inv $571,733 0.45% $897,317 0.63%
Target Date 2040 Moderate Vanguard Target Retirement 2040 Inv $258,731 0.20% $487,981 0.34%
Target Date 2045 Moderate Vanguard Target Retirement 2045 Inv $308,566 0.24% $192,167 0.13%
Target Date 2050 Moderate Vanguard Target Retirement 2050 Inv $26,113 0.02% $72,627 0.05%
Target Date 2055 Moderate Vanguard Target Retirement 2055 Inv $4,286 0.00% $60,979 0.04%
MARKET VALUE
CONTINUED…
University of Maine System Retirement Tax Deferred Annuity Plan 403(b) TDA- 102966
20
Investment Committee - Defined Contribution Plan - Quarterly Review
31

Q4 16Period Ending 12.31.16 |plan investment review | asset summary
Information provided by Record Keeper. For informational purposes. Not a substitute for official statements produced by the plan custodian. Information has been obtained from sources considered reliable, but its accuracy and completeness are not guaranteed. This report is not an illustration of investment performance, but rather a historical illustration of asset allocation.
FUND OPTION CURRENT INVESTMENT NAME 12.31.2015 (%) CURRENT (%)
Target Date 2060+ Moderate Vanguard Target Retirement 2060 Inv $7,494 0.01% $2,819 0.00%
Large Company Value JHancock Disciplined Value R5 $1,884,375 1.47% $1,620,296 1.13%
Large Company Value JHancock Disciplined Value R6 - - $323,047 0.23%
Large Company Blend CREF Stock R3 $18,003,922 14.09% $17,793,531 12.43%
Large Company Blend Vanguard Institutional Index I $3,587,169 2.81% $5,625,224 3.93%
Large Company Growth Harbor Capital App Instl $1,521,247 1.19% $1,141,107 0.80%
Large Company Growth Harbor Capital Appreciation Retirement - - $26,628 0.02%
Medium Company Value RidgeWorth Ceredex Mid-Cap Value Eq I $591,428 0.46% $890,804 0.62%
Medium Company Value RidgeWorth Ceredex Mid-Cap Value Eq IS - - $243,490 0.17%
Medium Company Blend Vanguard Ext Mkt Idx Inst $1,327,722 1.04% $1,497,045 1.05%
Medium Company Growth Goldman Sachs Growth Opp I $521,678 0.41% $368,615 0.26%
Medium Company Growth Goldman Sachs Growth Opportunities R6 - - $820 0.00%
Foreign Large Value MFS International Value R6 $1,537,785 1.20% $1,745,873 1.22%
Foreign Large Blend Vanguard Total Intl Stock Index Inst $1,044,930 0.82% $1,275,052 0.89%
Foreign Large Growth Oppenheimer Intl Growth I - - $24,765 0.02%
Foreign Large Growth Oppenheimer Intl Growth Y $417,912 0.33% $502,139 0.35%
Small Company Value Victory Sycamore Small Company Opp I $672,707 0.53% $1,395,946 0.98%
Small Company Growth Eagle Small Cap Growth R6 $138,214 0.11% $109,887 0.08%
MARKET VALUE
CONTINUED…
University of Maine System Retirement Tax Deferred Annuity Plan 403(b) TDA- 102966
21
Investment Committee - Defined Contribution Plan - Quarterly Review
32
Q4 16Period Ending 12.31.16 |plan investment review | asset summary
Information provided by Record Keeper. For informational purposes. Not a substitute for official statements produced by the plan custodian. Information has been obtained from sources considered reliable, but its accuracy and completeness are not guaranteed. This report is not an illustration of investment performance, but rather a historical illustration of asset allocation.
FUND OPTION CURRENT INVESTMENT NAME 12.31.2015 (%) CURRENT (%)
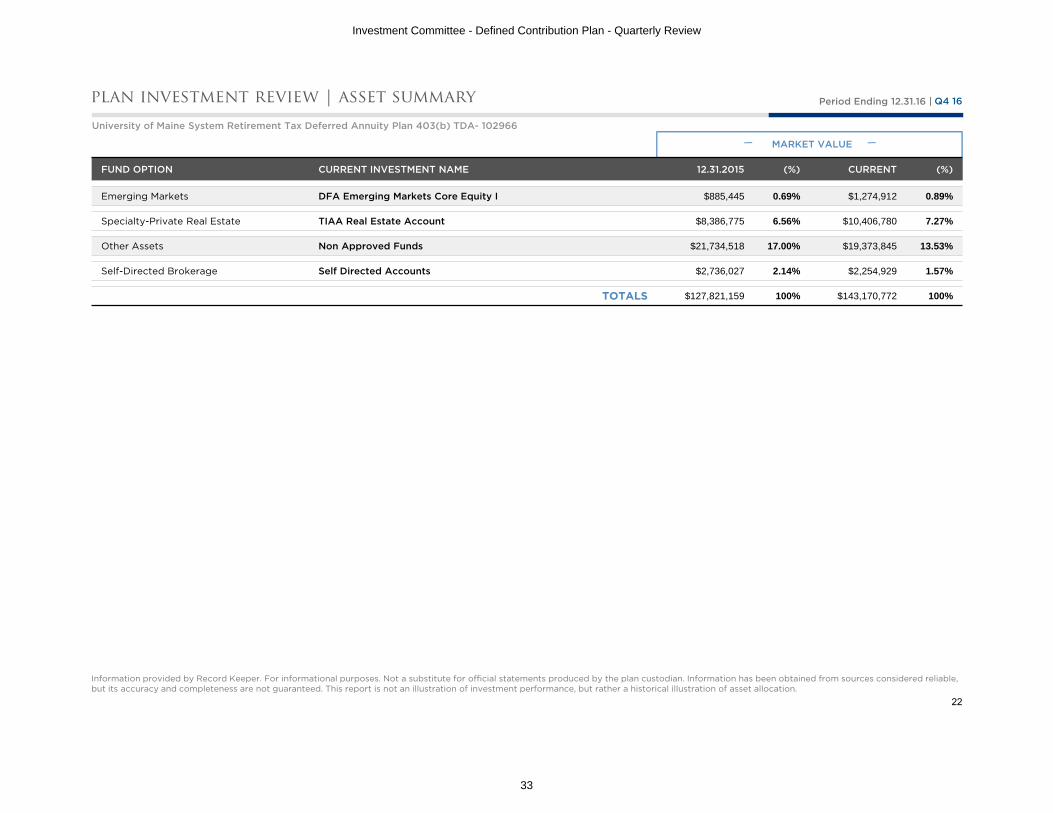
Emerging Markets DFA Emerging Markets Core Equity I $885,445 0.69% $1,274,912 0.89%
Specialty-Private Real Estate TIAA Real Estate Account $8,386,775 6.56% $10,406,780 7.27%
Other Assets Non Approved Funds $21,734,518 17.00% $19,373,845 13.53%
Self-Directed Brokerage Self Directed Accounts $2,736,027 2.14% $2,254,929 1.57%
TOTALS $127,821,159 100% $143,170,772 100%
MARKET VALUE
University of Maine System Retirement Tax Deferred Annuity Plan 403(b) TDA- 102966
22
Investment Committee - Defined Contribution Plan - Quarterly Review
33

Q4 16Period Ending 12.31.16 |plan investment review | asset summary
Information provided by Record Keeper. For informational purposes. Not a substitute for official statements produced by the plan custodian. Information has been obtained from sources considered reliable, but its accuracy and completeness are not guaranteed. This report is not an illustration of investment performance, but rather a historical illustration of asset allocation.
FUND OPTION CURRENT INVESTMENT NAME 12.31.2015 (%) CURRENT (%)
Cash and Equivalents - Money Market CREF Money Market R3 $9,722 0.66% $9,271 0.66%
Cash and Equivalents - Money Market Vanguard Federal Money Market - - $0 0.00%
Stable Value TIAA Traditional - Group Retirement Annuity $670,312 45.78% $619,822 44.12%
Inflation Protected Bond CREF Inflation-Linked Bond R3 $31,109 2.12% $32,113 2.29%
Intermediate Term Bond Prudential Total Return Bond Q $2,246 0.15% $2,934 0.21%
Intermediate Term Bond Vanguard Total Bond Market Index Adm $0 0.00% $251 0.02%
World Allocation CREF Social Choice R3 $37,036 2.53% $37,727 2.69%
Target Date Ret Income Moderate Vanguard Target Retirement Income Inv $972 0.07% $1,011 0.07%
Target Date 2000-2010 Conservative Vanguard Target Retirement 2010 Inv $1,528 0.10% $254 0.02%
Target Date 2015 Moderate Vanguard Target Retirement 2015 Inv $135 0.01% $143 0.01%
Target Date 2020 Moderate Vanguard Target Retirement 2020 Inv $35,915 2.45% $46,905 3.34%
Target Date 2025 Moderate Vanguard Target Retirement 2025 Inv $1,877 0.13% $2,017 0.14%
Target Date 2030 Conservative Vanguard Target Retirement 2030 Inv $0 0.00% $0 0.00%
Target Date 2035 Moderate Vanguard Target Retirement 2035 Inv $0 0.00% $0 0.00%
Target Date 2040 Moderate Vanguard Target Retirement 2040 Inv $0 0.00% $0 0.00%
Target Date 2045 Moderate Vanguard Target Retirement 2045 Inv $0 0.00% $0 0.00%
Target Date 2050 Moderate Vanguard Target Retirement 2050 Inv $0 0.00% $0 0.00%
Target Date 2055 Moderate Vanguard Target Retirement 2055 Inv $0 0.00% $0 0.00%
MARKET VALUE
CONTINUED…
University of Maine System Optional Retirement Savings 403(b) - 102967
23
Investment Committee - Defined Contribution Plan - Quarterly Review
34

Q4 16Period Ending 12.31.16 |plan investment review | asset summary
Information provided by Record Keeper. For informational purposes. Not a substitute for official statements produced by the plan custodian. Information has been obtained from sources considered reliable, but its accuracy and completeness are not guaranteed. This report is not an illustration of investment performance, but rather a historical illustration of asset allocation.
FUND OPTION CURRENT INVESTMENT NAME 12.31.2015 (%) CURRENT (%)
Target Date 2060+ Moderate Vanguard Target Retirement 2060 Inv $0 0.00% $0 0.00%
Large Company Value JHancock Disciplined Value R5 $1,853 0.13% $1,605 0.11%
Large Company Value JHancock Disciplined Value R6 - - $0 0.00%
Large Company Blend CREF Stock R3 $203,537 13.90% $212,794 15.15%
Large Company Blend Vanguard Institutional Index I $2,992 0.20% $4,677 0.33%
Large Company Growth Harbor Capital App Instl $1,506 0.10% $741 0.05%
Large Company Growth Harbor Capital Appreciation Retirement - - $0 0.00%
Medium Company Value RidgeWorth Ceredex Mid-Cap Value Eq I $1,607 0.11% $1,436 0.10%
Medium Company Value RidgeWorth Ceredex Mid-Cap Value Eq IS - - $50 0.00%
Medium Company Blend Vanguard Ext Mkt Idx Inst $1,522 0.10% $1,724 0.12%
Medium Company Growth Goldman Sachs Growth Opp I $245 0.02% $39 0.00%
Medium Company Growth Goldman Sachs Growth Opportunities R6 - - $0 0.00%
Foreign Large Value MFS International Value R6 $2,390 0.16% $2,304 0.16%
Foreign Large Blend Vanguard Total Intl Stock Index Inst $1,194 0.08% $1,197 0.09%
Foreign Large Growth Oppenheimer Intl Growth I - - $51 0.00%
Foreign Large Growth Oppenheimer Intl Growth Y $441 0.03% $509 0.04%
Small Company Value Victory Sycamore Small Company Opp I $546 0.04% $1,162 0.08%
Small Company Growth Eagle Small Cap Growth R6 $389 0.03% $221 0.02%
MARKET VALUE
CONTINUED…
University of Maine System Optional Retirement Savings 403(b) - 102967
24
Investment Committee - Defined Contribution Plan - Quarterly Review
35

Q4 16Period Ending 12.31.16 |plan investment review | asset summary
Information provided by Record Keeper. For informational purposes. Not a substitute for official statements produced by the plan custodian. Information has been obtained from sources considered reliable, but its accuracy and completeness are not guaranteed. This report is not an illustration of investment performance, but rather a historical illustration of asset allocation.
FUND OPTION CURRENT INVESTMENT NAME 12.31.2015 (%) CURRENT (%)
Emerging Markets DFA Emerging Markets Core Equity I $833 0.06% $1,202 0.09%
Specialty-Private Real Estate TIAA Real Estate Account $47,589 3.25% $45,550 3.24%
Other Assets Non Approved Funds $406,780 27.78% $377,155 26.85%
Self-Directed Brokerage Self Directed Accounts $0 0.00% $0 0.00%
TOTALS $1,464,278 100% $1,404,865 100%
MARKET VALUE
University of Maine System Optional Retirement Savings 403(b) - 102967
25
Investment Committee - Defined Contribution Plan - Quarterly Review
36

Q4 16Period Ending 12.31.16 |plan investment review | asset summary
Information provided by Record Keeper. For informational purposes. Not a substitute for official statements produced by the plan custodian. Information has been obtained from sources considered reliable, but its accuracy and completeness are not guaranteed. This report is not an illustration of investment performance, but rather a historical illustration of asset allocation.
FUND OPTION CURRENT INVESTMENT NAME 12.31.2015 (%) CURRENT (%)
Cash and Equivalents - Money Market CREF Money Market R3 $3,319 0.28% $3,634 0.32%
Cash and Equivalents - Money Market Vanguard Federal Money Market - - $0 0.00%
Stable Value TIAA Traditional - Group Retirement Annuity $392,475 32.70% $393,666 34.47%
Inflation Protected Bond CREF Inflation-Linked Bond R3 $32,383 2.70% $20,367 1.78%
Intermediate Term Bond Prudential Total Return Bond Q $588 0.05% $760 0.07%
Intermediate Term Bond Vanguard Total Bond Market Index Adm $0 0.00% $63 0.01%
World Allocation CREF Social Choice R3 $24,303 2.02% $24,637 2.16%
Target Date Ret Income Moderate Vanguard Target Retirement Income Inv $244 0.02% $253 0.02%
Target Date 2000-2010 Conservative Vanguard Target Retirement 2010 Inv $1,088 0.09% $839 0.07%
Target Date 2015 Moderate Vanguard Target Retirement 2015 Inv $0 0.00% $0 0.00%
Target Date 2020 Moderate Vanguard Target Retirement 2020 Inv $31,433 2.62% $38,617 3.38%
Target Date 2025 Moderate Vanguard Target Retirement 2025 Inv $391 0.03% $420 0.04%
Target Date 2030 Conservative Vanguard Target Retirement 2030 Inv $747 0.06% $806 0.07%
Target Date 2035 Moderate Vanguard Target Retirement 2035 Inv $0 0.00% $0 0.00%
Target Date 2040 Moderate Vanguard Target Retirement 2040 Inv $0 0.00% $0 0.00%
Target Date 2045 Moderate Vanguard Target Retirement 2045 Inv $0 0.00% $0 0.00%
Target Date 2050 Moderate Vanguard Target Retirement 2050 Inv $0 0.00% $0 0.00%
Target Date 2055 Moderate Vanguard Target Retirement 2055 Inv $0 0.00% $0 0.00%
MARKET VALUE
CONTINUED…
University of Maine System Optional Retirement Savings 401(a) - 102968
26
Investment Committee - Defined Contribution Plan - Quarterly Review
37
Q4 16Period Ending 12.31.16 |plan investment review | asset summary
Information provided by Record Keeper. For informational purposes. Not a substitute for official statements produced by the plan custodian. Information has been obtained from sources considered reliable, but its accuracy and completeness are not guaranteed. This report is not an illustration of investment performance, but rather a historical illustration of asset allocation.
FUND OPTION CURRENT INVESTMENT NAME 12.31.2015 (%) CURRENT (%)
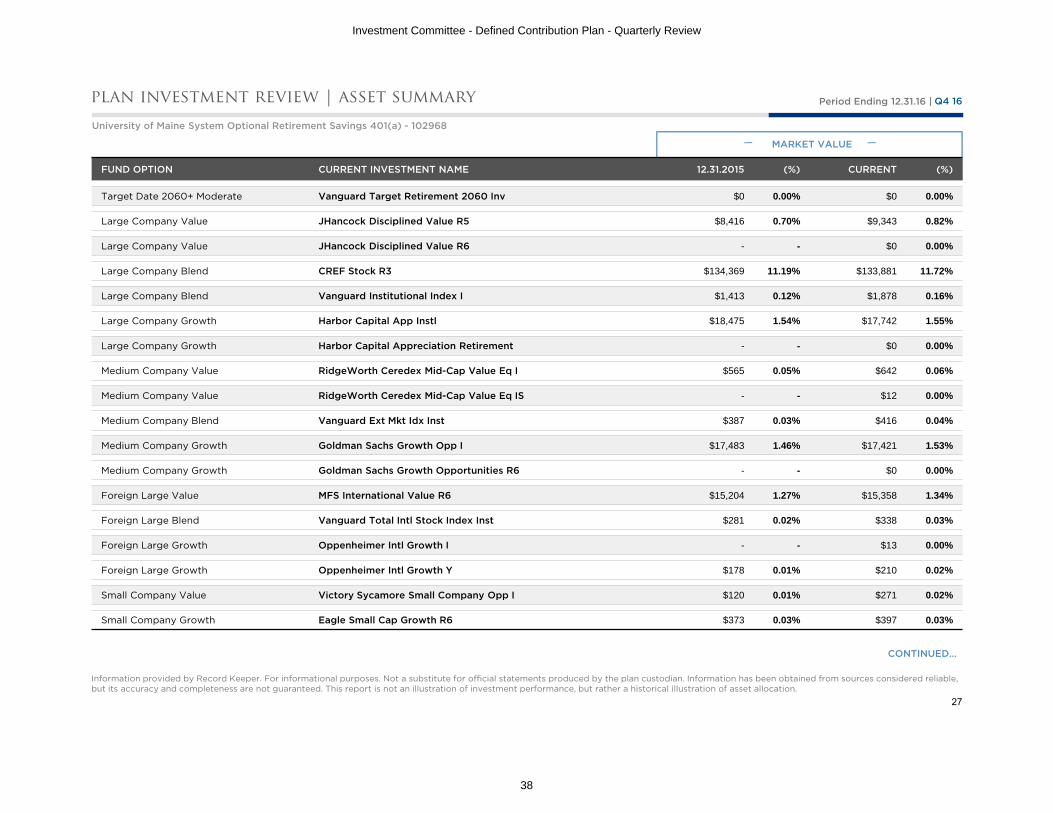
Target Date 2060+ Moderate Vanguard Target Retirement 2060 Inv $0 0.00% $0 0.00%
Large Company Value JHancock Disciplined Value R5 $8,416 0.70% $9,343 0.82%
Large Company Value JHancock Disciplined Value R6 - - $0 0.00%
Large Company Blend CREF Stock R3 $134,369 11.19% $133,881 11.72%
Large Company Blend Vanguard Institutional Index I $1,413 0.12% $1,878 0.16%
Large Company Growth Harbor Capital App Instl $18,475 1.54% $17,742 1.55%
Large Company Growth Harbor Capital Appreciation Retirement - - $0 0.00%
Medium Company Value RidgeWorth Ceredex Mid-Cap Value Eq I $565 0.05% $642 0.06%
Medium Company Value RidgeWorth Ceredex Mid-Cap Value Eq IS - - $12 0.00%
Medium Company Blend Vanguard Ext Mkt Idx Inst $387 0.03% $416 0.04%
Medium Company Growth Goldman Sachs Growth Opp I $17,483 1.46% $17,421 1.53%
Medium Company Growth Goldman Sachs Growth Opportunities R6 - - $0 0.00%
Foreign Large Value MFS International Value R6 $15,204 1.27% $15,358 1.34%
Foreign Large Blend Vanguard Total Intl Stock Index Inst $281 0.02% $338 0.03%
Foreign Large Growth Oppenheimer Intl Growth I - - $13 0.00%
Foreign Large Growth Oppenheimer Intl Growth Y $178 0.01% $210 0.02%
Small Company Value Victory Sycamore Small Company Opp I $120 0.01% $271 0.02%
Small Company Growth Eagle Small Cap Growth R6 $373 0.03% $397 0.03%
MARKET VALUE
CONTINUED…
University of Maine System Optional Retirement Savings 401(a) - 102968
27
Investment Committee - Defined Contribution Plan - Quarterly Review
38
Q4 16Period Ending 12.31.16 |plan investment review | asset summary
Information provided by Record Keeper. For informational purposes. Not a substitute for official statements produced by the plan custodian. Information has been obtained from sources considered reliable, but its accuracy and completeness are not guaranteed. This report is not an illustration of investment performance, but rather a historical illustration of asset allocation.
FUND OPTION CURRENT INVESTMENT NAME 12.31.2015 (%) CURRENT (%)
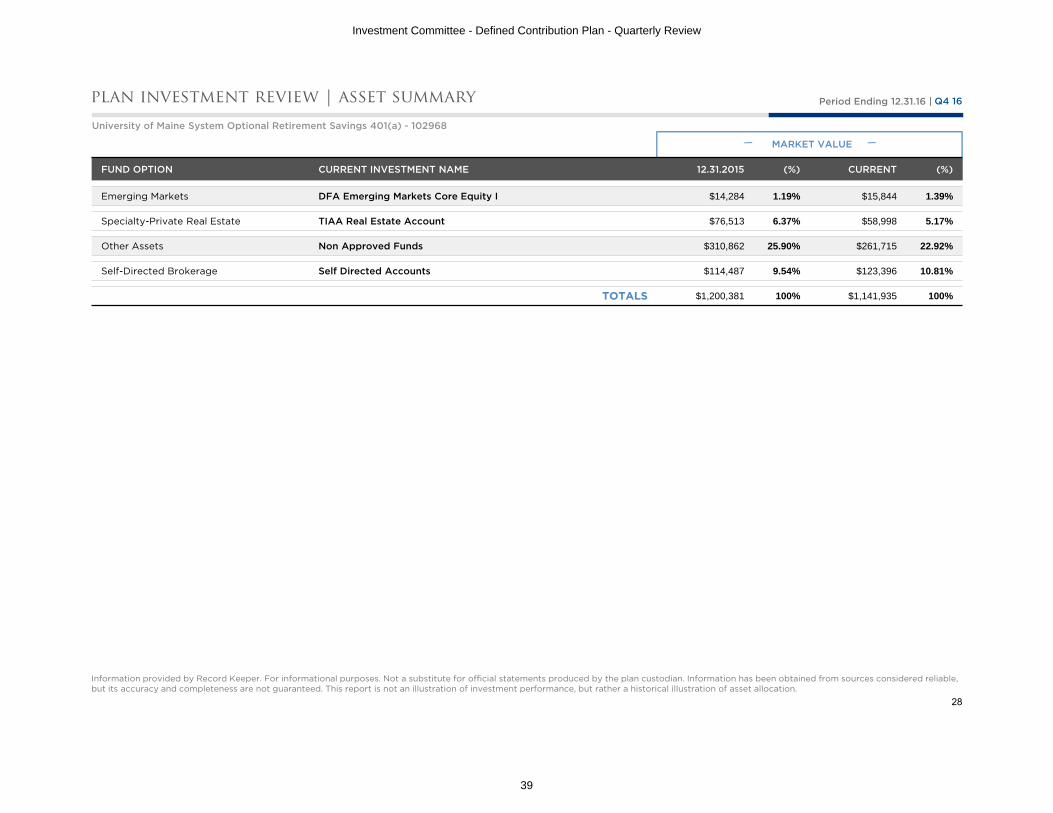
Emerging Markets DFA Emerging Markets Core Equity I $14,284 1.19% $15,844 1.39%
Specialty-Private Real Estate TIAA Real Estate Account $76,513 6.37% $58,998 5.17%
Other Assets Non Approved Funds $310,862 25.90% $261,715 22.92%
Self-Directed Brokerage Self Directed Accounts $114,487 9.54% $123,396 10.81%
TOTALS $1,200,381 100% $1,141,935 100%
MARKET VALUE
University of Maine System Optional Retirement Savings 401(a) - 102968
28
Investment Committee - Defined Contribution Plan - Quarterly Review
39

Q4 16Period Ending 12.31.16 |plan investment review | asset summary
Information provided by Record Keeper. For informational purposes. Not a substitute for official statements produced by the plan custodian. Information has been obtained from sources considered reliable, but its accuracy and completeness are not guaranteed. This report is not an illustration of investment performance, but rather a historical illustration of asset allocation.
FUND OPTION CURRENT INVESTMENT NAME 12.31.2015 (%) CURRENT (%)
Cash and Equivalents - Money Market CREF Money Market R3 $461,801 1.61% $618,547 1.95%
Cash and Equivalents - Money Market Vanguard Federal Money Market - - $2 0.00%
Stable Value TIAA Traditional - Group Retirement Annuity $5,700,020 19.88% $6,132,272 19.30%
Inflation Protected Bond CREF Inflation-Linked Bond R3 $494,033 1.72% $552,746 1.74%
Intermediate Term Bond Prudential Total Return Bond Q $450,841 1.57% $636,759 2.00%
Intermediate Term Bond Vanguard Total Bond Market Index Adm $36,490 0.13% $74,975 0.24%
World Allocation CREF Social Choice R3 $1,026,629 3.58% $1,068,820 3.36%
Target Date Ret Income Moderate Vanguard Target Retirement Income Inv $324,427 1.13% $272,110 0.86%
Target Date 2000-2010 Conservative Vanguard Target Retirement 2010 Inv $171,976 0.60% $137,528 0.43%
Target Date 2015 Moderate Vanguard Target Retirement 2015 Inv $214,587 0.75% $345,261 1.09%
Target Date 2020 Moderate Vanguard Target Retirement 2020 Inv $536,379 1.87% $811,756 2.56%
Target Date 2025 Moderate Vanguard Target Retirement 2025 Inv $466,979 1.63% $936,012 2.95%
Target Date 2030 Conservative Vanguard Target Retirement 2030 Inv $262,271 0.91% $443,884 1.40%
Target Date 2035 Moderate Vanguard Target Retirement 2035 Inv $208,469 0.73% $297,787 0.94%
Target Date 2040 Moderate Vanguard Target Retirement 2040 Inv $212,125 0.74% $297,390 0.94%
Target Date 2045 Moderate Vanguard Target Retirement 2045 Inv $142,202 0.50% $233,350 0.73%
Target Date 2050 Moderate Vanguard Target Retirement 2050 Inv $55,596 0.19% $93,358 0.29%
Target Date 2055 Moderate Vanguard Target Retirement 2055 Inv $36,663 0.13% $73,838 0.23%
MARKET VALUE
CONTINUED…
University of Maine System Basic Retirement Plan for Classified Employees 403(b) - 102969
29
Investment Committee - Defined Contribution Plan - Quarterly Review
40

Q4 16Period Ending 12.31.16 |plan investment review | asset summary
Information provided by Record Keeper. For informational purposes. Not a substitute for official statements produced by the plan custodian. Information has been obtained from sources considered reliable, but its accuracy and completeness are not guaranteed. This report is not an illustration of investment performance, but rather a historical illustration of asset allocation.
FUND OPTION CURRENT INVESTMENT NAME 12.31.2015 (%) CURRENT (%)
Target Date 2060+ Moderate Vanguard Target Retirement 2060 Inv $674 0.00% $9,780 0.03%
Large Company Value JHancock Disciplined Value R5 $476,593 1.66% $419,105 1.32%
Large Company Value JHancock Disciplined Value R6 - - $122,491 0.39%
Large Company Blend CREF Stock R3 $3,193,830 11.14% $3,212,845 10.11%
Large Company Blend Vanguard Institutional Index I $410,238 1.43% $748,525 2.36%
Large Company Growth Harbor Capital App Instl $619,967 2.16% $527,971 1.66%
Large Company Growth Harbor Capital Appreciation Retirement - - $3,049 0.01%
Medium Company Value RidgeWorth Ceredex Mid-Cap Value Eq I $103,896 0.36% $163,112 0.51%
Medium Company Value RidgeWorth Ceredex Mid-Cap Value Eq IS - - $127,105 0.40%
Medium Company Blend Vanguard Ext Mkt Idx Inst $135,840 0.47% $220,415 0.69%
Medium Company Growth Goldman Sachs Growth Opp I $394,721 1.38% $404,887 1.27%
Medium Company Growth Goldman Sachs Growth Opportunities R6 - - $0 0.00%
Foreign Large Value MFS International Value R6 $644,124 2.25% $685,481 2.16%
Foreign Large Blend Vanguard Total Intl Stock Index Inst $91,693 0.32% $188,081 0.59%
Foreign Large Growth Oppenheimer Intl Growth I - - $21,850 0.07%
Foreign Large Growth Oppenheimer Intl Growth Y $45,296 0.16% $69,750 0.22%
Small Company Value Victory Sycamore Small Company Opp I $199,642 0.70% $470,488 1.48%
Small Company Growth Eagle Small Cap Growth R6 $27,276 0.10% $32,674 0.10%
MARKET VALUE
CONTINUED…
University of Maine System Basic Retirement Plan for Classified Employees 403(b) - 102969
30
Investment Committee - Defined Contribution Plan - Quarterly Review
41

Q4 16Period Ending 12.31.16 |plan investment review | asset summary
Information provided by Record Keeper. For informational purposes. Not a substitute for official statements produced by the plan custodian. Information has been obtained from sources considered reliable, but its accuracy and completeness are not guaranteed. This report is not an illustration of investment performance, but rather a historical illustration of asset allocation.
FUND OPTION CURRENT INVESTMENT NAME 12.31.2015 (%) CURRENT (%)
Emerging Markets DFA Emerging Markets Core Equity I $472,422 1.65% $687,139 2.16%
Specialty-Private Real Estate TIAA Real Estate Account $1,849,250 6.45% $2,029,933 6.39%
Other Assets Non Approved Funds $6,607,607 23.04% $6,035,842 19.00%
Self-Directed Brokerage Self Directed Accounts $2,603,877 9.08% $2,563,149 8.07%
TOTALS $28,678,435 100% $31,770,064 100%
MARKET VALUE
University of Maine System Basic Retirement Plan for Classified Employees 403(b) - 102969
31
Investment Committee - Defined Contribution Plan - Quarterly Review
42

Q4 16Period Ending 12.31.16 |plan investment review | asset summary
Information provided by Record Keeper. For informational purposes. Not a substitute for official statements produced by the plan custodian. Information has been obtained from sources considered reliable, but its accuracy and completeness are not guaranteed. This report is not an illustration of investment performance, but rather a historical illustration of asset allocation.
FUND OPTION CURRENT INVESTMENT NAME 12.31.2015 (%) CURRENT (%)
Cash and Equivalents - Money Market CREF Money Market R3 $1,509,830 2.69% $1,419,189 2.35%
Cash and Equivalents - Money Market Vanguard Federal Money Market - - $13 0.00%
Stable Value TIAA Traditional - Group Retirement Annuity $13,250,524 23.58% $14,028,827 23.24%
Inflation Protected Bond CREF Inflation-Linked Bond R3 $953,390 1.70% $1,045,099 1.73%
Intermediate Term Bond Prudential Total Return Bond Q $777,767 1.38% $1,037,070 1.72%
Intermediate Term Bond Vanguard Total Bond Market Index Adm $39,063 0.07% $94,748 0.16%
World Allocation CREF Social Choice R3 $2,625,993 4.67% $2,715,282 4.50%
Target Date Ret Income Moderate Vanguard Target Retirement Income Inv $418,042 0.74% $492,158 0.82%
Target Date 2000-2010 Conservative Vanguard Target Retirement 2010 Inv $257,989 0.46% $263,210 0.44%
Target Date 2015 Moderate Vanguard Target Retirement 2015 Inv $448,923 0.80% $583,552 0.97%
Target Date 2020 Moderate Vanguard Target Retirement 2020 Inv $937,525 1.67% $1,177,594 1.95%
Target Date 2025 Moderate Vanguard Target Retirement 2025 Inv $850,970 1.51% $1,340,971 2.22%
Target Date 2030 Conservative Vanguard Target Retirement 2030 Inv $449,587 0.80% $781,116 1.29%
Target Date 2035 Moderate Vanguard Target Retirement 2035 Inv $436,696 0.78% $601,057 1.00%
Target Date 2040 Moderate Vanguard Target Retirement 2040 Inv $293,966 0.52% $418,897 0.69%
Target Date 2045 Moderate Vanguard Target Retirement 2045 Inv $223,665 0.40% $340,464 0.56%
Target Date 2050 Moderate Vanguard Target Retirement 2050 Inv $95,400 0.17% $160,641 0.27%
Target Date 2055 Moderate Vanguard Target Retirement 2055 Inv $35,170 0.06% $75,237 0.12%
MARKET VALUE
CONTINUED…
University of Maine System Basic Retirement Plan for Classified Employees 401(a) - 102970
32
Investment Committee - Defined Contribution Plan - Quarterly Review
43

Q4 16Period Ending 12.31.16 |plan investment review | asset summary
Information provided by Record Keeper. For informational purposes. Not a substitute for official statements produced by the plan custodian. Information has been obtained from sources considered reliable, but its accuracy and completeness are not guaranteed. This report is not an illustration of investment performance, but rather a historical illustration of asset allocation.
FUND OPTION CURRENT INVESTMENT NAME 12.31.2015 (%) CURRENT (%)
Target Date 2060+ Moderate Vanguard Target Retirement 2060 Inv $674 0.00% $9,779 0.02%
Large Company Value JHancock Disciplined Value R5 $669,342 1.19% $700,406 1.16%
Large Company Value JHancock Disciplined Value R6 - - $159,468 0.26%
Large Company Blend CREF Stock R3 $7,987,829 14.22% $8,071,198 13.37%
Large Company Blend Vanguard Institutional Index I $645,159 1.15% $1,141,971 1.89%
Large Company Growth Harbor Capital App Instl $798,041 1.42% $802,234 1.33%
Large Company Growth Harbor Capital Appreciation Retirement - - $4,604 0.01%
Medium Company Value RidgeWorth Ceredex Mid-Cap Value Eq I $191,761 0.34% $277,595 0.46%
Medium Company Value RidgeWorth Ceredex Mid-Cap Value Eq IS - - $161,465 0.27%
Medium Company Blend Vanguard Ext Mkt Idx Inst $270,593 0.48% $396,264 0.66%
Medium Company Growth Goldman Sachs Growth Opp I $421,498 0.75% $479,334 0.79%
Medium Company Growth Goldman Sachs Growth Opportunities R6 - - $0 0.00%
Foreign Large Value MFS International Value R6 $888,052 1.58% $1,027,422 1.70%
Foreign Large Blend Vanguard Total Intl Stock Index Inst $177,318 0.32% $291,281 0.48%
Foreign Large Growth Oppenheimer Intl Growth I - - $7,483 0.01%
Foreign Large Growth Oppenheimer Intl Growth Y $89,502 0.16% $129,418 0.21%
Small Company Value Victory Sycamore Small Company Opp I $248,802 0.44% $577,144 0.96%
Small Company Growth Eagle Small Cap Growth R6 $38,198 0.07% $54,590 0.09%
MARKET VALUE
CONTINUED…
University of Maine System Basic Retirement Plan for Classified Employees 401(a) - 102970
33
Investment Committee - Defined Contribution Plan - Quarterly Review
44

Q4 16Period Ending 12.31.16 |plan investment review | asset summary
Information provided by Record Keeper. For informational purposes. Not a substitute for official statements produced by the plan custodian. Information has been obtained from sources considered reliable, but its accuracy and completeness are not guaranteed. This report is not an illustration of investment performance, but rather a historical illustration of asset allocation.
FUND OPTION CURRENT INVESTMENT NAME 12.31.2015 (%) CURRENT (%)
Emerging Markets DFA Emerging Markets Core Equity I $527,424 0.94% $805,114 1.33%
Specialty-Private Real Estate TIAA Real Estate Account $3,384,389 6.02% $3,543,381 5.87%
Other Assets Non Approved Funds $14,144,637 25.18% $13,101,869 21.70%
Self-Directed Brokerage Self Directed Accounts $2,096,355 3.73% $2,046,461 3.39%
TOTALS $56,184,073 100% $60,363,607 100%
MARKET VALUE
University of Maine System Basic Retirement Plan for Classified Employees 401(a) - 102970
34
Investment Committee - Defined Contribution Plan - Quarterly Review
45

Q4 16Period Ending 12.31.16 |asset investment review | summary
Information provided by Record Keeper. For informational purposes. Not a substitute for official statements produced by the plan custodian and/or administrator. Information has been obtained from sources considered reliable, but its accuracy and completeness are not guaranteed. This report is not an illustration of investment performance, but rather a historical illustration of asset allocation.
FUND OPTION CURRENT INVESTMENT NAME 12.31.2015 (%) CURRENT (%)
Cash and Equivalents - Money Market CREF Money Market R3 $471,493 2.28% $529,498 2.12%
Cash and Equivalents - Money Market Vanguard Federal Money Market - - $35,492 0.14%
Stable Value TIAA Traditional - Group Retirement Annuity $5,148,401 24.93% $6,219,922 24.94%
Inflation Protected Bond CREF Inflation-Linked Bond R3 $474,741 2.30% $586,270 2.35%
Intermediate Term Bond Prudential Total Return Bond Q $612,548 2.97% $895,107 3.59%
Intermediate Term Bond Vanguard Total Bond Market Index Adm $2,218 0.01% $48,594 0.19%
World Allocation CREF Social Choice R3 $1,100,213 5.33% $1,215,718 4.87%
Target Date Ret Income Moderate Vanguard Target Retirement Income Inv $168,285 0.81% $128,688 0.52%
Target Date 2000-2010 Conservative Vanguard Target Retirement 2010 Inv $247,335 1.20% $306,473 1.23%
Target Date 2015 Moderate Vanguard Target Retirement 2015 Inv $291,448 1.41% $375,654 1.51%
Target Date 2020 Moderate Vanguard Target Retirement 2020 Inv $371,303 1.80% $601,347 2.41%
Target Date 2025 Moderate Vanguard Target Retirement 2025 Inv $643,243 3.11% $654,453 2.62%
Target Date 2030 Conservative Vanguard Target Retirement 2030 Inv $329,898 1.60% $583,136 2.34%
Target Date 2035 Moderate Vanguard Target Retirement 2035 Inv $101,329 0.49% $144,777 0.58%
Target Date 2040 Moderate Vanguard Target Retirement 2040 Inv $105,924 0.51% $154,953 0.62%
Target Date 2045 Moderate Vanguard Target Retirement 2045 Inv $55,490 0.27% $86,149 0.35%
Target Date 2050 Moderate Vanguard Target Retirement 2050 Inv $26,478 0.13% $30,118 0.12%
Target Date 2055 Moderate Vanguard Target Retirement 2055 Inv $0 0.00% $0 0.00%
MARKET VALUE
CONTINUED…
University of Maine System Deferred Compensation Plan 457(b) - 102971
35
Investment Committee - Defined Contribution Plan - Quarterly Review
46
Q4 16Period Ending 12.31.16 |asset investment review | summary
Information provided by Record Keeper. For informational purposes. Not a substitute for official statements produced by the plan custodian and/or administrator. Information has been obtained from sources considered reliable, but its accuracy and completeness are not guaranteed. This report is not an illustration of investment performance, but rather a historical illustration of asset allocation.
FUND OPTION CURRENT INVESTMENT NAME 12.31.2015 (%) CURRENT (%)
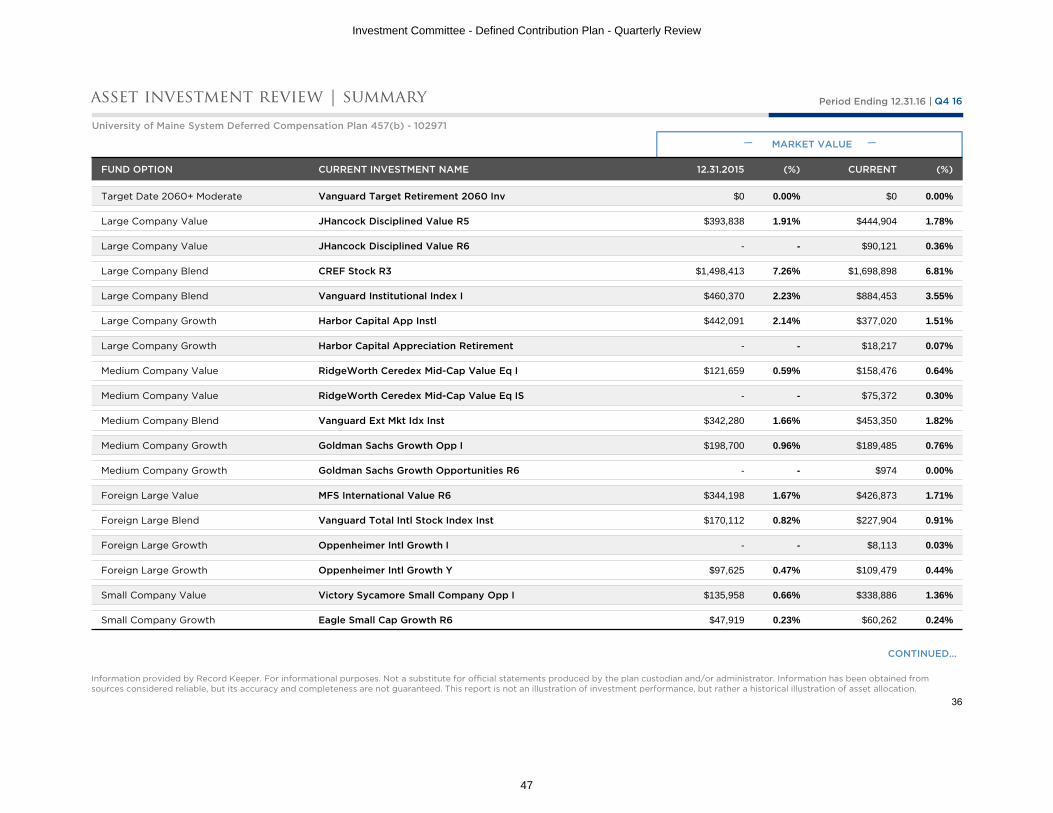
Target Date 2060+ Moderate Vanguard Target Retirement 2060 Inv $0 0.00% $0 0.00%
Large Company Value JHancock Disciplined Value R5 $393,838 1.91% $444,904 1.78%
Large Company Value JHancock Disciplined Value R6 - - $90,121 0.36%
Large Company Blend CREF Stock R3 $1,498,413 7.26% $1,698,898 6.81%
Large Company Blend Vanguard Institutional Index I $460,370 2.23% $884,453 3.55%
Large Company Growth Harbor Capital App Instl $442,091 2.14% $377,020 1.51%
Large Company Growth Harbor Capital Appreciation Retirement - - $18,217 0.07%
Medium Company Value RidgeWorth Ceredex Mid-Cap Value Eq I $121,659 0.59% $158,476 0.64%
Medium Company Value RidgeWorth Ceredex Mid-Cap Value Eq IS - - $75,372 0.30%
Medium Company Blend Vanguard Ext Mkt Idx Inst $342,280 1.66% $453,350 1.82%
Medium Company Growth Goldman Sachs Growth Opp I $198,700 0.96% $189,485 0.76%
Medium Company Growth Goldman Sachs Growth Opportunities R6 - - $974 0.00%
Foreign Large Value MFS International Value R6 $344,198 1.67% $426,873 1.71%
Foreign Large Blend Vanguard Total Intl Stock Index Inst $170,112 0.82% $227,904 0.91%
Foreign Large Growth Oppenheimer Intl Growth I - - $8,113 0.03%
Foreign Large Growth Oppenheimer Intl Growth Y $97,625 0.47% $109,479 0.44%
Small Company Value Victory Sycamore Small Company Opp I $135,958 0.66% $338,886 1.36%
Small Company Growth Eagle Small Cap Growth R6 $47,919 0.23% $60,262 0.24%
MARKET VALUE
CONTINUED…
University of Maine System Deferred Compensation Plan 457(b) - 102971
36
Investment Committee - Defined Contribution Plan - Quarterly Review
47

Q4 16Period Ending 12.31.16 |asset investment review | summary
Information provided by Record Keeper. For informational purposes. Not a substitute for official statements produced by the plan custodian and/or administrator. Information has been obtained from sources considered reliable, but its accuracy and completeness are not guaranteed. This report is not an illustration of investment performance, but rather a historical illustration of asset allocation.
FUND OPTION CURRENT INVESTMENT NAME 12.31.2015 (%) CURRENT (%)
Emerging Markets DFA Emerging Markets Core Equity I $262,922 1.27% $487,321 1.95%
Specialty-Private Real Estate TIAA Real Estate Account $1,568,671 7.60% $1,940,406 7.78%
Other Assets Non Approved Funds $3,462,829 16.77% $3,433,240 13.77%
Self-Directed Brokerage Self Directed Accounts $955,381 4.63% $917,770 3.68%
TOTALS $20,653,315 100% $24,937,871 100%
MARKET VALUE
University of Maine System Deferred Compensation Plan 457(b) - 102971
37
Investment Committee - Defined Contribution Plan - Quarterly Review
48

University of Maine System Defined Contribution Plan
Q4 16Period Ending 12.31.16 |
LEGEND
IN GOOD STANDING MARKED FOR REVIEW CONSIDER FOR TERMINATION
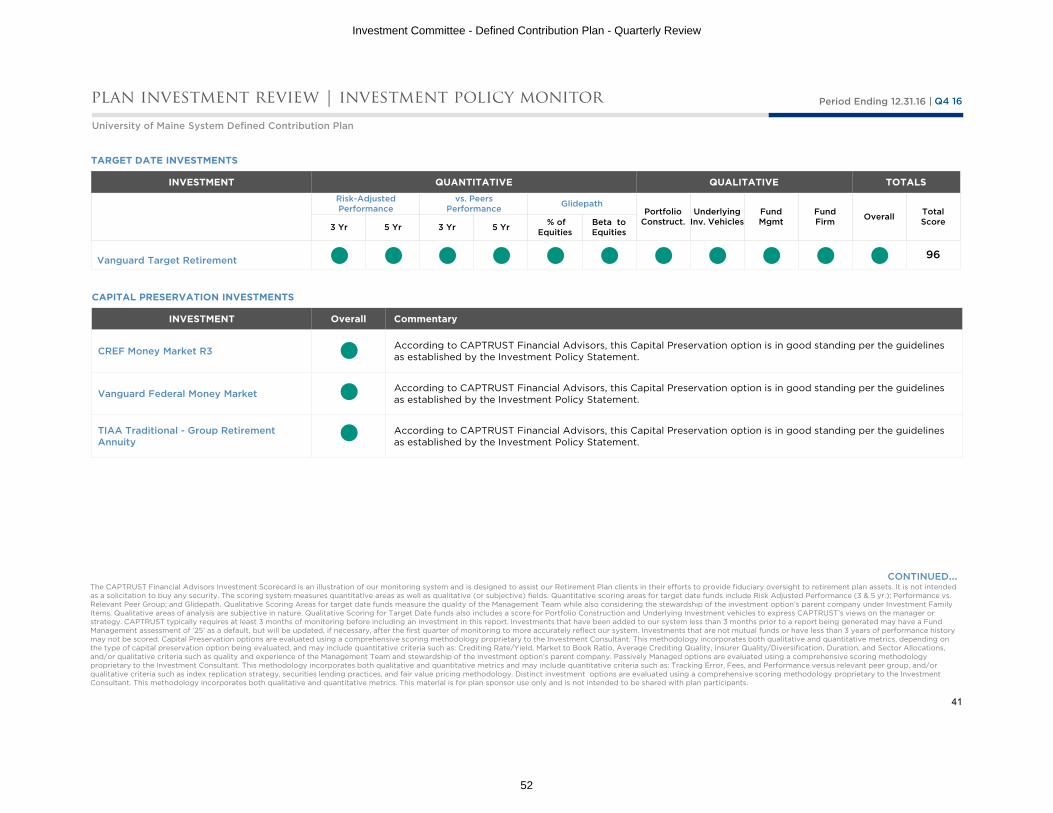
The CAPTRUST Investment Policy Monitor (“Scorecard”) is an illustration of our monitoring system and is designed to assist our Retirement Plan clients in their efforts to provide fiduciary oversight to retirement plan assets. It is not intendedas a solicitation to buy any security. The scoring system measures quantitative areas as well as qualitative (or subjective) fields for actively managed investment options. Quantitative scoring areas include Risk Adjusted Performance (3 & 5yr.); Performance vs. Relevant Peer Group; Style Attribution; and Confidence. Qualitative Scoring Areas measure the quality of the Management Team while also considering the stewardship of the investment option’s parent company underInvestment Family Items. Qualitative areas of analysis are subjective in nature. CAPTRUST typically requires at least 3 months of monitoring before including an investment in this report. Investments that have been added to our system lessthan 3 months prior to a report being generated may have a Fund Management assessment of ‘25’ as a default, but will be updated, if necessary, after the first quarter of monitoring to more accurately reflect our system. Investments that arenot mutual funds or have less than 3 years of performance history may not be scored. This material is for plan sponsor use only and is not intended to be shared with plan participants.
plan investment review | investment policy monitor
CONTINUED…
INVESTMENT QUANTITATIVE QUALITATIVE TOTALSRisk-AdjustedPerformance
vs. PeersPerformance Style Confidence Fund
ManagementFund Firm Overall Total
Score3 Yr 5 Yr 3 Yr 5 Yr 3 Yr 5 Yr 3 Yr 5 Yr
Inflation Protected BondCREF Inflation-Linked Bond R3 89
Intermediate Term BondPrudential Total Return Bond Q 100
World AllocationCREF Social Choice R3 99
Large Company ValueJHancock Disciplined Value R5 90
Large Company ValueJHancock Disciplined Value R6 90
Large Company GrowthHarbor Capital App Instl 86
Large Company GrowthHarbor Capital Appreciation Retirement 86
Medium Company ValueRidgeWorth Ceredex Mid-Cap Value Eq I
96
38
Investment Committee - Defined Contribution Plan - Quarterly Review
49

University of Maine System Defined Contribution Plan
Q4 16Period Ending 12.31.16 |
LEGEND
IN GOOD STANDING MARKED FOR REVIEW CONSIDER FOR TERMINATION
The CAPTRUST Investment Policy Monitor (“Scorecard”) is an illustration of our monitoring system and is designed to assist our Retirement Plan clients in their efforts to provide fiduciary oversight to retirement plan assets. It is not intendedas a solicitation to buy any security. The scoring system measures quantitative areas as well as qualitative (or subjective) fields for actively managed investment options. Quantitative scoring areas include Risk Adjusted Performance (3 & 5yr.); Performance vs. Relevant Peer Group; Style Attribution; and Confidence. Qualitative Scoring Areas measure the quality of the Management Team while also considering the stewardship of the investment option’s parent company underInvestment Family Items. Qualitative areas of analysis are subjective in nature. CAPTRUST typically requires at least 3 months of monitoring before including an investment in this report. Investments that have been added to our system lessthan 3 months prior to a report being generated may have a Fund Management assessment of ‘25’ as a default, but will be updated, if necessary, after the first quarter of monitoring to more accurately reflect our system. Investments that arenot mutual funds or have less than 3 years of performance history may not be scored. This material is for plan sponsor use only and is not intended to be shared with plan participants.
plan investment review | investment policy monitor
CONTINUED…
INVESTMENT QUANTITATIVE QUALITATIVE TOTALSRisk-AdjustedPerformance
vs. PeersPerformance Style Confidence Fund
ManagementFund Firm Overall Total
Score3 Yr 5 Yr 3 Yr 5 Yr 3 Yr 5 Yr 3 Yr 5 Yr
Medium Company ValueRidgeWorth Ceredex Mid-Cap Value Eq IS
96
Medium Company GrowthGoldman Sachs Growth Opp I 76
Medium Company GrowthGoldman Sachs Growth Opportunities R6
76
Foreign Large ValueMFS International Value R6 99
Foreign Large GrowthOppenheimer Intl Growth I 94
Foreign Large GrowthOppenheimer Intl Growth Y 94
Small Company ValueVictory Sycamore Small Company Opp I 100
Small Company GrowthEagle Small Cap Growth R6 85
39
Investment Committee - Defined Contribution Plan - Quarterly Review
50

University of Maine System Defined Contribution Plan
Q4 16Period Ending 12.31.16 |
LEGEND
IN GOOD STANDING MARKED FOR REVIEW CONSIDER FOR TERMINATION
The CAPTRUST Investment Policy Monitor (“Scorecard”) is an illustration of our monitoring system and is designed to assist our Retirement Plan clients in their efforts to provide fiduciary oversight to retirement plan assets. It is not intendedas a solicitation to buy any security. The scoring system measures quantitative areas as well as qualitative (or subjective) fields for actively managed investment options. Quantitative scoring areas include Risk Adjusted Performance (3 & 5yr.); Performance vs. Relevant Peer Group; Style Attribution; and Confidence. Qualitative Scoring Areas measure the quality of the Management Team while also considering the stewardship of the investment option’s parent company underInvestment Family Items. Qualitative areas of analysis are subjective in nature. CAPTRUST typically requires at least 3 months of monitoring before including an investment in this report. Investments that have been added to our system lessthan 3 months prior to a report being generated may have a Fund Management assessment of ‘25’ as a default, but will be updated, if necessary, after the first quarter of monitoring to more accurately reflect our system. Investments that arenot mutual funds or have less than 3 years of performance history may not be scored. This material is for plan sponsor use only and is not intended to be shared with plan participants.
plan investment review | investment policy monitor
INVESTMENT QUANTITATIVE QUALITATIVE TOTALSRisk-AdjustedPerformance
vs. PeersPerformance Style Confidence Fund
ManagementFund Firm Overall Total
Score3 Yr 5 Yr 3 Yr 5 Yr 3 Yr 5 Yr 3 Yr 5 Yr
Emerging MarketsDFA Emerging Markets Core Equity I 92
40
Investment Committee - Defined Contribution Plan - Quarterly Review
51
University of Maine System Defined Contribution Plan
Q4 16Period Ending 12.31.16 |plan investment review | investment policy monitor
CAPITAL PRESERVATION INVESTMENTS
INVESTMENT Overall Commentary
CREF Money Market R3 According to CAPTRUST Financial Advisors, this Capital Preservation option is in good standing per the guidelines as established by the Investment Policy Statement.
Vanguard Federal Money Market According to CAPTRUST Financial Advisors, this Capital Preservation option is in good standing per the guidelines as established by the Investment Policy Statement.
TIAA Traditional - Group Retirement Annuity
According to CAPTRUST Financial Advisors, this Capital Preservation option is in good standing per the guidelines as established by the Investment Policy Statement.
The CAPTRUST Financial Advisors Investment Scorecard is an illustration of our monitoring system and is designed to assist our Retirement Plan clients in their efforts to provide fiduciary oversight to retirement plan assets. It is not intended as a solicitation to buy any security. The scoring system measures quantitative areas as well as qualitative (or subjective) fields. Quantitative scoring areas for target date funds include Risk Adjusted Performance (3 & 5 yr.); Performance vs. Relevant Peer Group; and Glidepath. Qualitative Scoring Areas for target date funds measure the quality of the Management Team while also considering the stewardship of the investment option’s parent company under Investment Family Items. Qualitative areas of analysis are subjective in nature. Qualitative Scoring for Target Date funds also includes a score for Portfolio Construction and Underlying Investment vehicles to express CAPTRUST’s views on the manager or strategy. CAPTRUST typically requires at least 3 months of monitoring before including an investment in this report. Investments that have been added to our system less than 3 months prior to a report being generated may have a Fund Management assessment of ‘25’ as a default, but will be updated, if necessary, after the first quarter of monitoring to more accurately reflect our system. Investments that are not mutual funds or have less than 3 years of performance history may not be scored. Capital Preservation options are evaluated using a comprehensive scoring methodology proprietary to the Investment Consultant. This methodology incorporates both qualitative and quantitative metrics, depending on the type of capital preservation option being evaluated, and may include quantitative criteria such as: Crediting Rate/Yield, Market to Book Ratio, Average Crediting Quality, Insurer Quality/Diversification, Duration, and Sector Allocations, and/or qualitative criteria such as quality and experience of the Management Team and stewardship of the investment option’s parent company. Passively Managed options are evaluated using a comprehensive scoring methodology proprietary to the Investment Consultant. This methodology incorporates both qualitative and quantitative metrics and may include quantitative criteria such as: Tracking Error, Fees, and Performance versus relevant peer group, and/or qualitative criteria such as index replication strategy, securities lending practices, and fair value pricing methodology. Distinct investment options are evaluated using a comprehensive scoring methodology proprietary to the Investment Consultant. This methodology incorporates both qualitative and quantitative metrics. This material is for plan sponsor use only and is not intended to be shared with plan participants.
TARGET DATE INVESTMENTS
INVESTMENT QUANTITATIVE QUALITATIVE TOTALS
Risk-AdjustedPerformance
vs. PeersPerformance Glidepath
PortfolioConstruct.
UnderlyingInv. Vehicles
Fund Mgmt
Fund Firm Overall Total
Score3 Yr 5 Yr 3 Yr 5 Yr % of Equities
Beta to Equities
Vanguard Target Retirement 96
CONTINUED…
41
Investment Committee - Defined Contribution Plan - Quarterly Review
52

University of Maine System Defined Contribution Plan
Q4 16Period Ending 12.31.16 |plan investment review | investment policy monitor
The CAPTRUST Financial Advisors Investment Scorecard is an illustration of our monitoring system and is designed to assist our Retirement Plan clients in their efforts to provide fiduciary oversight to retirement plan assets. It is not intended as a solicitation to buy any security. The scoring system measures quantitative areas as well as qualitative (or subjective) fields. Quantitative scoring areas for target date funds include Risk Adjusted Performance (3 & 5 yr.); Performance vs. Relevant Peer Group; and Glidepath. Qualitative Scoring Areas for target date funds measure the quality of the Management Team while also considering the stewardship of the investment option’s parent company under Investment Family Items. Qualitative areas of analysis are subjective in nature. Qualitative Scoring for Target Date funds also includes a score for Portfolio Construction and Underlying Investment vehicles to express CAPTRUST’s views on the manager or strategy. CAPTRUST typically requires at least 3 months of monitoring before including an investment in this report. Investments that have been added to our system less than 3 months prior to a report being generated may have a Fund Management assessment of ‘25’ as a default, but will be updated, if necessary, after the first quarter of monitoring to more accurately reflect our system. Investments that are not mutual funds or have less than 3 years of performance history may not be scored. Capital Preservation options are evaluated using a comprehensive scoring methodology proprietary to the Investment Consultant. This methodology incorporates both qualitative and quantitative metrics, depending on the type of capital preservation option being evaluated, and may include quantitative criteria such as: Crediting Rate/Yield, Market to Book Ratio, Average Crediting Quality, Insurer Quality/Diversification, Duration, and Sector Allocations, and/or qualitative criteria such as quality and experience of the Management Team and stewardship of the investment option’s parent company. Passively Managed options are evaluated using a comprehensive scoring methodology proprietary to the Investment Consultant. This methodology incorporates both qualitative and quantitative metrics and may include quantitative criteria such as: Tracking Error, Fees, and Performance versus relevant peer group, and/or qualitative criteria such as index replication strategy, securities lending practices, and fair value pricing methodology. Distinct investment options are evaluated using a comprehensive scoring methodology proprietary to the Investment Consultant. This methodology incorporates both qualitative and quantitative metrics. This material is for plan sponsor use only and is not intended to be shared with plan participants.
PASSIVE INVESTMENTS
INVESTMENT Overall Commentary
Vanguard Total Bond Market Index AdmThis fund currently meets the guidelines set forth by CAPTRUST for passively managed investments. This assessment is based on both quantitative and qualitative data. Examples of quantitative and qualitative items considered include, but are not limited to, quality of management, tracking error, and cost.
Vanguard Institutional Index IThis fund currently meets the guidelines set forth by CAPTRUST for passively managed investments. This assessment is based on both quantitative and qualitative data. Examples of quantitative and qualitative items considered include, but are not limited to, quality of management, tracking error, and cost.
Vanguard Ext Mkt Idx InstThis fund currently meets the guidelines set forth by CAPTRUST for passively managed investments. This assessment is based on both quantitative and qualitative data. Examples of quantitative and qualitative items considered include, but are not limited to, quality of management, tracking error, and cost.
Vanguard Total Intl Stock Index InstThis fund currently meets the guidelines set forth by CAPTRUST for passively managed investments. This assessment is based on both quantitative and qualitative data. Examples of quantitative and qualitative items considered include, but are not limited to, quality of management, tracking error, and cost.
42
Investment Committee - Defined Contribution Plan - Quarterly Review
53

University of Maine System Defined Contribution Plan
Q4 16Period Ending 12.31.16 |plan investment review | investment policy monitor
The CAPTRUST Financial Advisors Investment Scorecard is an illustration of our monitoring system and is designed to assist our Retirement Plan clients in their efforts to provide fiduciary oversight to retirement plan assets. It is not intended as a solicitation to buy any security. The scoring system measures quantitative areas as well as qualitative (or subjective) fields. Quantitative scoring areas for target date funds include Risk Adjusted Performance (3 & 5 yr.); Performance vs. Relevant Peer Group; and Glidepath. Qualitative Scoring Areas for target date funds measure the quality of the Management Team while also considering the stewardship of the investment option’s parent company under Investment Family Items. Qualitative areas of analysis are subjective in nature. Qualitative Scoring for Target Date funds also includes a score for Portfolio Construction and Underlying Investment vehicles to express CAPTRUST’s views on the manager or strategy. CAPTRUST typically requires at least 3 months of monitoring before including an investment in this report. Investments that have been added to our system less than 3 months prior to a report being generated may have a Fund Management assessment of ‘25’ as a default, but will be updated, if necessary, after the first quarter of monitoring to more accurately reflect our system. Investments that are not mutual funds or have less than 3 years of performance history may not be scored. Capital Preservation options are evaluated using a comprehensive scoring methodology proprietary to the Investment Consultant. This methodology incorporates both qualitative and quantitative metrics, depending on the type of capital preservation option being evaluated, and may include quantitative criteria such as: Crediting Rate/Yield, Market to Book Ratio, Average Crediting Quality, Insurer Quality/Diversification, Duration, and Sector Allocations, and/or qualitative criteria such as quality and experience of the Management Team and stewardship of the investment option’s parent company. Passively Managed options are evaluated using a comprehensive scoring methodology proprietary to the Investment Consultant. This methodology incorporates both qualitative and quantitative metrics and may include quantitative criteria such as: Tracking Error, Fees, and Performance versus relevant peer group, and/or qualitative criteria such as index replication strategy, securities lending practices, and fair value pricing methodology. Distinct investment options are evaluated using a comprehensive scoring methodology proprietary to the Investment Consultant. This methodology incorporates both qualitative and quantitative metrics. This material is for plan sponsor use only and is not intended to be shared with plan participants.
INVESTMENTS IN DISTINCT ASSET CLASSES
INVESTMENT Overall Commentary
CREF Stock R3
This fund currently meets the guidelines set forth by CAPTRUST for distinct investments in the Investment Policy Statement. This assessment is based on both quantitative and qualitative data. Examples of quantitative and qualitative items considered include, but are not limited to, quality of management, excess return, and risk-adjusted performance.
TIAA Real Estate Account
This fund currently meets the guidelines set forth by CAPTRUST for distinct investments in the Investment Policy Statement. This assessment is based on both quantitative and qualitative data. Examples of quantitative and qualitative items considered include, but are not limited to, quality of management, excess return, and risk-adjusted performance.
43
Investment Committee - Defined Contribution Plan - Quarterly Review
54
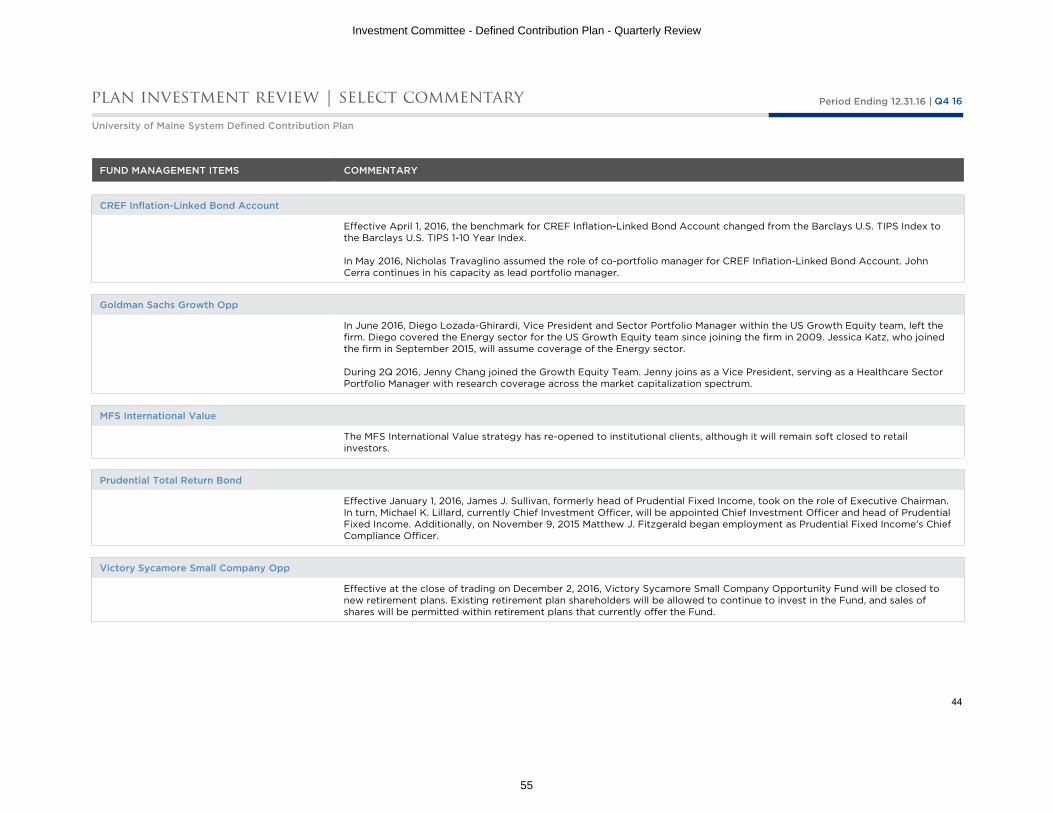
University of Maine System Defined Contribution Plan
Q4 16Period Ending 12.31.16 |plan investment review | select commentary
FUND MANAGEMENT ITEMS COMMENTARY
CREF Inflation-Linked Bond Account
Effective April 1, 2016, the benchmark for CREF Inflation-Linked Bond Account changed from the Barclays U.S. TIPS Index to the Barclays U.S. TIPS 1-10 Year Index.
In May 2016, Nicholas Travaglino assumed the role of co-portfolio manager for CREF Inflation-Linked Bond Account. John Cerra continues in his capacity as lead portfolio manager.
Goldman Sachs Growth Opp
In June 2016, Diego Lozada-Ghirardi, Vice President and Sector Portfolio Manager within the US Growth Equity team, left the firm. Diego covered the Energy sector for the US Growth Equity team since joining the firm in 2009. Jessica Katz, who joined the firm in September 2015, will assume coverage of the Energy sector.
During 2Q 2016, Jenny Chang joined the Growth Equity Team. Jenny joins as a Vice President, serving as a Healthcare Sector Portfolio Manager with research coverage across the market capitalization spectrum.
MFS International Value
The MFS International Value strategy has re-opened to institutional clients, although it will remain soft closed to retail investors.
Prudential Total Return Bond
Effective January 1, 2016, James J. Sullivan, formerly head of Prudential Fixed Income, took on the role of Executive Chairman. In turn, Michael K. Lillard, currently Chief Investment Officer, will be appointed Chief Investment Officer and head of Prudential Fixed Income. Additionally, on November 9, 2015 Matthew J. Fitzgerald began employment as Prudential Fixed Income's Chief Compliance Officer.
Victory Sycamore Small Company Opp
Effective at the close of trading on December 2, 2016, Victory Sycamore Small Company Opportunity Fund will be closed to new retirement plans. Existing retirement plan shareholders will be allowed to continue to invest in the Fund, and sales of shares will be permitted within retirement plans that currently offer the Fund.
44
Investment Committee - Defined Contribution Plan - Quarterly Review
55

University of Maine System Defined Contribution Plan
Q4 16Period Ending 12.31.16 |plan investment review | select commentary
FUND MANAGEMENT ITEMS COMMENTARY
Vanguard Target Retirement
Vanguard has announced it will launch a 2065 vintage for the Target Retirement suite and merge the 2010 vintage with the Target Retirement Income Fund. These adjustments will occur in mid-2017.
FUND FIRM ITEMS COMMENTARY
Dimensional Fund Advisors
David Martin retired from the roles of Chief Financial Officer and Treasurer at the end of March 2016. Greg Hinkle, Dimensional's Controller, took over Dave’s responsibilities effective April 1, 2016 and was named CFO and Treasurer in July 2016.
Eagle Asset Management, Inc.
In early 2016, the senior management succession plan was implemented when Richard Rossi, president and co-COO announced his retirement effective December 31, 2016. Richard stepped down as president on April 4, 2016, but remains as a director of Eagle through the end of 2016. Succeeding Richard in April were Cooper Abbott, co-COO and executive vice president of investments, and Court James, vice president of new business development. This was an administrative change; there were no ownership or investment strategy changes.
Harbor Funds
It was announced in Q3 2016 that effective 10/21/2016, ORIX Corporation acquired the remaining interest that Rabobank Nederland held in Harbor Capital's parent company, Robeco Groep (10%). As a result, Robeco Groep is wholly-owned by ORIX, a global financial services company based in Japan.
John Hancock Funds
John Hancock launched two new ESG funds on December 14, 2016. The John Hancock ESG Core Bond Fund is managed by Breckinridge and the John Hancock International Equity Fund is managed by Boston Common Asset Management.
45
Investment Committee - Defined Contribution Plan - Quarterly Review
56

University of Maine System Defined Contribution Plan
Q4 16Period Ending 12.31.16 |plan investment review | select commentary
FUND FIRM ITEMS COMMENTARY
Prudential Investments
Jeffrey T. Becker became chairman and chief executive officer of Jennison Associates, effective Oct. 3, 2016. Jennison is an investment manager of PGIM, the global investment management businesses of Prudential Financial.
Ridgeworth Capital Management, Inc.
On December 16, 2016, Virtus Investment Partners announced that it had reached an agreement to acquire Ridgeworth Investments. The transaction is expected to close in mid-2017, at which time Ridgeworth will become a wholly owned subsidiary of Virtus.
TIAA-CREF
In Q3 2016, Michelle Beck was promoted to the role of Chief Risk Officer of TIAA Global Asset Management (TGAM), head of risk management and valuation service, moving from her role as head of risk management for Nuveen Investments and TGAM Public Markets. Michelle will report to Glenn Richter, COO of TGAM.
On October 7, 2016, TIAA announced that CIO Bill Riegel, will retire effective April 1, 2017. In the meantime, Billl's team willreport directly to Brad Finkle, President of TIAA Investments.
Victory Capital Management, Inc.
The planned acquisition of RS Investments by Victory Capital Management was completed on Friday, July 29, 2016.
46
Investment Committee - Defined Contribution Plan - Quarterly Review
57

University of Maine System Defined Contribution Plan
Q4 16Period Ending 12.31.16 |plan investment review | target date review
FOCUS AREA
Organizational
COMMENTARY
In January, Vanguard announced that they are launching a 2065 vintage for each series within the Target Retirement suite, including the Target Retirement CITs. In addition, Vanguard will merge the 2010 vintage fund with the Income vintage fund. This will also be implemented across the suite and CITs. These adjustments will take place in mid-2017.
Investments
COMMENTARY
There were no changes made to the underlying investments of the Target Retirement series during the quarter.
Performance and Positioning
COMMENTARY
In January, Vanguard announced that they are launching a 2065 vintage for each series within the Target Retirement suite, including the Target Retirement CITs. In addition, Vanguard will merge the 2010 vintage fund with the Income vintage fund. This will also be implemented across the suite and CITs. These adjustments will take place in mid-2017.
VANGUARD TARGET RETIREMENT MEETING DATE: JANUARY 12, 2017
47
Investment Committee - Defined Contribution Plan - Quarterly Review
58

Q4 16Period Ending 12.31.16 |
HARBOR CAPITAL APPRECIATION
TopicThe strategy’s 2016 results significantly lagged its peer group and benchmark. Notably, the strategy was coming off a strong 2015 and its longer-term results compare favorably to its peers.
Attribution
2016 underperformance was driven by poor stock selection in healthcare (Novo Nordisk, UnitedHealth, Alexion Pharmaceuticals), technology (LinkedIn), and consumer staples (Kroger).
Much of the underperformance occurred in Q1 when higher growth stocks came under pressure, as the strategy has more exposure to those stocks vs. the benchmark. Biotech stocks were particularly hard hit in Q1 on drug pricing concerns, and the strategy has significant exposure to this area due to strong product innovation. Higher yielding stocks led the market in Q1 due to historically low interest rates, and the strategy has less exposure to those areas such as consumer staples and telecom.
Our View
We continue to recommend this strategy as it benefits from the long tenure of co-managers Sig Segalas (1990) and Kathleen McCarragher (with the firm since 1998, promoted to co-PM in 2013). They are supported by an experienced team of ten sector analysts.
The process focuses on the sustainability of growth and finding companies whose growth prospects are under appreciated by the market, both in duration and magnitude. The strategy uses an average investment horizon of five years as the team focuses on secular growth themes in sectors like technology, healthcare, and consumer discretionary.
This is not a solicitation to invest, but rather a manager update being delivered to CAPTRUST clients whose assets are invested with the manager who is the subject of this report. The opinions expressed are subject to change without notice. Statistics have been obtained from sources deemed reliable but are not guaranteed to be accurate or complete. Any performance illustrated is past performance and is not indicative of future results.
recommended manager updates
48
Investment Committee - Defined Contribution Plan - Quarterly Review
59

Q4 16Period Ending 12.31.16 |
RIDGEWORTH MID CAP VALUE
This is not a solicitation to invest, but rather a manager update being delivered to CAPTRUST clients whose assets are invested with the manager who is the subject of this report. The opinions expressed are subject to change without notice. Statistics have been obtained from sources deemed reliable but are not guaranteed to be accurate or complete. Any performance illustrated is past performance and is not indicative of future results.
recommended manager updates
We are removing this strategy from our watch list and it remains on our recommended list.
• The strategy was placed on watch in Q3 2015 due to inconsistent performance. In recent years, the strategy faced stylistic headwinds similar to its peers. However, poor stock selection and its benchmark agnostic approach magnified the underperformance.
• Based on valuation concerns, the strategy is underweight to REITs and utilities which comprise nearly 30% of the index and benefited from the low interest rate backdrop.
• 2016 results showed improvement, as they were in-line with the index and in the top half of the peer group. Cyclical sectors such as energy, industrials, and financials led the market, which was a tailwind for the strategy’s pro-cyclical positioning.
• Portfolio manager Don Wordell was early in positioning for higher interest rates and an improving economy, but his decision has paid off recently. As interest rates rose in the second half of 2016, real estate and utilities came under pressure while banks rose sharply. This aided the strategy’s performance.
• In 2015, the strategy had several positions in technology and consumer discretionary where the investment thesis did not unfold as expected. The strategy largely avoided those issues in 2016.
49
Investment Committee - Defined Contribution Plan - Quarterly Review
60
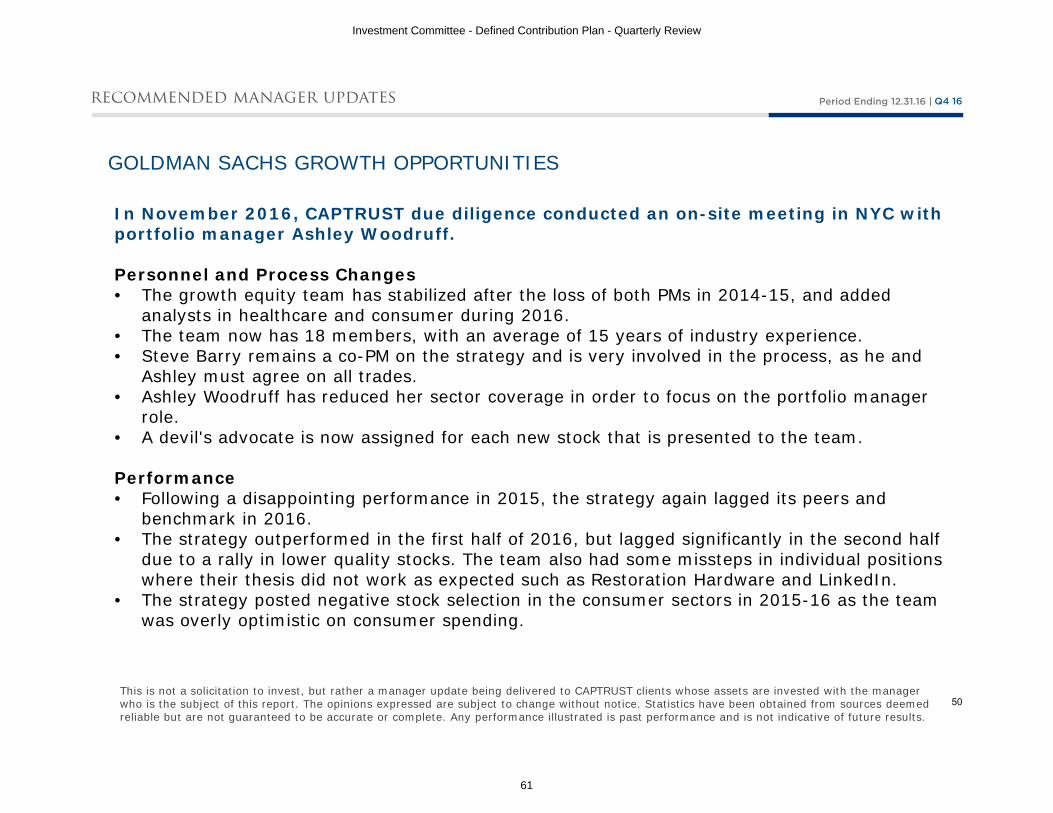
Q4 16Period Ending 12.31.16 |
GOLDMAN SACHS GROWTH OPPORTUNITIES
This is not a solicitation to invest, but rather a manager update being delivered to CAPTRUST clients whose assets are invested with the manager who is the subject of this report. The opinions expressed are subject to change without notice. Statistics have been obtained from sources deemed reliable but are not guaranteed to be accurate or complete. Any performance illustrated is past performance and is not indicative of future results.
recommended manager updates
In November 2016, CAPTRUST due diligence conducted an on-site meeting in NYC with portfolio manager Ashley Woodruff.
Personnel and Process Changes• The growth equity team has stabilized after the loss of both PMs in 2014-15, and added
analysts in healthcare and consumer during 2016. • The team now has 18 members, with an average of 15 years of industry experience.• Steve Barry remains a co-PM on the strategy and is very involved in the process, as he and
Ashley must agree on all trades. • Ashley Woodruff has reduced her sector coverage in order to focus on the portfolio manager
role. • A devil's advocate is now assigned for each new stock that is presented to the team.
Performance• Following a disappointing performance in 2015, the strategy again lagged its peers and
benchmark in 2016. • The strategy outperformed in the first half of 2016, but lagged significantly in the second half
due to a rally in lower quality stocks. The team also had some missteps in individual positions where their thesis did not work as expected such as Restoration Hardware and LinkedIn.
• The strategy posted negative stock selection in the consumer sectors in 2015-16 as the team was overly optimistic on consumer spending.
50
Investment Committee - Defined Contribution Plan - Quarterly Review
61
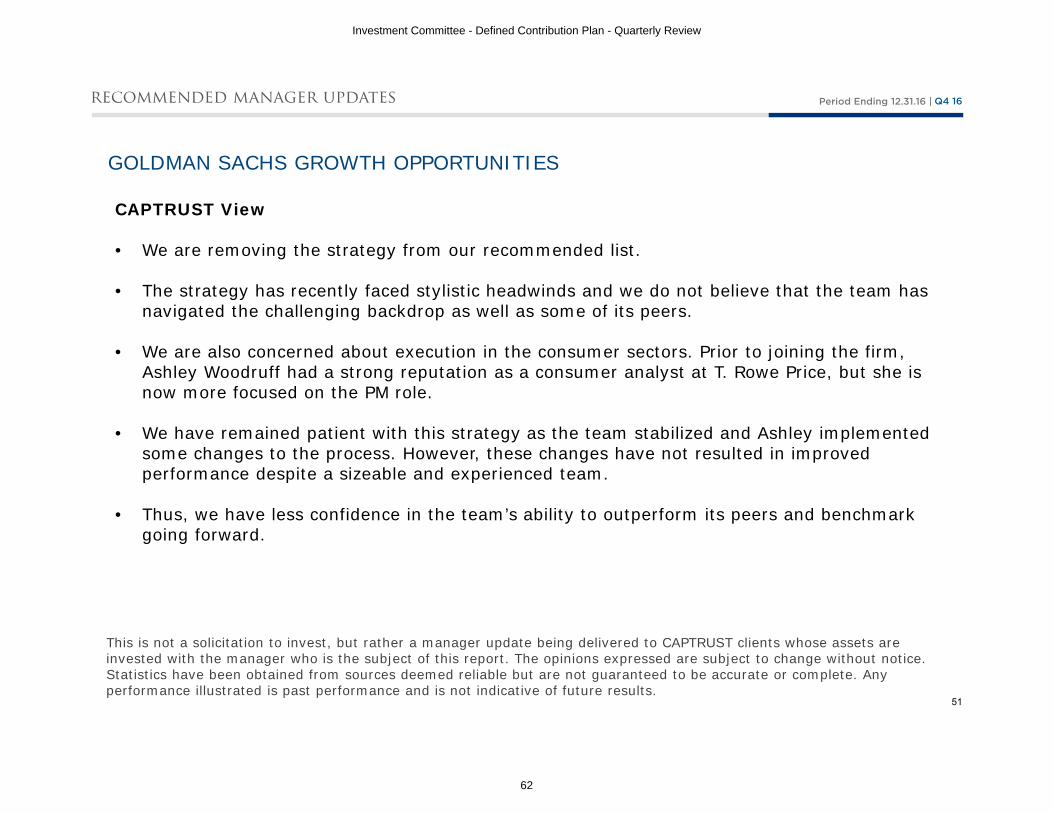
Q4 16Period Ending 12.31.16 |
GOLDMAN SACHS GROWTH OPPORTUNITIES
This is not a solicitation to invest, but rather a manager update being delivered to CAPTRUST clients whose assets are invested with the manager who is the subject of this report. The opinions expressed are subject to change without notice. Statistics have been obtained from sources deemed reliable but are not guaranteed to be accurate or complete. Any performance illustrated is past performance and is not indicative of future results.
recommended manager updates
CAPTRUST View
• We are removing the strategy from our recommended list.
• The strategy has recently faced stylistic headwinds and we do not believe that the team has navigated the challenging backdrop as well as some of its peers.
• We are also concerned about execution in the consumer sectors. Prior to joining the firm, Ashley Woodruff had a strong reputation as a consumer analyst at T. Rowe Price, but she is now more focused on the PM role.
• We have remained patient with this strategy as the team stabilized and Ashley implemented some changes to the process. However, these changes have not resulted in improved performance despite a sizeable and experienced team.
• Thus, we have less confidence in the team’s ability to outperform its peers and benchmark going forward.
51
Investment Committee - Defined Contribution Plan - Quarterly Review
62

University of Maine System Defined Contribution Plan
Q4 16Period Ending 12.31.16 |
SUMMARY: Over the previous quarters the plan investment options have averaged a score of
AVG SCORE
50
70 or > 80 or >
91100
91
plan investment review | plan performance measurement
Plan Performance Success Rate: Average score of plan investments illustrated below
INVESTMENT NAME Q2 14 Q3 14 Q4 14 Q1 15 Q2 15 Q3 15 Q4 15 Q1 16 Q2 16 Q3 16 Q4 16 AVERAGE
CREF Inflation-Linked Bond R3 - - - - 90 94 93 93 89 80 89 89
Prudential Total Return Bond Q - - - 96 100 100 100 97 98 99 100 98
CREF Social Choice R3 - - - - 100 100 100 100 100 100 99 99
Vanguard Target Retirement 95 95 95 96 90 90 94 96 96 91 96 94
JHancock Disciplined Value R5 97 98 98 97 98 95 95 91 86 90 90 94
JHancock Disciplined Value R6 - - - - - - - - - - 90 90
Harbor Capital App Instl 91 84 86 91 99 100 100 99 95 90 86 92
Harbor Capital Appreciation Retirement - - - - - - - - - - 86 86
RidgeWorth Ceredex Mid-Cap Value Eq I 87 92 90 74 70 64 74 78 81 91 96 81
RidgeWorth Ceredex Mid-Cap Value Eq IS - - - - - - - - - - 96 96
Goldman Sachs Growth Opp I 94 89 92 84 81 71 79 84 90 84 76 84
Goldman Sachs Growth Opportunities R6 - - - - - - - - - - 76 76
MFS International Value R6 100 99 99 100 100 100 100 100 100 100 99 99
Oppenheimer Intl Growth Y 99 98 98 97 99 99 99 100 97 97 94 97
Oppenheimer Intl Growth I - - - - - - - - - - 94 94
Victory Sycamore Small Company Opp I 92 81 84 88 86 100 100 99 99 100 100 93
.
Scores are calculated quarterly using the CAPTRUST Investment Policy Monitoring System (“Scorecard”). In the 4Q2013, our methodology changed utilizing different quantitative statistics than the prior system resulting in a re‐categorization of some specific funds as either “passive” (funds designed to track a given benchmark) or “distinct” funds with a limited number of comparable funds, or funds with distinct strategies that do not have an appropriate benchmark. These funds (passive and/or distinct) will no longer be included in the Plan Performance Measurement Report but will continue to be included on the Investment Policy Monitor and be scored by CAPTRUST for their ability to achieve stated goals.
Eagle Small Cap Growth R6 78 90 86 86 91 86 88 91 91 82 85 86
DFA Emerging Markets Core Equity I 93 93 91 91 90 90 89 91 92 92 92 91
52
Investment Committee - Defined Contribution Plan - Quarterly Review
63

University of Maine System Defined Contribution Plan
Q4 16Period Ending 12.31.16 |plan investment review | performance summary
INVESTMENT NAME
CASH AND EQUIVALENTS - MONEY MARKET
CREF Money Market R3 0.04% 0.13% 0.00% 0.00% 0.00% 0.00% 0.00% 0.13% 0.04% 0.03% 0.75%
Vanguard Federal Money Market 0.08% 0.30% 0.04% 0.01% 0.02% 0.01% 0.01% 0.30% 0.12% 0.08% 0.83%
BofA ML US Treasury Bill 3 Mon USD 0.08% 0.33% 0.05% 0.03% 0.07% 0.11% 0.10% 0.33% 0.14% 0.12% 0.80%
STABLE VALUE
TIAA Traditional - Group Retirement Annuity Current Rate is 4.00%
BofA ML US Treasury Bill 3 Mon USD 0.08% 0.33% 0.05% 0.03% 0.07% 0.11% 0.10% 0.33% 0.14% 0.12% 0.80%
Hueler Stable Value Index (gross) 0.45% 1.79% 1.77% 1.69% 1.84% 2.26% 2.69% 1.79% 1.75% 1.87% 2.77%
INFLATION PROTECTED BOND
CREF Inflation-Linked Bond R3 -1.66% 4.23% -1.68% 3.34% -9.01% 6.41% 13.18% 4.23% 1.93% 0.50% 3.92%
BBgBarc US Treasury US TIPS TR USD -2.41% 4.68% -1.44% 3.64% -8.61% 6.98% 13.56% 4.68% 2.26% 0.89% 4.36%
Morningstar Inflation Protected Bond Universe -1.65% 4.63% -2.22% 2.01% -7.62% 6.35% 10.80% 4.63% 1.41% 0.42% 3.43%
INTERMEDIATE TERM BOND
Prudential Total Return Bond Q -3.01% 4.83% 0.09% 7.25% -0.91% 9.96% 7.93% 4.83% 4.01% 4.16% 5.86%
Vanguard Total Bond Market Index Adm -3.17% 2.60% 0.40% 5.89% -2.15% 4.15% 7.68% 2.60% 2.94% 2.14% 4.29%
BBgBarc Aggregate Bond Index -2.98% 2.65% 0.55% 5.97% -2.02% 4.21% 7.84% 2.65% 3.03% 2.23% 4.34%
Morningstar Intermediate Term Bond Universe -2.53% 3.24% -0.25% 5.23% -1.43% 6.66% 6.11% 3.24% 2.74% 2.68% 4.20%
WORLD ALLOCATION
CREF Social Choice R3 0.38% 7.40% -0.87% 6.83% 16.68% 10.99% 1.81% 7.40% 4.38% 8.05% 5.13%
60% MSCI World 40% BBgBarc Agg Index 0.64% 6.67% -0.09% 5.63% 17.90% 12.26% -0.92% 6.67% 4.03% 8.30% 4.40%
Morningstar World Allocation Universe -0.53% 6.07% -4.30% 1.50% 11.13% 11.68% -3.21% 6.07% 1.04% 5.40% 3.74%
*ANNUALIZED
Information from sources believed to be reliable, but not warranted by CAPTRUST to be accurate or complete. Please consult a prospectus before investing. Past performance is not indicative of futureresults. Manager and peer group returns are shown net of fees unless otherwise indicated.
16 16 2015 2014 2013 2012 2011Q4 ’ YTD ’
CONTINUED…
1 YEAR* 3 YEAR* 5 YEAR* 10 YEAR*
53
Investment Committee - Defined Contribution Plan - Quarterly Review
64

University of Maine System Defined Contribution Plan
Q4 16Period Ending 12.31.16 |plan investment review | performance summary
INVESTMENT NAME
TARGET DATE RET INCOME MODERATE
Vanguard Target Retirement Income Inv -0.99% 5.25% -0.17% 5.54% 5.87% 8.23% 5.25% 5.25% 3.50% 4.91% 4.88%
Morningstar Lifetime Moderate Income Index -0.66% 5.98% -1.30% 4.09% 6.45% 8.78% 4.13% 5.98% 2.88% 4.75% 4.80%
Retirement Income Moderate -0.87% 5.04% -1.38% 4.58% 6.61% 8.98% 2.09% 5.04% 2.78% 4.71% 3.87%
TARGET DATE 2000-2010 CONSERVATIVE
Vanguard Target Retirement 2010 Inv -1.02% 5.22% -0.20% 5.93% 9.10% 10.12% 3.37% 5.22% 3.61% 5.97% 4.61%
Morningstar Lifetime Conservative 2010 Index -1.71% 5.61% -1.48% 4.62% 3.77% 9.02% 5.51% 5.61% 2.87% 4.25% 4.90%
2000-2010 Conservative -1.38% 4.71% -0.86% 3.35% 5.17% 6.88% 1.88% 4.71% 2.56% 4.00% 3.25%
TARGET DATE 2015 MODERATE
Vanguard Target Retirement 2015 Inv -0.55% 6.16% -0.46% 6.56% 13.00% 11.37% 1.71% 6.16% 4.04% 7.22% 4.85%
Morningstar Lifetime Moderate 2015 Index -0.76% 7.10% -1.73% 5.55% 10.50% 11.49% 2.90% 7.10% 3.57% 6.48% 5.16%
2015 Moderate -0.14% 6.27% -1.40% 4.69% 11.76% 11.14% -0.32% 6.27% 3.15% 6.71% 4.05%
TARGET DATE 2020 MODERATE
Vanguard Target Retirement 2020 Inv -0.18% 6.95% -0.68% 7.11% 15.85% 12.35% 0.60% 6.95% 4.39% 8.17% 4.99%
Morningstar Lifetime Moderate 2020 Index -0.56% 7.66% -1.88% 5.87% 12.98% 12.53% 1.75% 7.66% 3.80% 7.29% 5.18%
2020 Moderate -0.11% 6.11% -1.41% 5.02% 15.48% 12.88% -1.29% 6.11% 3.22% 7.68% 3.99%
TARGET DATE 2025 MODERATE
Vanguard Target Retirement 2025 Inv 0.11% 7.48% -0.85% 7.17% 18.14% 13.29% -0.37% 7.48% 4.53% 8.86% 5.00%
Morningstar Lifetime Moderate 2025 Index -0.12% 8.39% -2.06% 6.04% 16.28% 13.67% 0.24% 8.39% 4.03% 8.27% 5.22%
2025 Moderate 0.09% 6.81% -1.41% 5.11% 17.80% 13.86% -2.15% 6.81% 3.40% 8.30% 4.27%
*ANNUALIZED
Information from sources believed to be reliable, but not warranted by CAPTRUST to be accurate or complete. Please consult a prospectus before investing. Past performance is not indicative of futureresults. Manager and peer group returns are shown net of fees unless otherwise indicated.
16 16 2015 2014 2013 2012 2011Q4 ’ YTD ’
CONTINUED…
1 YEAR* 3 YEAR* 5 YEAR* 10 YEAR*
54
Investment Committee - Defined Contribution Plan - Quarterly Review
65

University of Maine System Defined Contribution Plan
Q4 16Period Ending 12.31.16 |plan investment review | performance summary
INVESTMENT NAME
TARGET DATE 2030 CONSERVATIVE
Vanguard Target Retirement 2030 Inv 0.42% 7.85% -1.03% 7.17% 20.49% 14.24% -1.27% 7.85% 4.58% 9.50% 4.98%
Morningstar Lifetime Conservative 2030 Index -1.14% 7.73% -2.06% 6.09% 12.23% 12.89% 1.80% 7.73% 3.83% 7.24% 5.27%
2030 Conservative 0.17% 7.23% -2.01% 5.09% 15.23% 13.03% -1.24% 7.23% 3.48% 7.63% 3.74%
TARGET DATE 2035 MODERATE
Vanguard Target Retirement 2035 Inv 0.78% 8.26% -1.26% 7.24% 22.82% 15.16% -2.24% 8.26% 4.66% 10.15% 5.09%
Morningstar Lifetime Moderate 2035 Index 1.17% 10.07% -2.58% 5.80% 22.03% 15.36% -2.28% 10.07% 4.30% 9.82% 5.41%
2035 Moderate 0.60% 7.93% -1.34% 5.34% 22.06% 15.51% -3.32% 7.93% 3.90% 9.73% 4.68%
TARGET DATE 2040 MODERATE
Vanguard Target Retirement 2040 Inv 1.13% 8.73% -1.59% 7.15% 24.37% 15.56% -2.55% 8.73% 4.66% 10.51% 5.26%
Morningstar Lifetime Moderate 2040 Index 1.60% 10.61% -2.83% 5.51% 23.05% 15.71% -2.85% 10.61% 4.28% 10.06% 5.45%
2040 Moderate 0.76% 7.41% -1.43% 5.52% 23.50% 15.58% -4.37% 7.41% 3.75% 9.88% 4.56%
TARGET DATE 2045 MODERATE
Vanguard Target Retirement 2045 Inv 1.24% 8.87% -1.57% 7.16% 24.37% 15.58% -2.51% 8.87% 4.72% 10.54% 5.27%
Morningstar Lifetime Moderate 2045 Index 1.74% 10.84% -3.03% 5.25% 23.07% 15.84% -3.19% 10.84% 4.20% 10.03% 5.41%
2045 Moderate 0.98% 7.94% -1.99% 5.03% 22.01% 15.15% -4.56% 7.94% 3.62% 9.47% 4.43%
TARGET DATE 2050 MODERATE
Vanguard Target Retirement 2050 Inv 1.25% 8.85% -1.57% 7.18% 24.34% 15.58% -2.54% 8.85% 4.72% 10.54% 5.27%
Morningstar Lifetime Moderate 2050 Index 1.71% 10.89% -3.19% 5.00% 22.83% 15.94% -3.47% 10.89% 4.07% 9.93% 5.35%
2050 Moderate 0.99% 7.95% -1.79% 5.23% 23.75% 15.60% -4.92% 7.95% 3.70% 9.77% 5.12%
*ANNUALIZED
Information from sources believed to be reliable, but not warranted by CAPTRUST to be accurate or complete. Please consult a prospectus before investing. Past performance is not indicative of futureresults. Manager and peer group returns are shown net of fees unless otherwise indicated.
16 16 2015 2014 2013 2012 2011Q4 ’ YTD ’
CONTINUED…
1 YEAR* 3 YEAR* 5 YEAR* 10 YEAR*
55
Investment Committee - Defined Contribution Plan - Quarterly Review
66

University of Maine System Defined Contribution Plan
Q4 16Period Ending 12.31.16 |plan investment review | performance summary
INVESTMENT NAME
TARGET DATE 2055 MODERATE
Vanguard Target Retirement 2055 Inv 1.26% 8.88% -1.72% 7.19% 24.33% 15.58% -2.27% 8.88% 4.68% 10.51% -
Morningstar Lifetime Moderate 2055 Index 1.65% 10.90% -3.34% 4.74% 22.49% 16.00% -3.75% 10.90% 3.94% 9.79% 5.27%
2055 Moderate 1.30% 8.38% -1.55% 5.95% 23.73% 15.47% -4.54% 8.38% 4.21% 10.06% 5.38%
TARGET DATE 2060+ MODERATE
Vanguard Target Retirement 2060 Inv 1.25% 8.84% -1.68% 7.16% 24.35% - - 8.84% 4.67% - -
Morningstar Lifetime Moderate 2060 Index 1.57% 10.88% -3.48% 4.53% 22.18% 15.90% -4.11% 10.88% 3.81% 9.64% 5.29%
2060+ Moderate 1.26% 8.72% -0.89% 7.24% 24.34% - - 8.72% 4.89% - -
LARGE COMPANY VALUE
JHancock Disciplined Value R5 8.04% 14.00% -4.93% 11.03% 36.04% 20.02% 0.32% 14.00% 6.36% 14.46% 7.01%
JHancock Disciplined Value R6 8.11% 14.07% -4.81% 11.04% 35.97% 20.08% 0.41% 14.07% 6.43% 14.51% 7.04%
Russell 1000 Value 6.68% 17.34% -3.83% 13.45% 32.53% 17.51% 0.39% 17.34% 8.59% 14.80% 5.72%
Morningstar Large Value Universe 6.36% 14.70% -4.05% 10.44% 31.61% 14.70% -0.57% 14.70% 6.81% 13.02% 5.50%
LARGE COMPANY BLEND
CREF Stock R3 2.08% 9.17% -0.84% 6.41% 27.83% 17.29% -4.95% 9.17% 4.83% 11.55% 5.03%
Vanguard Institutional Index I 3.82% 11.93% 1.37% 13.65% 32.35% 15.98% 2.09% 11.93% 8.85% 14.63% 6.95%
S&P 500 Index 3.82% 11.96% 1.38% 13.69% 32.39% 16.00% 2.11% 11.96% 8.87% 14.66% 6.95%
Morningstar Large Blend Universe 3.87% 10.28% -0.88% 11.26% 31.78% 15.08% -0.67% 10.28% 6.79% 13.17% 6.14%
*ANNUALIZED
Information from sources believed to be reliable, but not warranted by CAPTRUST to be accurate or complete. Please consult a prospectus before investing. Past performance is not indicative of futureresults. Manager and peer group returns are shown net of fees unless otherwise indicated.
16 16 2015 2014 2013 2012 2011Q4 ’ YTD ’
CONTINUED…
1 YEAR* 3 YEAR* 5 YEAR* 10 YEAR*
56
Investment Committee - Defined Contribution Plan - Quarterly Review
67

University of Maine System Defined Contribution Plan
Q4 16Period Ending 12.31.16 |plan investment review | performance summary
INVESTMENT NAME
LARGE COMPANY GROWTH
Harbor Capital App Instl -1.94% -1.07% 10.99% 9.93% 37.66% 15.69% 0.61% -1.07% 6.48% 13.96% 8.01%
Harbor Capital Appreciation Retirement -1.92% -1.04% 10.99% 9.93% 37.66% 15.69% 0.61% -1.04% 6.49% 13.97% 8.02%
Russell 1000 Growth 1.01% 7.08% 5.67% 13.05% 33.48% 15.26% 2.64% 7.08% 8.55% 14.50% 8.33%
Morningstar Large Growth Universe -0.30% 3.17% 3.72% 10.06% 34.39% 15.29% -2.24% 3.17% 5.72% 12.97% 6.94%
MEDIUM COMPANY VALUE
RidgeWorth Ceredex Mid-Cap Value Eq I 7.78% 20.16% -6.00% 11.00% 31.21% 21.79% -7.31% 20.16% 7.83% 14.91% 9.13%
RidgeWorth Ceredex Mid-Cap Value Eq IS 7.87% 20.53% -5.63% 11.05% 31.21% 21.79% -7.31% 20.53% 8.10% 15.08% 9.21%
Russell Mid Cap Value 5.52% 20.00% -4.78% 14.75% 33.46% 18.51% -1.38% 20.00% 9.45% 15.70% 7.59%
Morningstar Mid Value Universe 6.75% 17.92% -5.61% 9.54% 34.84% 16.26% -3.87% 17.92% 6.77% 13.79% 6.89%
MEDIUM COMPANY BLEND
Vanguard Ext Mkt Idx Inst 5.62% 16.15% -3.24% 7.56% 38.42% 18.50% -3.57% 16.15% 6.53% 14.67% 7.99%
Russell Mid Cap 3.21% 13.80% -2.44% 13.22% 34.76% 17.28% -1.55% 13.80% 7.92% 14.72% 7.86%
Morningstar Mid Blend Universe 5.31% 14.17% -4.23% 8.74% 34.06% 16.38% -3.48% 14.17% 5.98% 13.33% 6.83%
MEDIUM COMPANY GROWTH
Goldman Sachs Growth Opp I -2.65% 1.49% -5.24% 11.44% 32.38% 19.58% -3.70% 1.49% 2.34% 11.15% 8.28%
Goldman Sachs Growth Opportunities R6 -2.69% 1.49% -5.24% 11.44% 32.38% 19.58% -3.70% 1.49% 2.34% 11.15% 8.28%
Russell Mid Cap Growth 0.46% 7.33% -0.20% 11.90% 35.74% 15.81% -1.65% 7.33% 6.23% 13.51% 7.83%
Morningstar Mid Growth Universe 0.71% 5.93% -0.75% 7.07% 35.29% 14.30% -3.91% 5.93% 4.02% 11.78% 6.96%
*ANNUALIZED
Information from sources believed to be reliable, but not warranted by CAPTRUST to be accurate or complete. Please consult a prospectus before investing. Past performance is not indicative of futureresults. Manager and peer group returns are shown net of fees unless otherwise indicated.
16 16 2015 2014 2013 2012 2011Q4 ’ YTD ’
CONTINUED…
1 YEAR* 3 YEAR* 5 YEAR* 10 YEAR*
57
Investment Committee - Defined Contribution Plan - Quarterly Review
68

University of Maine System Defined Contribution Plan
Q4 16Period Ending 12.31.16 |plan investment review | performance summary
INVESTMENT NAME
FOREIGN LARGE VALUE
MFS International Value R6 -5.66% 4.31% 6.85% 1.61% 27.80% 16.13% -1.81% 4.31% 4.23% 10.94% 5.15%
MSCI EAFE -0.68% 1.51% -0.39% -4.48% 23.29% 17.90% -11.73% 1.51% -1.15% 7.02% 1.22%
Morningstar Foreign Large Value Universe 0.14% 2.96% -3.26% -6.32% 20.59% 16.61% -12.71% 2.96% -2.41% 5.45% -0.04%
FOREIGN LARGE BLEND
Vanguard Total Intl Stock Index Inst -1.92% 4.70% -4.24% -4.15% 15.15% 18.28% -14.51% 4.70% -1.32% 5.53% 0.93%
MSCI EAFE -0.68% 1.51% -0.39% -4.48% 23.29% 17.90% -11.73% 1.51% -1.15% 7.02% 1.22%
Morningstar Foreign Large Blend Universe -2.24% 0.70% -1.50% -4.96% 19.48% 18.04% -13.62% 0.70% -2.07% 5.83% 0.57%
FOREIGN LARGE GROWTH
Oppenheimer Intl Growth I -5.33% -1.88% 3.63% -6.80% 25.71% 22.12% -7.71% -1.88% -1.78% 7.79% 3.38%
Oppenheimer Intl Growth Y -5.35% -2.06% 3.44% -6.99% 25.46% 22.10% -7.31% -2.06% -1.96% 7.62% 3.55%
MSCI EAFE -0.68% 1.51% -0.39% -4.48% 23.29% 17.90% -11.73% 1.51% -1.15% 7.02% 1.22%
Morningstar Foreign Large Growth Universe -5.71% -2.15% 0.91% -3.97% 19.74% 18.63% -12.43% -2.15% -1.80% 6.22% 1.57%
SMALL COMPANY VALUE
Victory Sycamore Small Company Opp I 13.82% 30.04% -0.39% 6.80% 33.39% 12.55% 1.52% 30.04% 11.42% 15.74% 9.25%
Russell 2000 Value 14.07% 31.74% -7.47% 4.22% 34.52% 18.05% -5.50% 31.74% 8.31% 15.07% 6.26%
Morningstar Small Value Universe 12.12% 25.68% -6.61% 3.47% 35.90% 16.06% -4.51% 25.68% 6.63% 14.02% 6.86%
SMALL COMPANY GROWTH
Eagle Small Cap Growth R6 3.08% 10.39% -0.39% 5.59% 34.70% 14.71% -1.53% 10.39% 5.10% 12.40% 8.10%
Russell 2000 Growth 3.57% 11.32% -1.38% 5.60% 43.30% 14.59% -2.91% 11.32% 5.05% 13.74% 7.76%
Morningstar Small Growth Universe 3.35% 11.25% -2.41% 2.56% 41.22% 13.51% -3.28% 11.25% 3.59% 12.29% 7.18%
*ANNUALIZED
Information from sources believed to be reliable, but not warranted by CAPTRUST to be accurate or complete. Please consult a prospectus before investing. Past performance is not indicative of futureresults. Manager and peer group returns are shown net of fees unless otherwise indicated.
16 16 2015 2014 2013 2012 2011Q4 ’ YTD ’
CONTINUED…
1 YEAR* 3 YEAR* 5 YEAR* 10 YEAR*
58
Investment Committee - Defined Contribution Plan - Quarterly Review
69

University of Maine System Defined Contribution Plan
Q4 16Period Ending 12.31.16 |plan investment review | performance summary
INVESTMENT NAME
EMERGING MARKETS
DFA Emerging Markets Core Equity I -5.10% 12.35% -14.86% -0.91% -2.64% 20.49% -20.64% 12.35% -1.77% 2.14% 3.11%
MSCI Emerging Markets -4.08% 11.60% -14.60% -1.82% -2.27% 18.63% -18.17% 11.60% -2.19% 1.64% 2.17%
Morningstar Emerging Markets Universe -5.41% 8.29% -13.75% -2.78% 0.30% 18.93% -19.52% 8.29% -3.07% 1.83% 1.40%
SPECIALTY-PRIVATE REAL ESTATE
TIAA Real Estate Account 1.25% 5.20% 8.16% 12.22% 9.65% 10.06% 13.00% 5.20% 8.49% 9.03% 3.38%
NCREIF Property Index 1.73% 7.97% 13.33% 11.81% 10.99% 10.54% 14.26% 7.97% 11.01% 10.91% 6.93%
Morningstar Specialty-Real Estate Universe -2.63% 6.53% 2.41% 28.26% 1.80% 17.57% 7.60% 6.53% 11.78% 10.89% 4.34%
*ANNUALIZED
Information from sources believed to be reliable, but not warranted by CAPTRUST to be accurate or complete. Please consult a prospectus before investing. Past performance is not indicative of futureresults. Manager and peer group returns are shown net of fees unless otherwise indicated.
16 16 2015 2014 2013 2012 2011Q4 ’ YTD ’ 1 YEAR* 3 YEAR* 5 YEAR* 10 YEAR*
59
Investment Committee - Defined Contribution Plan - Quarterly Review
70

University of Maine System Defined Contribution Plan
Q4 16Period Ending 12.31.16 |section
SECTION 4: FUND FACT SHEETS
Fund Fact Sheets…………………………………………………………………………………………………………….
4: fund fact sheets
60
Investment Committee - Defined Contribution Plan - Quarterly Review
71

-3 0
Excess Annualized Return, %
10 years
5 years
3 years
1 year
YTD
Last Qtr.
-0.05
-0.09
-0.09
-0.20
-0.20
-0.04
CREF Money Market R3Excess
Performance vs Risk - 5 Year
0
1
2
To
tal A
nn
ua
lize
d R
etu
rn, %
0.00 0.25 0.50 0.75
Total Annualized StdDev, %
CREF Money Market R390 Day US Treasury Bill Index
Performance Disclosure:The performance data quoted represents past performance and does not guarantee future results. The investment return and principal value of an investment will fluctuate thus an investor's shares, whenredeemed, may be worth more or less than their original cost. Current performance may be lower or higher than return data quoted herein. For performance data current to the most recent month-end, please call (800) 216-0645. Indexaverages are derived from Morningstar. The opinions expressed in this report are subject to change without notice. This material is not a solicitation or an offer to buy any security or to participate in any investment strategy and is notguaranteed as to accuracy. Any such solicitation must be made by prospectus only. To obtain a prospectus, please call your Financial Advisor at (800) 216-0645. CAPTRUST Financial Advisors.
CREF MoneyMarket R3
90 Day US TreasuryBill Index
TRAILING RETURNSLast Qtr. 0.04 0.09
YTD 0.13 0.33
1 Year 0.13 0.33
3 Years 0.04 0.14
5 Years 0.03 0.12
10 Years 0.75 0.80
CALENDAR RETURNS2015 0.00 0.05
2014 0.00 0.03
2013 0.00 0.07
2012 0.00 0.11
2011 0.00 0.10
2010 0.00 0.13
KEY MEASURES / 5 YEARStandard Deviation 0.02 0.04
INVESTMENT PROFILETicker -Strategy Incept Date -Prospectus Exp Ratio -12 Mo Yield -
Cumulative Performance
Dec-11 - Dec-16
99.8
100.0
100.1
100.2
100.3
100.4
100.6
100.7
100.8
Gro
wth
of
$10
0
Dec-11 Dec-12 Dec-13 Dec-14 Dec-15 Dec-16
Rolling 3 Yr Annualized Excess Return (Mar-11 - Dec-16)
-0.2
-0.1
0.0
Ex
ce
ss A
nn
ua
liz
ed
Re
turn
, %
Mar-11 Dec-11 Dec-12 Dec-13 Dec-14 Dec-15 Dec-16
Period Ending 12.31.16 I Q4 16CREF Money Market R3
INDUSTRY ANALYSIS
Money market reform passed in 2010 imposed new mandates on 2a-7 managers including shorter
average maturities, tighter restrictions on allowable securities, increased liquidity mandates and
mandatory stress testing by fund managers. In July 2014, the SEC passed further 2a-7 regulations
that mandated a floating rate NAV for some products and allowed managers, under certain
circumstances, to limit redemptions or charge a fee for withdrawals. The July regulations will have
a multi-year phase-in period,
61
Investment Committee - Defined Contribution Plan - Quarterly Review
72

Q4 16Period Ending 12.31.16 |
Important Disclosures: This slide is intended solely for institutional use. The opinions expressed in this report are subject to change without notice. The statistics and data have been compiled from sources believed to be reliable but are notguaranteed to be accurate or complete. Any performance quoted represents past performance and does not guarantee future results. Bloomberg Index averages are derived from Morningstar. This material is not a solicitation or an offer tobuy any security or to participate in any investment strategy. Any such solicitation must be made by prospectus only. For more information or to obtain a prospectus, please contact your financial advisor at 800.216.0645. CAPTRUSTFinancial Advisors.
INDUSTRY ANALYSIS
The insurance providers and industry as a whole have historically exhibited ahigh degree of sensitivity to broad financial markets. The economic and marketdownturn of 2008 and 2009 proved to be no exception as many of theseproviders watched as the assets on their balance sheets – public and private -were marked meaningfully lower. The shrinking assets resulted in deteriorationof capital ratios and reserve amounts across the industry, leading to system-wide downgrades from the ratings agencies. However, the drive in equitymarkets since the nadir in March of 2009 have presented a formidable rallyacross every major fixed income sector. As this rally strengthened the balancesheets of insurers, attention shifted away from the industry, which has now beenable to breathe a collective sigh of relief. While the insurance industry hasstaged an impressive recovery, investors should use this episode as a reminderof the risks inherent with single-insurer backed products.
GROSS CREDITING RATES - For Contributions Applied:
4/1/16 –4/30/16
5/1/16 –6/30/16
7/1/16 –7/31/16
8/1/16 –11/30/16
12/1/16 –12/31/16
4.00% 3.75% 3.50% 3.75% 4.00%
TIAA Traditional – Group Retirement Annuity (GRA)
LIQUIDITY PROVISIONS
Plan Sponsor Participant
Not applicable. Contracts are individually owned by the participant.
Lump Sum withdrawals are available within 120 days of termination of
employment with a 2.5% surrender charge.
Transfers and withdrawals can be made in 10 annual installments (paid over 9
years and 1 day) .
INVESTMENT DETAILS
Crediting Rate Details:
Current contributions are invested at the new money rate, which can change monthly but is guaranteed until the last day of February. Old Money is grouped by time period into vintages, rate on all vintages are reviewed for reset every March 1st.
Competing Options: Allowed.
Minimum Rate: 3.00% during accumulation stage and 2.50% during annuity payout stage, reset annually.
CAPTRUST ANALYSIS
Aaron Tove-White – Senior Associate | Investment ResearchThe TIAA Traditional Annuity is a guaranteed annuity account (group annuitycontract) that is backed by the financial strength and claims-paying ability ofTIAA. The product offers participants guaranteed principal and a contractuallyspecified interest rate. The contractually agreed upon minimum annual interestrate is 3%. The TIAA Board of Trustees also reserves the right each year todeclare a higher crediting rate to participants which remains effective for atwelve month period that begins each March 1.
The product has a payout structure at the participant level that varies thelength of time it takes for a participant to fully redeem . This payout structure isindividual contract-specific.
62
Investment Committee - Defined Contribution Plan - Quarterly Review
73

-3 0 3
Excess Annualized Return, %
10 years
5 years
3 years
1 year
YTD
Last Qtr.
0.03
-0.04
-0.02
-0.02
-0.02
0.00
Vanguard Federal Money MarketExcess
Performance vs Risk - 5 Year
0
1
2
To
tal A
nn
ua
lize
d R
etu
rn, %
0.00 0.25 0.50 0.75
Total Annualized StdDev, %
Vanguard Federal Money Marke90 Day US Treasury Bill Index
Performance Disclosure:The performance data quoted represents past performance and does not guarantee future results. The investment return and principal value of an investment will fluctuate thus an investor's shares, when redeemed, may be worth more or less than their original cost. Current performance may be lower or higher than return data quoted herein. For performance data current to the most recent month-end, please call (800) 216-0645. Index averages are derived from Morningstar. The opinions expressed in this report are subject to change without notice. This material is not a solicitation or an offer to buy any security or to participate in any investment strategy and is not guaranteed as to accuracy. Any such solicitation must be made by prospectus only. To obtain a prospectus, please call your Financial Advisor at (800) 216-0645. CAPTRUST Financial Advisors.
Vanguard FederalMoney Market
90 Day US TreasuryBill Index
TRAILING RETURNSLast Qtr. 0.08 0.09
YTD 0.30 0.33
1 Year 0.30 0.33
3 Years 0.12 0.14
5 Years 0.08 0.12
10 Years 0.83 0.80
CALENDAR RETURNS2015 0.04 0.05
2014 0.01 0.03
2013 0.02 0.07
2012 0.01 0.11
2011 0.01 0.10
2010 0.02 0.13
KEY MEASURES / 5 YEARStandard Deviation 0.03 0.04
INVESTMENT PROFILETicker VMFXXStrategy Incept Date 07/13/1981Prospectus Exp Ratio 0.11%12 Mo Yield 0.30%
Cumulative Performance
Dec-11 - Dec-16
99.8
100.0
100.1
100.2
100.3
100.4
100.6
100.7
100.8
Gro
wth
of
$10
0
Dec-11 Dec-12 Dec-13 Dec-14 Dec-15 Dec-16
Rolling 3 Yr Annualized Excess Return (Mar-11 - Dec-16)
-0.2
-0.1
0.0
0.1
0.2
Ex
ce
ss A
nn
ua
liz
ed
Re
turn
, %
Mar-11 Dec-11 Dec-12 Dec-13 Dec-14 Dec-15 Dec-16
Period Ending 12.31.16 I Q4 16Vanguard Federal Money Market
INDUSTRY ANALYSIS
Money market reform passed in 2010 imposed new mandates on 2a-7 managers including shorter
average maturities, tighter restrictions on allowable securities, increased liquidity mandates and
mandatory stress testing by fund managers. In July 2014, the SEC passed further 2a-7 regulations
that mandated a floating rate NAV for some products and allowed managers, under certain
circumstances, to limit redemptions or charge a fee for withdrawals. The July regulations will have
a multi-year phase-in period,
63
Investment Committee - Defined Contribution Plan - Quarterly Review
74

Style Exposure 5 Yr
-1
0
1
Du
rati
on
-1 0 1
Quality
Corp Long Bond
Corporate Int Bond
Gov Long Bond
Gov Int Bond
Performance Disclosure:The performance data quoted represents past performance and does not guarantee future results. The investment return and principal value of an investment will fluctuate thus an investor's shares, when redeemedmay be worth more or less than their original cost. Current performance may be lower or higher than return data quoted herein. For performance data current to the most recent month-end, please call (800) 216-0645. Index averages arederived from Morningstar. The opinions expressed in this report are subject to change without notice. This material is not a solicitation or an offer to buy any security or to participate in any investment strategy and is not guaranteed as toaccuracy. Any such solicitation must be made by prospectus only. To obtain a prospectus, please call your Financial Advisor at (800) 216-0645. CAPTRUST Financial Advisors.
CREF Inflation-LinkedBond R3
Peer GroupRank
BBgBarc CapitalUS TIPS Index
MorningstarInfl-Prot Bond
# ofFunds
KEY MEASURES / 5 YEAR
Standard Deviation 4.67 63% 4.76 4.40 182
Sharpe Ratio 0.08 47% 0.16 0.08 182
Alpha -0.37 50% 0.00 -0.36 182
Beta 0.97 39% 1.00 0.85 182
R-Squared 98.64 35% 100.00 84.24 182
Up Mkt Capture 93.12 38% 100.00 81.72 182
Down Mkt Capture 98.99 49% 100.00 87.20 182
Information Ratio -0.70 62% NA -0.83 182
TRAILING RETURNS
Last Qtr. -1.66 -- -2.41 -1.65 232
YTD 4.23 -- 4.68 4.63 228
1 Year 4.23 53% 4.68 4.63 228
3 Years 1.93 27% 2.26 1.41 212
5 Years 0.50 42% 0.89 0.42 182
10 Years 3.92 36% 4.36 3.43 139
CALENDAR RETURNS
2015 -1.68 36% -1.44 -2.22 236
2014 3.34 22% 3.64 2.01 235
2013 -9.01 67% -8.60 -7.62 236
2012 6.41 50% 6.98 6.35 211
2011 13.18 15% 13.56 10.80 205
2010 5.89 46% 6.31 5.83 188
-5 0 5
EXCESS ANNUALIZED RETURN %
10 years
5 years
3 years
1 year
YTD
Last Qtr.
-0.93
-0.45
-0.48
-0.39
-0.85
-0.33
-0.06
-0.45
-0.06
-0.45
0.76
0.75
CREF Inflation-Linked Bond R3Morningstar Infl-Prot Bond Average
CREF Inflation-Linked Bond R3 Period Ending 12.31.16 I Q4 16
Rolling 3 Yr Annualized Excess Return (Jan-12 - Dec-16)
-6
-5
-4
-3
-2
-1
0
1
2
3
EX
CE
SS
AN
NU
AL
IZE
D R
ET
UR
N, %
Jan-12 Sep-12 Sep-13 Sep-14 Sep-15 Dec-16
Performance vs Risk 5 Yr
0
5
TO
TA
L A
NN
UA
LIZ
ED
RE
TU
RN
, %
0 5 10
TOTAL ANNUALIZED STD DEV, %
Morningstar Infl-Prot Bond AverageCREF Inflation-Linked Bond R3BBgBarc Capital US TIPS Index
5 Yr Cumulative Performance (Jan-12 - Dec-16)
949596979899
100101102103104105106
GR
OW
TH O
F $1
00
Jan-12 Dec-12 Jun-13 Dec-13 Jun-14 Dec-14 Jun-15 Dec-15 Jun-16 Dec-16
64
Investment Committee - Defined Contribution Plan - Quarterly Review
75

Style Exposure 5 Yr
-1
0
1
Du
rati
on
-1 0 1
Quality
Corp Long Bond
Corporate Int Bond
Gov Long Bond
Gov Int Bond
Performance Disclosure:The performance data quoted represents past performance and does not guarantee future results. The investment return and principal value of an investment will fluctuate thus an investor's shares, when redeemed,may be worth more or less than their original cost. Current performance may be lower or higher than return data quoted herein. For performance data current to the most recent month-end, please call (800) 216-0645. Index averages arederived from Morningstar. The opinions expressed in this report are subject to change without notice. This material is not a solicitation or an offer to buy any security or to participate in any investment strategy and is not guaranteed as toaccuracy. Any such solicitation must be made by prospectus only. To obtain a prospectus, please call your Financial Advisor at (800) 216-0645. CAPTRUST Financial Advisors.
Prudential TotalReturn Bond Q
Peer GroupRank
BBgBarc US AggBond TR USD
MorningstarInterm Bond
# ofFunds
KEY MEASURES / 5 YEAR
Standard Deviation 3.78 96% 2.91 2.98 900
Sharpe Ratio 1.07 22% 0.73 0.87 900
Alpha 1.51 16% 0.00 0.61 900
Beta 1.20 2% 1.00 0.93 900
R-Squared 84.89 61% 100.00 83.52 900
Up Mkt Capture 143.47 1% 100.00 102.05 900
Down Mkt Capture 108.33 86% 100.00 87.95 900
Information Ratio 1.19 9% NA 0.19 900
TRAILING RETURNS
Last Qtr. -3.01 -- -2.98 -2.53 1011
YTD 4.83 -- 2.65 3.24 995
1 Year 4.83 13% 2.65 3.24 995
3 Years 4.01 5% 3.03 2.74 947
5 Years 4.16 5% 2.23 2.68 900
10 Years 5.86 3% 4.34 4.20 796
CALENDAR RETURNS
2015 0.09 45% 0.55 -0.25 998
2014 7.25 5% 5.97 5.23 1039
2013 -0.91 28% -2.02 -1.43 1052
2012 9.96 8% 4.21 6.66 1093
2011 7.93 8% 7.84 6.11 1130
2010 9.73 15% 6.54 7.67 1180
INVESTMENT PROFILETicker PTRQXCUSIP 74440B884Net Assets $MM $19,150.00Manager Names Team ManagedManager Tenure 14.2 YearsProspectus Exp Ratio 0.43%Cat Median Exp Ratio 0.80%Current 12b-1 N/AAnnlzd Ret Since Incept 4.87%Inception Date 12/27/2010Phone Number 800-225-1852Sub Advisor PGIM
FixedIncome
TOP HOLDINGSUS 5 Year Note (CBT) Ma 23.71%US Ultra Bond (CBT) Mar1 5.60%US 10 Year Note (CBT) Ma 5.05%Payb Fra 1.6 12072016 2.88%Recv Fra 2.86 12072016 2.88%
HOLDINGS OVERVIEWTotal Number of Holdings 2451% Assets in Top 10 Holdings 54.17%Avg Mkt Cap $MM N/ATurnover Ratio 102.00%
-5 0 5
EXCESS ANNUALIZED RETURN %
10 years
5 years
3 years
1 year
YTD
Last Qtr.
-0.14
1.51
0.45
1.93
-0.29
0.98
0.60
2.18
0.60
2.18
0.45
-0.03
Prudential Total Return Bond QMorningstar Interm Bond Average
Prudential Total Return Bond Q Period Ending 12.31.16 I Q4 16
Rolling 3 Yr Annualized Excess Return (Mar-11 - Dec-16)
-4
-2
0
2
4
6
8
EX
CE
SS
AN
NU
AL
IZE
D R
ET
UR
N, %
Mar-11 Dec-11 Jun-12 Dec-12 Jun-13 Dec-13 Jun-14 Dec-14 Jun-15 Dec-15 Jun-16 Dec-16
Performance vs Risk 5 Yr
0
5
10
TO
TA
L A
NN
UA
LIZ
ED
RE
TU
RN
, %
0 5
TOTAL ANNUALIZED STD DEV, %
Morningstar Interm Bond AveragePrudential Total Return Bond QBBgBarc US Agg Bond TR USD
65
Investment Committee - Defined Contribution Plan - Quarterly Review
76

Style Exposure 5 Yr
-1
0
1
Du
rati
on
-1 0 1
Quality
Corp Long Bond
Corporate Int Bond
Gov Long Bond
Gov Int Bond
Performance Disclosure:The performance data quoted represents past performance and does not guarantee future results. The investment return and principal value of an investment will fluctuate thus an investor's shares, when redeemed, may be worth more or less than their original cost. Current performance may be lower or higher than return data quoted herein. For performance data current to the most recent month-end, please call (800) 216-0645. Index averages are derived from Morningstar. The opinions expressed in this report are subject to change without notice. This material is not a solicitation or an offer to buy any security or to participate in any investment strategy and is not guaranteed as to accuracy. Any such solicitation must be made by prospectus only. To obtain a prospectus, please call your Financial Advisor at (800) 216-0645. CAPTRUST Financial Advisors.
Vanguard Total BondMarket Index Adm
Peer GroupRank
BBgBarc US AggFloat Adj TR USD
MorningstarInterm Bond
# ofFunds
KEY MEASURES / 5 YEAR
Standard Deviation 3.05 63% 2.96 2.98 900
Sharpe Ratio 0.66 77% 0.72 0.87 900
Alpha -0.16 81% 0.00 0.63 900
Beta 1.03 13% 1.00 0.91 900
R-Squared 99.43 3% 100.00 83.52 900
Up Mkt Capture 101.22 54% 100.00 100.53 900
Down Mkt Capture 105.44 85% 100.00 85.95 900
Information Ratio -0.40 82% NA 0.20 900
TRAILING RETURNS
Last Qtr. -3.17 -- -3.05 -2.53 1011
YTD 2.60 -- 2.75 3.24 995
1 Year 2.60 64% 2.75 3.24 995
3 Years 2.94 41% 2.99 2.74 947
5 Years 2.14 73% 2.24 2.68 900
10 Years 4.29 52% NA 4.20 796
CALENDAR RETURNS
2015 0.40 28% 0.44 -0.25 998
2014 5.89 32% 5.85 5.23 1039
2013 -2.15 67% -1.97 -1.43 1052
2012 4.15 84% 4.32 6.66 1093
2011 7.68 13% 7.92 6.11 1130
2010 6.54 72% 6.58 7.67 1180
INVESTMENT PROFILETicker VBTLXCUSIP 921937603Net Assets $MM $171,815.00Manager Names Team ManagedManager Tenure 3.9 YearsProspectus Exp Ratio 0.06%Cat Median Exp Ratio 0.80%Current 12b-1 N/AAnnlzd Ret Since Incept 4.24%Inception Date 11/12/2001Phone Number 800-662-7447Sub Advisor N/A
TOP HOLDINGSGinnie Mae Jumbos TBA 3.5 0.65%Fed Natl Mort Assc 3% 0.61%US Treasury Note 2.125% 0.54%US Treasury Note 1% 0.48%Ginnie Mae Jumbos TBA 3% 0.47%
HOLDINGS OVERVIEWTotal Number of Holdings 17609% Assets in Top 10 Holdings 4.92%Avg Mkt Cap $MM N/ATurnover Ratio 10.86%
-5 0 5
EXCESS ANNUALIZED RETURN %
10 years
5 years
3 years
1 year
YTD
Last Qtr.
0.44
-0.10
-0.25
-0.05
0.49
-0.16
0.49
-0.16
0.52
-0.11
Vanguard Total Bond Market Index AdmMorningstar Interm Bond Average
Vanguard Total Bond Market Index Adm Period Ending 12.31.16 I Q4 16
Rolling 3 Yr Annualized Excess Return (Mar-11 - Dec-16)
-2
-1
0
1
2
3
4
5
EX
CE
SS
AN
NU
AL
IZE
D R
ET
UR
N, %
Mar-11 Dec-11 Jun-12 Dec-12 Jun-13 Dec-13 Jun-14 Dec-14 Jun-15 Dec-15 Jun-16 Dec-16
Performance vs Risk 5 Yr
0
5
TO
TA
L A
NN
UA
LIZ
ED
RE
TU
RN
, %
0 5
TOTAL ANNUALIZED STD DEV, %
Morningstar Interm Bond AverageVanguard Total Bond Market Index AdmBBgBarc US Agg Float Adj TR USD
66
Investment Committee - Defined Contribution Plan - Quarterly Review
77

Style Exposure 5 Yr
-1
0
1
Fo
reig
n -
Do
me
sti
c
-1 0 1
Fixed - Equity
US Bonds
Int'l Bonds
US Equity
Int'l Equity
Performance Disclosure:The performance data quoted represents past performance and does not guarantee future results. The investment return and principal value of an investment will fluctuate thus an investor's shares, when redeemedmay be worth more or less than their original cost. Current performance may be lower or higher than return data quoted herein. For performance data current to the most recent month-end, please call (800) 216-0645. Index averages arederived from Morningstar. The opinions expressed in this report are subject to change without notice. This material is not a solicitation or an offer to buy any security or to participate in any investment strategy and is not guaranteed as toaccuracy. Any such solicitation must be made by prospectus only. To obtain a prospectus, please call your Financial Advisor at (800) 216-0645. CAPTRUST Financial Advisors.
CREF SocialChoice R3
Peer GroupRank
60% MSCI World 40%BBgBarc Agg Bond Index
MorningstarWorld Alloc
# ofFunds
KEY MEASURES / 5 YEAR
Standard Deviation 6.45 9% 6.78 8.20 370
Sharpe Ratio 1.23 1% 1.10 0.67 370
Alpha 0.95 3% 0.00 -3.03 370
Beta 0.93 86% 1.00 1.11 370
R-Squared 96.12 4% 100.00 85.80 370
Up Mkt Capture 98.49 53% 100.00 98.51 370
Down Mkt Capture 90.31 6% 100.00 129.89 370
Information Ratio 0.31 3% NA -0.65 370
TRAILING RETURNS
Last Qtr. 0.38 -- -0.01 -0.53 501
YTD 7.40 -- 6.09 6.07 489
1 Year 7.40 25% 6.09 6.07 489
3 Years 4.38 3% 4.01 1.04 438
5 Years 8.05 8% 7.61 5.40 370
10 Years 5.13 10% 4.74 3.74 244
CALENDAR RETURNS
2015 -0.87 17% 0.26 -4.30 496
2014 6.83 5% 5.77 1.50 493
2013 16.68 25% 14.83 11.13 484
2012 10.99 63% 11.70 11.68 454
2011 1.81 14% 0.32 -3.21 384
2010 11.95 40% 10.57 11.23 362
-5 0 5
EXCESS ANNUALIZED RETURN %
10 years
5 years
3 years
1 year
YTD
Last Qtr.
-1.00
0.39
-2.21
0.44
-2.96
0.38
-0.02
1.31
-0.02
1.31
-0.52
0.39
CREF Social Choice R3Morningstar World Alloc Average
CREF Social Choice R3 Period Ending 12.31.16 I Q4 16
Rolling 3 Yr Annualized Excess Return (Jan-12 - Dec-16)
-12
-10
-8
-6
-4
-2
0
2
4
6
EX
CE
SS
AN
NU
AL
IZE
D R
ET
UR
N, %
Jan-12 Sep-12 Sep-13 Sep-14 Sep-15 Dec-16
Performance vs Risk 5 Yr
0
5
10
TO
TA
L A
NN
UA
LIZ
ED
RE
TU
RN
, %
0 5 10
TOTAL ANNUALIZED STD DEV, %
Morningstar World Alloc AverageCREF Social Choice R360% MSCI World 40% BBgBarc Agg Bond Index
5 Yr Cumulative Performance (Jan-12 - Dec-16)
95
100
105
110
115
120
125
130
135
140
145
GR
OW
TH O
F $1
00
Jan-12 Dec-12 Jun-13 Dec-13 Jun-14 Dec-14 Jun-15 Dec-15 Jun-16 Dec-16
67
Investment Committee - Defined Contribution Plan - Quarterly Review
78

Investment Profile
Important Disclosures: This slide is intended solely for institutional use. The opinions expressed in this report are subject to change without notice. The statistics and data have been compiled from sourcesbelieved to be reliable but are not guaranteed to be accurate or complete. Any performance quoted represents past performance and does not guarantee future results. Index averages are derived fromMorningstar. This material is not a solicitation or an offer to buy any security or to participate in any investment strategy. Any such solicitation must be made by prospectus only. For more information or toobtain a prospectus, please contact your financial advisor at 800.216.0645. CAPTRUST Financial Advisors.
Glidepath Management • Through retirement (assumed at age 65) ending 7 years after retirement
Assumed Investor Savings Rate:
• Contributions start at 5% at age 25 and increase to 10% at age 65. Also includes a 50% employer match up to 3% of salary.
Assumed Investor Income Growth Rate • 1.1% annual salary growth
Income Replacement • The portfolios are designed to provide withdrawals in retirement based on multiples of an investor’s age 65 salary.
Assumed Accumulated Savings at Retirement • N/A
Life Expectancy • Through age 95
Asset Allocation Flexibility • Strict targets with narrow ranges.
Other Assumptions • Glidepath was tested against 10,000 potential lifetime return outcomes
KEY FACTORS AND ASSUMPTIONS
Vintage Year
Eq
uity
Wei
ght
Vanguard Target Retirement
Dedicated Asset Class Granularity/Diversification
Emerging Market Equities No
International/Global Debt Yes
Inflation-Protected Securities Yes
High Yield Fixed Income No
Real Estate No
Commodities No
Investor Assumptions/Glidepath Methodology
KEY FACTORS AND ASSUMPTIONSTarget Asset Allocation Glidepath per Vintage Year
% Open Architecture: 0%
Inception Date: 10-27-2003
Net Assets $MM: $193,375
Manager Name: Team
Avg # of Holdings: 5
Active/Passive: Passive
% Active: 0%
Manager Tenure: 3.92 years (longest)
Expense Range: 0.14% - 0.16%
Investment Structure: Mutual Fund
Vanguard uses a proprietary capital markets modeling tool to statistically analyze historical data, including interest rates, inflation, and other risk factors for global equities, fixed income, and commodity markets. This tool is used to generate forward-looking distributions of expected returns. Then, by combining these figures with their investor assumptions, Vanguard constructs target portfolios with asset allocations that seek to provide the highest probability of a successful outcome (not outliving retirement savings).
The Vanguard Target Retirement funds allocate to five broad index funds that provide comprehensive exposure to U.S. and non-U.S. equity and bond markets. Using index funds allows Vanguard to provide investment diversification at a low cost while also producing returns in line with equity and fixed income markets. Through its five index funds, the strategies gain exposure to over 25 sub-asset classes, capturing over 90% of the world’s investable market.
Period Ending 12.31.16 I Q4 16
68
Investment Committee - Defined Contribution Plan - Quarterly Review
79

Vanguard Target Retirement
2006: • Increased minimum equity allocation from 20% to 30%• Added Emerging Markets EquityRationale:• Participant behavior showed lower savings rate• Decreased costs within the EM space led to increased
liquidity
2010:• Collapsed three international equity index funds (Europe,
Pacific, and Emerging Markets) with Vanguard Total International Stock Index
Rationale:• More cost-effective way to gain international exposure
2013:• Replaced the broad TIPs fund with a short-term TIPs
allocation• Eliminated the Prime Money Market fund• Added a 20% International Bond Index AllocationRationale:• Short-Term TIPs provide better inflation exposure with
lower interest rate risk• Deemed to be an unnecessary asset class• Dedicated exposure to move more in line with the Global
fixed income Market Cap; better FI diversification
2015:• Increased international stock allocation from 30% to 40%• Increased International bond allocation from 20% to 30%Rationale:• Move to be more in line with the Global Market Cap
*All information provided by the asset manager, as of 12/31/15. Asset allocations shown are static in nature and do not incorporate any tactical views implemented by the manager.
KEY FACTORS AND ASSUMPTIONSMaterial Changes to the Series Equity Exposure
Fixed Income Exposure
Vintage Years
Vintage Years
Important Disclosures: This slide is intended solely for institutional use. The opinions expressed in this report are subject to change without notice. The statistics and data have been compiled from sourcesbelieved to be reliable but are not guaranteed to be accurate or complete. Any performance quoted represents past performance and does not guarantee future results. Index averages are derived fromMorningstar. This material is not a solicitation or an offer to buy any security or to participate in any investment strategy. Any such solicitation must be made by prospectus only. For more information or toobtain a prospectus, please contact your financial advisor at 800.216.0645. CAPTRUST Financial Advisors.
Period Ending 12.31.16 I Q4 16
69
Investment Committee - Defined Contribution Plan - Quarterly Review
80

Target Date Analysis
Important Disclosures: This slide is intended solely for institutional use. The opinions expressed in this report are subject to change without notice. The statistics and data have been compiled from sources believed to be reliable but are not guaranteed to be accurate or complete. Any performance quoted represents past performance and does not guarantee future results. Index averages are derived from Morningstar. This material is not a solicitation or an offer to buy any security or to participate in any investment strategy. Any such solicitation must be made by prospectus only. For more information or to obtain a prospectus, please contact your financial advisor at 800.216.0645. CAPTRUST Financial Advisors.
3 Year 5 Year
Beta Sharpe Up Capture Down Capture Beta Sharpe Up Capture Down Capture
Vanguard Target Retirement 2015 Inv 0.99 0.71 99.55 97.27 1.00 1.23 102.09 96.60
Morningstar Target Date 2015 0.96 0.54 91.28 101.66 0.96 1.04 91.62 99.33
S&P Target Date 2015 TR 1.00 0.69 100.00 100.00 1.00 1.17 100.00 100.00
Period Ending 12.31.16 I Q4 16
3 Year 5 Year
Beta Sharpe Up Capture Down Capture Beta Sharpe Up Capture Down Capture
Vanguard Target Retirement 2025 Inv 1.02 0.60 102.91 101.57 1.01 1.16 102.99 99.44
Morningstar Target Date 2025 1.00 0.45 94.30 103.95 0.98 1.02 95.01 101.15
S&P Target Date 2025 TR 1.00 0.59 100.00 100.00 1.00 1.12 100.00 100.00
3 Year 5 Year
Beta Sharpe Up Capture Down Capture Beta Sharpe Up Capture Down Capture
Vanguard Target Retirement 2045 Inv 1.04 0.47 102.34 104.05 1.02 1.07 102.21 101.80
Morningstar Target Date 2045 1.04 0.37 97.21 106.13 1.02 0.97 97.43 103.33
S&P Target Date 2045 TR 1.00 0.50 100.00 100.00 1.00 1.07 100.00 100.00
*Lowest cost share class shown
70
Investment Committee - Defined Contribution Plan - Quarterly Review
81

Style Exposure 5 Yr
-1
0
1
Sm
all
- L
arg
e
-1 0 1
Value - Growth
Sm GrowthSm Value
Lg GrowthLg Value
Performance Disclosure:The performance data quoted represents past performance and does not guarantee future results. The investment return and principal value of an investment will fluctuate thus an investor's shares, when redeemed,may be worth more or less than their original cost. Current performance may be lower or higher than return data quoted herein. For performance data current to the most recent month-end, please call (800) 216-0645. Index averages arederived from Morningstar. The opinions expressed in this report are subject to change without notice. This material is not a solicitation or an offer to buy any security or to participate in any investment strategy and is not guaranteed as toaccuracy. Any such solicitation must be made by prospectus only. To obtain a prospectus, please call your Financial Advisor at (800) 216-0645. CAPTRUST Financial Advisors.
JHancock DisciplinedValue R5
Peer GroupRank
Russell 1000Value TR USD
MorningstarLarge Value
# ofFunds
KEY MEASURES / 5 YEAR
Standard Deviation 11.73 74% 10.61 10.98 1073
Sharpe Ratio 1.22 44% 1.38 1.18 1073
Alpha -1.37 46% 0.00 -1.61 1073
Beta 1.07 26% 1.00 0.99 1073
R-Squared 93.69 48% 100.00 91.24 1073
Up Mkt Capture 102.24 17% 100.00 93.35 1073
Down Mkt Capture 107.84 67% 100.00 101.72 1073
Information Ratio -0.10 18% NA -0.54 1073
TRAILING RETURNS
Last Qtr. 8.04 -- 6.68 6.36 1251
YTD 14.00 -- 17.34 14.70 1241
1 Year 14.00 54% 17.34 14.70 1241
3 Years 6.36 66% 8.59 6.81 1154
5 Years 14.46 18% 14.80 13.02 1073
10 Years 7.01 13% 5.72 5.50 942
CALENDAR RETURNS
2015 -4.93 68% -3.83 -4.05 1254
2014 11.03 46% 13.45 10.44 1256
2013 36.04 13% 32.53 31.61 1232
2012 20.02 5% 17.51 14.70 1266
2011 0.32 41% 0.39 -0.57 1318
2010 13.08 57% 15.51 14.04 1376
INVESTMENT PROFILETicker JDVVXCUSIP 47803U517Net Assets $MM $14,344.00Manager Names Team ManagedManager Tenure 20.0 YearsProspectus Exp Ratio 0.77%Cat Median Exp Ratio 1.12%Current 12b-1 0.00%Annlzd Ret Since Incept 14.62%Inception Date 05/22/2009Phone Number 888-972-8696Sub Advisor Robeco
InvestmentManagement, Inc
TOP HOLDINGSJohnson & Johnson 4.52%JPMorgan Chase & Co 4.49%Berkshire Hathaway Inc B 3.66%Bank of America Corporat 2.96%Chevron Corp 2.68%
HOLDINGS OVERVIEWTotal Number of Holdings 90% Assets in Top 10 Holdings 29.11%Avg Mkt Cap $MM $52,045.93Turnover Ratio 61.00%
-5 0 5
EXCESS ANNUALIZED RETURN %
10 years
5 years
3 years
1 year
YTD
Last Qtr.
-0.23
1.29
-1.78
-0.34
-1.78
-2.22
-2.64
-3.34
-2.64
-3.34
-0.32
1.36
JHancock Disciplined Value R5Morningstar Large Value Average
JHancock Disciplined Value R5 Period Ending 12.31.16 I Q4 16
Rolling 3 Yr Annualized Excess Return (Mar-11 - Dec-16)
-8
-6
-4
-2
0
2
4
6
8
EX
CE
SS
AN
NU
AL
IZE
D R
ET
UR
N, %
Mar-11 Dec-11 Jun-12 Dec-12 Jun-13 Dec-13 Jun-14 Dec-14 Jun-15 Dec-15 Jun-16 Dec-16
Performance vs Risk 5 Yr
0
5
10
15
20
TO
TA
L A
NN
UA
LIZ
ED
RE
TU
RN
, %
0 5 10 15
TOTAL ANNUALIZED STD DEV, %
Morningstar Large Value AverageJHancock Disciplined Value R5Russell 1000 Value TR USD
71
Investment Committee - Defined Contribution Plan - Quarterly Review
82

Style Exposure 5 Yr
-1
0
1
Sm
all
- L
arg
e
-1 0 1
Value - Growth
Sm GrowthSm Value
Lg GrowthLg Value
Performance Disclosure:The performance data quoted represents past performance and does not guarantee future results. The investment return and principal value of an investment will fluctuate thus an investor's shares, when redeemed,may be worth more or less than their original cost. Current performance may be lower or higher than return data quoted herein. For performance data current to the most recent month-end, please call (800) 216-0645. Index averages arederived from Morningstar. The opinions expressed in this report are subject to change without notice. This material is not a solicitation or an offer to buy any security or to participate in any investment strategy and is not guaranteed as toaccuracy. Any such solicitation must be made by prospectus only. To obtain a prospectus, please call your Financial Advisor at (800) 216-0645. CAPTRUST Financial Advisors.
JHancock DisciplinedValue R6
Peer GroupRank
Russell 1000Value TR USD
MorningstarLarge Value
# ofFunds
KEY MEASURES / 5 YEAR
Standard Deviation 11.74 75% 10.61 10.98 1073
Sharpe Ratio 1.23 43% 1.38 1.18 1073
Alpha -1.34 45% 0.00 -1.61 1073
Beta 1.07 25% 1.00 0.99 1073
R-Squared 93.68 48% 100.00 91.24 1073
Up Mkt Capture 102.41 17% 100.00 93.35 1073
Down Mkt Capture 107.79 67% 100.00 101.72 1073
Information Ratio -0.09 17% NA -0.54 1073
TRAILING RETURNS
Last Qtr. 8.11 -- 6.68 6.36 1251
YTD 14.07 -- 17.34 14.70 1241
1 Year 14.07 53% 17.34 14.70 1241
3 Years 6.43 64% 8.59 6.81 1154
5 Years 14.51 17% 14.80 13.02 1073
10 Years 7.04 12% 5.72 5.50 942
CALENDAR RETURNS
2015 -4.81 67% -3.83 -4.05 1254
2014 11.04 46% 13.45 10.44 1256
2013 35.97 14% 32.53 31.61 1232
2012 20.08 5% 17.51 14.70 1266
2011 0.41 40% 0.39 -0.57 1318
2010 13.12 56% 15.51 14.04 1376
INVESTMENT PROFILETicker JDVWXCUSIP 47803U418Net Assets $MM $14,344.00Manager Names Team ManagedManager Tenure 20.0 YearsProspectus Exp Ratio 0.70%Cat Median Exp Ratio 1.12%Current 12b-1 0.00%Annlzd Ret Since Incept 14.41%Inception Date 08/31/2011Phone Number 888-972-8696Sub Advisor Robeco
InvestmentManagement, Inc
TOP HOLDINGSJohnson & Johnson 4.52%JPMorgan Chase & Co 4.49%Berkshire Hathaway Inc B 3.66%Bank of America Corporat 2.96%Chevron Corp 2.68%
HOLDINGS OVERVIEWTotal Number of Holdings 90% Assets in Top 10 Holdings 29.11%Avg Mkt Cap $MM $52,045.93Turnover Ratio 61.00%
-5 0 5
EXCESS ANNUALIZED RETURN %
10 years
5 years
3 years
1 year
YTD
Last Qtr.
-0.23
1.32
-1.78
-0.29
-1.78
-2.15
-2.64
-3.27
-2.64
-3.27
-0.32
1.43
JHancock Disciplined Value R6Morningstar Large Value Average
JHancock Disciplined Value R6 Period Ending 12.31.16 I Q4 16
Rolling 3 Yr Annualized Excess Return (Mar-11 - Dec-16)
-8
-6
-4
-2
0
2
4
6
8
EX
CE
SS
AN
NU
AL
IZE
D R
ET
UR
N, %
Mar-11 Dec-11 Jun-12 Dec-12 Jun-13 Dec-13 Jun-14 Dec-14 Jun-15 Dec-15 Jun-16 Dec-16
Performance vs Risk 5 Yr
0
5
10
15
20
TO
TA
L A
NN
UA
LIZ
ED
RE
TU
RN
, %
0 5 10 15
TOTAL ANNUALIZED STD DEV, %
Morningstar Large Value AverageJHancock Disciplined Value R6Russell 1000 Value TR USD
72
Investment Committee - Defined Contribution Plan - Quarterly Review
83

Style Exposure 5 Yr
-1
0
1
Sm
all -
Larg
e
-1 0 1
Value - Growth
Sm GrowthSm Value
Lg GrowthLg Value
Performance Disclosure:The performance data quoted represents past performance and does not guarantee future results. The investment return and principal value of an investment will fluctuate thus an investor's shares, when redeemed, may be worth more or less than their original cost. Current performance may be lower or higher than return data quoted herein. For performance data current to the most recent month-end, please call (800) 216-0645. Index averages are derived from Morningstar. The opinions expressed in this report are subject to change without notice. This material is not a solicitation or an offer to buy any security or to participate in any investment strategy and is not guaranteed as to accuracy. Any such solicitation must be made by prospectus only. To obtain a prospectus, please call your Financial Advisor at (800) 216-0645. CAPTRUST Financial Advisors.
CREFStock R3
Peer GroupRank
CREF StockCustom Bmk
Morningstar LargeBlend Universe
# ofFunds
KEY MEASURES / 5 YEAR
Standard Deviation 11.02 63% 10.93 10.88 1221
Sharpe Ratio 1.04 85% 1.09 1.20 1221
Alpha -0.54 90% 0.00 1.82 1221
Beta 1.01 18% 1.00 0.94 1221
R-Squared 99.58 1% 100.00 90.08 1221
Up Mkt Capture 99.31 70% 100.00 101.81 1221
Down Mkt Capture 102.69 82% 100.00 93.42 1221
Information Ratio -0.59 96% NA 0.35 1221
TRAILING RETURNS
Last Qtr. 2.08 -- 2.51 3.87 1401
YTD 9.17 -- 10.41 10.28 1378
1 Year 9.17 68% 10.41 10.28 1378
3 Years 4.83 85% 5.58 6.79 1304
5 Years 11.55 83% 12.01 13.17 1221
10 Years 5.03 85% 5.52 6.14 1079
CALENDAR RETURNS
2015 -0.84 56% -0.89 -0.88 1421
2014 6.41 94% 7.55 11.26 1466
2013 27.83 88% 28.23 31.78 1478
2012 17.29 18% 16.85 15.08 1553
2011 -4.95 88% -3.65 -0.67 1648
2010 15.74 23% 15.89 14.02 1755
-5 0 5
EXCESS ANNUALIZED RETURN %
10 years
5 years
3 years
1 year
YTD
Last Qtr.
0.63
-0.48
1.16
-0.47
1.22
-0.75
-0.13
-1.24
-0.13
-1.24
1.36
-0.42
CREF Stock R3Morningstar Large Blend Universe Average
CREF Stock R3 Period Ending 12.31.16 I Q4 16
Rolling 3 Yr Annualized Excess Return (Jan-12 - Dec-16)
-6-5-4-3-2-1012345
EX
CESS A
NN
UA
LIZ
ED
RETU
RN
, %
Jan-12 Sep-12 Sep-13 Sep-14 Sep-15 Dec-16
Performance vs Risk 5 Yr
0
5
10
15
20
TO
TA
L A
NN
UA
LIZ
ED
RETU
RN
, %
0 5 10 15
TOTAL ANNUALIZED STD DEV, %
Morningstar Large Blend Universe AverageCREF Stock R3CREF Stock Custom Bmk
5 Yr Cumulative Performance (Jan-12 - Dec-16)
90
100
110
120
130
140
150
160
170
180
GR
OW
TH O
F $1
00
Jan-12 Dec-12 Jun-13 Dec-13 Jun-14 Dec-14 Jun-15 Dec-15 Jun-16 Dec-16
73
Investment Committee - Defined Contribution Plan - Quarterly Review
84

Style Exposure 5 Yr
-1
0
1
Sm
all
- L
arg
e
-1 0 1
Value - Growth
Sm GrowthSm Value
Lg GrowthLg Value
Performance Disclosure:The performance data quoted represents past performance and does not guarantee future results. The investment return and principal value of an investment will fluctuate thus an investor's shares, when redeemed, may be worth more or less than their original cost. Current performance may be lower or higher than return data quoted herein. For performance data current to the most recent month-end, please call (800) 216-0645. Index averages are derived from Morningstar. The opinions expressed in this report are subject to change without notice. This material is not a solicitation or an offer to buy any security or to participate in any investment strategy and is not guaranteed as to accuracy. Any such solicitation must be made by prospectus only. To obtain a prospectus, please call your Financial Advisor at (800) 216-0645. CAPTRUST Financial Advisors.
Vanguard InstitutionalIndex I
Peer GroupRank
S&P 500TR USD
MorningstarLarge Blend
# ofFunds
KEY MEASURES / 5 YEAR
Standard Deviation 10.36 24% 10.37 10.88 1221
Sharpe Ratio 1.40 5% 1.40 1.20 1221
Alpha -0.03 9% 0.00 -1.68 1221
Beta 1.00 62% 1.00 1.01 1221
R-Squared 100.00 1% 100.00 93.44 1221
Up Mkt Capture 99.92 31% 100.00 96.53 1221
Down Mkt Capture 100.08 21% 100.00 106.61 1221
Information Ratio -1.87 90% NA -1.25 1221
TRAILING RETURNS
Last Qtr. 3.82 -- 3.82 3.87 1401
YTD 11.93 -- 11.96 10.28 1378
1 Year 11.93 26% 11.96 10.28 1378
3 Years 8.85 6% 8.87 6.79 1304
5 Years 14.63 16% 14.66 13.17 1221
10 Years 6.95 22% 6.95 6.14 1079
CALENDAR RETURNS
2015 1.37 20% 1.38 -0.88 1421
2014 13.65 18% 13.69 11.26 1466
2013 32.35 42% 32.39 31.78 1478
2012 15.98 36% 16.00 15.08 1553
2011 2.09 18% 2.11 -0.67 1648
2010 15.05 30% 15.06 14.02 1755
INVESTMENT PROFILETicker VINIXCUSIP 922040100Net Assets $MM $211,496.00Manager Names Team ManagedManager Tenure 16.0 YearsProspectus Exp Ratio 0.04%Cat Median Exp Ratio 1.13%Current 12b-1 N/AAnnlzd Ret Since Incept 9.50%Inception Date 07/31/1990Phone Number 888-809-8102Sub Advisor N/A
TOP HOLDINGSApple Inc 3.12%Microsoft Corp 2.46%Exxon Mobil Corp 1.90%Johnson & Johnson 1.60%Amazon.com Inc 1.55%
HOLDINGS OVERVIEWTotal Number of Holdings 517% Assets in Top 10 Holdings 17.77%Avg Mkt Cap $MM $78,275.41Turnover Ratio 8.33%
-5 0 5
EXCESS ANNUALIZED RETURN %
10 years
5 years
3 years
1 year
YTD
Last Qtr.
-0.80
0.00
-1.49
-0.03
-2.08
-0.03
-1.68
-0.03
-1.68
-0.03
0.05
-0.01
Vanguard Institutional Index IMorningstar Large Blend Average
Vanguard Institutional Index I Period Ending 12.31.16 I Q4 16
Rolling 3 Yr Annualized Excess Return (Mar-11 - Dec-16)
-6-5-4-3-2-1012345
EX
CE
SS
AN
NU
AL
IZE
D R
ET
UR
N, %
Mar-11 Dec-11 Jun-12 Dec-12 Jun-13 Dec-13 Jun-14 Dec-14 Jun-15 Dec-15 Jun-16 Dec-16
Performance vs Risk 5 Yr
0
5
10
15
20
TO
TA
L A
NN
UA
LIZ
ED
RE
TU
RN
, %
0 5 10 15
TOTAL ANNUALIZED STD DEV, %
Morningstar Large Blend AverageVanguard Institutional Index IS&P 500 TR USD
74
Investment Committee - Defined Contribution Plan - Quarterly Review
85
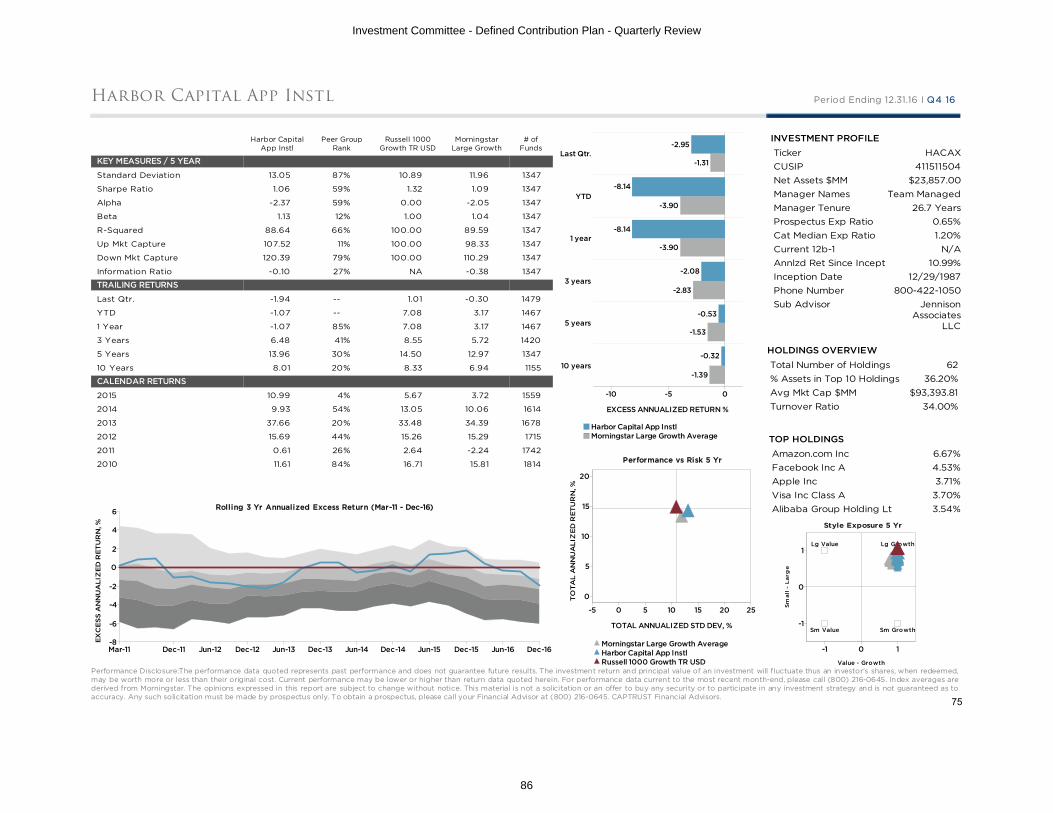
Style Exposure 5 Yr
-1
0
1
Sm
all
- L
arg
e
-1 0 1
Value - Growth
Sm GrowthSm Value
Lg GrowthLg Value
Performance Disclosure:The performance data quoted represents past performance and does not guarantee future results. The investment return and principal value of an investment will fluctuate thus an investor's shares, when redeemed, may be worth more or less than their original cost. Current performance may be lower or higher than return data quoted herein. For performance data current to the most recent month-end, please call (800) 216-0645. Index averages are derived from Morningstar. The opinions expressed in this report are subject to change without notice. This material is not a solicitation or an offer to buy any security or to participate in any investment strategy and is not guaranteed as to accuracy. Any such solicitation must be made by prospectus only. To obtain a prospectus, please call your Financial Advisor at (800) 216-0645. CAPTRUST Financial Advisors.
Harbor CapitalApp Instl
Peer GroupRank
Russell 1000Growth TR USD
MorningstarLarge Growth
# ofFunds
KEY MEASURES / 5 YEAR
Standard Deviation 13.05 87% 10.89 11.96 1347
Sharpe Ratio 1.06 59% 1.32 1.09 1347
Alpha -2.37 59% 0.00 -2.05 1347
Beta 1.13 12% 1.00 1.04 1347
R-Squared 88.64 66% 100.00 89.59 1347
Up Mkt Capture 107.52 11% 100.00 98.33 1347
Down Mkt Capture 120.39 79% 100.00 110.29 1347
Information Ratio -0.10 27% NA -0.38 1347
TRAILING RETURNS
Last Qtr. -1.94 -- 1.01 -0.30 1479
YTD -1.07 -- 7.08 3.17 1467
1 Year -1.07 85% 7.08 3.17 1467
3 Years 6.48 41% 8.55 5.72 1420
5 Years 13.96 30% 14.50 12.97 1347
10 Years 8.01 20% 8.33 6.94 1155
CALENDAR RETURNS
2015 10.99 4% 5.67 3.72 1559
2014 9.93 54% 13.05 10.06 1614
2013 37.66 20% 33.48 34.39 1678
2012 15.69 44% 15.26 15.29 1715
2011 0.61 26% 2.64 -2.24 1742
2010 11.61 84% 16.71 15.81 1814
INVESTMENT PROFILETicker HACAXCUSIP 411511504Net Assets $MM $23,857.00Manager Names Team ManagedManager Tenure 26.7 YearsProspectus Exp Ratio 0.65%Cat Median Exp Ratio 1.20%Current 12b-1 N/AAnnlzd Ret Since Incept 10.99%Inception Date 12/29/1987Phone Number 800-422-1050Sub Advisor Jennison
AssociatesLLC
TOP HOLDINGSAmazon.com Inc 6.67%Facebook Inc A 4.53%Apple Inc 3.71%Visa Inc Class A 3.70%Alibaba Group Holding Ltd 3.54%
HOLDINGS OVERVIEWTotal Number of Holdings 62% Assets in Top 10 Holdings 36.20%Avg Mkt Cap $MM $93,393.81Turnover Ratio 34.00%
-10 -5 0
EXCESS ANNUALIZED RETURN %
10 years
5 years
3 years
1 year
YTD
Last Qtr.
-1.39
-0.32
-1.53
-0.53
-2.83
-2.08
-3.90
-8.14
-3.90
-8.14
-1.31
-2.95
Harbor Capital App InstlMorningstar Large Growth Average
Harbor Capital App Instl Period Ending 12.31.16 I Q4 16
Rolling 3 Yr Annualized Excess Return (Mar-11 - Dec-16)
-8
-6
-4
-2
0
2
4
6
EX
CE
SS
AN
NU
AL
IZE
D R
ET
UR
N, %
Mar-11 Dec-11 Jun-12 Dec-12 Jun-13 Dec-13 Jun-14 Dec-14 Jun-15 Dec-15 Jun-16 Dec-16
Performance vs Risk 5 Yr
0
5
10
15
20
TO
TA
L A
NN
UA
LIZ
ED
RE
TU
RN
, %
-5 0 5 10 15 20 25
TOTAL ANNUALIZED STD DEV, %
Morningstar Large Growth AverageHarbor Capital App InstlRussell 1000 Growth TR USD
75
Investment Committee - Defined Contribution Plan - Quarterly Review
86

Style Exposure 5 Yr
-1
0
1
Sm
all
- L
arg
e
-1 0 1
Value - Growth
Sm GrowthSm Value
Lg GrowthLg Value
Performance Disclosure:The performance data quoted represents past performance and does not guarantee future results. The investment return and principal value of an investment will fluctuate thus an investor's shares, when redeemed, may be worth more or less than their original cost. Current performance may be lower or higher than return data quoted herein. For performance data current to the most recent month-end, please call (800) 216-0645. Index averages are derived from Morningstar. The opinions expressed in this report are subject to change without notice. This material is not a solicitation or an offer to buy any security or to participate in any investment strategy and is not guaranteed as to accuracy. Any such solicitation must be made by prospectus only. To obtain a prospectus, please call your Financial Advisor at (800) 216-0645. CAPTRUST Financial Advisors.
Harbor CapitalAppreciation Retirement
Peer GroupRank
Russell 1000Growth
MorningstarLarge Growth
# ofFunds
KEY MEASURES / 5 YEAR
Standard Deviation 13.04 87% 10.89 11.96 1347
Sharpe Ratio 1.06 59% 1.32 1.09 1347
Alpha -2.36 59% 0.00 -2.05 1347
Beta 1.13 12% 1.00 1.04 1347
R-Squared 88.66 66% 100.00 89.59 1347
Up Mkt Capture 107.51 11% 100.00 98.33 1347
Down Mkt Capture 120.31 79% 100.00 110.29 1347
Information Ratio -0.10 27% NA -0.38 1347
TRAILING RETURNS
Last Qtr. -1.92 -- 1.01 -0.30 1479
YTD -1.04 -- 7.08 3.17 1467
1 Year -1.04 85% 7.08 3.17 1467
3 Years 6.49 40% 8.55 5.72 1420
5 Years 13.97 30% 14.50 12.97 1347
10 Years 8.02 20% 8.33 6.94 1155
CALENDAR RETURNS
2015 10.99 4% 5.67 3.72 1559
2014 9.93 54% 13.05 10.06 1614
2013 37.66 20% 33.48 34.39 1678
2012 15.69 44% 15.26 15.29 1715
2011 0.61 26% 2.64 -2.24 1742
2010 11.61 84% 16.71 15.81 1814
INVESTMENT PROFILETicker HNACXCUSIP 411512528Net Assets $MM $23,857.00Manager Names Team ManagedManager Tenure 26.7 YearsProspectus Exp Ratio 0.60%Cat Median Exp Ratio 1.20%Current 12b-1 N/AAnnlzd Ret Since Incept 7.87%Inception Date 03/01/2016Phone Number 800-422-1050Sub Advisor Jennison
AssociatesLLC
TOP HOLDINGSAmazon.com Inc 6.67%Facebook Inc A 4.53%Apple Inc 3.71%Visa Inc Class A 3.70%Alibaba Group Holding Ltd 3.54%
HOLDINGS OVERVIEWTotal Number of Holdings 62% Assets in Top 10 Holdings 36.20%Avg Mkt Cap $MM $93,393.81Turnover Ratio 34.00%
-10 -5 0
EXCESS ANNUALIZED RETURN %
10 years
5 years
3 years
1 year
YTD
Last Qtr.
-1.39
-0.32
-1.53
-0.53
-2.83
-2.07
-3.90
-8.11
-3.90
-8.11
-1.31
-2.93
Harbor Capital Appreciation RetirementMorningstar Large Growth Average
Harbor Capital Appreciation Retirement Period Ending 12.31.16 I Q4 16
Rolling 3 Yr Annualized Excess Return (Mar-11 - Dec-16)
-8
-6
-4
-2
0
2
4
6
EX
CE
SS
AN
NU
AL
IZE
D R
ET
UR
N, %
Mar-11 Dec-11 Jun-12 Dec-12 Jun-13 Dec-13 Jun-14 Dec-14 Jun-15 Dec-15 Jun-16 Dec-16
Performance vs Risk 5 Yr
0
5
10
15
20
TO
TA
L A
NN
UA
LIZ
ED
RE
TU
RN
, %
-5 0 5 10 15 20 25
TOTAL ANNUALIZED STD DEV, %
Morningstar Large Growth AverageHarbor Capital Appreciation RetirementRussell 1000 Growth
76
Investment Committee - Defined Contribution Plan - Quarterly Review
87

Style Exposure 5 Yr
-1
0
1
Sm
all
- L
arg
e
-1 0 1
Value - Growth
Sm GrowthSm Value
Lg GrowthLg Value
Performance Disclosure:The performance data quoted represents past performance and does not guarantee future results. The investment return and principal value of an investment will fluctuate thus an investor's shares, when redeemed, may be worth more or less than their original cost. Current performance may be lower or higher than return data quoted herein. For performance data current to the most recent month-end, please call (800) 216-0645. Index averages are derived from Morningstar. The opinions expressed in this report are subject to change without notice. This material is not a solicitation or an offer to buy any security or to participate in any investment strategy and is not guaranteed as to accuracy. Any such solicitation must be made by prospectus only. To obtain a prospectus, please call your Financial Advisor at (800) 216-0645. CAPTRUST Financial Advisors.
RidgeWorth CeredexMid-Cap Value Eq I
Peer GroupRank
Russell Mid CapValue TR USD
MorningstarMid Value
# ofFunds
KEY MEASURES / 5 YEAR
Standard Deviation 12.24 62% 11.03 12.00 341
Sharpe Ratio 1.21 38% 1.41 1.15 341
Alpha -1.75 38% 0.00 -2.44 341
Beta 1.06 39% 1.00 1.03 341
R-Squared 91.25 57% 100.00 90.62 341
Up Mkt Capture 101.51 19% 100.00 96.26 341
Down Mkt Capture 110.53 59% 100.00 109.05 341
Information Ratio -0.19 26% NA -0.47 341
TRAILING RETURNS
Last Qtr. 7.78 -- 5.52 6.75 386
YTD 20.16 -- 20.00 17.92 386
1 Year 20.16 35% 20.00 17.92 386
3 Years 7.83 28% 9.45 6.77 355
5 Years 14.91 28% 15.70 13.79 341
10 Years 9.13 9% 7.59 6.86 289
CALENDAR RETURNS
2015 -6.00 60% -4.78 -5.61 397
2014 11.00 38% 14.75 9.54 386
2013 31.21 84% 33.46 34.84 386
2012 21.79 4% 18.51 16.26 395
2011 -7.31 85% -1.38 -3.87 384
2010 27.66 4% 24.75 21.82 404
INVESTMENT PROFILETicker SMVTXCUSIP 76628R615Net Assets $MM $3,315.00Manager Names Don WordellManager Tenure 15.1 YearsProspectus Exp Ratio 1.12%Cat Median Exp Ratio 1.22%Current 12b-1 N/AAnnlzd Ret Since Incept 9.84%Inception Date 11/30/2001Phone Number 888-784-3863Sub Advisor Ceredex
ValueAdvisors LLC
TOP HOLDINGSCigna Corp 3.60%Cypress Semiconductor Co 2.51%The Hartford Financial Serv 2.17%XL Group Ltd 2.17%Progressive Corp 2.00%
HOLDINGS OVERVIEWTotal Number of Holdings 74% Assets in Top 10 Holdings 21.85%Avg Mkt Cap $MM $12,970.86Turnover Ratio 98.00%
-5 0 5
EXCESS ANNUALIZED RETURN %
10 years
5 years
3 years
1 year
YTD
Last Qtr.
-0.72
1.54
-1.91
-0.80
-2.68
-1.62
-2.07
0.16
-2.07
0.16
1.22
2.26
RidgeWorth Ceredex Mid-Cap Value Eq IMorningstar Mid Value Average
RidgeWorth Ceredex Mid-Cap Value Eq I Period Ending 12.31.16 I Q4 16
Rolling 3 Yr Annualized Excess Return (Mar-11 - Dec-16)
-8
-6
-4
-2
0
2
4
6
8
EX
CE
SS
AN
NU
AL
IZE
D R
ET
UR
N, %
Mar-11 Dec-11 Jun-12 Dec-12 Jun-13 Dec-13 Jun-14 Dec-14 Jun-15 Dec-15 Jun-16 Dec-16
Performance vs Risk 5 Yr
0
5
10
15
20
TO
TA
L A
NN
UA
LIZ
ED
RE
TU
RN
, %
0 5 10 15
TOTAL ANNUALIZED STD DEV, %
Morningstar Mid Value AverageRidgeWorth Ceredex Mid-Cap Value Eq IRussell Mid Cap Value TR USD
77
Investment Committee - Defined Contribution Plan - Quarterly Review
88

Style Exposure 5 Yr
-1
0
1
Sm
all
- L
arg
e
-1 0 1
Value - Growth
Sm GrowthSm Value
Lg GrowthLg Value
Performance Disclosure:The performance data quoted represents past performance and does not guarantee future results. The investment return and principal value of an investment will fluctuate thus an investor's shares, when redeemed,may be worth more or less than their original cost. Current performance may be lower or higher than return data quoted herein. For performance data current to the most recent month-end, please call (800) 216-0645. Index averages arederived from Morningstar. The opinions expressed in this report are subject to change without notice. This material is not a solicitation or an offer to buy any security or to participate in any investment strategy and is not guaranteed as toaccuracy. Any such solicitation must be made by prospectus only. To obtain a prospectus, please call your Financial Advisor at (800) 216-0645. CAPTRUST Financial Advisors.
RidgeWorth CeredexMid-Cap Value Eq IS
Peer GroupRank
Russell MidCapValue Index
MorningstarMid Value
# ofFunds
KEY MEASURES / 5 YEAR
Standard Deviation 12.26 63% 11.03 12.00 341
Sharpe Ratio 1.22 35% 1.41 1.15 341
Alpha -1.60 33% 0.00 -2.44 341
Beta 1.06 38% 1.00 1.03 341
R-Squared 91.20 57% 100.00 90.62 341
Up Mkt Capture 101.89 16% 100.00 96.26 341
Down Mkt Capture 109.81 56% 100.00 109.05 341
Information Ratio -0.15 24% NA -0.47 341
TRAILING RETURNS
Last Qtr. 7.87 -- 5.52 6.75 386
YTD 20.53 -- 20.00 17.92 386
1 Year 20.53 32% 20.00 17.92 386
3 Years 8.10 23% 9.45 6.77 355
5 Years 15.08 25% 15.70 13.79 341
10 Years 9.21 7% 7.59 6.86 289
CALENDAR RETURNS
2015 -5.63 57% -4.78 -5.61 397
2014 11.05 37% 14.75 9.54 386
2013 31.21 84% 33.46 34.84 386
2012 21.79 4% 18.51 16.26 395
2011 -7.31 85% -1.38 -3.87 384
2010 27.66 4% 24.75 21.82 404
INVESTMENT PROFILETicker SMVZXCUSIP 76628T165Net Assets $MM $3,315.00Manager Names Don WordellManager Tenure 15.1 YearsProspectus Exp Ratio 0.80%Cat Median Exp Ratio 1.22%Current 12b-1 N/AAnnlzd Ret Since Incept 8.03%Inception Date 08/01/2014Phone Number 888-784-3863Sub Advisor Ceredex
ValueAdvisors LLC
TOP HOLDINGSCigna Corp 3.60%Cypress Semiconductor Co 2.51%The Hartford Financial Serv 2.17%XL Group Ltd 2.17%Progressive Corp 2.00%
HOLDINGS OVERVIEWTotal Number of Holdings 74% Assets in Top 10 Holdings 21.85%Avg Mkt Cap $MM $12,970.86Turnover Ratio 98.00%
-5 0 5
EXCESS ANNUALIZED RETURN %
10 years
5 years
3 years
1 year
YTD
Last Qtr.
-0.72
1.62
-1.91
-0.62
-2.68
-1.35
-2.07
0.53
-2.07
0.53
1.22
2.35
RidgeWorth Ceredex Mid-Cap Value Eq ISMorningstar Mid Value Average
RidgeWorth Ceredex Mid-Cap Value Eq IS Period Ending 12.31.16 I Q4 16
Rolling 3 Yr Annualized Excess Return (Mar-11 - Dec-16)
-8
-6
-4
-2
0
2
4
6
8
EX
CE
SS
AN
NU
AL
IZE
D R
ET
UR
N, %
Mar-11 Dec-11 Jun-12 Dec-12 Jun-13 Dec-13 Jun-14 Dec-14 Jun-15 Dec-15 Jun-16 Dec-16
Performance vs Risk 5 Yr
0
5
10
15
20
TO
TA
L A
NN
UA
LIZ
ED
RE
TU
RN
, %
0 5 10 15
TOTAL ANNUALIZED STD DEV, %
Morningstar Mid Value AverageRidgeWorth Ceredex Mid-Cap Value Eq ISRussell MidCap Value Index
78
Investment Committee - Defined Contribution Plan - Quarterly Review
89

Style Exposure 5 Yr
-1
0
1
Sm
all
- L
arg
e
-1 0 1
Value - Growth
Sm GrowthSm Value
Lg GrowthLg Value
Performance Disclosure:The performance data quoted represents past performance and does not guarantee future results. The investment return and principal value of an investment will fluctuate thus an investor's shares, when redeemed, may be worth more or less than their original cost. Current performance may be lower or higher than return data quoted herein. For performance data current to the most recent month-end, please call (800) 216-0645. Index averages are derived from Morningstar. The opinions expressed in this report are subject to change without notice. This material is not a solicitation or an offer to buy any security or to participate in any investment strategy and is not guaranteed as to accuracy. Any such solicitation must be made by prospectus only. To obtain a prospectus, please call your Financial Advisor at (800) 216-0645. CAPTRUST Financial Advisors.
Vanguard ExtMkt Idx Inst
Peer GroupRank
S&P CompletionTR USD
MorningstarMid Blend
# ofFunds
KEY MEASURES / 5 YEAR
Standard Deviation 13.11 91% 13.09 11.95 361
Sharpe Ratio 1.11 53% 1.10 1.12 361
Alpha 0.10 68% 0.00 0.86 361
Beta 1.00 5% 1.00 0.86 361
R-Squared 100.00 1% 100.00 88.14 361
Up Mkt Capture 100.42 7% 100.00 86.53 361
Down Mkt Capture 99.93 89% 100.00 83.79 361
Information Ratio 1.29 1% NA -0.20 361
TRAILING RETURNS
Last Qtr. 5.62 -- 5.55 5.31 440
YTD 16.15 -- 15.95 14.17 413
1 Year 16.15 40% 15.95 14.17 413
3 Years 6.53 49% 6.41 5.98 383
5 Years 14.67 29% 14.55 13.33 361
10 Years 7.99 30% 7.84 6.83 311
CALENDAR RETURNS
2015 -3.24 52% -3.35 -4.23 426
2014 7.56 68% 7.50 8.74 424
2013 38.42 19% 38.24 34.06 427
2012 18.50 27% 18.45 16.38 421
2011 -3.57 57% -3.71 -3.48 421
2010 27.59 7% 27.46 21.83 432
INVESTMENT PROFILETicker VIEIXCUSIP 922908884Net Assets $MM $51,549.00Manager Names Team ManagedManager Tenure 19.0 YearsProspectus Exp Ratio 0.07%Cat Median Exp Ratio 1.21%Current 12b-1 N/AAnnlzd Ret Since Incept 8.46%Inception Date 07/07/1997Phone Number 888-809-8102Sub Advisor N/A
TOP HOLDINGSTesla Motors Inc 0.53%LinkedIn Corp Class A 0.53%Las Vegas Sands Corp 0.52%Liberty Global Group C 0.51%Fleetcor Technologies Inc 0.41%
HOLDINGS OVERVIEWTotal Number of Holdings 3267% Assets in Top 10 Holdings 4.26%Avg Mkt Cap $MM $3,538.24Turnover Ratio 8.34%
-5 0 5
EXCESS ANNUALIZED RETURN %
10 years
5 years
3 years
1 year
YTD
Last Qtr.
-1.00
0.15
-1.22
0.12
-0.42
0.12
-1.78
0.20
-1.78
0.20
-0.24
0.07
Vanguard Ext Mkt Idx InstMorningstar Mid Blend Average
Vanguard Ext Mkt Idx Inst Period Ending 12.31.16 I Q4 16
Rolling 3 Yr Annualized Excess Return (Mar-11 - Dec-16)
-12
-10
-8
-6
-4
-2
0
2
4
EX
CE
SS
AN
NU
AL
IZE
D R
ET
UR
N, %
Mar-11 Dec-11 Jun-12 Dec-12 Jun-13 Dec-13 Jun-14 Dec-14 Jun-15 Dec-15 Jun-16 Dec-16
Performance vs Risk 5 Yr
0
5
10
15
20
TO
TA
L A
NN
UA
LIZ
ED
RE
TU
RN
, %
-5 0 5 10 15 20 25
TOTAL ANNUALIZED STD DEV, %
Morningstar Mid Blend AverageVanguard Ext Mkt Idx InstS&P Completion TR USD
79
Investment Committee - Defined Contribution Plan - Quarterly Review
90

Style Exposure 5 Yr
-1
0
1
Sm
all
- L
arg
e
-1 0 1
Value - Growth
Sm GrowthSm Value
Lg GrowthLg Value
Performance Disclosure:The performance data quoted represents past performance and does not guarantee future results. The investment return and principal value of an investment will fluctuate thus an investor's shares, when redeemed, may be worth more or less than their original cost. Current performance may be lower or higher than return data quoted herein. For performance data current to the most recent month-end, please call (800) 216-0645. Index averages are derived from Morningstar. The opinions expressed in this report are subject to change without notice. This material is not a solicitation or an offer to buy any security or to participate in any investment strategy and is not guaranteed as to accuracy. Any such solicitation must be made by prospectus only. To obtain a prospectus, please call your Financial Advisor at (800) 216-0645. CAPTRUST Financial Advisors.
Goldman SachsGrowth Opp I
Peer GroupRank
Russell Mid CapGrowth TR USD
MorningstarMid Growth
# ofFunds
KEY MEASURES / 5 YEAR
Standard Deviation 12.18 34% 11.93 12.76 584
Sharpe Ratio 0.91 50% 1.12 0.93 584
Alpha -2.12 53% 0.00 -1.79 584
Beta 0.98 61% 1.00 1.00 584
R-Squared 92.61 41% 100.00 89.30 584
Up Mkt Capture 92.56 73% 100.00 96.49 584
Down Mkt Capture 104.68 40% 100.00 106.96 584
Information Ratio -0.64 69% NA -0.40 584
TRAILING RETURNS
Last Qtr. -2.65 -- 0.46 0.71 648
YTD 1.49 -- 7.33 5.93 648
1 Year 1.49 80% 7.33 5.93 648
3 Years 2.34 80% 6.23 4.02 625
5 Years 11.15 62% 13.51 11.78 584
10 Years 8.28 22% 7.83 6.96 538
CALENDAR RETURNS
2015 -5.24 86% -0.20 -0.75 668
2014 11.44 14% 11.90 7.07 689
2013 32.38 70% 35.74 35.29 672
2012 19.58 8% 15.81 14.30 716
2011 -3.70 46% -1.65 -3.91 766
2010 19.10 90% 26.38 25.26 775
INVESTMENT PROFILETicker GGOIXCUSIP 38142Y401Net Assets $MM $2,851.00Manager Names Team ManagedManager Tenure 17.5 YearsProspectus Exp Ratio 0.95%Cat Median Exp Ratio 1.30%Current 12b-1 N/AAnnlzd Ret Since Incept 10.45%Inception Date 05/24/1999Phone Number 800-526-7384Sub Advisor N/A
TOP HOLDINGSAmphenol Corp Class A 3.24%The Middleby Corp 2.73%Panera Bread Co Class A 2.70%Roper Technologies Inc 2.65%Xylem Inc 2.63%
HOLDINGS OVERVIEWTotal Number of Holdings 75% Assets in Top 10 Holdings 25.68%Avg Mkt Cap $MM $11,967.71Turnover Ratio 55.00%
-10 -5 0 5
EXCESS ANNUALIZED RETURN %
10 years
5 years
3 years
1 year
YTD
Last Qtr.
-0.88
0.45
-1.73
-2.36
-2.21
-3.89
-1.40
-5.84
-1.40
-5.84
0.25
-3.11
Goldman Sachs Growth Opp IMorningstar Mid Growth Average
Goldman Sachs Growth Opp I Period Ending 12.31.16 I Q4 16
Rolling 3 Yr Annualized Excess Return (Mar-11 - Dec-16)
-10
-8
-6
-4
-2
0
2
4
6
8
EX
CE
SS
AN
NU
AL
IZE
D R
ET
UR
N, %
Mar-11 Dec-11 Jun-12 Dec-12 Jun-13 Dec-13 Jun-14 Dec-14 Jun-15 Dec-15 Jun-16 Dec-16
Performance vs Risk 5 Yr
0
5
10
15
20
TO
TA
L A
NN
UA
LIZ
ED
RE
TU
RN
, %
0 5 10 15
TOTAL ANNUALIZED STD DEV, %
Morningstar Mid Growth AverageGoldman Sachs Growth Opp IRussell Mid Cap Growth TR USD
80
Investment Committee - Defined Contribution Plan - Quarterly Review
91

Style Exposure 5 Yr
-1
0
1
Sm
all
- L
arg
e
-1 0 1
Value - Growth
Sm GrowthSm Value
Lg GrowthLg Value
Performance Disclosure:The performance data quoted represents past performance and does not guarantee future results. The investment return and principal value of an investment will fluctuate thus an investor's shares, when redeemed, may be worth more or less than their original cost. Current performance may be lower or higher than return data quoted herein. For performance data current to the most recent month-end, please call (800) 216-0645. Index averages are derived from Morningstar. The opinions expressed in this report are subject to change without notice. This material is not a solicitation or an offer to buy any security or to participate in any investment strategy and is not guaranteed as to accuracy. Any such solicitation must be made by prospectus only. To obtain a prospectus, please call your Financial Advisor at (800) 216-0645. CAPTRUST Financial Advisors.
Goldman Sachs GrowthOpportunities R6
Peer GroupRank
Russell MidCapGrowth Index
MorningstarMid Growth
# ofFunds
KEY MEASURES / 5 YEAR
Standard Deviation 12.18 34% 11.93 12.76 584
Sharpe Ratio 0.91 50% 1.12 0.93 584
Alpha -2.13 53% 0.00 -1.79 584
Beta 0.98 60% 1.00 1.00 584
R-Squared 92.64 40% 100.00 89.30 584
Up Mkt Capture 92.55 73% 100.00 96.49 584
Down Mkt Capture 104.67 40% 100.00 106.96 584
Information Ratio -0.64 70% NA -0.40 584
TRAILING RETURNS
Last Qtr. -2.69 -- 0.46 0.71 648
YTD 1.49 -- 7.33 5.93 648
1 Year 1.49 81% 7.33 5.93 648
3 Years 2.34 80% 6.23 4.02 625
5 Years 11.15 63% 13.51 11.78 584
10 Years 8.28 22% 7.83 6.96 538
CALENDAR RETURNS
2015 -5.24 86% -0.20 -0.75 668
2014 11.44 14% 11.90 7.07 689
2013 32.38 70% 35.74 35.29 672
2012 19.58 8% 15.81 14.30 716
2011 -3.70 46% -1.65 -3.91 766
2010 19.10 90% 26.38 25.26 775
INVESTMENT PROFILETicker GGOUXCUSIP 38148U601Net Assets $MM $2,851.00Manager Names Team ManagedManager Tenure 17.5 YearsProspectus Exp Ratio 0.93%Cat Median Exp Ratio 1.30%Current 12b-1 N/AAnnlzd Ret Since Incept -4.49%Inception Date 07/31/2015Phone Number 800-526-7384Sub Advisor N/A
TOP HOLDINGSAmphenol Corp Class A 3.24%The Middleby Corp 2.73%Panera Bread Co Class A 2.70%Roper Technologies Inc 2.65%Xylem Inc 2.63%
HOLDINGS OVERVIEWTotal Number of Holdings 75% Assets in Top 10 Holdings 25.68%Avg Mkt Cap $MM $11,967.71Turnover Ratio 55.00%
-10 -5 0 5
EXCESS ANNUALIZED RETURN %
10 years
5 years
3 years
1 year
YTD
Last Qtr.
-0.88
0.45
-1.73
-2.36
-2.21
-3.89
-1.40
-5.84
-1.40
-5.84
0.25
-3.15
Goldman Sachs Growth Opportunities R6Morningstar Mid Growth Average
Goldman Sachs Growth Opportunities R6 Period Ending 12.31.16 I Q4 16
Rolling 3 Yr Annualized Excess Return (Mar-11 - Dec-16)
-10
-8
-6
-4
-2
0
2
4
6
8
EX
CE
SS
AN
NU
AL
IZE
D R
ET
UR
N, %
Mar-11 Dec-11 Jun-12 Dec-12 Jun-13 Dec-13 Jun-14 Dec-14 Jun-15 Dec-15 Jun-16 Dec-16
Performance vs Risk 5 Yr
0
5
10
15
20
TO
TA
L A
NN
UA
LIZ
ED
RE
TU
RN
, %
0 5 10 15
TOTAL ANNUALIZED STD DEV, %
Morningstar Mid Growth AverageGoldman Sachs Growth Opportunities R6Russell MidCap Growth Index
81
Investment Committee - Defined Contribution Plan - Quarterly Review
92

Style Exposure 5 Yr
-1
0
1
-1 0 1
MSCI Eur
MSCI Japan
MSCI Pac ex. Jpn
Emg Mkt Free
Performance Disclosure:The performance data quoted represents past performance and does not guarantee future results. The investment return and principal value of an investment will fluctuate thus an investor's shares, when redeemed,may be worth more or less than their original cost. Current performance may be lower or higher than return data quoted herein. For performance data current to the most recent month-end, please call (800) 216-0645. Index averages arederived from Morningstar. The opinions expressed in this report are subject to change without notice. This material is not a solicitation or an offer to buy any security or to participate in any investment strategy and is not guaranteed as toaccuracy. Any such solicitation must be made by prospectus only. To obtain a prospectus, please call your Financial Advisor at (800) 216-0645. CAPTRUST Financial Advisors.
MFS InternationalValue R6
Peer GroupRank
MSCI EAFEValue GR USD
Mstar ForeignLarge Val
# ofFunds
KEY MEASURES / 5 YEAR
Standard Deviation 10.75 3% 14.62 13.35 266
Sharpe Ratio 1.01 1% 0.46 0.40 266
Alpha 6.59 1% 0.00 -0.53 266
Beta 0.63 100% 1.00 0.87 266
R-Squared 72.78 97% 100.00 90.48 266
Up Mkt Capture 71.90 89% 100.00 83.55 266
Down Mkt Capture 44.09 1% 100.00 87.96 266
Information Ratio 0.48 5% NA -0.28 266
TRAILING RETURNS
Last Qtr. -5.66 -- 4.22 0.14 325
YTD 4.31 -- 5.68 2.96 322
1 Year 4.31 27% 5.68 2.96 322
3 Years 4.23 1% -1.62 -2.41 291
5 Years 10.94 1% 6.87 5.45 266
10 Years 5.15 1% 0.35 -0.04 188
CALENDAR RETURNS
2015 6.85 1% -5.22 -3.26 340
2014 1.61 1% -4.92 -6.32 337
2013 27.80 2% 23.59 20.59 328
2012 16.13 62% 18.43 16.61 356
2011 -1.81 2% -11.65 -12.71 363
2010 9.32 34% 3.81 7.72 370
INVESTMENT PROFILETicker MINJXCUSIP 552746349Net Assets $MM $24,294.00Manager Names Team ManagedManager Tenure 8.1 YearsProspectus Exp Ratio 0.66%Cat Median Exp Ratio 1.25%Current 12b-1 N/AAnnlzd Ret Since Incept 5.70%Inception Date 05/01/2006Phone Number 800-225-2606Sub Advisor N/A
TOP HOLDINGSNestle SA 4.11%Danone SA 3.30%Reckitt Benckiser Group P 3.16%Brambles Ltd 2.89%Compass Group PLC 2.42%
HOLDINGS OVERVIEWTotal Number of Holdings 121% Assets in Top 10 Holdings 26.78%Avg Mkt Cap $MM $19,823.65Turnover Ratio 14.00%
-10 -5 0 5 10
EXCESS ANNUALIZED RETURN %
10 years
5 years
3 years
1 year
YTD
Last Qtr.
-0.39
4.80
-1.42
4.08
-0.80
5.85
-2.72
-1.37
-2.72
-1.37
-4.08
-9.88
MFS International Value R6Mstar Foreign Large Val Average
MFS International Value R6 Period Ending 12.31.16 I Q4 16
Rolling 3 Yr Annualized Excess Return (Mar-11 - Dec-16)
-8
-6
-4
-2
0
2
4
6
8
10
EX
CE
SS
AN
NU
AL
IZE
D R
ET
UR
N, %
Mar-11 Dec-11 Jun-12 Dec-12 Jun-13 Dec-13 Jun-14 Dec-14 Jun-15 Dec-15 Jun-16 Dec-16
Performance vs Risk 5 Yr
0
5
10
15
TO
TA
L A
NN
UA
LIZ
ED
RE
TU
RN
, %
-5 0 5 10 15 20 25
TOTAL ANNUALIZED STD DEV, %
Mstar Foreign Large Val AverageMFS International Value R6MSCI EAFE Value GR USD
82
Investment Committee - Defined Contribution Plan - Quarterly Review
93

Style Exposure 5 Yr
-1
0
1
-1 0 1
MSCI Eur
MSCI Japan
MSCI Pac ex. Jpn
Emg Mkt Free
Performance Disclosure:The performance data quoted represents past performance and does not guarantee future results. The investment return and principal value of an investment will fluctuate thus an investor's shares, when redeemed,may be worth more or less than their original cost. Current performance may be lower or higher than return data quoted herein. For performance data current to the most recent month-end, please call (800) 216-0645. Index averages arederived from Morningstar. The opinions expressed in this report are subject to change without notice. This material is not a solicitation or an offer to buy any security or to participate in any investment strategy and is not guaranteed as toaccuracy. Any such solicitation must be made by prospectus only. To obtain a prospectus, please call your Financial Advisor at (800) 216-0645. CAPTRUST Financial Advisors.
Vanguard Total IntlStock Index Inst
Peer GroupRank
FTSE Global All Capex US (USA) NR USD
Mstar ForeignLarge Blend
# ofFunds
KEY MEASURES / 5 YEAR
Standard Deviation 13.04 58% 13.31 12.86 623
Sharpe Ratio 0.41 63% 0.42 0.45 623
Alpha 0.04 66% 0.00 0.62 623
Beta 0.97 15% 1.00 0.92 623
R-Squared 98.35 2% 100.00 90.66 623
Up Mkt Capture 97.85 26% 100.00 94.01 623
Down Mkt Capture 98.24 79% 100.00 91.90 623
Information Ratio -0.07 64% NA 0.03 623
TRAILING RETURNS
Last Qtr. -1.92 -- -1.27 -2.24 762
YTD 4.70 -- 4.72 0.70 742
1 Year 4.70 11% 4.72 0.70 742
3 Years -1.32 30% -1.07 -2.07 655
5 Years 5.53 61% 5.65 5.83 623
10 Years 0.93 32% 1.55 0.57 474
CALENDAR RETURNS
2015 -4.24 82% -4.29 -1.50 717
2014 -4.15 32% -3.39 -4.96 729
2013 15.15 82% 15.59 19.48 754
2012 18.28 45% 17.60 18.04 764
2011 -14.51 63% -14.25 -13.62 772
2010 11.09 36% 12.98 9.96 794
INVESTMENT PROFILETicker VTSNXCUSIP 921909784Net Assets $MM $231,928.00Manager Names Team ManagedManager Tenure 8.4 YearsProspectus Exp Ratio 0.10%Cat Median Exp Ratio 1.21%Current 12b-1 N/AAnnlzd Ret Since Incept 3.02%Inception Date 11/29/2010Phone Number 888-809-8102Sub Advisor N/A
TOP HOLDINGSNestle SA 1.04%Novartis AG 0.82%Toyota Motor Corp 0.82%Roche Holding AG Dividen 0.80%HSBC Holdings PLC 0.79%
HOLDINGS OVERVIEWTotal Number of Holdings 6069% Assets in Top 10 Holdings 7.45%Avg Mkt Cap $MM $18,456.47Turnover Ratio 3.00%
-5 0 5
EXCESS ANNUALIZED RETURN %
10 years
5 years
3 years
1 year
YTD
Last Qtr.
-0.97
-0.61
0.18
-0.12
-1.01
-0.25
-4.02
-0.02
-4.02
-0.02
-0.97
-0.64
Vanguard Total Intl Stock Index InstMstar Foreign Large Blend Average
Vanguard Total Intl Stock Index Inst Period Ending 12.31.16 I Q4 16
Rolling 3 Yr Annualized Excess Return (Mar-11 - Dec-16)
-8
-6
-4
-2
0
2
4
6
EX
CE
SS
AN
NU
AL
IZE
D R
ET
UR
N, %
Mar-11 Dec-11 Jun-12 Dec-12 Jun-13 Dec-13 Jun-14 Dec-14 Jun-15 Dec-15 Jun-16 Dec-16
Performance vs Risk 5 Yr
0
5
10
TO
TA
L A
NN
UA
LIZ
ED
RE
TU
RN
, %
-5 0 5 10 15 20 25
TOTAL ANNUALIZED STD DEV, %
Mstar Foreign Large Blend AverageVanguard Total Intl Stock Index InstFTSE Global All Cap ex US (USA) NR USD
83
Investment Committee - Defined Contribution Plan - Quarterly Review
94

Style Exposure 5 Yr
-1
0
1
-1 0 1
MSCI Eur
MSCI Japan
MSCI Pac ex. Jpn
Emg Mkt Free
Performance Disclosure:The performance data quoted represents past performance and does not guarantee future results. The investment return and principal value of an investment will fluctuate thus an investor's shares, when redeemed, may be worth more or less than their original cost. Current performance may be lower or higher than return data quoted herein. For performance data current to the most recent month-end, please call (800) 216-0645. Index averages are derived from Morningstar. The opinions expressed in this report are subject to change without notice. This material is not a solicitation or an offer to buy any security or to participate in any investment strategy and is not guaranteed as to accuracy. Any such solicitation must be made by prospectus only. To obtain a prospectus, please call your Financial Advisor at (800) 216-0645. CAPTRUST Financial Advisors.
OppenheimerIntl Growth I
Peer GroupRank
MSCI ACWI ExUSA NR USD
Mstar ForeignLarge Gr
# ofFunds
KEY MEASURES / 5 YEAR
Standard Deviation 12.81 72% 13.35 12.45 310
Sharpe Ratio 0.60 17% 0.37 0.49 310
Alpha 3.30 15% 0.00 1.88 310
Beta 0.89 31% 1.00 0.86 310
R-Squared 86.74 59% 100.00 85.90 310
Up Mkt Capture 97.15 10% 100.00 89.17 310
Down Mkt Capture 81.04 52% 100.00 80.77 310
Information Ratio 0.54 14% NA 0.24 310
TRAILING RETURNS
Last Qtr. -5.33 -- -1.25 -5.71 381
YTD -1.88 -- 4.50 -2.15 366
1 Year -1.88 48% 4.50 -2.15 366
3 Years -1.78 52% -1.78 -1.80 336
5 Years 7.79 14% 5.00 6.22 310
10 Years 3.38 2% 0.96 1.57 257
CALENDAR RETURNS
2015 3.63 20% -5.66 0.91 362
2014 -6.80 82% -3.87 -3.97 361
2013 25.71 10% 15.29 19.74 362
2012 22.12 13% 16.83 18.63 354
2011 -7.71 12% -13.71 -12.43 371
2010 14.69 29% 11.15 13.69 393
INVESTMENT PROFILETicker OIGIXCUSIP 68380L605Net Assets $MM $21,704.00Manager Names Team ManagedManager Tenure 20.8 YearsProspectus Exp Ratio 0.70%Cat Median Exp Ratio 1.26%Current 12b-1 N/AAnnlzd Ret Since Incept 5.57%Inception Date 03/29/2012Phone Number 800-225-5677Sub Advisor OppenheimerFunds
Inc
TOP HOLDINGSInfineon Technologies AG 2.14%Dollarama Inc 2.09%Valeo SA 1.74%Nippon Telegraph & Telep 1.73%Nidec Corp 1.59%
HOLDINGS OVERVIEWTotal Number of Holdings 108% Assets in Top 10 Holdings 16.72%Avg Mkt Cap $MM $14,810.43Turnover Ratio 10.00%
-10 -5 0 5
EXCESS ANNUALIZED RETURN %
10 years
5 years
3 years
1 year
YTD
Last Qtr.
0.60
2.42
1.22
2.78
-0.02
0.00
-6.65
-6.37
-6.65
-6.37
-4.45
-4.08
Oppenheimer Intl Growth IMstar Foreign Large Gr Average
Oppenheimer Intl Growth I Period Ending 12.31.16 I Q4 16
Rolling 3 Yr Annualized Excess Return (Mar-11 - Dec-16)
-6
-4
-2
0
2
4
6
8
10
EX
CE
SS
AN
NU
AL
IZE
D R
ET
UR
N, %
Mar-11 Dec-11 Jun-12 Dec-12 Jun-13 Dec-13 Jun-14 Dec-14 Jun-15 Dec-15 Jun-16 Dec-16
Performance vs Risk 5 Yr
0
5
10
TO
TA
L A
NN
UA
LIZ
ED
RE
TU
RN
, %
-5 0 5 10 15 20 25
TOTAL ANNUALIZED STD DEV, %
Mstar Foreign Large Gr AverageOppenheimer Intl Growth IMSCI ACWI Ex USA NR USD
84
Investment Committee - Defined Contribution Plan - Quarterly Review
95

Style Exposure 5 Yr
-1
0
1
-1 0 1
MSCI Eur
MSCI Japan
MSCI Pac ex. Jpn
Emg Mkt Free
Performance Disclosure:The performance data quoted represents past performance and does not guarantee future results. The investment return and principal value of an investment will fluctuate thus an investor's shares, when redeemed, may be worth more or less than their original cost. Current performance may be lower or higher than return data quoted herein. For performance data current to the most recent month-end, please call (800) 216-0645. Index averages are derived from Morningstar. The opinions expressed in this report are subject to change without notice. This material is not a solicitation or an offer to buy any security or to participate in any investment strategy and is not guaranteed as to accuracy. Any such solicitation must be made by prospectus only. To obtain a prospectus, please call your Financial Advisor at (800) 216-0645. CAPTRUST Financial Advisors.
OppenheimerIntl Growth Y
Peer GroupRank
MSCI ACWI ExUSA NR USD
Mstar ForeignLarge Gr
# ofFunds
KEY MEASURES / 5 YEAR
Standard Deviation 12.83 74% 13.35 12.45 310
Sharpe Ratio 0.58 21% 0.37 0.49 310
Alpha 3.13 18% 0.00 1.88 310
Beta 0.90 28% 1.00 0.86 310
R-Squared 86.74 59% 100.00 85.90 310
Up Mkt Capture 96.85 10% 100.00 89.17 310
Down Mkt Capture 81.67 55% 100.00 80.77 310
Information Ratio 0.51 18% NA 0.24 310
TRAILING RETURNS
Last Qtr. -5.35 -- -1.25 -5.71 381
YTD -2.06 -- 4.50 -2.15 366
1 Year -2.06 50% 4.50 -2.15 366
3 Years -1.96 57% -1.78 -1.80 336
5 Years 7.62 17% 5.00 6.22 310
10 Years 3.55 1% 0.96 1.57 257
CALENDAR RETURNS
2015 3.44 23% -5.66 0.91 362
2014 -6.99 84% -3.87 -3.97 361
2013 25.46 12% 15.29 19.74 362
2012 22.10 14% 16.83 18.63 354
2011 -7.31 12% -13.71 -12.43 371
2010 15.35 25% 11.15 13.69 393
INVESTMENT PROFILETicker OIGYXCUSIP 68380L407Net Assets $MM $21,704.00Manager Names Team ManagedManager Tenure 20.8 YearsProspectus Exp Ratio 0.89%Cat Median Exp Ratio 1.26%Current 12b-1 N/AAnnlzd Ret Since Incept 6.07%Inception Date 09/07/2005Phone Number 800-225-5677Sub Advisor OppenheimerFunds
Inc
TOP HOLDINGSInfineon Technologies AG 2.14%Dollarama Inc 2.09%Valeo SA 1.74%Nippon Telegraph & Telep 1.73%Nidec Corp 1.59%
HOLDINGS OVERVIEWTotal Number of Holdings 108% Assets in Top 10 Holdings 16.72%Avg Mkt Cap $MM $14,810.43Turnover Ratio 10.00%
-10 -5 0 5
EXCESS ANNUALIZED RETURN %
10 years
5 years
3 years
1 year
YTD
Last Qtr.
0.60
2.59
1.22
2.61
-0.02
-0.19
-6.65
-6.55
-6.65
-6.55
-4.45
-4.10
Oppenheimer Intl Growth YMstar Foreign Large Gr Average
Oppenheimer Intl Growth Y Period Ending 12.31.16 I Q4 16
Rolling 3 Yr Annualized Excess Return (Mar-11 - Dec-16)
-6
-4
-2
0
2
4
6
8
10
EX
CE
SS
AN
NU
AL
IZE
D R
ET
UR
N, %
Mar-11 Dec-11 Jun-12 Dec-12 Jun-13 Dec-13 Jun-14 Dec-14 Jun-15 Dec-15 Jun-16 Dec-16
Performance vs Risk 5 Yr
0
5
10
TO
TA
L A
NN
UA
LIZ
ED
RE
TU
RN
, %
-5 0 5 10 15 20 25
TOTAL ANNUALIZED STD DEV, %
Mstar Foreign Large Gr AverageOppenheimer Intl Growth YMSCI ACWI Ex USA NR USD
85
Investment Committee - Defined Contribution Plan - Quarterly Review
96

Style Exposure 5 Yr
-1
0
1
Sm
all
- L
arg
e
-1 0 1
Value - Growth
Sm GrowthSm Value
Lg GrowthLg Value
Performance Disclosure:The performance data quoted represents past performance and does not guarantee future results. The investment return and principal value of an investment will fluctuate thus an investor's shares, when redeemed, may be worth more or less than their original cost. Current performance may be lower or higher than return data quoted herein. For performance data current to the most recent month-end, please call (800) 216-0645. Index averages are derived from Morningstar. The opinions expressed in this report are subject to change without notice. This material is not a solicitation or an offer to buy any security or to participate in any investment strategy and is not guaranteed as to accuracy. Any such solicitation must be made by prospectus only. To obtain a prospectus, please call your Financial Advisor at (800) 216-0645. CAPTRUST Financial Advisors.
Victory SycamoreSmall Company Opp I
Peer GroupRank
Russell 2000Value TR USD
MorningstarSmall Value
# ofFunds
KEY MEASURES / 5 YEAR
Standard Deviation 13.26 32% 14.22 14.04 360
Sharpe Ratio 1.18 14% 1.05 1.00 360
Alpha 2.01 15% 0.00 -0.07 360
Beta 0.91 61% 1.00 0.93 360
R-Squared 95.30 27% 100.00 90.18 360
Up Mkt Capture 95.64 42% 100.00 92.91 360
Down Mkt Capture 88.77 28% 100.00 94.13 360
Information Ratio 0.18 18% NA -0.18 360
TRAILING RETURNS
Last Qtr. 13.82 -- 14.07 12.12 415
YTD 30.04 -- 31.74 25.68 409
1 Year 30.04 17% 31.74 25.68 409
3 Years 11.42 1% 8.31 6.63 380
5 Years 15.74 18% 15.07 14.02 360
10 Years 9.25 1% 6.26 6.86 285
CALENDAR RETURNS
2015 -0.39 3% -7.47 -6.61 422
2014 6.80 14% 4.22 3.47 422
2013 33.39 73% 34.52 35.90 421
2012 12.55 79% 18.05 16.06 414
2011 1.52 5% -5.50 -4.51 401
2010 22.00 79% 24.50 25.22 399
INVESTMENT PROFILETicker VSOIXCUSIP 92646A815Net Assets $MM $4,137.00Manager Names Team ManagedManager Tenure 18.6 YearsProspectus Exp Ratio 0.97%Cat Median Exp Ratio 1.33%Current 12b-1 0.00%Annlzd Ret Since Incept 9.63%Inception Date 08/31/2007Phone Number 800-539-3863Sub Advisor N/A
TOP HOLDINGSEMCOR Group Inc 1.86%Anixter International Inc 1.78%UniFirst Corp 1.69%Sterling Bancorp 1.63%Applied Industrial Technolo 1.57%
HOLDINGS OVERVIEWTotal Number of Holdings 105% Assets in Top 10 Holdings 15.96%Avg Mkt Cap $MM $1,777.87Turnover Ratio 59.00%
-10 -5 0 5
EXCESS ANNUALIZED RETURN %
10 years
5 years
3 years
1 year
YTD
Last Qtr.
0.59
2.99
-1.05
0.67
-1.67
3.12
-6.06
-1.70
-6.06
-1.70
-1.95
-0.26
Victory Sycamore Small Company Opp IMorningstar Small Value Average
Victory Sycamore Small Company Opp I Period Ending 12.31.16 I Q4 16
Rolling 3 Yr Annualized Excess Return (Mar-11 - Dec-16)
-8
-6
-4
-2
0
2
4
6
8
10
EX
CE
SS
AN
NU
AL
IZE
D R
ET
UR
N, %
Mar-11 Dec-11 Jun-12 Dec-12 Jun-13 Dec-13 Jun-14 Dec-14 Jun-15 Dec-15 Jun-16 Dec-16
Performance vs Risk 5 Yr
0
5
10
15
20
TO
TA
L A
NN
UA
LIZ
ED
RE
TU
RN
, %
-5 0 5 10 15 20 25
TOTAL ANNUALIZED STD DEV, %
Morningstar Small Value AverageVictory Sycamore Small Company Opp IRussell 2000 Value TR USD
86
Investment Committee - Defined Contribution Plan - Quarterly Review
97

Style Exposure 5 Yr
-1
0
1
Sm
all
- L
arg
e
-1 0 1
Value - Growth
Sm GrowthSm Value
Lg GrowthLg Value
Performance Disclosure:The performance data quoted represents past performance and does not guarantee future results. The investment return and principal value of an investment will fluctuate thus an investor's shares, when redeemed, may be worth more or less than their original cost. Current performance may be lower or higher than return data quoted herein. For performance data current to the most recent month-end, please call (800) 216-0645. Index averages are derived from Morningstar. The opinions expressed in this report are subject to change without notice. This material is not a solicitation or an offer to buy any security or to participate in any investment strategy and is not guaranteed as to accuracy. Any such solicitation must be made by prospectus only. To obtain a prospectus, please call your Financial Advisor at (800) 216-0645. CAPTRUST Financial Advisors.
Eagle SmallCap Growth R6
Peer GroupRank
Russell 2000Growth TR USD
MorningstarSmall Growth
# ofFunds
KEY MEASURES / 5 YEAR
Standard Deviation 14.75 46% 15.53 14.82 613
Sharpe Ratio 0.83 51% 0.88 0.84 613
Alpha -0.23 52% 0.00 -0.16 613
Beta 0.92 48% 1.00 0.91 613
R-Squared 93.51 33% 100.00 90.17 613
Up Mkt Capture 90.46 40% 100.00 88.92 613
Down Mkt Capture 92.86 52% 100.00 90.96 613
Information Ratio -0.30 54% NA -0.27 613
TRAILING RETURNS
Last Qtr. 3.08 -- 3.57 3.35 688
YTD 10.39 -- 11.32 11.25 684
1 Year 10.39 51% 11.32 11.25 684
3 Years 5.10 34% 5.05 3.59 646
5 Years 12.40 48% 13.74 12.29 613
10 Years 8.10 27% 7.76 7.18 547
CALENDAR RETURNS
2015 -0.39 27% -1.38 -2.41 704
2014 5.59 25% 5.60 2.56 714
2013 34.70 85% 43.30 41.22 716
2012 14.71 39% 14.59 13.51 758
2011 -1.53 37% -2.91 -3.28 797
2010 35.09 10% 29.09 27.51 802
INVESTMENT PROFILETicker HSRUXCUSIP 269858460Net Assets $MM $4,268.00Manager Names Team ManagedManager Tenure 21.0 YearsProspectus Exp Ratio 0.66%Cat Median Exp Ratio 1.36%Current 12b-1 0.00%Annlzd Ret Since Incept 11.73%Inception Date 08/15/2011Phone Number 800-421-4184Sub Advisor N/A
TOP HOLDINGSWaste Connections Inc 3.15%Universal Electronics Inc 2.47%Coherent Inc 2.32%Burlington Stores Inc 2.01%Genesco Inc 1.93%
HOLDINGS OVERVIEWTotal Number of Holdings 123% Assets in Top 10 Holdings 20.23%Avg Mkt Cap $MM $2,924.48Turnover Ratio 32.00%
-5 0 5
EXCESS ANNUALIZED RETURN %
10 years
5 years
3 years
1 year
YTD
Last Qtr.
-0.57
0.34
-1.45
-1.34
-1.46
0.05
-0.07
-0.93
-0.07
-0.93
-0.22
-0.49
Eagle Small Cap Growth R6Morningstar Small Growth Average
Eagle Small Cap Growth R6 Period Ending 12.31.16 I Q4 16
Rolling 3 Yr Annualized Excess Return (Mar-11 - Dec-16)
-8
-6
-4
-2
0
2
4
6
8
EX
CE
SS
AN
NU
AL
IZE
D R
ET
UR
N, %
Mar-11 Dec-11 Jun-12 Dec-12 Jun-13 Dec-13 Jun-14 Dec-14 Jun-15 Dec-15 Jun-16 Dec-16
Performance vs Risk 5 Yr
0
5
10
15
20
TO
TA
L A
NN
UA
LIZ
ED
RE
TU
RN
, %
-5 0 5 10 15 20 25
TOTAL ANNUALIZED STD DEV, %
Morningstar Small Growth AverageEagle Small Cap Growth R6Russell 2000 Growth TR USD
87
Investment Committee - Defined Contribution Plan - Quarterly Review
98

Style Exposure 5 Yr
-1
0
1
-1 0 1
MSCI Eur
MSCI Japan
MSCI Pac ex. Jpn
Emg Mkt Free
Performance Disclosure:The performance data quoted represents past performance and does not guarantee future results. The investment return and principal value of an investment will fluctuate thus an investor's shares, when redeemed, may be worth more or less than their original cost. Current performance may be lower or higher than return data quoted herein. For performance data current to the most recent month-end, please call (800) 216-0645. Index averages are derived from Morningstar. The opinions expressed in this report are subject to change without notice. This material is not a solicitation or an offer to buy any security or to participate in any investment strategy and is not guaranteed as to accuracy. Any such solicitation must be made by prospectus only. To obtain a prospectus, please call your Financial Advisor at (800) 216-0645. CAPTRUST Financial Advisors.
DFA Emerging MarketsCore Equity I
Peer GroupRank
MSCI EMNR USD
MorningstarEmerging Markets
# ofFunds
KEY MEASURES / 5 YEAR
Standard Deviation 16.02 72% 16.16 15.18 510
Sharpe Ratio 0.13 40% 0.07 0.12 510
Alpha 0.89 42% 0.00 0.69 510
Beta 0.98 22% 1.00 0.89 510
R-Squared 97.60 7% 100.00 88.56 510
Up Mkt Capture 99.97 15% 100.00 88.85 510
Down Mkt Capture 96.27 62% 100.00 87.43 510
Information Ratio 0.34 21% NA 0.04 510
TRAILING RETURNS
Last Qtr. -5.10 -- -4.16 -5.41 802
YTD 12.35 -- 11.19 8.29 787
1 Year 12.35 20% 11.19 8.29 787
3 Years -1.77 27% -2.55 -3.07 635
5 Years 2.14 39% 1.28 1.83 510
10 Years 3.11 13% 1.84 1.40 266
CALENDAR RETURNS
2015 -14.86 58% -14.92 -13.75 783
2014 -0.91 30% -2.19 -2.78 732
2013 -2.64 60% -2.60 0.30 649
2012 20.49 30% 18.22 18.93 619
2011 -20.64 60% -18.42 -19.52 517
2010 23.62 17% 18.88 19.31 475
INVESTMENT PROFILETicker DFCEXCUSIP 233203421Net Assets $MM $17,911.00Manager Names Team ManagedManager Tenure 6.8 YearsProspectus Exp Ratio 0.62%Cat Median Exp Ratio 1.49%Current 12b-1 N/AAnnlzd Ret Since Incept 6.89%Inception Date 04/05/2005Phone Number 888-576-1167Sub Advisor DFA Australia Limited/
DimensionalFund Advisors Ltd
TOP HOLDINGSSamsung Electronics Co Ltd 3.23%Tencent Holdings Ltd 1.46%Taiwan Semiconductor Man 1.33%Taiwan Semiconductor Man 1.03%China Construction Bank Co 0.99%
HOLDINGS OVERVIEWTotal Number of Holdings 4508% Assets in Top 10 Holdings 11.13%Avg Mkt Cap $MM $6,777.83Turnover Ratio 5.00%
-5 0 5
EXCESS ANNUALIZED RETURN %
10 years
5 years
3 years
1 year
YTD
Last Qtr.
-0.44
1.27
0.56
0.87
-0.52
0.79
-2.90
1.17
-2.90
1.17
-1.24
-0.93
DFA Emerging Markets Core Equity IMorningstar Emerging Markets Average
DFA Emerging Markets Core Equity I Period Ending 12.31.16 I Q4 16
Rolling 3 Yr Annualized Excess Return (Mar-11 - Dec-16)
-8
-6
-4
-2
0
2
4
6
8
10
EX
CE
SS
AN
NU
AL
IZE
D R
ET
UR
N, %
Mar-11 Dec-11 Jun-12 Dec-12 Jun-13 Dec-13 Jun-14 Dec-14 Jun-15 Dec-15 Jun-16 Dec-16
Performance vs Risk 5 Yr
0
5
TO
TA
L A
NN
UA
LIZ
ED
RE
TU
RN
, %
-5 0 5 10 15 20 25
TOTAL ANNUALIZED STD DEV, %
Morningstar Emerging Markets AverageDFA Emerging Markets Core Equity IMSCI EM NR USD
88
Investment Committee - Defined Contribution Plan - Quarterly Review
99

Style Exposure 5 Yr
-1
0
1
Sm
all -
Larg
e
-1 0 1
Value - Growth
Sm GrowthSm Value
Lg GrowthLg Value
Performance Disclosure:The performance data quoted represents past performance and does not guarantee future results. The investment return and principal value of an investment will fluctuate thus an investor's shares, when redeemed, may be worth more or less than their original cost. Current performance may be lower or higher than return data quoted herein. For performance data current to the most recent month-end, please call (800) 216-0645. Index averages are derived from Morningstar. The opinions expressed in this report are subject to change without notice. This material is not a solicitation or an offer to buy any security or to participate in any investment strategy and is not guaranteed as to accuracy. Any such solicitation must be made by prospectus only. To obtain a prospectus, please call your Financial Advisor at (800) 216-0645. CAPTRUST Financial Advisors.
TIAA Real EstateAccount
Peer GroupRank
5% NACREIF Property 25%DJ US Select REIT.fnd
MorningstarSp-Real Estate
# ofFunds
KEY MEASURES / 5 YEAR
Standard Deviation 1.40 1% 5.18 13.49 227
Sharpe Ratio 6.37 1% 2.12 0.82 227
Alpha 7.45 1% 0.00 -10.35 227
Beta 0.13 100% 1.00 1.93 227
R-Squared 23.86 99% 100.00 54.39 227
Up Mkt Capture 49.91 100% 100.00 163.17 227
Down Mkt Capture -55.50 1% 100.00 342.46 227
Information Ratio -0.40 99% NA -0.03 227
TRAILING RETURNS
Last Qtr. 1.25 -- 0.66 -2.63 254
YTD 5.20 -- 7.69 6.53 253
1 Year 5.20 71% 7.69 6.53 253
3 Years 8.49 92% 11.85 11.78 246
5 Years 9.03 95% 11.08 10.89 227
10 Years 3.38 87% 6.97 4.34 198
CALENDAR RETURNS
2015 8.16 1% 11.26 2.41 261
2014 12.22 99% 16.79 28.26 263
2013 9.65 2% 7.67 1.80 257
2012 10.06 100% 12.22 17.57 262
2011 13.00 3% 13.54 7.60 248
2010 13.30 100% 16.91 27.33 269
INVESTMENT PROFILEID VAUSA059TLCusip 878094200Net Assets $ $24,186,617,508.00Manager Name Gerald CasimirManager Start Date 2015-08-14Expense Ratio 0.86%Cat Median Exp Ratio 1.28%Annlzd Ret Since Incept 6.45%Inception Date 10-02-1995Sub Advisor N/A
TOP HOLDINGS1001 Pennsylvania Avenue 3.07%Fashion Show 3.01%The Florida Mall 2.84%Colorado Center 1.98%Fourth And Madison 1.98%
HOLDINGS OVERVIEW% Assets in Top 10 Holdings 22.00%Avg Mkt Cap $MM $11,884.12Turnover Ratio 10.00%
-5 0 5
EXCESS ANNUALIZED RETURN %
10 years
5 years
3 years
1 year
YTD
Last Qtr.
-2.63
-3.59
-0.19
-2.04
-0.08
-3.36
-1.16
-2.49
-1.16
-2.49
-3.30
0.59
TIAA Real Estate AccountMorningstar Sp-Real Estate Average
TIAA Real Estate Account Period Ending 12.31.16 I Q4 16
Rolling 3 Yr Annualized Excess Return (Mar-11 - Dec-16)
-15
-10
-5
0
5
10
15
20
25
30
EX
CESS A
NN
UA
LIZ
ED
RETU
RN
, %
Mar-11 Dec-11 Jun-12 Dec-12 Jun-13 Dec-13 Jun-14 Dec-14 Jun-15 Dec-15 Jun-16 Dec-16
Performance vs Risk 5 Yr
0
5
10
15
TO
TA
L A
NN
UA
LIZ
ED
RETU
RN
, %
-5 0 5 10 15 20 25
TOTAL ANNUALIZED STD DEV, %
Morningstar Sp-Real Estate AverageTIAA Real Estate Account75% NACREIF Property 25% DJ US Select REIT.fnd
89
Investment Committee - Defined Contribution Plan - Quarterly Review
100

University of Maine System Defined Contribution Plan
Q4 16Period Ending 12.31.16 |appendix
APPENDIX
Plan Administration Review .………………………………………………………………………………………..
Your CAPTRUST Service Team…………………………………………………………………………………….
Glossary of Terms……………………………………………………………………………………………………………
Evaluation Methodology………………....……………………...................……………………………………..
90
Investment Committee - Defined Contribution Plan - Quarterly Review
101
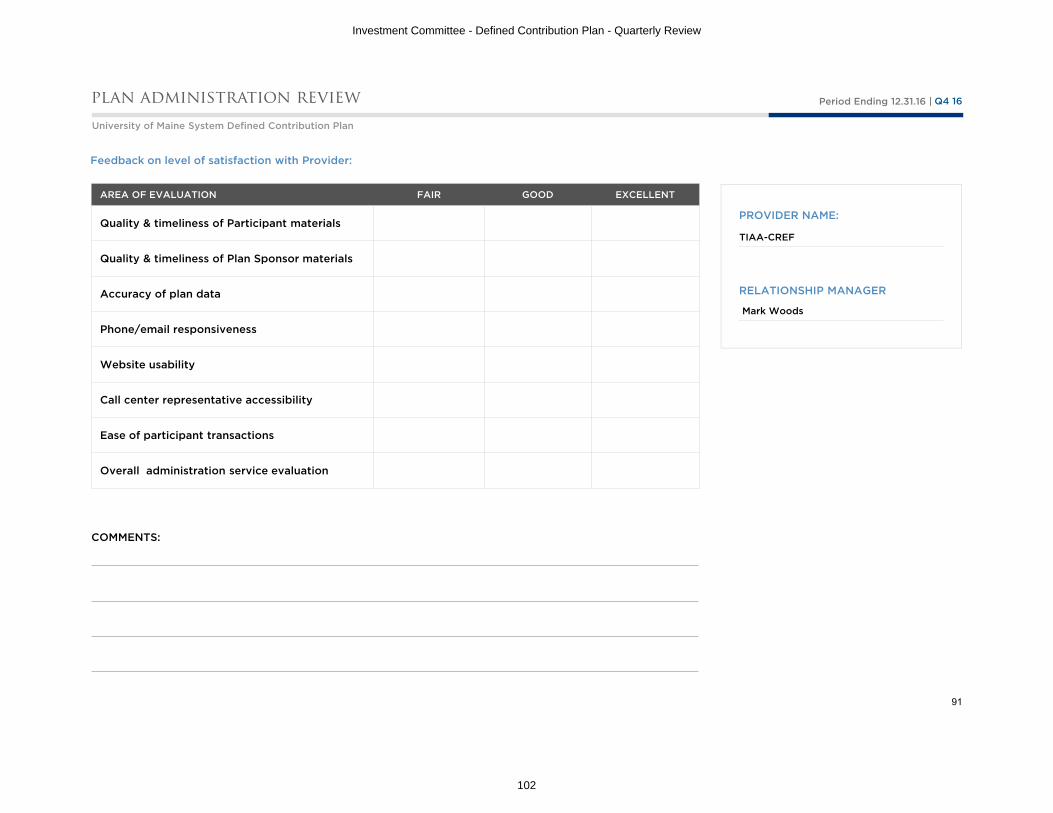
University of Maine System Defined Contribution Plan
Q4 16Period Ending 12.31.16 |
AREA OF EVALUATION FAIR GOOD EXCELLENT
Quality & timeliness of Participant materials
Quality & timeliness of Plan Sponsor materials
Accuracy of plan data
Phone/email responsiveness
Website usability
Call center representative accessibility
Ease of participant transactions
Overall administration service evaluation
Feedback on level of satisfaction with Provider:
COMMENTS:
plan administration review
PROVIDER NAME:
RELATIONSHIP MANAGER
TIAA-CREF
Mark Woods
91
Investment Committee - Defined Contribution Plan - Quarterly Review
102

University of Maine System Defined Contribution Plan
Q4 16Period Ending 12.31.16 |your captrust service team members
TEAM MEMBERS RESPONSIBILITIES
Michael S. PraticoSenior Vice President | Financial [email protected]
Account Role: Lead Consultant Our Lead Consultants serve as the primary relationship manager for the fiduciaries of corporate retirement plans. They oversee and ensure quality delivery of comprehensive investment advisory services. They are available to assist with any aspect of clients' accounts, or put them in contact with the appropriate resources here at CAPTRUST.
Barron V. SchmittSenior Vice President | Financial [email protected]
Account Role: Consultant Our Consultants have responsibility for client project management, client meetings, report preparation, and presentation. Projects involve the establishment of investment policies and objectives, asset allocation modeling, investment manager analyses and searches, fee analysis, performance evaluation, and other specialized projects. In addition, they will provide comprehensive written investment option and plan reviews, as well as monitor overall results and service delivery to ensure complete satisfaction.
Scott T. Matheson, CFA, CPASenior Director | Defined Contribution Practice [email protected]
Account Role: Research AnalystOur Investment Analysts conduct investment manager research, asset allocation studies, portfolio monitoring and performance measurement. Some of their specific duties include: evaluating fund lineups and investment options, reporting due diligence findings to clients, and researching the various universes for viable investment options. Our team monitors and evaluates mutual funds, separate account managers and alternative investments for use with current and prospective clients.
Che-Che S. McCrimmonSenior Client Management [email protected]
Account Role: Client Management Consultant The Client Management Consultants are focused on overall client management from initial conversion of new plans to CAPTRUST throughout their ‘life’ at CAPTRUST. As the primary contact for day-to-day client service needs, the main goal of the Client Management Consultant is to deliver exceptional proactive client service. On a daily basis, the Client Management Consultants are available to assist employees with questions related to plan enrollment and education, available investment options, and other areas.
92
Investment Committee - Defined Contribution Plan - Quarterly Review
103

Q4 16Period Ending 12.31.16 |
ALPHA
Alpha measures a manager’s rate of return in excess of that which can be explained by its systematic risk, or Beta. It is a result of regressing a manager’s returns against those of a benchmark index. A positive alpha implies that a manager has added value relative to its benchmark on a risk-adjusted basis.
BETA
Beta measures a manager’s sensitivity to systematic, or market risk. Beta is a result of the analysis regressing a manager’s returns against those of a benchmark Index. A manager with a Beta of 1 should move perfectly with a benchmark. A Beta of less than 1 implies that a manager’s returns are less volatile than the market’s (i.e., selected benchmarks). A Beta of greater than 1 implies that a manager exhibits greater volatility than the market (i.e., selected benchmark).
CAPTURE RATIO
Up Market Capture is the average return of a manager relative to a benchmark index using only periods where the benchmark return was positive. Down Market Capture is the average return of a manager relative to a benchmark index using only periods where the benchmark return was negative. An Up Market Capture of greater than 100% and a Down Market Capture of less than 100% is considered desirable.
INFORMATION RATIO
The Information Ratio measures a manager’s excess return over the passive index divided by the volatility of that excess return, or Tracking Error. To obtain a higher Information Ratio, which is preferable, a manager must demonstrate the ability to generate returns above its benchmark while avoiding large performance swings relative to that same benchmark.
PERCENTILE RANK
Percentile Rankings are based on a manager’s performance relative to all other available funds in its universe. Percentiles range from 1, being the best, to 100 being the worst. A ranking in the 50th percentile or above demonstrates that the manager has performed better on a relative basis than at least 50% of its peers.
RISK-ADJUSTED PERFORMANCE
Risk-adjusted Performance, or RAP, measures the level of return that an investment option would generate given a level of risk equivalent to the benchmark index.
R-SQUARED
R-squared measures the portion of a manager’s movements that are explained by movements in a benchmark index. R-squared values range from 0 to 100. An R-squared of 100 means that all movements of a manager are completely explained by movements in the index. Thismeasurement is identified as the coefficient of determination from a regression equation. A high R-squared value supports the validity of the Alpha and Beta measures, and it can be used as a measure of style consistency.
SHARPE RATIO
Sharpe ratio measures a manager’s return per unit of risk, or standard deviation. It is the ratio of a manager’s excess return above the risk-free rate divided by a manager’s standard deviation. A higher sharpe ratio implies greater manager efficiency.
STANDARD DEVIATION
Standard Deviation is a measure of the extent to which observations in a series vary from the arithmetic mean of the series. This measure of volatility or risk allows the estimation of a range of values for a manager’s returns. The wider the range, the more uncertainty, and, therefore, the riskier a manager is assumed to be.
glossary
93
Investment Committee - Defined Contribution Plan - Quarterly Review
104

University of Maine System Defined Contribution Plan
Q4 16Period Ending 12.31.16 |plan investment review | evaluation methodology
QUANTITATIVE EVALUATION ITEMS QUALITATIVE EVALUATION ITEMS
3/5 Year Risk- adjusted Performance Fund Management
MARKED FOR REVIEWThe investment option’s 3 or 5 Year Annualized Risk Adjusted Performance falls below the 50th percentile of the peer group.
A significant disruption to the investment option’s management team has been discovered.
The following categories of the Investment Policy Monitor appear
“Marked For Review” when:
Fund Family3/5 Year Performance vs. Peers
A significant disruption to the investment option’s parent company has been discovered.The investment option’s 3 or 5 Year Annualized Peer
Relative Performance falls below the 50th percentile of the peer group.
Portfolio Construction
3/5 Year Style The investment option’s combined Portfolio Construction score is 6 or below out of a possible 15 points.The investment option’s 3 or 5 Year R-Squared
measure falls below the absolute threshold set per asset class.
Underlying Investment Vehicles3/5 Year ConfidenceThe investment option’s 3 or 5 Year Confidence Rating falls below the 50th percentile of the peer group.
The investment option’s combined Underlying Investment Vehicles score is 6 or below out of a possible 15 points.
Glidepath Assessment
% of Equity Exposure: The combined percentage of an investment option’s equity exposure ranks in the top 20th percentile or bottom 20th percentile of the peer group.
Regression to the Benchmark: The investment option’s sensitivity to market risk - as measured by beta relative to a Global Equity Index - is above 0.89.
94
Investment Committee - Defined Contribution Plan - Quarterly Review
105