earlier this year we learned about populations of organisms in pond water, when we studied the...
TRANSCRIPT

Earlier this year we learned about populations of organisms in pond water, when we studied the importance of biodiversity.
Now, we move on to the human population.

Demography is a broad social science discipline concerned with the study of human populations. Demographers deal with the collection, presentation and analysis of data relating to the basic life-cycle events and experiences of people:
• birth,
• marriage,
• divorce,
• household and family formation,
• employment,
• level of education,
• income,
• aging,
• migration patterns,
• death.

• People migrate in two ways.People move into a country where they are not a native, from another place. ImmigrationPeople move out of a country in which they are a native, to another place. Emigration
Ellis Island: Processing in1840’s Irish Potato Famine
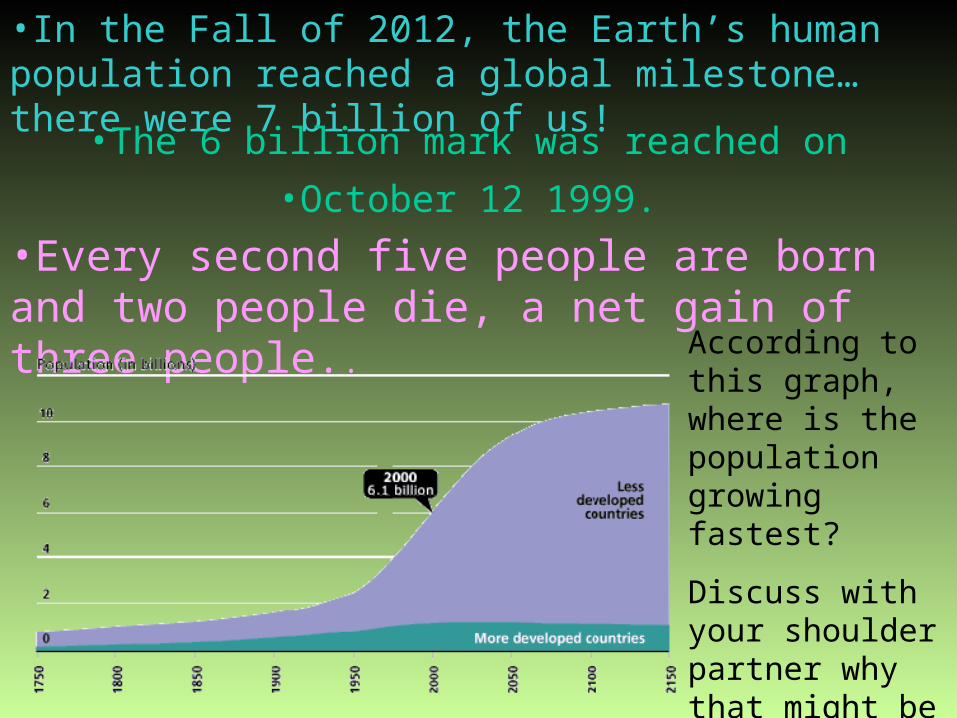
•In the Fall of 2012, the Earth’s human population reached a global milestone…there were 7 billion of us!
•Every second five people are born and two people die, a net gain of three people..
•The 6 billion mark was reached on
•October 12 1999.
According to this graph, where is the population growing fastest?
Discuss with your shoulder partner why that might be true.
At this rate, the world population is doubling every 40 years and would be:
48 billion in 120 years,
24 billion in 80 years,
•12 billion in 40 years,
However the United Nations estimates that we will only be at 12 billion in 120 years.
Why has the world's population exploded in recent years and why might it stabilize during the next century?
For thousands of years the human population was growing at a low but steadily increasing rate. Then in less than 200 years, the world population went from 1 billion to 6 billion people. Why?
•Because the balance between birth and death was broken.
When birth rate equals death rate, there is a “0” population growth.
When birth rate exceeds death rate, there is population growth.
When death rate exceeds birth rate, there is a population decline.

•200 million couples have intercourse
•100 million billion sperm are released
•50 million ovules are produced
•800,000 are fertilized
•400,000 babies are born
(Sorry, no pictures available)
How many babies could a woman biologically have in her lifetime?
•Fertility begins at 12-15
•Fertility ends at menopause (50-60)Technically, a woman could give birth about
every 18 months of her child-bearing years.
Although, the youngest mother whose history is authenticated is Lina Medina, who delivered a 6½-pound boy by cesarean section in Lima, Peru in 1939, at an age of 5 years and 7 months.
•How many babies could each woman have?
Hypothetically, a woman could have 32 babies over her lifetime, given the extreme statistics above, and that’s not accounting for multiples!
Scientists who study human population dynamics are known as…
How can a person be both an immigrant, and an emigrant? Specify.
Why might populations rise faster in underdeveloped countries, rather than in developed countries?
How could the human population have gone from 1-6 billion in only 200 years?
Describe the conditions for each of the following to occur:• Zero population growth• Population growth• Population decline
Looking at the lower end of the statistics, most women could potentially have 15 single-birth babies, but practically never achieve this number. Why? The main reasons are:
Why isn’t the Earth overcome with babies?
The use of birth control
The practice of breastfeeding, nature's way to delay the next birth
The institution of marriage, which delays the first birth
The highest officially recorded number of children born to one mother is 69, to the first wife of Feodor Vassilyev (1707-1782) of Russia. Between 1725 and 1765, she gave birth to 16 pairs of twins, seven sets of triplets, and four sets of quadruplets. 67 of them survived infancy.
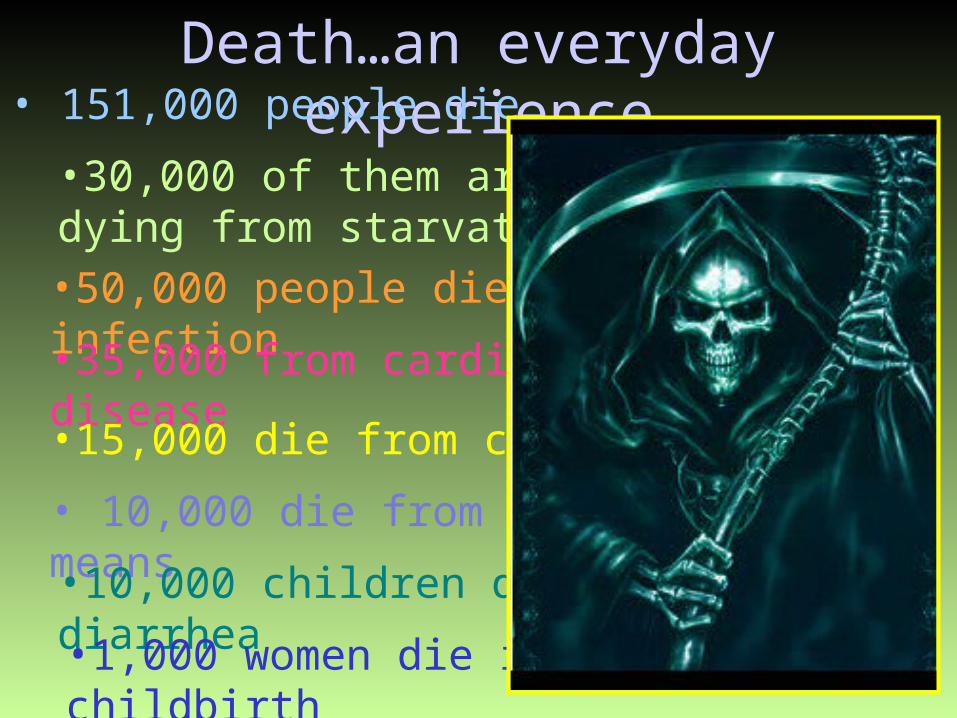
Death…an everyday experience• 151,000 people die
•30,000 of them are children dying from starvation under 5•50,000 people die from infection
•35,000 from cardiovascular disease•15,000 die from cancer
• 10,000 die from violent means•10,000 children die from diarrhea
•1,000 women die in childbirth
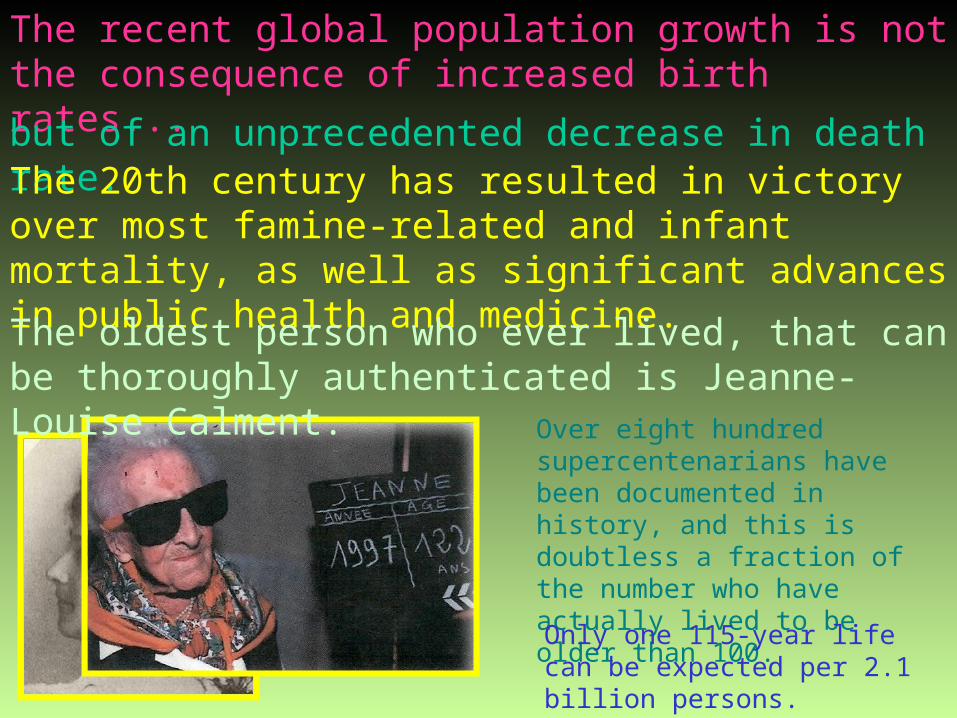
The recent global population growth is not the consequence of increased birth rates...
but of an unprecedented decrease in death rate. The 20th century has resulted in victory over most famine-related and infant mortality, as well as significant advances in public health and medicine.
Over eight hundred supercentenarians have been documented in history, and this is doubtless a fraction of the number who have actually lived to be older than 100.
Only one 115-year life can be expected per 2.1 billion persons.
The oldest person who ever lived, that can be thoroughly authenticated is Jeanne-Louise Calment.
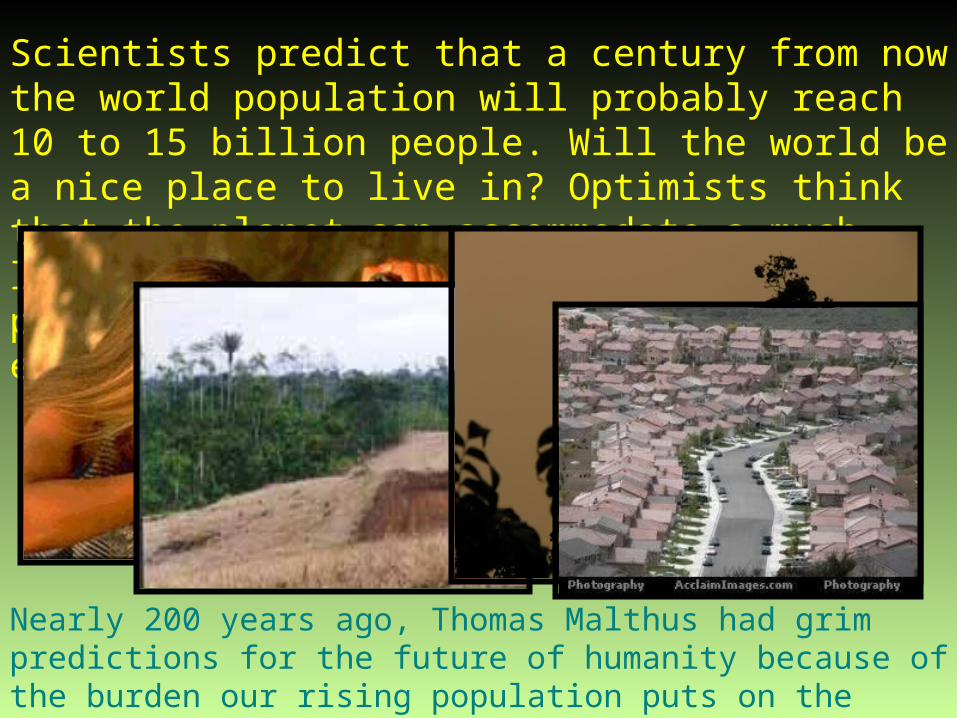
Scientists predict that a century from now the world population will probably reach 10 to 15 billion people. Will the world be a nice place to live in? Optimists think that the planet can accommodate a much larger population. Others, more pessimistic, predict catastrophes before ever reaching this number. Will our natural resources run out?
Nearly 200 years ago, Thomas Malthus had grim predictions for the future of humanity because of the burden our rising population puts on the Earth’s limited resources.

For what three reasons do human females rarely reach their reproductive potential of 15 babies in a lifetime?
What is the recent population growth of humans ultimately a result of?
What are people who live to over 100 years of age known as? (no…it isn’t “old”)
What might a “neo-Malthusian” say about the future of the human population?

If everyone on the planet today adopted a North American lifestyle, natural resources would quickly be exhausted.
•It will be imperative that wealthy nations curb their consumption and wastes.
• A new management of the planet's resources has to be planned. Less focus must be placed on fossil fuel development, and more focus on a future using “clean technology”.
•Being limited in quantity, natural resources need to be managed accordingly...such as
•Our survival depends on population control as well as a better management of natural resources.
Fossil Fuel Consumption
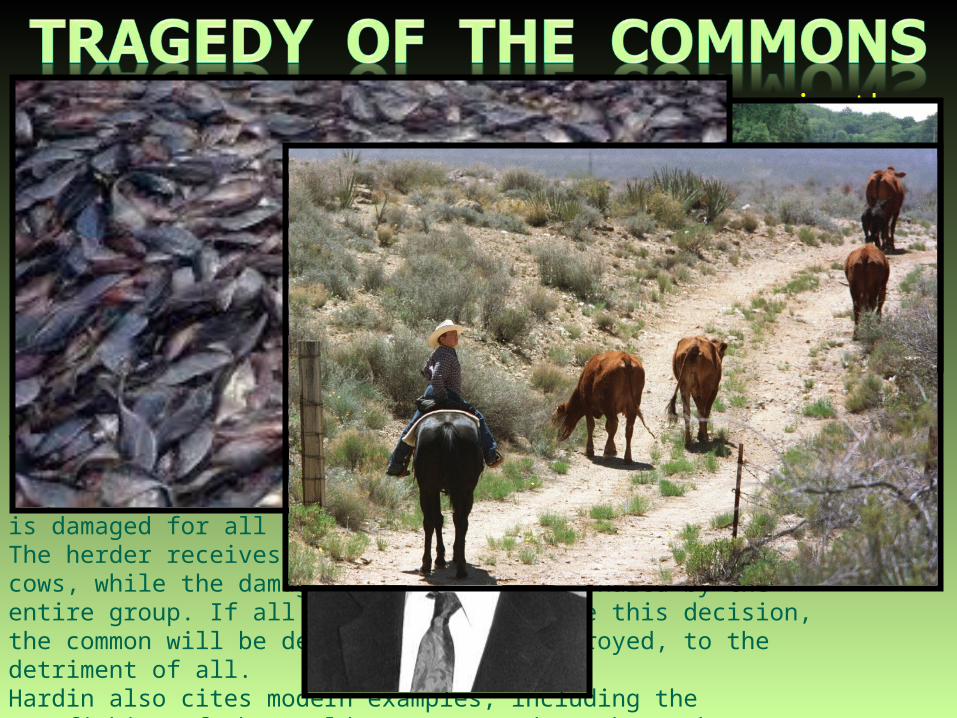
In economics, the tragedy of the commons is the depletion of a shared resource by individuals, acting according to each one's self-interest, despite understanding that the depletion the common resource is contrary to the group's long-term best interests.In 1968, ecologist Garrett Hardin explored this social dilemma in "The Tragedy of the Commons", published in the journal Science.Example: herders sharing a common parcel of land, on which they are each entitled to let their cows graze. It is in each herder's interest to graze all the cows he acquires on the land, even if the quality of the common is damaged for all as a result, through overgrazing. The herder receives all of the benefits from additional cows, while the damage to the common is shared by the entire group. If all herders were to make this decision, the common will be depleted or even destroyed, to the detriment of all. Hardin also cites modern examples, including the overfishing of the world's oceans and ranchers who graze their cattle on government lands in the American West
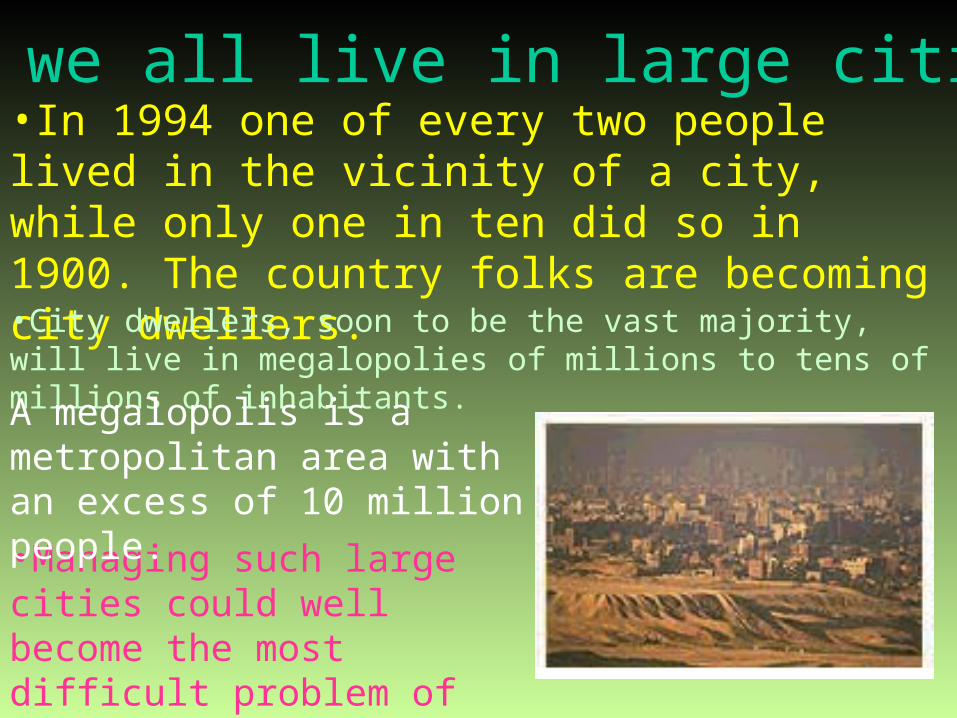
Will we all live in large cities?•In 1994 one of every two people lived in the vicinity of a city, while only one in ten did so in 1900. The country folks are becoming city dwellers.
•Managing such large cities could well become the most difficult problem of the next century
•City dwellers, soon to be the vast majority, will live in megalopolies of millions to tens of millions of inhabitants.
A megalopolis is a metropolitan area with an excess of 10 million people.
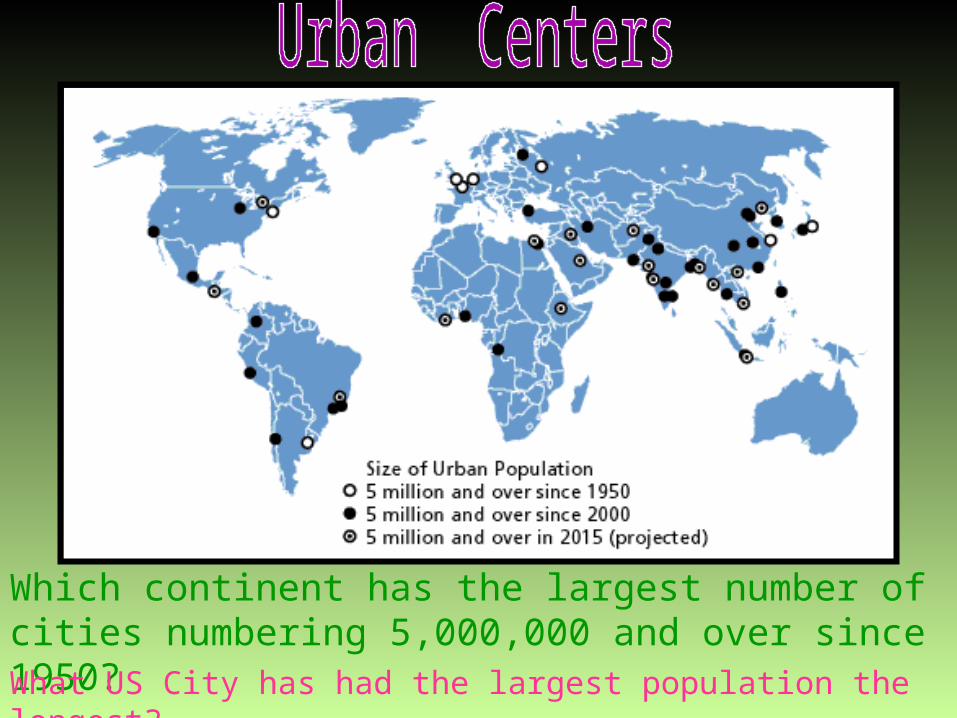
Which continent has the largest number of cities numbering 5,000,000 and over since 1950?What US City has had the largest population the longest?
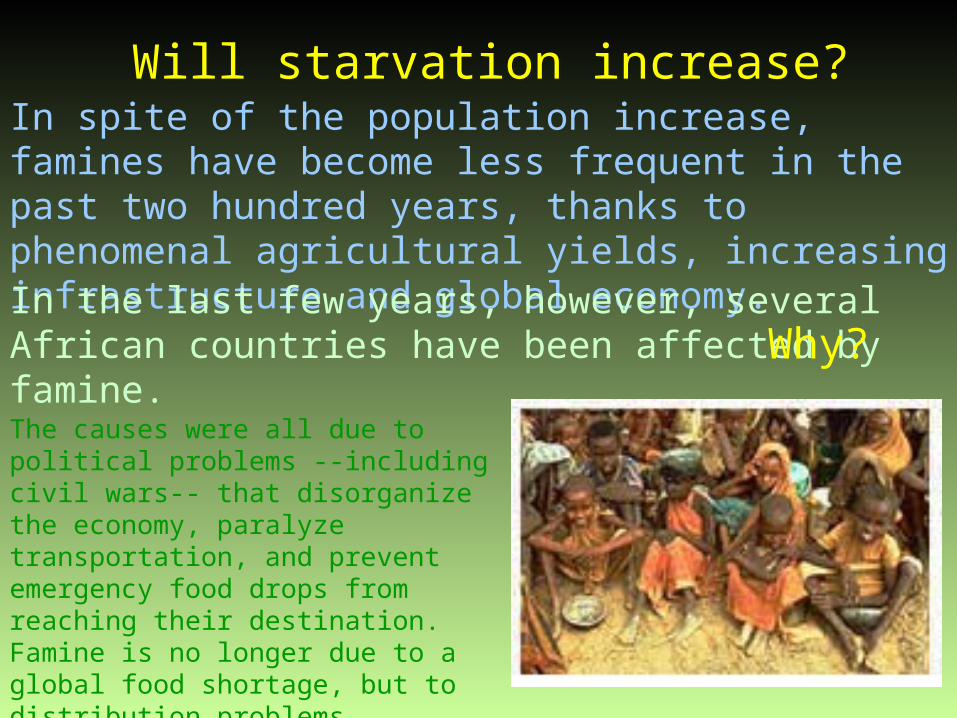
Will starvation increase?In spite of the population increase, famines have become less frequent in the past two hundred years, thanks to phenomenal agricultural yields, increasing infrastructure and global economy.
The causes were all due to political problems --including civil wars-- that disorganize the economy, paralyze transportation, and prevent emergency food drops from reaching their destination. Famine is no longer due to a global food shortage, but to distribution problems.
In the last few years, however, several African countries have been affected by famine. Why?

Is population aging a threat?With an increased lifespan and a more stable world population the proportion of older people will increase.
Retirement age and retirement objectives will have to be revisited.
However, people living a longer and healthier life will consider themselves "older" later in life
Who you callin’ old, sucka?
In excess of how many people live in a megalopolis?
Describe the Tragedy of the Commons in your own words, and give an example.
Which US city has, by far, the largest population?
If famine and starvation is on the decrease, even with increasing populations, why has it been a problem in Africa recently?
What are some possible consequences of an “older” population?

Just how do we know how many people there are, anyway?
• Americans have one of the longest records of continuous population censuses, beginning with the first count in 1790--required, then as now, by the U.S. Constitution for the purpose of allocating seats in the House of Representatives.
• The U.S. Census Bureau--an arm of the Department of Commerce—since that time, has always conducted the census in years ending in 0.
• Our last census was taken in 2010!

When demographers study populations, they divide the world up into regions.
Developed countries are those that are industrialized and have a high standard of living. Some examples of developed countries are: America, All of Europe, Japan and Australia. Underdeveloped, and Developing countries occur where the standards of living are lower. Most are agricultural nations. Some developing countries are: India, East and Central Africa, and China.
Developed countries have experienced both a decline in death rate, and a decline in the birth rate. Developing countries, on the other hand have experienced a decline in their death rate, but their birth rates haven’t fallen nearly so much. This has resulted in rapidly growing populations, poverty, starvation, and civil unrest in these parts of the world. The TFR (or total fertility rate) of a population is the average number of children born to a woman in her lifetime in that culture.
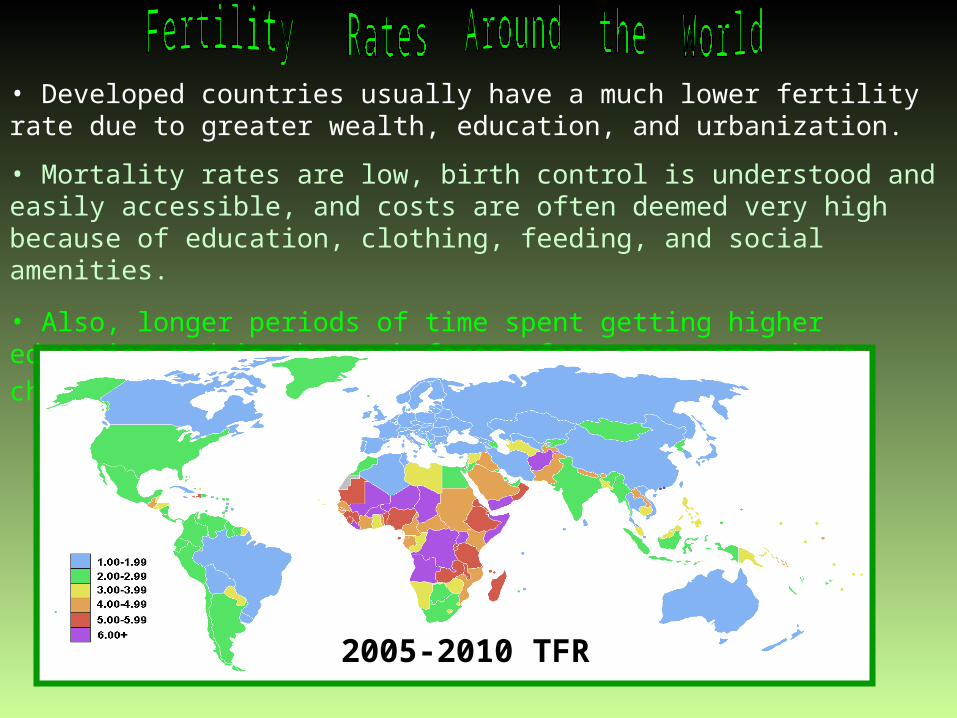
• Developed countries usually have a much lower fertility rate due to greater wealth, education, and urbanization.
• Mortality rates are low, birth control is understood and easily accessible, and costs are often deemed very high because of education, clothing, feeding, and social amenities.
• Also, longer periods of time spent getting higher education and in the work force often mean women have children later in life.
2005-2010 TFR

2005-2010 TFR
In developing countries on the other hand, families desire children for their labor and as caregivers during old age. (no governmental compensation for elderly)
Fertility rates are also higher due to
• the lack of access to contraceptives
• generally lower levels of female education
• and lower rates of female employment in industry.
How do demographers divide up the world?
Name three examples of developed countries.
Name three examples of underdeveloped countries.
How do birth and death rates vary from developed, to underdeveloped/developing countries?
What is TFR?
On what continent is TFR the highest?
Discuss factors influencing TFR in developed countries…in developing countries…
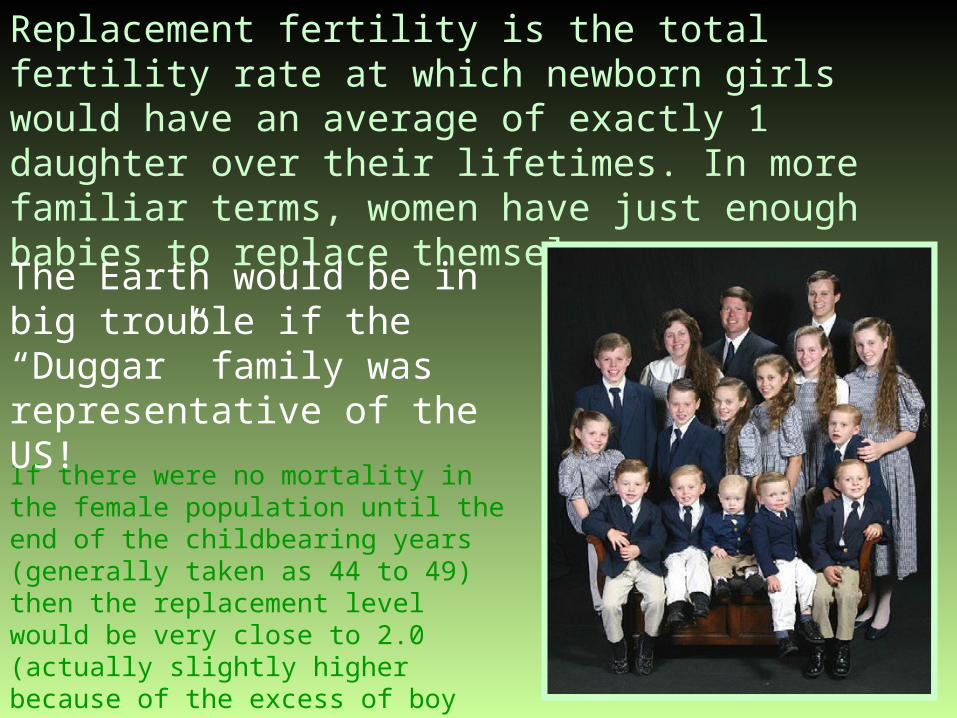
Replacement fertility is the total fertility rate at which newborn girls would have an average of exactly 1 daughter over their lifetimes. In more familiar terms, women have just enough babies to replace themselves.
If there were no mortality in the female population until the end of the childbearing years (generally taken as 44 to 49) then the replacement level would be very close to 2.0 (actually slightly higher because of the excess of boy over girl births in human populations).
The Earth would be in big trouble if the “Duggar” family was representative of the US!
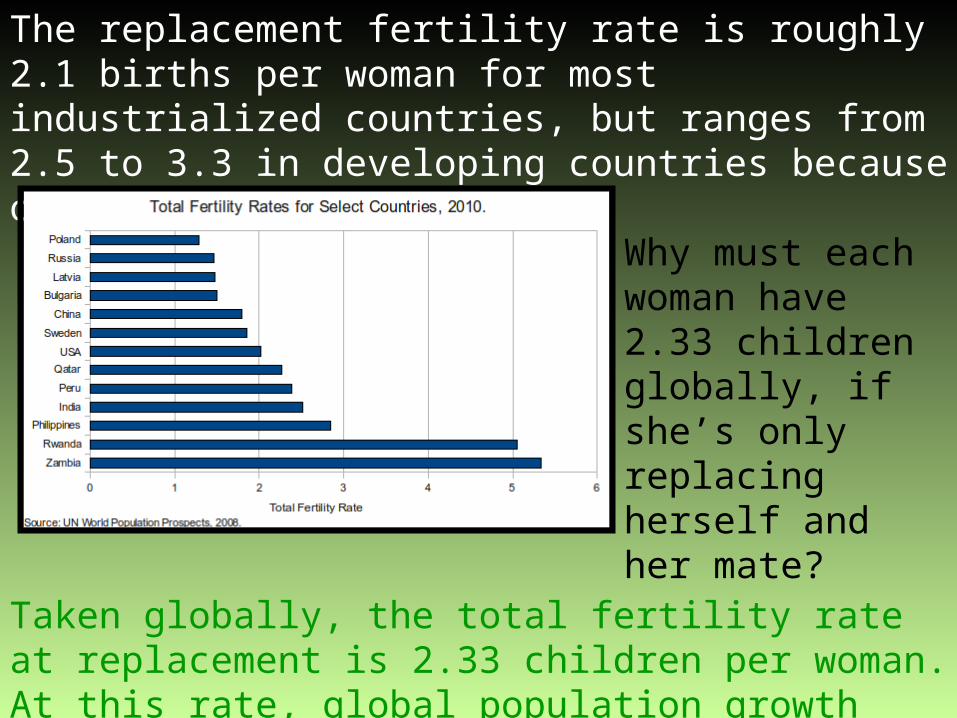
The replacement fertility rate is roughly 2.1 births per woman for most industrialized countries, but ranges from 2.5 to 3.3 in developing countries because of higher mortality rates.
Taken globally, the total fertility rate at replacement is 2.33 children per woman. At this rate, global population growth would trend towards zero.
Why must each woman have 2.33 children globally, if she’s only replacing herself and her mate?

When drawn as a "population pyramid," age distribution can hint at patterns of growth. A top heavy pyramid, like the one below for Grant County, North Dakota, suggests negative population growth that might be due to any number of factors, including:
• high death rates
• low birth rates
• and increased emigration from the area.
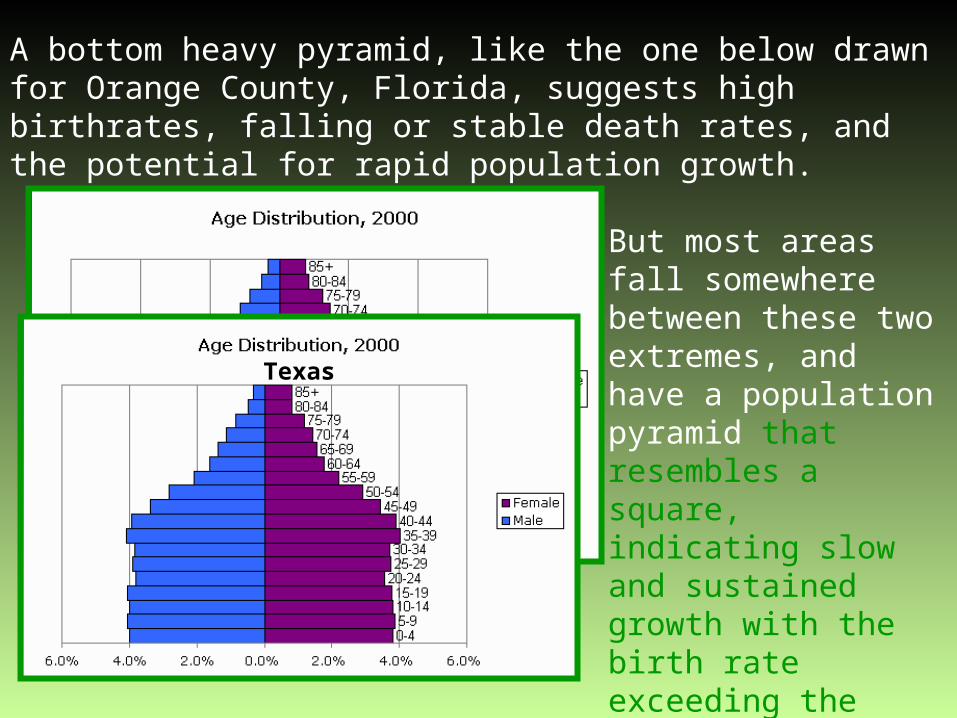
A bottom heavy pyramid, like the one below drawn for Orange County, Florida, suggests high birthrates, falling or stable death rates, and the potential for rapid population growth.
But most areas fall somewhere between these two extremes, and have a population pyramid that resembles a square, indicating slow and sustained growth with the birth rate exceeding the death rate, though not by a great margin.
Texas
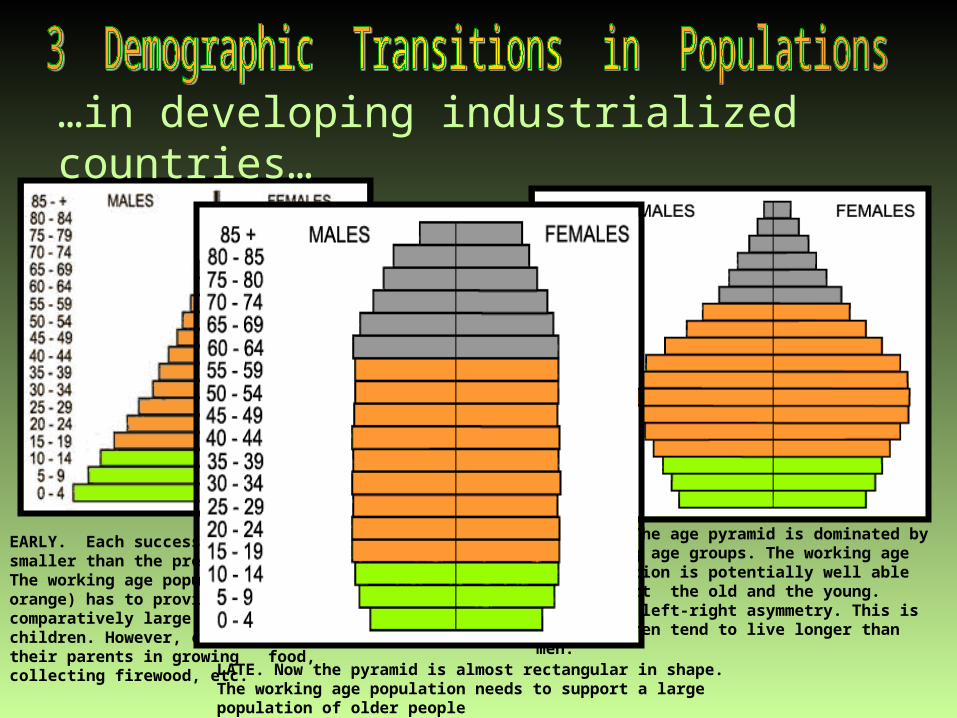
…in developing industrialized countries…
EARLY. Each successive age group is smaller than the preceding age group. The working age population (shown in orange) has to provide for a comparatively large population of children. However, children can help their parents in growing food, collecting firewood, etc.
Middle:. The age pyramid is dominated by the working age groups. The working age population is potentially well able to support the old and the young. Notice the left-right asymmetry. This is because women tend to live longer than men.
LATE. Now the pyramid is almost rectangular in shape. The working age population needs to support a large population of older people
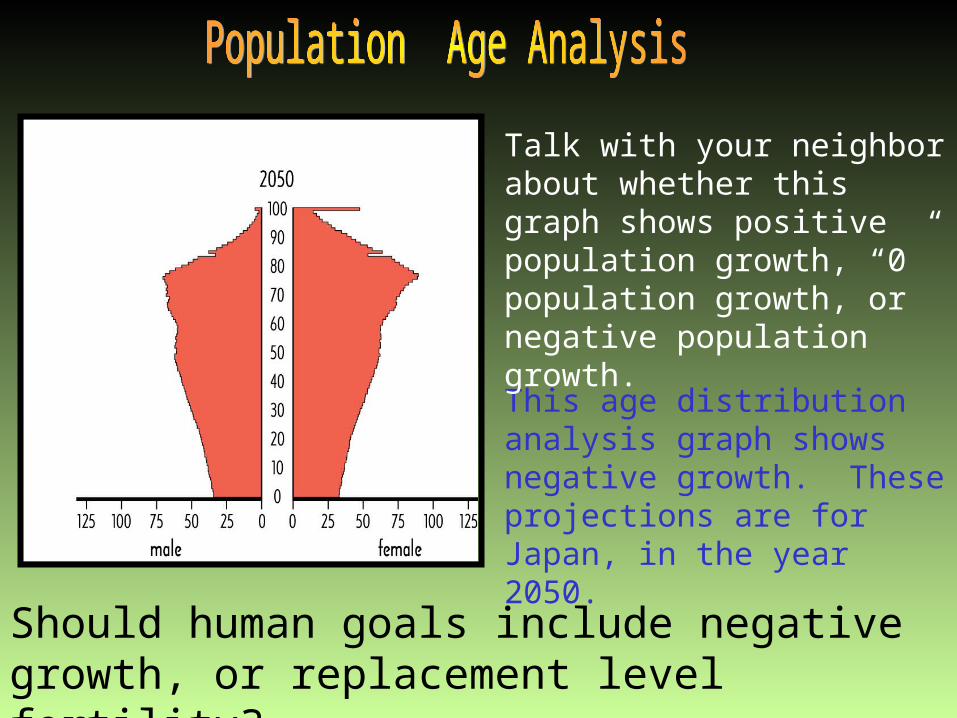
This age distribution analysis graph shows negative growth. These projections are for Japan, in the year 2050.
Talk with your neighbor about whether this graph shows positive population growth, “0” population growth, or negative population growth.
Should human goals include negative growth, or replacement level fertility?

What is “replacement” fertility, and why is it generally higher in developing vs. developed countries?
What trends might a top-heavy population pyramid indicate?
What trends might a bottom-heavy population pyramid indicate?
What trends might a square-shaped population pyramid indicate?
Describe the demographic transition in the population pyramid above. At what stage might this population be, and how do you know?
Right now, the world’s population is growing at an average rate of 1.4% per year, giving it a doubling time of approximately 50 years. The rapid addition of more people has significant implications. The Earth, after all, is a finite system, and cannot sustain continued exponential growth indefinitely.
The absolute maximum population the Earth can sustain at a reasonable average living standard for its inhabitants is called the carrying capacity.
Every habitat, no matter how rich, contains limited supplies of important resources like food, shelter, mineral nutrients, water, and light. When a population grows rapidly, it consumes these resources at an increasing rate. The resources that limit the growth of a certain population are known as limiting resources, or factors.

Human growth patterns exhibit exponential qualities. This means that in a given time, the population will double. Humans exhibit the same type of growth patterns as bacterial infections!
What are some of the limiting factors for these bacterial colonies?
The petri dish was half full at 11:59am. When will the bacteria run out of space? Before you answer this question, consider the fact that at 11:55 am the petri dish was only about 3% full. Would you likely recognize a space problem in the next 5 minutes?
• Space
• Food
• Oxygen, if they’re aerobic
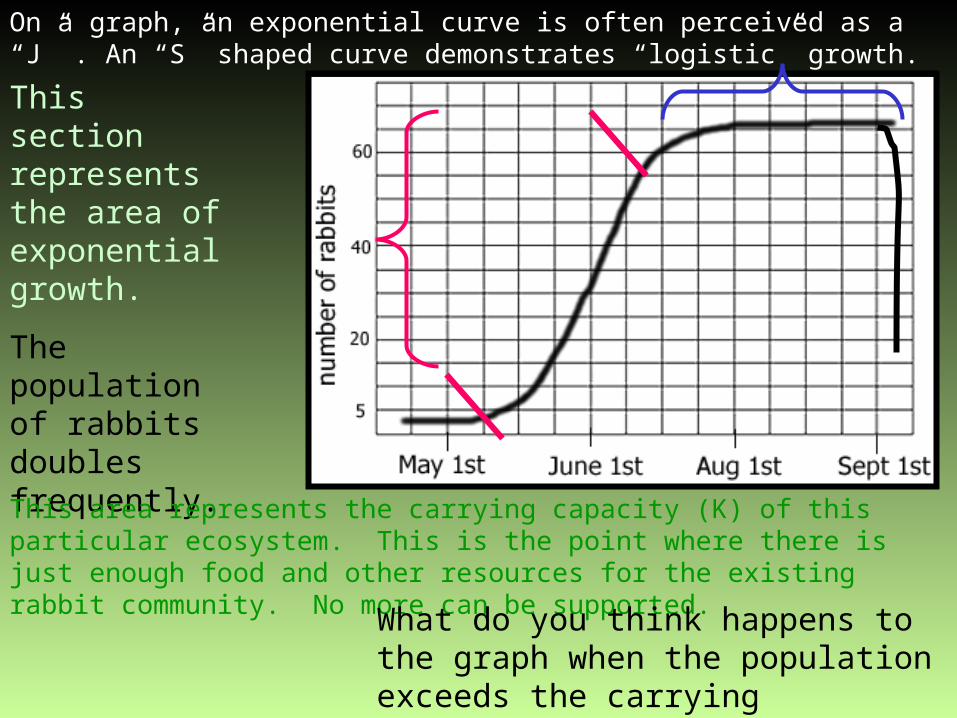
On a graph, an exponential curve is often perceived as a “J” . An “S” shaped curve demonstrates “logistic” growth.
This section represents the area of exponential growth.
The population of rabbits doubles frequently.This area represents the carrying capacity (K) of this particular ecosystem. This is the point where there is just enough food and other resources for the existing rabbit community. No more can be supported. What do you think happens to the
graph when the population exceeds the carrying capacity?
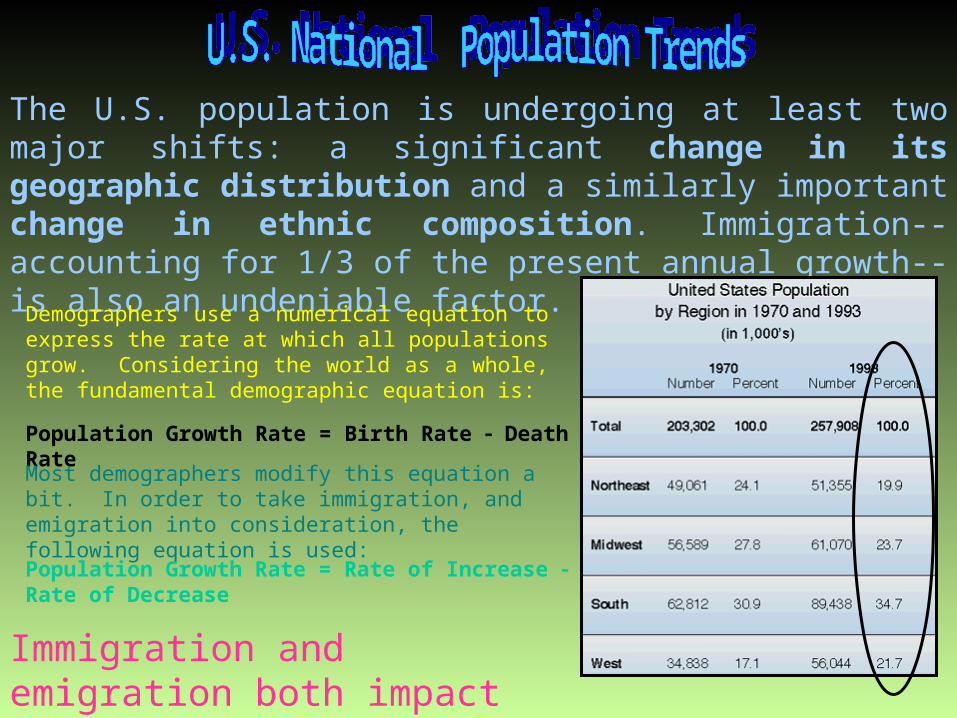
The U.S. population is undergoing at least two major shifts: a significant change in its geographic distribution and a similarly important change in ethnic composition. Immigration--accounting for 1/3 of the present annual growth--is also an undeniable factor.
Demographers use a numerical equation to express the rate at which all populations grow. Considering the world as a whole, the fundamental demographic equation is:
Population Growth Rate = Birth Rate Death RateMost demographers modify this equation a bit. In order to take immigration, and emigration into consideration, the following equation is used:
Population Growth Rate = Rate of Increase Rate of Decrease
Immigration and emigration both impact populations.
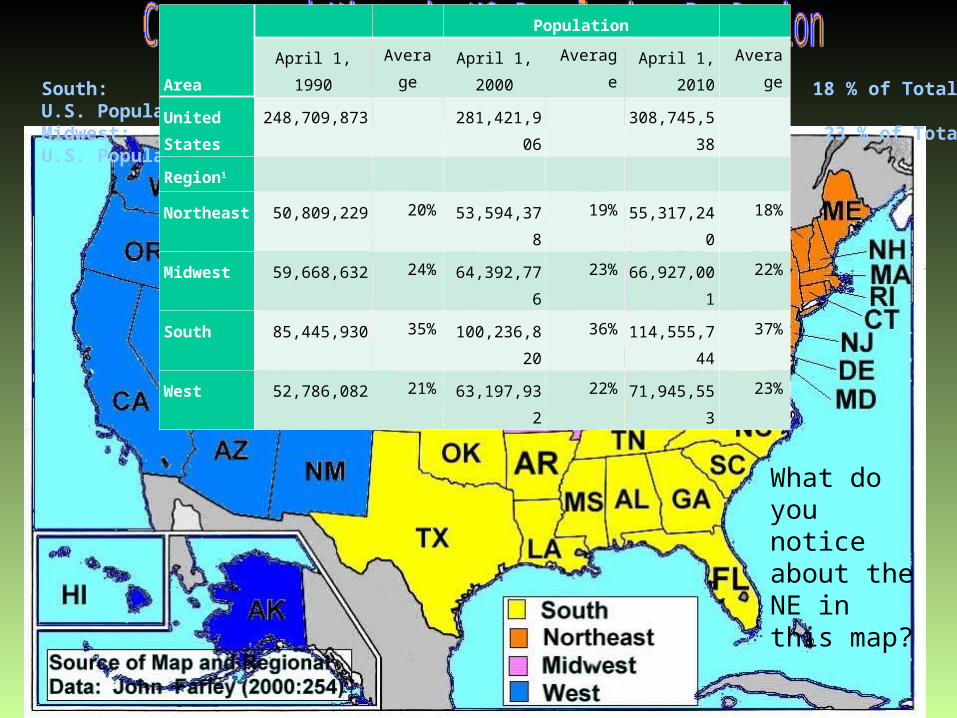
South: 37 % of Total U.S. Population Northeast: 18 % of Total U.S. PopulationMidwest: 22 % of Total U.S. Population West: 23 % of Total U.S. Population
What do you notice about the NE in this map?
Area
Population
April 1, 1990 Average April 1, 2000 Average April 1, 2010 Average
United
States
248,709,873 281,421,906 308,745,538
Region1
Northeast 50,809,229 20% 53,594,378 19% 55,317,240 18%
Midwest 59,668,632 24% 64,392,776 23% 66,927,001 22%
South 85,445,930 35% 100,236,820 36% 114,555,744 37%
West 52,786,082 21% 63,197,932 22% 71,945,553 23%
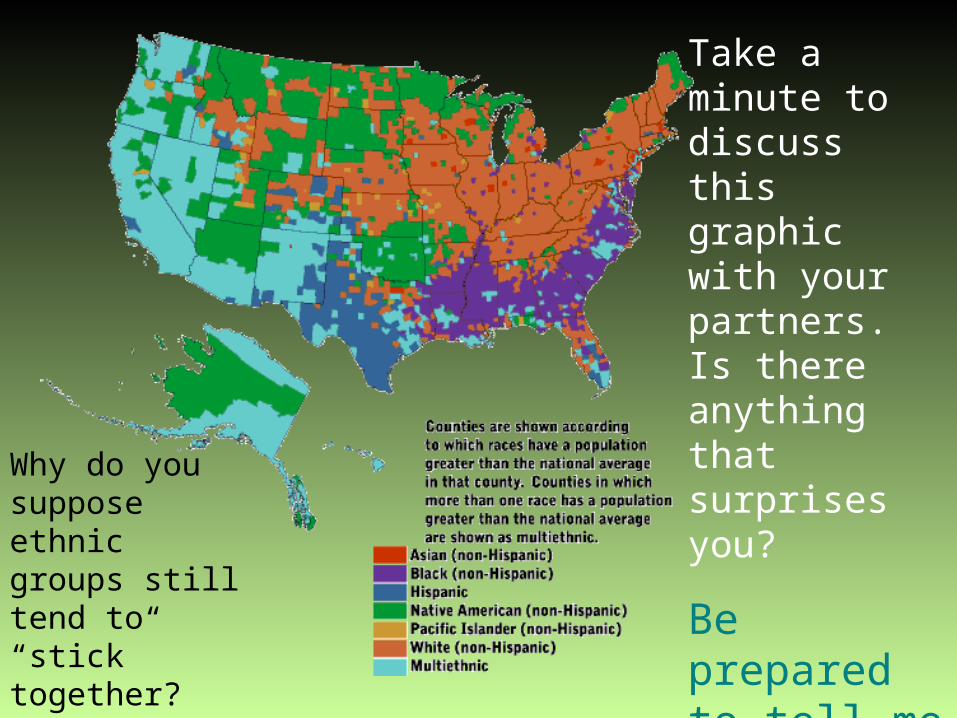
Take a minute to discuss this graphic with your partners. Is there anything that surprises you?
Be prepared to tell me what you think.
Why do you suppose ethnic groups still tend to “stick” together?

What type of growth is the human population currently exhibiting?
Why can exponential growth not be sustained forever? Use your academic vocabulary!
Describe how the population growth patterns in the US are currently trending by region.
What factor must demographers take into consideration when calculating population growth?