early childhood predictors of boys’ - santa fe...
TRANSCRIPT

Early Childhood Predictors of Boys’
Antisocial Behavior and Adjustment
in Adolescence and Early Adulthood
Daniel Shaw
University of Pittsburgh
www.pitt.edu/~ppcl

Special Thanks to:
Richard Bell, Joan Vondra
Kate Keenan, Emily Winslow
Elizabeth Owens, Monica Garcia
Erin Ingoldsby, Miles Gilliom
Michael Schonberg, Michael Criss,
Luke Hyde, Daniel Nagin, Erika Forbes
Staff of the Pitt Mother & Child Project
Women, Infants, and Children Nutritional
Supplement Program
National Institute of Mental Health
National Institute on Drug Abuse

Aims
Describe developmental model
of early conduct problems
Review support for components
of model from ages 1 to 20 years
Briefly discuss implications for
further basic and applied work

The Spread
Of Antisocial
Behavior

Child Effects
Model

Parent Effects Model

Parent, Family, and Neighborhood

Increase in
undirected
anger
Walking to
toddling
Developmental
Transformations:
12 to 24 Months

12-24
Months:
Transition
to Physical
Mobility

Attachment
Theory:
Early
Starting
Conduct
Problems
(Ainsworth,
Sroufe,
Greenberg)
Sensitivity in 1st two years
promotes child compliance
By preschool age, parental
requests should be honored
differentially based on the
quality of the parent-child
relationship and the stakes
for displeasing parents
Supports parents making
investment in child early on
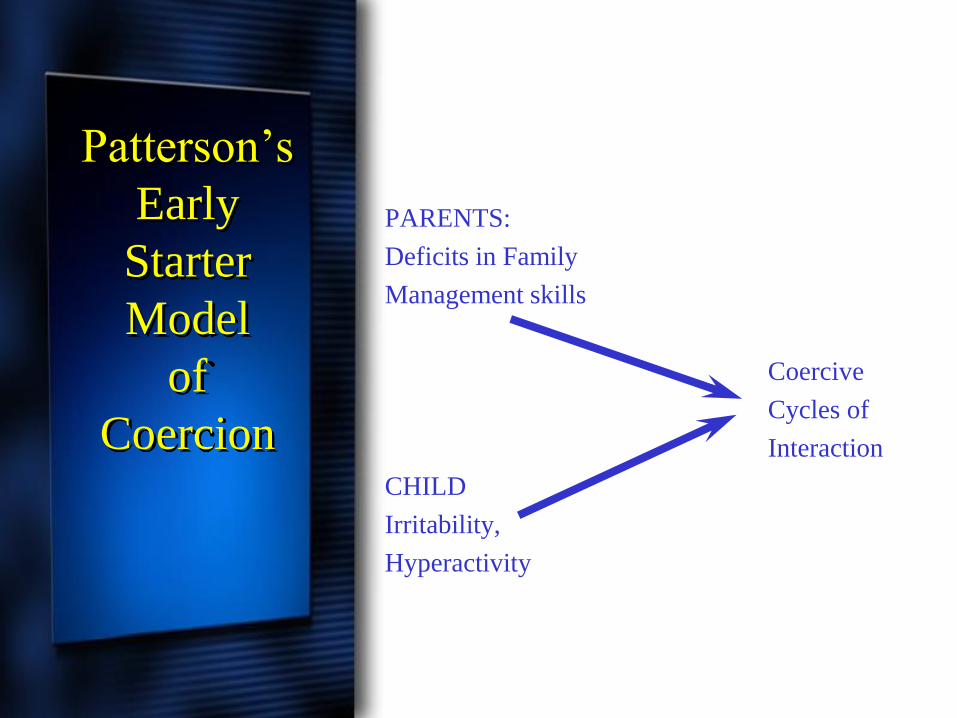
Patterson’s
Early
Starter
Model
of
Coercion
PARENTS:
Deficits in Family
Management skills
Coercive
Cycles of
Interaction
CHILD
Irritability,
Hyperactivity
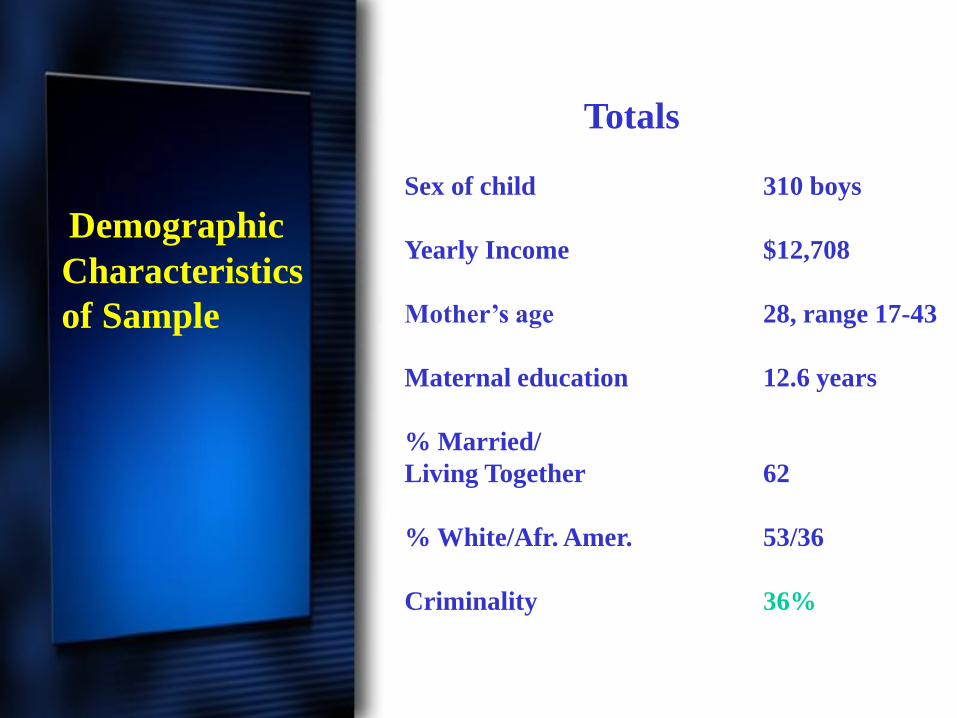
Totals
Sex of child 310 boys
Yearly Income $12,708
Mother’s age 28, range 17-43
Maternal education 12.6 years
% Married/
Living Together 62
% White/Afr. Amer. 53/36
Criminality 36%
Demographic
Characteristics
of Sample

1 yr. 1.5 yr. 2 yr. 3.5 yr. 5 yr. 5.5 yr. 6 yr. 8 yr. 10 yr. 11 yr. 12 yr. 15 yr. 17 yr. 20. yr
Lab Lab Lab/ Lab Home Home Lab Home Home Lab Home Home Home Home
Home Twice
---- Camp ---- --- Court Data ---
----------Teacher and School Data -------
Pitt Mother & Child Project:
Follow-Up Schedule
83% retention at age 20

Measurement Strategies
Focus on observation of developmentally salient
issues (e.g., maternal responsiveness & infant
persistence at age 1, discipline practices at age 2)
Assess in multiple contexts (e.g., home,
lab, summer camp, school) with observations of
target child interacting with parents, sibs, peers,
best friends, and romantic partners
Supplement observations with reports of family,
child, and community risk factors using multiple
family members, peers, best friends, romantic
partners, teachers, school and official records

Measures
High Chair Task at 1 yr: Maternal Responsiveness and Infant
Persistence
Child Noncompliance at 2 yrs: observed during clean-up task
Behaviorial Inhibition at 2 yrs: In response to distressing gorilla
sounds
Parenting Practices at 1.5 & 2 yrs: Hostile/Rejecting based on
molecular and global ratings during clean-up task
Sibling Conflict at 5 yrs: Verbal and physical conflict between
target child and closest-age sib during 1 hour directed play session
Maternal Resources: HOME Acceptance (2 yrs.), Beck Depression
Inventory (1.5 to 5 years), General Life Satisfaction (1.5 yrs.), and
Parenting Daily Hassles (1, 5, 2, & 3.5 yrs.)
Child IQ at 5.5 yrs: 4 subscales of the WPPSI-R
Achenbach CBCL/TRF at 2, 3.5, 5, 6, 8, 10-12 yrs: Externalizing,
Aggression, and other DSM-based factors
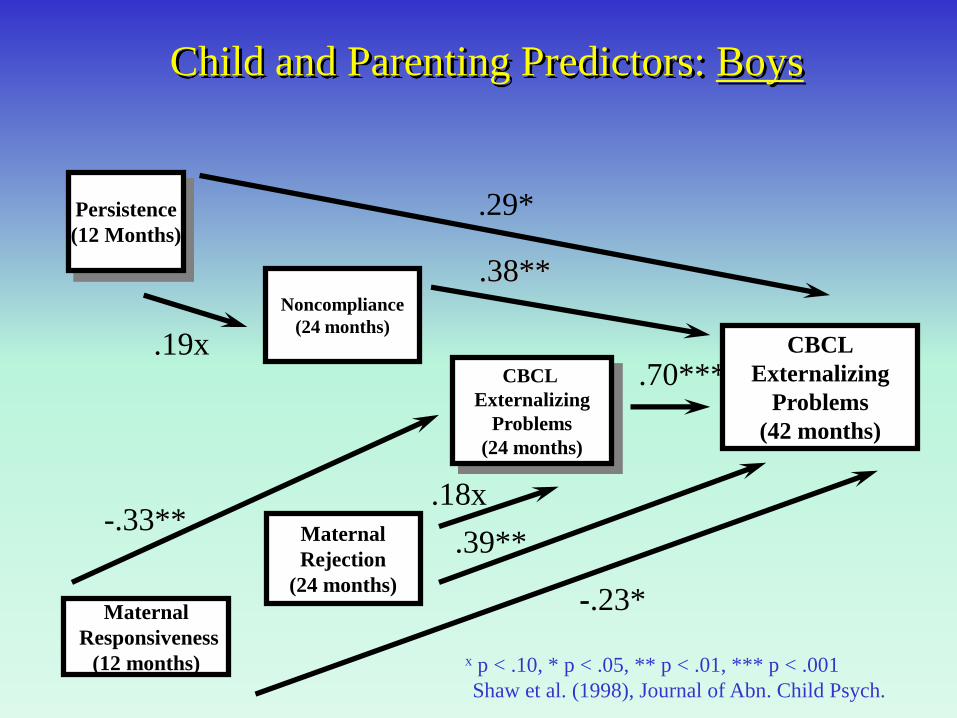
Child and Parenting Predictors: Boys
Noncompliance
(24 months)
Maternal
Responsiveness
(12 months)
CBCL
Externalizing
Problems
(42 months)
CBCL
Externalizing
Problems
(24 months)
.19x
-.23*
-.33**
Persistence
(12 Months)
.29*
x p < .10, * p < .05, ** p < .01, *** p < .001
Shaw et al. (1998), Journal of Abn. Child Psych.
Maternal
Rejection
(24 months)
.70***
.18x
.39**
.38**
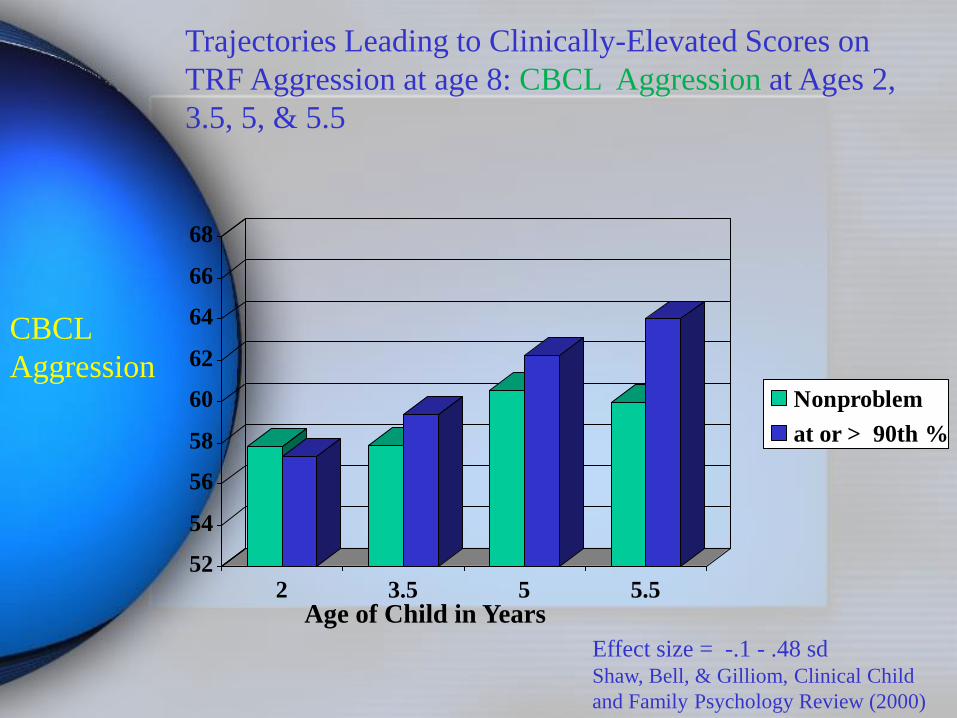
52
54
56
58
60
62
64
66
68
2 3.5 5 5.5
Nonproblem
at or > 90th %
CBCL
Aggression
Effect size = -.1 - .48 sdShaw, Bell, & Gilliom, Clinical Child
and Family Psychology Review (2000)
Age of Child in Years
Trajectories Leading to Clinically-Elevated Scores on
TRF Aggression at age 8: CBCL Aggression at Ages 2,
3.5, 5, & 5.5

0
2
4
6
8
10
12
14
16
1.5 2 3.5 5.5
Nonproblem
at or > 90th %
Maternal
Depressive
Symptoms
Effect size = .27 - .73 sd
Trajectories Leading to Clinically-Elevated Scores on
TRF Aggression at age 8: Maternal Depressive Symptoms
At Ages 1.5, 2, 3.5, and 5.5

35
40
45
50
55
Maternal
Social
Support
Effect size = .80 sd
Nonproblem > 90th %
Trajectories Leading to Clinically-Elevated TRF
Aggression Scores at Age 8: Maternal Social Support
at Age 1.5
25
27
29
31
33
35
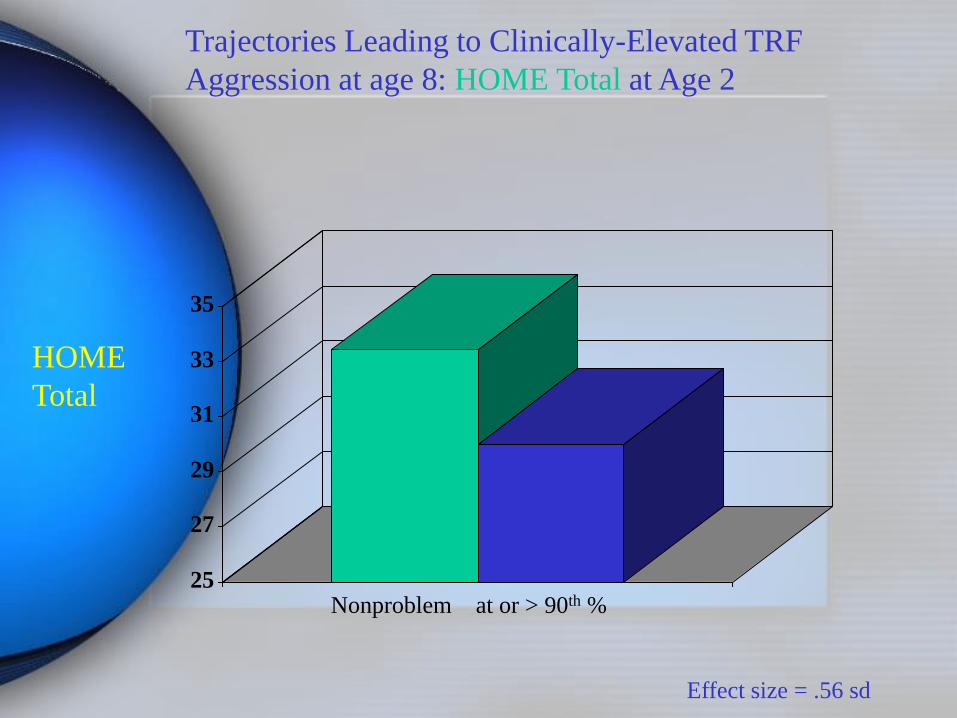
HOME
Total
Effect size = .56 sd
Nonproblem at or > 90th %
Trajectories Leading to Clinically-Elevated TRF
Aggression at age 8: HOME Total at Age 2

0
1
2
3
4
5
6
7
2 3.5 5 6 8Age (years)
Ove
rt A
nti
soci
al
Beh
avi
or
Low-actual Mod. desister-actual High desister-actual Chronic-actual
Low-pred. Mod. desister-pred. High desister-pred. Chronic-pred.
Developmental Trajectories of Overt Antisocial Behavior
Shaw, Gilliom, Ingoldsby, & Nagin (2003), Developmental Psychology
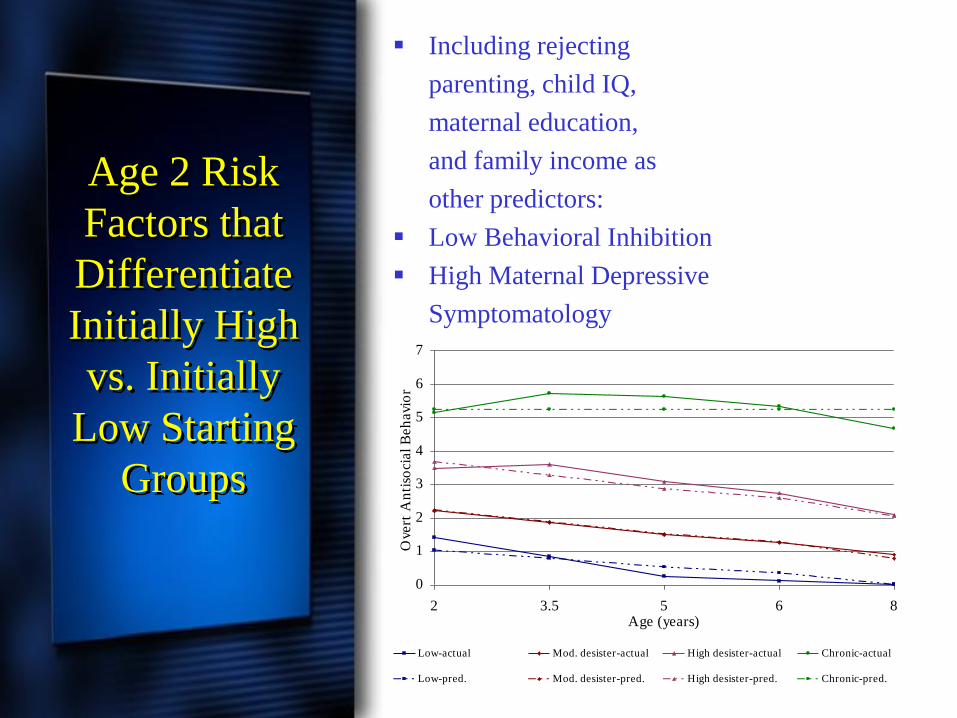
Age 2 Risk
Factors that
Differentiate
Initially High
vs. Initially
Low Starting
Groups
Including rejecting
parenting, child IQ,
maternal education,
and family income as
other predictors:
Low Behavioral Inhibition
High Maternal Depressive
Symptomatology
0
1
2
3
4
5
6
7
2 3.5 5 6 8Age (years)
Ove
rt A
nti
soci
al
Beh
avi
or
Low-actual Mod. desister-actual High desister-actual Chronic-actual
Low-pred. Mod. desister-pred. High desister-pred. Chronic-pred.
0
1
2
3
4
5
6
7
2 3.5 5 6 8Age (years)
Ove
rt A
nti
soci
al
Beh
avi
or
Low-actual Mod. desister-actual High desister-actual Chronic-actual
Low-pred. Mod. desister-pred. High desister-pred. Chronic-pred.
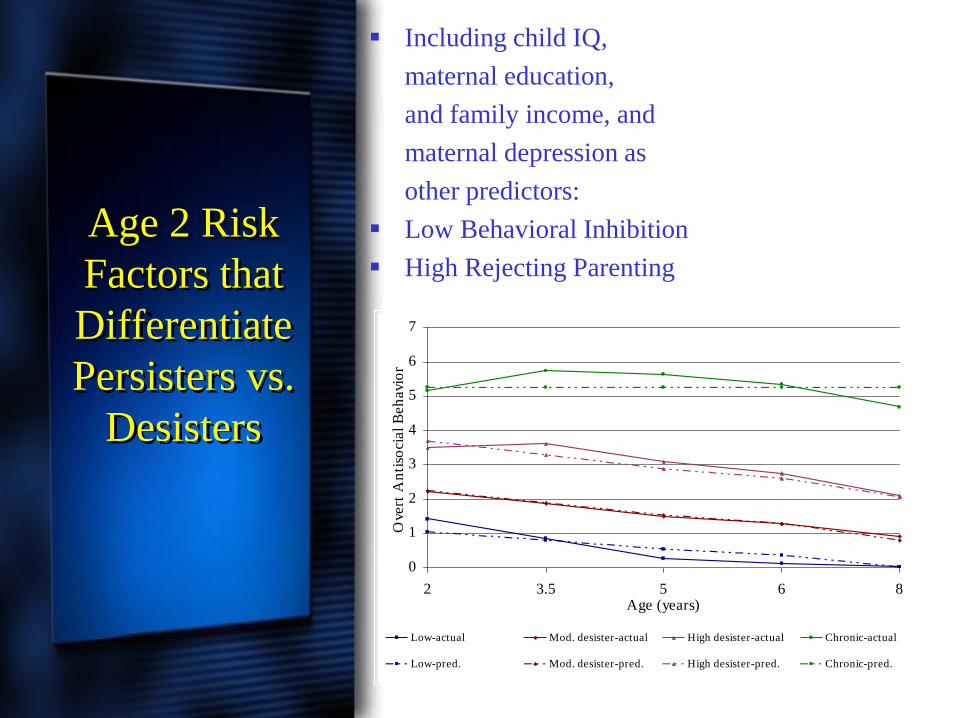
Age 2 Risk
Factors that
Differentiate
Persisters vs.
Desisters
Including child IQ,
maternal education,
and family income, and
maternal depression as
other predictors:
Low Behavioral Inhibition
High Rejecting Parenting
0
1
2
3
4
5
6
7
2 3.5 5 6 8Age (years)
Ove
rt A
nti
soci
al
Beh
avi
or
Low-actual Mod. desister-actual High desister-actual Chronic-actual
Low-pred. Mod. desister-pred. High desister-pred. Chronic-pred.

Developmental Trajectories of Youth Antisocial Behavior Ages 10-17
4 group solution with highest BIC score, all posterior probabilities > .85
Shaw, Hyde, & Brennan, 2012, Development and Psychopathology

Trajectory
Group
Differences
on Juvenile
Court
Petitions
• Low Stable -- 62% of sample: 25%
• High ‘Decreasing’ -- 5% of sample: 60%
• Late Increasing --10% of sample: 49%
• High Increasing -- 22% of sample:78%

Trajectory
Group
Differences
based on
Early
Childhood
Risk Factors
Accounting for predictors in early childhood,
• Factors that discriminated high increasers from low stable: maternal depression at ages 1.5-3.5 years
• Factors that discriminated ‘high decreasing’ group: rejecting parenting and maternal depression
Shaw et al., Development and Psychopathology, 2012
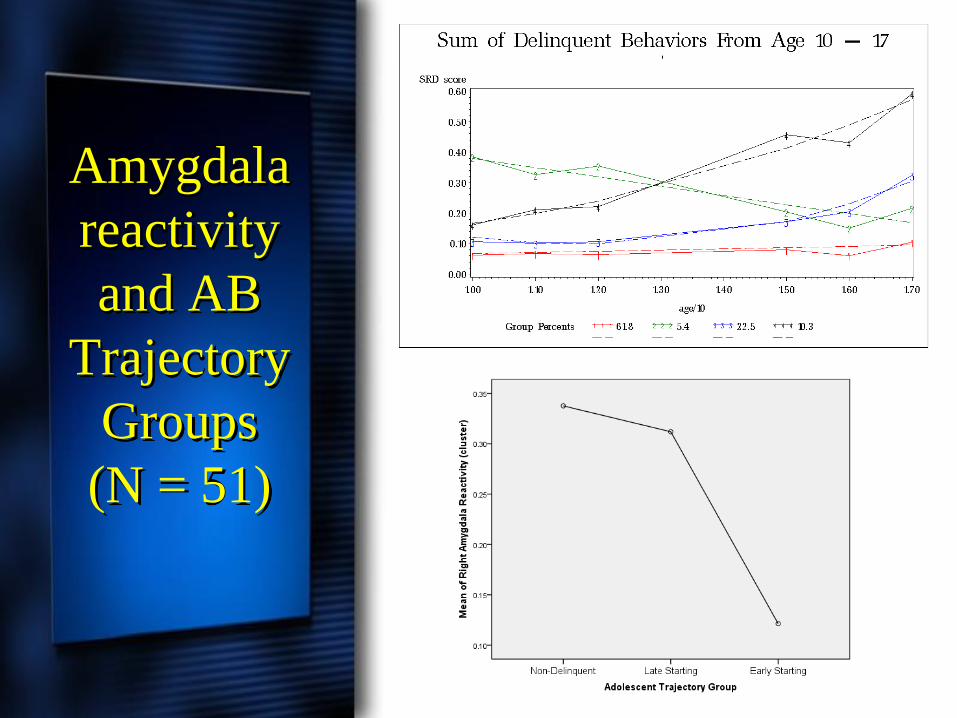
Amygdala
reactivity
and AB
Trajectory
Groups
(N = 51)

–––––––– Low MAOA Activity - - - - - - - High MAOA Activity
Choe, Shaw, & Hyde., 2014, Clinical Psychological Science

Early
Childhood
Predictors of
Serious
Violent*
Behavior in
Adolescence
• Early childhood factors
that discriminated:
– Nonoffenders vs.
nonviolent offenders
• Family income
– Violent offenders vs.
nonoffenders
• Family income, oppositional
behavior, emotion regulation
(ER), minority status
– Violent vs. nonviolent
offenders
• Rejecting parenting,
oppositional behavior, ER
Sitnick, Shaw et al., in press, Child Development
*homicide, forcible rape, sexual/physical assault,
robbery, arson, weapons possession

Sex
Differences
in Risk for
School-
Age
Conduct
Problems
o Male sex: a robust risk factor for CP
(Moffitt et al., 2001; Rutter et al., 2003)
o Risk factor prevalence
o Do boys have higher levels of risk
factors than girls?
o Findings that boys have higher
levels of child-level risk (e.g.,
inhibitory control,language
delays) than girls (Moffitt,
1993; Messer et al., 2006)
o Contextual risk differences less
clear (e.g., harsh parenting)
o Risk factor threshold
o Are associations between risk
factors and conduct problems
stronger in boys than in girls?
o Inconsistent findings (Moffitt et
al., 2001; Lahey et al., 2006;
Fergusson & Horwood, 2002)
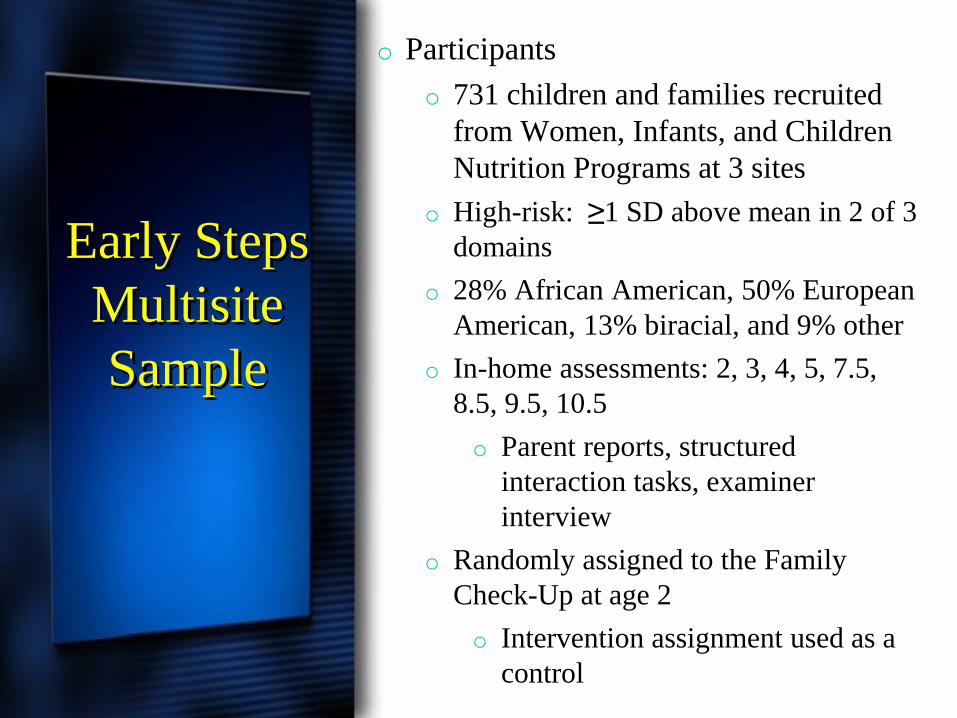
Early Steps
Multisite
Sample
o Participants
o 731 children and families recruited
from Women, Infants, and Children
Nutrition Programs at 3 sites
o High-risk: ≥1 SD above mean in 2 of 3
domains
o 28% African American, 50% European
American, 13% biracial, and 9% other
o In-home assessments: 2, 3, 4, 5, 7.5,
8.5, 9.5, 10.5
o Parent reports, structured
interaction tasks, examiner
interview
o Randomly assigned to the Family
Check-Up at age 2
o Intervention assignment used as a
control

0
0.2
0.4
0.6
0.8
1
1.2
2 3 4 5 7.5 8.5 9.5
Ag
gre
ssiv
e B
eha
vio
r M
ean
(0
-2)
Age
Male High
Female High
Male Increasing
Female
IncreasingMale Decreasing
Female
Decreasing
Developmental Trajectories of
Aggression from Ages 2 to 9.5
Brennan & Shaw, 2015
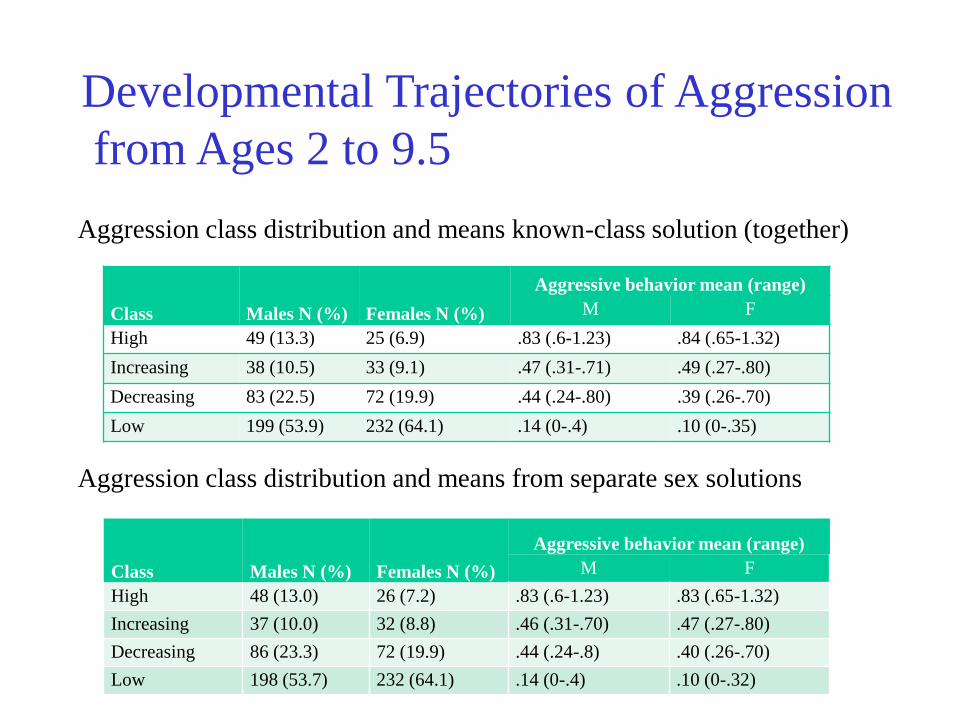
Developmental Trajectories of Aggression
from Ages 2 to 9.5
Class Males N (%) Females N (%)
Aggressive behavior mean (range)
M F
High 49 (13.3) 25 (6.9) .83 (.6-1.23) .84 (.65-1.32)
Increasing 38 (10.5) 33 (9.1) .47 (.31-.71) .49 (.27-.80)
Decreasing 83 (22.5) 72 (19.9) .44 (.24-.80) .39 (.26-.70)
Low 199 (53.9) 232 (64.1) .14 (0-.4) .10 (0-.35)
Class Males N (%) Females N (%)
Aggressive behavior mean (range)
M F
High 48 (13.0) 26 (7.2) .83 (.6-1.23) .83 (.65-1.32)
Increasing 37 (10.0) 32 (8.8) .46 (.31-.70) .47 (.27-.80)
Decreasing 86 (23.3) 72 (19.9) .44 (.24-.8) .40 (.26-.70)
Low 198 (53.7) 232 (64.1) .14 (0-.4) .10 (0-.32)
Aggression class distribution and means known-class solution (together)
Aggression class distribution and means from separate sex solutions
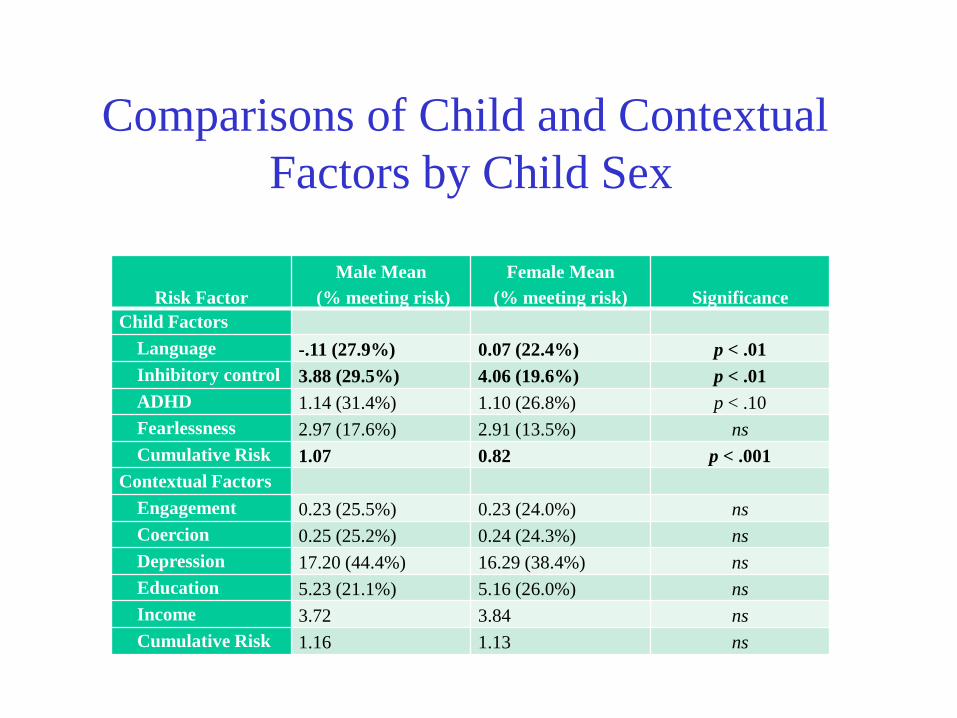
Risk Factor
Male Mean
(% meeting risk)
Female Mean
(% meeting risk) Significance
Child Factors
Language -.11 (27.9%) 0.07 (22.4%) p < .01
Inhibitory control 3.88 (29.5%) 4.06 (19.6%) p < .01
ADHD 1.14 (31.4%) 1.10 (26.8%) p < .10
Fearlessness 2.97 (17.6%) 2.91 (13.5%) ns
Cumulative Risk 1.07 0.82 p < .001
Contextual Factors
Engagement 0.23 (25.5%) 0.23 (24.0%) ns
Coercion 0.25 (25.2%) 0.24 (24.3%) ns
Depression 17.20 (44.4%) 16.29 (38.4%) ns
Education 5.23 (21.1%) 5.16 (26.0%) ns
Income 3.72 3.84 ns
Cumulative Risk 1.16 1.13 ns
Comparisons of Child and Contextual
Factors by Child Sex

Summary of FindingsFor boys, child and parenting precursors identifiable
from 1.5-2 years of age, stronger than for girls
- Both independent and interactive effects of parenting
and child
Factors that compromise parenting also related to persistence of conduct problems
- Maternal depression, social support
For male and female toddlers identified at high-risk for early conduct problems, boys’ higher risk for persistently high trajectories based on child risk, but no differences in magnitude of associations for boys and girls with similar levels of early CP
-
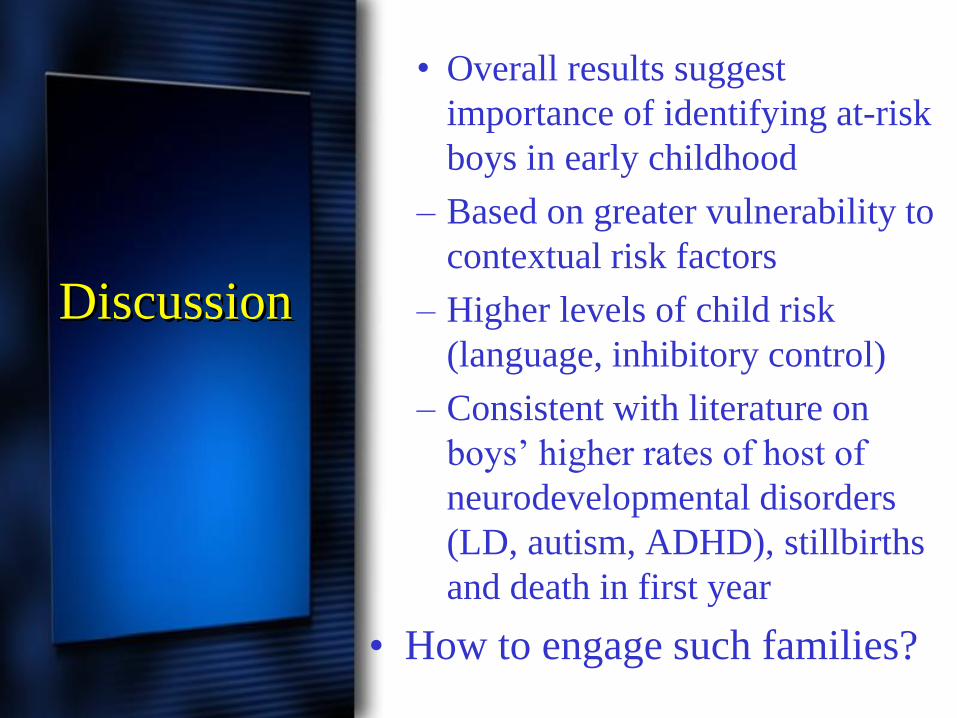
Discussion
• Overall results suggest
importance of identifying at-risk
boys in early childhood
– Based on greater vulnerability to
contextual risk factors
– Higher levels of child risk
(language, inhibitory control)
– Consistent with literature on
boys’ higher rates of host of
neurodevelopmental disorders
(LD, autism, ADHD), stillbirths
and death in first year
• How to engage such families?