early detection of foam formation in bubble columns by attractor comparison
TRANSCRIPT
Early Detection of Foam Formation in Bubble Columnsby Attractor Comparison
Javier VillaFaculty of Chemistry, Dept. of Chemical Engineering, Universidad de Alcala, 28871-Alcala de Henares´ ´
Ž .Madrid , Spain
J. Ruud van Ommen and Cor M. van den BleekDelft University of Technology, DelftChemTech, Reactor & Catalysis Engineering, Julianalaan 136, 2628 BL
Delft, The Netherlands
IntroductionBubble column reactors have many industrial applications
such as biological conversions, direct and indirect coal lique-faction, and hydrogenation reactions. In many of these appli-cations, unwanted formation of foam can take place, whichleads to a reduction in working volume, loss of product, foul-ing of sensors, and limitation in aeration rate. Therefore, foamcontrol is an important issue. In most cases, foaming occursunexpectedly and irregularly in time. Therefore, it is very im-portant to have the possibility of anticipating the foaming andto avoid all the problems associated with excessive foaming.
ŽMany research reports discuss foam control for example,Kunii et al., 1994; Takesono et al., 1994; Guitian and Joseph,´
.1998, Deshpande and Barigou, 2000 , but to our best knowl-edge, no information is available in literature about the earlydetection of foam formation.
Ž .Van Ommen et al. 2000 recently developed a monitoringmethod that was successfully used for the early detection ofagglomeration in fluidized beds. This article shows that thismonitoring method is more generic and can also be appliedfor early detection of foam formation in bubble columns.Knowing that dilute alcohol solutions simulate reasonably well
Žthe liquid-phase behavior in bioreactors Bukur and Patel,. Ž .1989 , and can also lead to foaming Pugh, 1996 , the system
waterrethanol was chosen as a model system. Experimentswere carried out both in the homogeneous and the heteroge-neous regime.
Monitoring by Attractor ComparisonThe monitoring method is based on pressure fluctuation
measurements. It compares the pressure fluctuation time-series measured in the bubble column at a certain desired
Correspondence concerning this article should be addressed to J. Ruud van Om-men.
Ž .reference state that is, without foaming to the pressuretime-series subsequently obtained during operation of the
Ž .column so-called evaluation time-series , using a statisticalŽ .test developed by Diks et al. 1996 . A short description of
the procedure is given below; refer to Van Ommen et al.Ž .2000 for a more detailed description.
The state of a bubble column at a certain time can be de-termined by projecting all variables governing the system in a
Ž .multidimensional space the ‘‘state space’’ ; the collection ofthe successive states of the system during its evolution in timeis called the ‘‘attractor’’. However, it is practically impossibleto know all governing variables of a bubble column. TakensŽ .1981 proved that the dynamic state of a system can be re-constructed from the time-series of only one characteristic
Ž .variable such as the local pressure in a bubble column . Sup-Žpose we have a reference pressure time-series p s p , p ,k 1 2
.. . . , p consisting of N values. To make the test less sensi-N pp
tive to the superficial gas velocity, we want to remove theinfluence of the standard deviation by normalizing the pres-sure time-series: the average value is subtracted from all val-ues and they are divided by the standard deviation of thetime-series. In this way, we obtain a time-series x with akmean of zero and a standard deviation of unity. In the sameway, we can convert an evaluation time-series into a normal-ized evaluation time-series y .k
Using so-called time-delay coordinates, it is possible toŽ .convert the pressure time-series x , x , . . . , x consisting1 2 Np
of N values into a set of N ymq1 delay vectors X withp p kŽ .Tm elements, where X s x , x , . . . , x . The sub-k k kq1 kq my1
sequent delay vectors can be regarded as points in an m-di-mensional state space yielding a reconstructed reference at-
Ž .tractor, which we will denote as � X . The reconstructedx iŽ .evaluation attractor will be denoted as � Y . The extent toy i
which two attractors differ can be expressed by the squared
September 2003 Vol. 49, No. 9 AIChE Journal2442

distance Q between them
m 2'Qs 2 d � H � R y � R dRŽ . Ž .Ž . Ž .x y
Ž .Diks et al. 1996 have given a procedure to calculate anˆunbiased estimator Q of the squared distance for two given
time-series. The larger the difference between two attractors,the larger their squared distance Q will be. However, we willneed to know whether or not a certain value of the estimatorQ̂ indicates a significant difference between the two delayvector sets, and, thus, between the two hydrodynamic statesof the bubble column from which they originate. Therefore,
ˆwe also need an estimate for the variance V of Q. Diks et al.Ž .1996 also derived an expression to calculate this variancefor two given time-series. Subsequently, we can define astatistic S as
Q̂Ss
ˆ'V QŽ .
The dimensionless squared distance S is a random variablewith a zero mean and standard deviation equal to unity whenthe two time-series originate from the same hydrodynamicsituation. When S�3, we know with more than 95% confi-dence that the two hydrodynamic situations differ. The rea-son to choose this method for monitoring bubble column hy-drodynamics is that it provides us with a quantitative, mathe-matically founded tool to judge whether a difference is signif-icant or not. Moreover, the method evaluates the pressuresignal as a whole and not just one property of the pressure
Ž .signal such as, the standard deviation or the main frequencyas other methods do. This makes the monitoring methodbased on attractor comparison more generic than othermethods.
Experimental StudiesThe experiments were carried out in a PMMA column of
0.19 m of internal diameter and 4 m in height. Air was blownthrough a stainless steel porous plate distributor. The columnwas filled with water to a height of 0.60 m. At certain times,small ethanol additions were made to simulate the foam for-mation process. At different heights, four pressure probes of0.18 m long and 4 mm internal diameter were inserted in thecolumn; the probe tips were located on the column axis. Threepiezoelectric pressure sensors of Kistler type 7261 connectedto probes located at 0.13, 0.33, and 0.53 m above the distribu-tor were used to measure pressure fluctuations. A Validynepressure sensor connected to a probe located at 0.43 m abovethe distributor was used to measure the hydrostatic pressureof the system. The signals were sampled at 400 Hz and lowpass filtered at 200 Hz to avoid aliasing. The length of thetime-series used for evaluation by the monitoring method was2 min. An embedding dimension, bandwidth, and segmentlength of 20, 0.5, and 2.5 s, respectively, were used to com-pute the S-statistic. For more information about the monitor-ing method parameter settings, refer to Van Ommen et al.Ž .2000 . Digital video recordings were made to follow the for-mation of the foam layer.
Figure 1. Average S -value and the average pressure( )drop dashed line as a function of the ethanol
concentration in the homogeneous regime.The S-values are calculated for pressure fluctuations mea-sured at three different heights; the average for eight valuesis given. The average pressure drop is measured over theupper part of the column.
Results and DiscussionFoam detection in the homogeneous regime
The experiments in the homogeneous regime were per-formed at a fixed superficial gas velocity of 0.029 mrs. Theethanol concentration was increased step by step to slowlyinduce foaming. We applied the monitoring method to thesystem using a pressure time-series measured with pure wa-ter as the reference state. At a certain ethanol concentration,
Žthe method calculates an S-value larger than three Figure.1 . At this point, both time-series, reference, and evaluation
differ significantly and the method detects a change in thehydrodynamics of the system as a result of the addition of thesurfactant. Figure 1 also shows that the average pressure dropover the upper part of the column is not very sensitive to thatchange. In the homogeneous regime, the pressure signalmeasured at a height of 0.53 m resulted in the most sensitive
Ž .S-value see Figure 1 . This might be due to the accumulationof surfactant in the upper part of the column.
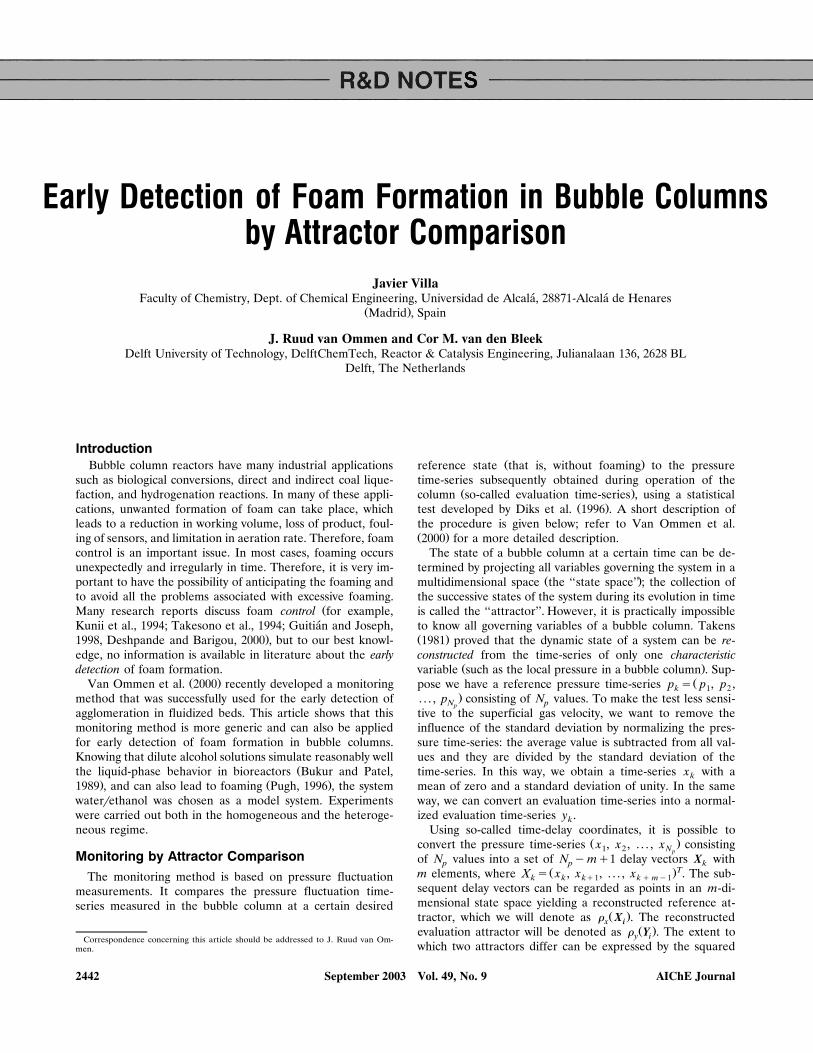
To determine if the monitoring method could be used asan early warning indicator, we used the video recordings madeduring the experiments to observe the amount of foaming foreach ethanol concentration. Figure 2 shows the S-values forpressure fluctuation measurements at 0.53 m together withpictures of the top of the column at several ethanol concen-trations. It can be seen that only at the highest concentrationserious foaming takes place. However, the monitoring methodalready exceeds the value three at much lower values. Thisindicates that the hydrodynamics already changes beforefoaming gives serious problems.
Foam detection in the heterogeneous regimeSimilar experiments were carried out in the heterogeneous
regime at a superficial gas velocity of 0.16 mrs. Figure 3 showsthat already at low ethanol concentrations the S-value be-comes larger than three. The change is sharper than in thehomogeneous regime and the concentration where the changeappears is lower. Again, the pressure drop does not clearly
September 2003 Vol. 49, No. 9AIChE Journal 2443
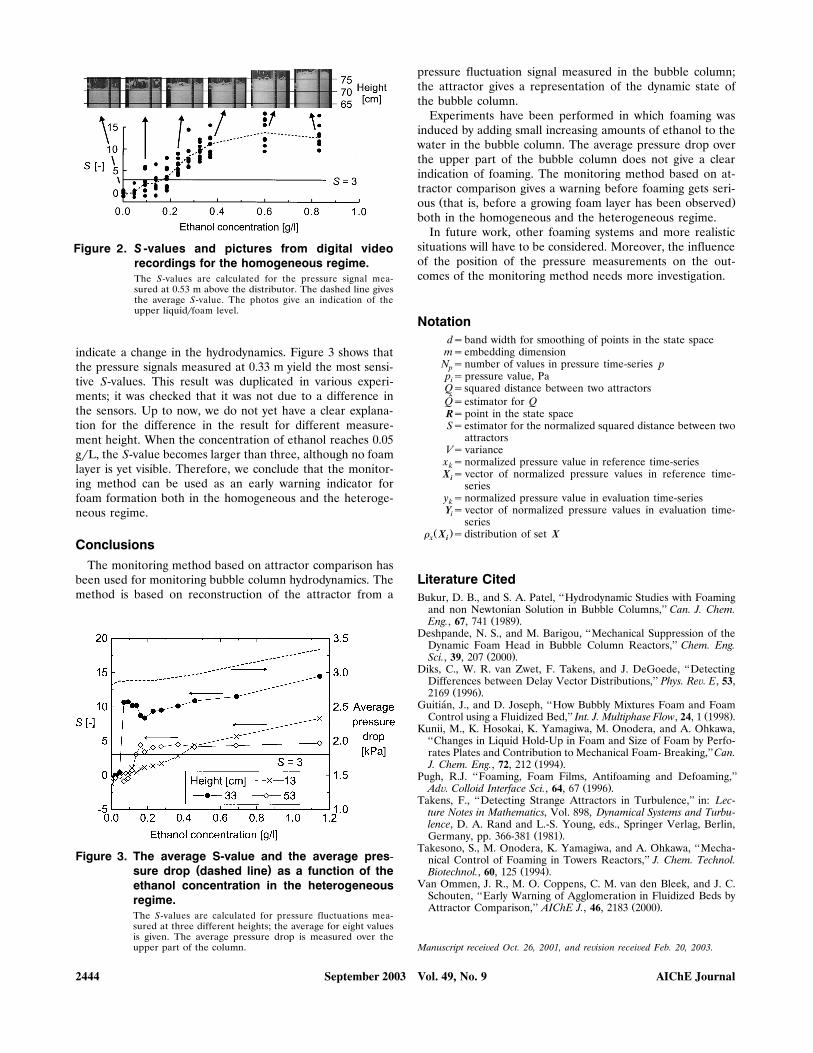
Figure 2. S -values and pictures from digital videorecordings for the homogeneous regime.The S-values are calculated for the pressure signal mea-sured at 0.53 m above the distributor. The dashed line givesthe average S-value. The photos give an indication of theupper liquidrfoam level.
indicate a change in the hydrodynamics. Figure 3 shows thatthe pressure signals measured at 0.33 m yield the most sensi-tive S-values. This result was duplicated in various experi-ments; it was checked that it was not due to a difference inthe sensors. Up to now, we do not yet have a clear explana-tion for the difference in the result for different measure-ment height. When the concentration of ethanol reaches 0.05grL, the S-value becomes larger than three, although no foamlayer is yet visible. Therefore, we conclude that the monitor-ing method can be used as an early warning indicator forfoam formation both in the homogeneous and the heteroge-neous regime.
ConclusionsThe monitoring method based on attractor comparison has
been used for monitoring bubble column hydrodynamics. Themethod is based on reconstruction of the attractor from a
Figure 3. The average S-value and the average pres-( )sure drop dashed line as a function of the
ethanol concentration in the heterogeneousregime.The S-values are calculated for pressure fluctuations mea-sured at three different heights; the average for eight valuesis given. The average pressure drop is measured over theupper part of the column.
pressure fluctuation signal measured in the bubble column;the attractor gives a representation of the dynamic state ofthe bubble column.
Experiments have been performed in which foaming wasinduced by adding small increasing amounts of ethanol to thewater in the bubble column. The average pressure drop overthe upper part of the bubble column does not give a clearindication of foaming. The monitoring method based on at-tractor comparison gives a warning before foaming gets seri-
Ž .ous that is, before a growing foam layer has been observedboth in the homogeneous and the heterogeneous regime.
In future work, other foaming systems and more realisticsituations will have to be considered. Moreover, the influenceof the position of the pressure measurements on the out-comes of the monitoring method needs more investigation.
Notationdsband width for smoothing of points in the state space
msembedding dimensionN snumber of values in pressure time-series ppp spressure value, PaiQssquared distance between two attractorsQ̂sestimator for QRspoint in the state spaceSsestimator for the normalized squared distance between two
attractorsVs variancex snormalized pressure value in reference time-serieskX s vector of normalized pressure values in reference time-i
seriesy snormalized pressure value in evaluation time-serieskYs vector of normalized pressure values in evaluation time-i
seriesŽ .� X sdistribution of set Xx i
Literature CitedBukur, D. B., and S. A. Patel, ‘‘Hydrodynamic Studies with Foaming
and non Newtonian Solution in Bubble Columns,’’ Can. J. Chem.Ž .Eng., 67, 741 1989 .
Deshpande, N. S., and M. Barigou, ‘‘Mechanical Suppression of theDynamic Foam Head in Bubble Column Reactors,’’ Chem. Eng.
Ž .Sci., 39, 207 2000 .Diks, C., W. R. van Zwet, F. Takens, and J. DeGoede, ‘‘Detecting
Differences between Delay Vector Distributions,’’ Phys. Re®. E, 53,Ž .2169 1996 .
Guitian, J., and D. Joseph, ‘‘How Bubbly Mixtures Foam and Foam´Ž .Control using a Fluidized Bed,’’ Int. J. Multiphase Flow, 24, 1 1998 .
Kunii, M., K. Hosokai, K. Yamagiwa, M. Onodera, and A. Ohkawa,‘‘Changes in Liquid Hold-Up in Foam and Size of Foam by Perfo-rates Plates and Contribution to Mechanical Foam- Breaking,’’Can.
Ž .J. Chem. Eng., 72, 212 1994 .Pugh, R.J. ‘‘Foaming, Foam Films, Antifoaming and Defoaming,’’
Ž .Ad®. Colloid Interface Sci., 64, 67 1996 .Takens, F., ‘‘Detecting Strange Attractors in Turbulence,’’ in: Lec-
ture Notes in Mathematics, Vol. 898, Dynamical Systems and Turbu-lence, D. A. Rand and L.-S. Young, eds., Springer Verlag, Berlin,
Ž .Germany, pp. 366-381 1981 .Takesono, S., M. Onodera, K. Yamagiwa, and A. Ohkawa, ‘‘Mecha-
nical Control of Foaming in Towers Reactors,’’ J. Chem. Technol.Ž .Biotechnol., 60, 125 1994 .
Van Ommen, J. R., M. O. Coppens, C. M. van den Bleek, and J. C.Schouten, ‘‘Early Warning of Agglomeration in Fluidized Beds by
Ž .Attractor Comparison,’’ AIChE J., 46, 2183 2000 .
Manuscript recei®ed Oct. 26, 2001, and re®ision recei®ed Feb. 20, 2003.
September 2003 Vol. 49, No. 9 AIChE Journal2444