early vocabulary assessment within a response to
TRANSCRIPT

University of Rhode Island University of Rhode Island
DigitalCommons@URI DigitalCommons@URI
Open Access Dissertations
2014
EARLY VOCABULARY ASSESSMENT WITHIN A RESPONSE TO EARLY VOCABULARY ASSESSMENT WITHIN A RESPONSE TO
INTERVENTION FRAMEWORK INTERVENTION FRAMEWORK
Jenlyn Furey University of Rhode Island, [email protected]
Follow this and additional works at: https://digitalcommons.uri.edu/oa_diss
Recommended Citation Recommended Citation Furey, Jenlyn, "EARLY VOCABULARY ASSESSMENT WITHIN A RESPONSE TO INTERVENTION FRAMEWORK" (2014). Open Access Dissertations. Paper 229. https://digitalcommons.uri.edu/oa_diss/229
This Dissertation is brought to you for free and open access by DigitalCommons@URI. It has been accepted for inclusion in Open Access Dissertations by an authorized administrator of DigitalCommons@URI. For more information, please contact [email protected].

EARLY VOCABULARY ASSESSMENT WITHIN A
RESPONSE TO INTERVENTION FRAMEWORK
BY
JENLYN FUREY
A DISSERTATION SUBMITTED IN PARTIAL FULFILLMENT OF THE
REQUIREMENTS FOR THE DEGREE OF
DOCTOR OF PHILOSOPHY
IN
PSYCHOLOGY
UNIVERSITY OF RHODE ISLAND
2014
DOCTOR OF PHILOSOPHY DISSERTATION
OF
JENLYN FUREY
APPROVED:
Dissertation Committee:
Major Professor Charles E. Collyer
Susan M. Rattan
Gary Stoner
Kathy Peno
Nasser H. Zawia
DEAN OF THE GRADUATE SCHOOL
UNIVERSITY OF RHODE ISLAND
2014
ABSTRACT
The current study examined the predictive and social validity of two weekly
vocabulary assessments embedded within a Tier I Kindergarten vocabulary
curriculum. Participants (N=250 Kindergarten students) received ongoing vocabulary
instruction and their target word knowledge was monitored weekly over the course of
24 weeks using two target word assessments (a Yes/No assessment and Receptive
Picture assessment). Data from the weekly vocabulary assessments were examined at
multiple time points with various cut scores. Predictive validity was examined in terms
of correct classification of student risk for poor vocabulary outcomes, and results were
compared with standardized measures of general receptive and expressive vocabulary
knowledge. Teacher judgments regarding the efficiency and effectiveness of the two
weekly vocabulary assessments were examined. Considerations for vocabulary
assessment within a multi-tiered or Response to Intervention framework are made.

iii
ACKNOWLEDGMENTS
I would like to express heartfelt gratitude to my major professor, Charlie
Collyer, who has been a constant source of support, wisdom, and encouragement
throughout my undergraduate and graduate studies. He has been there for me every
step of the way, providing thoughtful feedback and making hard work enjoyable.
Working with Charlie has made this journey so special, and I look forward to many
more years of collaboration and friendship together.
I would also like to express my sincere gratitude to Susan Rattan for her
ongoing guidance and warm encouragement as a committee member. I consider Susan
an academic role model, and it has been a pleasure to work with her and learn from
her. I especially want to thank Susan for allowing me the opportunity to work on
Project EVI over the past few years. Without Susan, Mike Coyne, and the rest of the
Project EVI research team and data collectors (including Sarah, Sheng, Jenna,
Heather, and Amy), this dissertation would not have been possible.
Gary Stoner has been extraordinarily helpful over the course of my graduate
studies, and I appreciate his time and useful suggestions as a committee member. I
have the deepest respect for Gary, and I feel fortunate for the many opportunities I
have had to collaborate with him. I would like to thank Kathy Peno for her generous
contributions as a committee member, and Su Boatright and Kristin Johnson for their
time and assistance as additional committee members.
I would like to thank my fellow doctoral students in the graduate program for
their friendship and companionship, especially Dr. Alison Mitchell, my LP. Special

iv
appreciation goes to Brad for his kindness, patience, friendship and love. Thanks also
to some of my favorite people who provided moral support along the way, including
Gram, Mimi, Jimmy, Kelley, Lou, and my big brother, Special Agent Billy Furey.
Most importantly, I would like to thank my amazing parents, Pam and Bill for
their unconditional love and support. Thanks to my dad for always being there for me,
making me laugh, and for thinking that it’s a big deal that I know how to use
PowerPoint. My deepest appreciation goes to my very best friend, my mom, who is
the strongest person I know. Thanks to my mom for always believing in me and
teaching me to never give up.

v
TABLE OF CONTENTS
ABSTRACT .................................................................................................................. ii
ACKNOWLEDGMENTS .......................................................................................... iii
TABLE OF CONTENTS ............................................................................................. v
LIST OF TABLES ..................................................................................................... vii
LIST OF FIGURES .................................................................................................... ix
CHAPTER 1: INTRODUCTION ............................................................................... 1
Early Language and Literacy Skills ...................................................................... 1
Causes and Consequences of Poor Early Language and Literacy Skills .............. 2
A Multi-Tiered Approach for Promoting Language and Literacy Skills .............. 5
Early Vocabulary Development and Instruction ................................................. 16
Early Vocabulary Assessment within a Multi-Tiered Framework ..................... 23
Curriculum Based Vocabulary Assessments ...................................................... 28
Research Questions ............................................................................................ 30
CHAPTER 2: METHODOLOGY ............................................................................ 32
Design ................................................................................................................. 32
Participants .......................................................................................................... 39
Measures ............................................................................................................. 42
Procedure............................................................................................................. 45
CHAPTER 3: RESULTS ........................................................................................... 50
Assumption of Normality for Weekly Scores ..................................................... 52
Assumption of Normality for Incrementally Averaged Scores........................... 55
Stability of the Yes/No and Receptive Picture Scores from Week to Week ...... 56
vi
Descriptive Information for Each Group ............................................................ 60
Inferential Findings ............................................................................................. 62
Correlations between Weekly Vocabulary Assessments and Outcomes ............ 63
Between-Group Differences in the Weekly Vocabulary Assessments ............... 65
Classification Accuracy of the Weekly Vocabulary Assessments ...................... 69
Receiver Operating Characteristic Curve (ROC Curve) Analyses ..................... 77
Teacher Questionnaire Results ............................................................................ 84
CHAPTER 4: DISCUSSION .................................................................................... 88
Summary of Results ............................................................................................ 89
Limitations .......................................................................................................... 90
Considerations for Early Vocabulary Assessment .............................................. 92
Future Directions ............................................................................................... 100
Conclusions ....................................................................................................... 101
APPENDIX A: Sample Yes/No Curriculum Based Vocabulary Assessment .......... 107
APPENDIX B: Sample Receptive Curriculum Based Vocabulary Assessment ...... 108
APPENDIX C: Fidelity Observation for Teacher Administration of Assessments . 109
APPENDIX D: Teacher Questionnaire: Yes/No Vocabulary Assessment ............... 111
APPENDIX E: Teacher Questionnaire: Receptive Vocabulary Assessment. .......... 112
REFERENCES ......................................................................................................... 113

vii
LIST OF TABLES
TABLE PAGE
Table 1. Comparison of Mastery Monitoring Measures vs. General Outcome
Measures.. ....................................................................................................... 14
Table 2. Stages of Word Learning... ........................................................................... 18
Table 3. Words Taught Each Week (i.e., Lesson) Through Elements of Reading:
Vocabulary Tier I Instruction.. ........................................................................ 33
Table 4. Project EVI Group Information... ................................................................. 34
Table 5. Data Collected from Each Group Through Project EVI and the Current
Study.. ............................................................................................................. 37
Table 6. Demographic Information from Each of the Four Participating Schools. .... 41
Table 7. Example of Weekly Scores vs. Incrementally Averaged Scores... ............... 51
Table 8. Summary of Descriptive Results for Each Group... ...................................... 61
Table 9. Correlations Between Pre-Intervention Measures, Weekly Assessments, and
Posttest Measures... ......................................................................................... 64
Table 10. Mann-Whitney U Test Results for Incrementally Averaged Yes/No
assessments... .................................................................................................. 66
Table 11. Classification Accuracy of the Yes/No Incrementally Averaged Measures in
Predicting the Target Receptive Post-Intervention Outcome.......................... 73
Table 12. Classification Accuracy of the PPVT-4 and EVT-2 Measures in Predicting
the Target Receptive Post-Intervention Outcome... ........................................ 74
Table 13. Classification Accuracy of the Yes/No assessment in Predicting the Target

viii
Expressive Post-Intervention Outcome... ........................................................ 76
Table 14. Classification Accuracy of the Pre-Intervention PPVT-4 Measure and the
Pre-Intervention EVT-2 Measure in Predicting the Post-Intervention Target
Expressive Outcome........................................................................................ 77
Table 15.ROC Curve Results: Area Under the Curve for Predictor Measures on Each
Outcome Measure... ........................................................................................ 79
Table 16. Teacher Responses to a Yes/No and Receptive Picture Assessment
Questionnaire... ............................................................................................... 85
Table 17. Review of Experimenter Developed Target Word Measures from 2003 to
2013... .............................................................................................................. 99
ix
LIST OF FIGURES
FIGURE PAGE
Figure 1. Summary of Project EVI Participants and Current Study Participants After
Six Classrooms Were Eliminated From Analyses. ......................................... 40
Figure 2. Sample Distributions of Yes/No Scores on Individual Weeks.. .................. 52
Figure 3. Sample Distributions of Receptive Scores on Individual Weeks. ............... 53
Figure 4. Sample Distributions of Incrementally Averaged Yes/No Data.................. 56
Figure 5. Weekly Mean Scores and Standard Deviations for the Yes/No Assessment
and Receptive Picture Assessment ................................................................. 57
Figure 6. Weekly Scores on the Yes/No assessment from Sample Control, Treatment,
and Reference Students ................................................................................... 58
Figure 7. A 2 x 2 Table of Predictors and Post-Intervention Outcomes with Formulas
Used to Examine Classification Accuracy ...................................................... 69
Figure 8. ROC Curves Comparing the PPVT-4 Screener and the Incrementally
Averaged Yes/No assessment for Weeks 1-8, Using the Target Receptive
Picture Assessment as the Outcome……………...………….……………….81
Figure 9. ROC Curves Comparing the PPVT-4 Screener and the Incrementally
Averaged Yes/No assessment for Weeks 1-11, Using the Target Expressive
Measure as the Outcome……………...……….…………………………….82
Figure 10. ROC Curves Comparing the PPVT-4 Screener and the Incrementally
Averaged Yes/No assessment for Weeks 1-8, Using the Post-Intervention
PPVT-4 as the Outcome……………...……………………………………83

1
CHAPTER 1:
INTRODUCTION
Early language and literacy skills are important predictors of reading
achievement and school success (Cunningham & Stanovich, 1997; Duncan et al.,
2007; Moats, 2010; National Reading Panel [NRP], 2000; Torgeson, 2002). Given that
students with poor early language and literacy skills are at risk for poor reading
achievement, researchers and educators have recognized the urgency of identifying
students at risk for low achievement and intervening early with evidence-based
instruction (Coyne, Capozzoli, Ware, & Loftus, 2010; Dickinson & Tabors, 2002;
Scarborough, 2001; Snow, Burns, & Griffins, 1998). While many factors can cause
children to enter school with poor early language and literacy skills, educators have an
opportunity to alter the trajectory of at risk students’ achievement through instruction
and intervention. A wealth of knowledge has been established regarding the
development, instruction, and assessment of many early language and literacy skills
(Dickinson & Neuman, 2006; Hosp, Hosp, & Howell, 2007; Moats, 2010; NRP, 2000;
Scarborough, 2001). However, more research is needed to aid educators in accurately
identifying children at risk for language and literacy difficulties, particularly in the
area of vocabulary (Loftus & Coyne, 2013; NRP, 2000).
Early Language and Literacy Skills
Reading researchers have indicated that word recognition abilities and
language comprehension abilities each play a foundational role in promoting skilled
2
reading. Word recognition skills include the use of phonological awareness, decoding,
and sight word recognition, while language comprehension skills include the use of
background knowledge, language structures, verbal reasoning, literacy knowledge,
and vocabulary (Scarborough, 2001). A report by the National Reading Panel (2000)
concluded that the five “pillars” of proficient reading achievement include skilled
phonemic awareness, phonics, fluency, vocabulary, and comprehension.
Research has shown that in the early grades, struggling readers often
experience difficulty with word recognition skills, especially phonemic awareness
(Scarborough, 2001; Torgeson, 2002). Given these findings, much attention has been
devoted to bolstering word recognition skills in the early elementary grades. However,
a misconception held by many educators is the belief that word recognition skills must
be established prior to teaching language comprehension skills (Biemiller, 2001).
Although word recognition skills tend to be the focus of reading instruction in early
elementary grades, a more effective approach entails simultaneously supporting word
recognition skills and language skills through high quality, systematic, and explicit
instruction beginning in Kindergarten (Biemiller, 2001). A comprehensive approach to
promote reading success includes explicit and direct vocabulary instruction in the
early elementary grades.
Causes and Consequences of Poor Early Language and Literacy Skills
For many reasons, children enter school with considerably different levels of
early language and pre-reading skills. One reason for this variability is that children
from families of low socioeconomic status have far less exposure to rich oral language
compared to children from families of high socioeconomic status. In a longitudinal

3
study by Hart and Risley (1995), the researchers visited 42 families monthly over the
course of two years, and recorded the language (e.g., the number and nature of
utterances) that one and two year old children were exposed to through
communications at home. The findings revealed that children from families of low
socioeconomic status (SES) were exposed to substantially less oral language at home,
in comparison to children from families of middle and high SES. The researchers
extrapolated that by age three, the differences in word exposure amounted to a 30
million word gap between children from families of high SES and low SES. As a
consequence, the children from low SES families were at a substantial disadvantage in
terms of their vocabulary knowledge prior to entering Kindergarten. A follow-up
study indicated that the children’s vocabulary knowledge at age three strongly
predicted their vocabulary knowledge at ages nine and ten (Hart & Risley, 1995). The
follow-up findings provide evidence that the gap in word knowledge persisted over
time, and initially disadvantaged children were not able to “catch up” to their
advantaged peers when they began school. Replication studies (e.g., Dickinson &
Tabors, 2002) with similar findings have encouraged the need for high quality early
intervention for disadvantaged children.
Recent data indicate a large gap in reading achievement between advantaged
and disadvantaged children. Findings from the 2012 National Assessment of
Educational Progress indicate that 80% of children from lower income families scored
below proficiency in fourth grade reading achievement, while 49% of children from
higher income families scored below proficiency in fourth grade reading achievement
(National Center for Education Statistics [NCES], 2013). While differences in

4
exposure to rich oral language plays a role in this discrepancy, it is also necessary to
acknowledge the many risk factors associated with childhood poverty, including
higher rates of violence, lead poisoning, air and noise pollution, family stress, and
health problems (Evans, 2004). In society today, proficient language and literacy skills
promote opportunities for school success and increased control over career
opportunities and life outcomes. Children with disadvantaged backgrounds often begin
formal education lacking prerequisite skills for school success (Biemiller, 2001; Hart
& Risley, 1995). Without early intervention, many children will continue to struggle
with language and literacy.
Researchers and educators have recognized the need to close the gap by
providing at risk students with early interventions to build foundational skills.
Intervening early is essential, in order to minimize the problem of “Matthew Effects”
(Stanovich, 1986), in which the “rich get richer and the poor get poorer” over time,
increasing the achievement gap between advantaged and disadvantaged children. For
example, research has demonstrated that one way children bolster their vocabulary
knowledge is by frequently engaging in reading. Skilled readers tend to read widely,
encountering many novel vocabulary words in texts, further bolstering their language
and reading skills. However, individuals who lack the skills to read advanced texts are
not exposed to rich vocabulary through texts (Stanovich, 1986). Furthermore,
individuals with poor reading skills are less likely to engage in frequent reading
compared to their peers with proficient reading skills (Morgan, Fuchs, Compton,
Cordray, & Fuchs, 2008). Findings from the most recent National Assessment of
Educational Progress report show that students who read frequently for enjoyment

5
(almost daily, or once or twice a week) had higher levels of reading proficiency
compared to students who reported reading for fun infrequently (a few times a year or
less) (NCES, 2013).
Many reciprocal interactions between initial skills and learning demands cause
initially disadvantaged students to fall further behind their peers over time.
Scarborough (2001) reported that of the children who experience early language and
literacy difficulties, 65%-75% continue to experience difficulties in subsequent years.
Conversely, of children who do not experience early language and literacy difficulties,
only 5% -10% have difficulties in subsequent years. Research has indicated that
individuals with limited vocabulary tend to learn new words at a slower rate compared
to their peers with larger vocabularies (Coyne, Simmons, Kame’enui, & Stoolmiller,
2004). Over time, the achievement gap between students with underdeveloped early
language and literacy skills and their advantaged peers tends to increase unless
interventions are put in place to close the achievement gap (Hart & Risley, 1995;
Snow, Burns, & Griffin, 1998; Torgeson, 2002).
A Multi-Tiered Approach for Promoting Language and Literacy Skills
Researchers have emphasized the need for instructional practices that aim to
prevent language and literacy difficulties, and to intervene as early as possible when
students do not make adequate progress towards important outcomes (Bradley,
Danielson, & Doolittle, 2005; Cunningham & Stanovich, 1997; Wanzek & Vaughn,
2007). Such initiatives have been guided by a public health model approach to
education, based on the idea that preventing academic problems is more effective and
efficient than remediating problems (Gutkin, 2012; Torgesen, 2002). A proactive

6
approach towards language and literacy development is particularly important,
considering the evidence that early reading skills strongly predict future reading
acquisition (Cunningham & Stanovich, 1997; Scarborough, 2001).
Response to Intervention (RtI) is a framework for providing multi-tiered,
differentiated instruction and supports to all students (National Center on Response to
Intervention [NCRTI], 2010). Schools using an RtI framework recognize that students
vary in terms of the level of instructional supports they need to learn and succeed
academically. As such, schools that implement an RtI framework regularly and
systematically identify students in need of additional support, and provide appropriate
support as needed. While researchers, educators, and school psychologists have long
recognized within-child factors that can affect student learning (e.g., intrinsic learning
or attention problems, etc.), it is important to note that ecological factors (e.g., the
quality of previous instruction, parent support, etc.) also play an important role in
promoting or prohibiting student learning (Gutkin, 2012). With multiple tiers of
support in place, students with diverse learning needs are supported, regardless of the
underlying cause of learning difficulties. As Brown-Chidsey and Steege (2010)
emphasized, “…the nature of the interventions provided to help students overcome
school difficulties is more important than the etiology or symptoms” (p. 27).
Key components of an RtI framework include the use of evidence-based,
differentiated instruction and the use of a comprehensive assessment plan that includes
screening, progress monitoring, and diagnostic assessment (NCRTI, 2010). Evidence-
based instruction refers to instructional methods or curricula that have empirical
support for promoting learning for most students. Differentiated instruction refers to

7
instruction that continuously targets the specific needs of individual students. The
universal level of support, or Tier I support, is high quality instruction in the
classroom. In an RtI model, the instructional practices provided through Tier I meet
the learning needs of most students (approximately 80% of students in the classroom).
For various reasons, some students (approximately 15%) will need Tier II support
(e.g., more instructional time, more opportunities to practice, more feedback, small
group instruction, etc.), in addition to Tier I instruction, to reach their learning goals.
A few students (approximately 5%) will require additional intensive Tier III supports
(e.g., increased instructional time, more explicit instruction, more opportunities to
practice skills, more feedback, and one-to-one or small group instruction) to reach
their learning goals (Burns & Gibbons, 2008).
Through data-based decision-making, educators identify students who need
additional support, determine the specific skills that need to be targeted for
interventions, and monitor how effective the interventions are in promoting learning
(Brown-Chidsey & Steege, 2010). Universal screenings, diagnostic assessments, and
progress monitoring are RtI assessment methods that promote timely and efficient
instructional decision-making. Universal screening is typically done three times
throughout an academic year within an RtI framework (Hosp et al., 2007). The
purpose of universal screening is to identify all students who are low performing and
in need of additional support. Screening tools should accurately predict students who
are at risk for learning difficulties and therefore would benefit from additional support.
In circumstances when the majority of students in a classroom are identified as being
at risk, modifications should be made in Tier I instruction (Brown-Chidsey & Steege,

8
2010; Burns & Gibbons, 2008). In an RtI framework, individual student progress is
monitored to guide instructional decision-making and bolster language and literacy
development. It is important to continually monitor individual students’ progress
towards proficient reading using efficient and technically adequate measures. Doing so
allows educators to adapt their instruction and determine whether or not a particular
intervention is effective (Fuchs, Fuchs & Vaughn, 2008).
Bloom, Hastings and Madaus (1971) described the need for classroom teachers
to differentiate instruction to facilitate learning for all children. Many assessments in
schools today measure differences in student aptitudes for learning in a given area.
Bloom et al. (1971) argued that the use of such aptitude tests lead many teachers and
students to believe that high levels of achievement are only possible for initially high
performing students. Carroll (1963) reasoned that “aptitude is the amount of time
required by the learner to attain mastery of a learning task” (as cited in Bloom et al.,
1971, p. 46). In Carroll’s view, most students can become successful learners, if given
appropriate time and instruction. Formative evaluations are valuable for effectively
gauging students’ instructional needs.
In a formative evaluation, a course or subject is broken up into smaller units of
learning, and assessments are administered after the end of each unit (Bloom et al.,
1971). The data obtained from formative assessments are used to determine which
students have mastered the learning objectives, and which students have not. For the
students who have not yet mastered a given skill, teachers can use formative
assessment data to determine the specific area(s) of difficulty and provide appropriate
instruction. Importantly, such assessments are not intended to grade or judge students,

9
but rather they are intended to be used as a tool to guide instruction and improve
student learning (Stiggins, 2001). Summative assessments, on the other hand, are
intended for grading and evaluating the outcome of instruction and learning (Bloom et
al., 1971).
Formative assessment data are used in schools today to identify student
instructional needs in a timely manner (Wiliam, 2006; Burns & Gibbons, 2008).
Research has demonstrated that formative assessments are powerful tools for
improving student learning (Black & Wiliam, 2009). In fact, a review of over 800
studies found the use of frequent formative assessment to be the most powerful
teaching variable to affect student learning (Hattie, 2009). The ongoing use of
formative assessments allows educators to allocate appropriate resources within a
multi-tiered service delivery framework, such as Response to Intervention (Burns &
Gibbons, 2008).
Curriculum Based Assessments are widely used tools for formative assessment
and evaluation. Curriculum Based Assessments are measurements that use “direct
observation and recording of a student’s performance in the local curriculum as a basis
for gathering information to make instructional decisions” (Deno, 1987, p. 41).
Curriculum Based Assessment (CBA) is considered a broad “umbrella” term, and
there are many forms, including Curriculum Based Measurement (CBM), Curriculum
Based Evaluation (CBE), Criterion-Referenced Curriculum Based Assessment (CR-
CBA), and Curriculum Based Assessment for Instructional Design (CBA-ID) (Hintze,
Christ, & Methe, 2006). Curriculum-based assessments can be divided into two major
forms: specific sub-skill mastery measurements (CBE, CR-CBA, and CBA-ID), or

10
general outcomes measurements (CBM). Each form of CBA addresses different
questions regarding instructional decision-making, and no single form provides
comprehensive information regarding the evaluation of and intervention for academic
problems (Hintze, Christ, & Methe, 2006). Therefore, it is helpful to understand each
form of CBA independently to inform the most appropriate measure to use in a given
context.
In the area of specific sub-skill mastery measurement, a global curriculum is
sequenced into short-term sub-skills, and mastery of each unique sub-skill is
measured. Mastery measures are typically not standardized, and the format of
measures can shift depending on the skill that is assessed. For example, within the
domain of reading, decoding skills are typically sequenced beginning with relatively
simple decoding skills (e.g., decoding CVC words). Once mastery measures indicate
that a student has mastered a specific skill, the student receives instruction for the next
short-term skill in the curriculum sequence (Hintze, Christ, & Methe, 2006). The
mastery measures are closely aligned with the specific curriculum, and therefore are
likely to have high content validity and social validity (i.e., the assessments measure
what was taught).
With Curriculum Based Assessment for Instructional Design (CBA-ID;
Gickling & Havertape, 1981), the goal is to determine a student’s current instructional
needs by aligning the content of the assessment with the current content of instruction.
With CBA-ID, excessive amounts of unknown information are not included in the
assessment, but instead the content is closely aligned with current instructional skill
areas (Hintze, Christ, & Methe, 2006). Teachers use CBA-ID data to control the

11
timing at which new instructional topics (e.g., sub-skills) are introduced to individual
students (Gickling & Havertape, 1981). For example, a teacher might monitor a
student’s progress towards mastery of decoding CVC words before moving on to
teaching and assessing CVCe decoding skills.
With Criterion Referenced Curriculum Based Assessment (CR-CBA; Idol &
Paolucci-Whitcomb, 1999), the goal again is to determine a student’s current
instructional needs. However, within a CR-CBA, several levels of the curriculum are
assessed at once. With CR-CBAs, the content consists of skills that have already been
taught and skills that have not yet been taught. A student’s performance is compared
with mastery criteria (e.g., using local norms to determine acceptable performance
levels) (Idol, Nevin, & Paolucci-Whitcomb, 1999). CR-CBAs can be used to monitor
long-term growth of skills from a sequenced curriculum.
Curriculum Based Evaluation (CBE; Howell, 1986) is a process in which
survey-level assessments are used to sample from a wide range of skills within a
particular domain, such as reading (Hintze, Christ, & Methe, 2006). For example, oral
reading fluency probes are often used as a survey level assessment of a student’s
current level of reading proficiency (Hosp et al., 2007). Using the results of a survey-
level assessment, follow-up diagnostic assessments are administered to examine
mastery levels for specific sub-skills and to determine the specific areas in which more
instruction is needed (e.g., silent-e endings, digraph patterns, etc.). CBE is a
systematic process for determining a student’s current instructional needs, in terms of
the specific skills that have or have not been mastered (Hosp et al., 2007).

12
In the area of general outcome measurements, global indicators of basic skills
are measured repeatedly to monitor long-term growth in a particular domain.
Curriculum-Based Measurements (CBM; Deno, 1987) are general outcome measures,
or standard measures of basic skills such as reading, spelling, writing, or mathematics.
In contrast to mastery measurements, CBMs are not aligned precisely with the specific
content taught in the curriculum. CBMs are used as dynamic indicators of basic skills
or DIBS to guide formative evaluation (Deno, 1987). CBMs are dynamic or sensitive
to differences between individuals and within individuals over time. The measures
also serve as evidence-based indicators of basic skills, such as reading (Shinn, 1998).
While CBMs are not as closely aligned with the instructional curriculum as mastery
measurements are, they are standardized, efficient to administer, sensitive to short-
term and long-term improvement and have established acceptable psychometric
properties (Hosp et al., 2007). As Shinn (1998) described, CBMs can be regarded as
“academic thermometers”, used to monitor indicators of overall academic health in a
particular domain (e.g., reading). However, CBMs are not useful for identifying
specific areas of weakness (Shinn, 1998).
While there is evidence that CBAs are useful as screening, progress
monitoring, and diagnostic instructional decision-making tools in areas such as
phonemic awareness, phonics, fluency, comprehension, there is currently insufficient
research regarding useful vocabulary assessments within an RtI framework (Loftus &
Coyne, 2013). Other reading skills work well within a general outcome or mastery
measurement system (e.g., oral reading fluency); however, the measurement of
vocabulary poses unique challenges. For example, given the vast number of

13
vocabulary words (over 500,000 distinct word types; Nagy & Anderson, 1984),
general outcome measures for long-term vocabulary achievement do not have
adequate sensitivity to capture short-term growth in vocabulary knowledge. A general
outcome approach to monitoring vocabulary growth would be less useful for
informing instructional decision-making, given the vast number of words available for
learning and assessing. Mastery measures are more appropriate for monitoring
vocabulary knowledge, because mastery measures promote alignment between what is
taught and what is assessed. However, the nature of using vocabulary mastery
measurement differs from mastery measurement in other reading skills. Typically,
mastery measures are used to monitor mastery of specific skills over a relatively short
period of time. In the case of vocabulary, mastery monitoring could continue over the
course of a lifetime as an individual continues to learn new words.
Jenkins, Graff and Miglioretti (2009) recommend using general outcome
measures sparingly (not more frequently than is necessary to establish a reliable
estimate of growth). Formative assessment tools that monitor progress toward mastery
of specific objectives or skills are more useful for informing day-to-day instructional
decision-making. General outcome measures are useful as indicators, or indirect
measures of growth in sub-skills; however, to facilitate ongoing differentiated
instruction and flexible intervention groups, mastery measurement is often more useful
to educators. A summary and comparison of general outcome measurement and
mastery monitoring measurement is provided in Table 1.

14
Table 1
Comparison of Mastery Monitoring Measures vs. General Outcome Measures
General Outcome Measurement Mastery Monitoring Measurement
What is
measured?
Broad achievement domains (e.g.,
reading, spelling).
Specific skills that are mastered
over a short period of time (e.g.,
CVC word decoding).
What do the
measures look
like?
Multiple standard measures of
equal difficulty (e.g., multiple
probes with adequate alternate
form reliability).
Multiple unique measures that
may vary in difficulty as the unit
or objectives change.
How are the
data used?
Used to monitor progress toward
long-term achievement in broad
domain areas (e.g., reading);
Used to identify students at risk
for low achievement in broad
domain areas.
Used to monitor progress toward
short-term achievement in specific
skill areas (e.g., CVC word
decoding); Used to document
mastery of specific skills.
How often is it
administered?
Typically administered weekly
for progress monitoring; tri-
annually for universal screening.
Administered at the end of each
unit (frequency may vary).
What are the
benefits?
Allows for continuous assessment
of retention and generalization in
broad domain areas; The method
of assessment is consistent over
time.
Strong instructional validity
(teachers can evaluate what
students have/have not learned);
Items on measures are aligned
with the specific
curriculum/instruction.
What are the
limitations?
Weak instructional validity; Does
not provide diagnostic
information.
Information regarding reliability,
validity, sensitivity to
improvement might not be
available; Might not capture
retention of previously taught
content; Might not test for
generalization of skills.
Note: The information included in this table was obtained from Shinn (1998) and
Hintze, Christ & Methe (2006).

15
A wealth of research has been conducted to explore best practices in promoting
code-based skills (e.g., phonemic awareness, phonics) within a multi-tiered or RtI
framework (Hosp et al., 2007). For example, the Dynamic Indicators of Basic Literacy
Skills or DIBELS (University of Oregon Center on Teaching and Learning, 2014; see
Kaminski & Good, 1996) include widely used general outcome measures in skills such
as phonological awareness, alphabetic principles, phonics, oral reading fluency, and
comprehension. Far less attention has been devoted to instructional strategies and
assessment tools for early vocabulary acquisition (Biemiller, 2001; Loftus & Coyne,
2013; NRP, 2000). The tools that have been developed to monitor vocabulary progress
have not established adequate sensitivity for short term gains in vocabulary
knowledge, and therefore are of limited use. Tools measuring general vocabulary
knowledge (i.e., items reflect a sampling of words that were not necessarily targeted
for direct instruction) are not likely to be effective in capturing ongoing gains in word
knowledge (NRP, 2000; Paris, 2005; Stahl & Bravo, 2010).
Researchers have agreed that it is a challenge to measure vocabulary
knowledge within an RtI framework (Beck, McKeown, & Kucan, 2002; Loftus &
Coyne, 2013; NRP, 2000; Paris, 2005). One of the challenges of measuring word
knowledge is determining what it means to know a word (Beck et al., 2002). Another
challenge is determining the most effective methods for measuring word knowledge
(NRP, 2000). Before discussing vocabulary assessment methods, is first helpful to
provide an overview of the nature of vocabulary development and evidence-based
instructional strategies.

16
Early Vocabulary Development and Instruction
Although vocabulary knowledge and growth varies from one child to the next,
most children’s lexicons grow substantially during the second year of life (Bates et al.,
1988, as cited in Snow, Burns & Griffin, 1998) and continue to grow rapidly through
preschool and subsequent school years. Researchers distinguish between multiple
forms of vocabulary, including receptive vocabulary and productive vocabulary (NRP,
2000). Receptive vocabulary refers to words that an individual is able to recognize
(e.g., words that are understood when presented through speech or writing).
Productive vocabulary refers to words that an individual is able to produce (e.g.,
words that an individual can produce through speech or through writing). Receptive
and productive vocabularies can be further sorted into categories of oral vocabulary
(words that are understood or produced through speech or oral language) or reading
vocabulary (words that are understood or produced through text or writing) (NRP,
2000).
Researchers have attempted to estimate vocabulary size and rate of growth;
however, this task is difficult for two reasons. First, there are challenges in defining
what it means to know a word. Additionally, different procedures and measures have
been used to capture vocabulary knowledge (Beck et al., 2002), leading to
inconsistencies in estimations of vocabulary knowledge. Researchers have estimated
that the average school-age child learns (or, becomes aware of) approximately seven
new words a day (Just & Carpenter, 1987; Nagy & Herman, 1987; Smith, 1941; as
cited in Snow, Burns, & Griffin, 1998). However, the number of words learned per
day can vary substantially from one student to the next. While some students learn

17
well over seven new words per day, some students learn two new words a day or
fewer (Beck et al., 2002). Research has indicated that children who enter school with
limited vocabularies learn new words at a lower rate compared to students who enter
school with rich vocabularies (Baker, Kame’enui, Simmons, & Simonsen, 2007;
Baker, Simmons, & Kame’enui, 1997; Hart & Risley, 1995).
Language and literacy researchers have asked the question, what does it mean
to know a word? Carey (1978) explained that initially, a “fast mapping” process of
word learning takes place. During this process, the individual has a very basic sense of
the meaning of the word. According to Carey (1978) it is not until the individual has
used and understood the word in multiple contexts that “extended mapping” or a more
advanced knowledge of the word can occur. Several other perspectives of word
learning have been put forth by researchers (see Table 2). Each perspective recognizes
that word knowledge is not an all or nothing phenomena (Beck et al., 2000). Instead,
word knowledge deepens incrementally as an individual uses and understands words
in multiple contexts (Stahl, 2003; Beck et al., 2002). Determining an individual’s word
knowledge is a difficult and nuanced task.
One of the most important components of effective vocabulary instruction is
selecting appropriate words to teach. Nagy and Anderson (1984) analyzed words in
printed school materials for Grades 3-9 and identified over 88,500 distinct word
families (e.g., motivate, motivated, motivates, motivating, motivation, motivations,
motives, motivational, and unmotivated are categorized as one distinct word family).
Given that there are thousands of words to choose from, researchers have categorized
the most important types of words for educators to teach directly. Beck et al. (2002)

18
encourage careful selection of target words that are useful and likely to bolster
language comprehension.
Table 2
Stages of Word Learning
Author Description of Stages or Categorizations of Word Knowledge
Dale (1965) 1. Never saw it before
2. Heard it, but doesn’t know what it means
3. Recognizes it in context as having something to do with ___.
4. Knows it well.
Beck, McKeown, & 1. No knowledge
Omanson (1987) 2. General sense, such as knowing mendacious has a negative
connotation.
3. Narrow, context-bound knowledge, such as knowing that a
radiant bride is a beautifully smiling happy one, but unable to
describe an individual in a different context as radiant.
4. Having knowledge of a word but not being able to recall it
readily enough to use it in appropriate situations.
5. Rich, decontextualized knowledge of a word’s meaning, its
relationship to other words, and its extension to metaphorical
uses, such as understanding what someone is doing when they
are devouring a book.
Cronbach (1942) 1. Generalization: The ability to define a word.
2. Application: The ability to select or recognize situations
appropriate to a word.
3. Precision: The ability to apply a term correctly to all
situations and to recognize inappropriate use.
4. Availability: The actual use of a word in thinking and
discourse.
Note: The information provided in this table was obtained from Beck et al. (2002, pp.
9-10).

19
Beck et al. (2002) distinguish between three tiers of words (unrelated to the
tiers of support referenced in an RtI framework). Tier One words are common,
everyday words such as clock, chair, and hand. Tier One words are relatively simple
to conceptualize, and most individuals learn these words quickly and easily through
everyday interactions and experiences. Tier Two words (e.g., operate, maintain, and
previous) are less common, more abstract terms that are used across many different
content areas. Tier Three words (e.g., peninsula, abolitionist, and isotope) are
uncommon, specialized, and limited to specific academic domains (Beck et al., 2002).
Tier Two and Tier Three words (Beck et al., 2002) align with what
Blachowicz, Fisher, Ogle, and Taffe (2013) referred to as academic vocabulary.
Academic vocabulary refers to content-area words that are often unfamiliar to students
until they are presented in academic contexts (e.g., by teachers, in texts, or other
academic resources). Unlike Tier One words, Tier Two and Three words are difficult
to learn through incidental exposure, because they are more abstract. Vocabulary
researchers suggest that Tier Two words or general academic vocabulary terms are
especially useful to teach, because they are found across disciplines and content areas,
and do not require domain-specific knowledge (Beck et al., 2002).
Given the large number of words in the English language, researchers and
educators have debated over the merits of a breadth versus depth approach to early
vocabulary instruction. In other words, in the allotted time available for vocabulary
instruction, should educators provide extensive, direct instruction for a few words, or
should they aim to cover many words through brief, incidental vocabulary instruction?
Research has demonstrated that direct vocabulary instruction of Tier Two words has

20
more powerful long-term effects than incidental exposure approaches to vocabulary
instruction (Coyne, McCoach, Loftus, Zipoli, & Kapp, 2009; Maynard, Pullen, &
Coyne, 2010), particularly for students with underdeveloped vocabulary knowledge.
Evidence-based practices for promoting vocabulary knowledge include
selecting appropriate target words, teaching words directly, using student-friendly
definitions, reinforcing the definition in multiple contexts, providing rich and varied
language experiences, storybook reading, fostering word consciousness, teaching word
learning strategies (such as looking for prefixes and root words), and providing
students with multiple opportunities for practice and feedback (Beck et al., 2002).
Vocabulary researchers (Beck et al., 2002; Biemiller, 2001; Coyne et al., 2009) have
cautioned educators against relying on incidental vocabulary learning to build
students’ vocabulary for Tier Two words. Research has indicated that relying on
contextual clues to learn new Tier Two words can provide inaccurate understandings
of novel words, especially for individuals with low levels of reading achievement and
vocabulary knowledge (Beck et al., 2002).
Studies have shown that repeated readings of storybooks paired with explicit,
rich explanations of Tier Two words is an effective method for bolstering the
vocabulary of children at risk of reading difficulty (Coyne, Simmons, Kame’enui, &
Stoolmiller, 2004; Loftus, Coyne, McCoach, Zipoli, & Pullen, 2010; Maynard, Pullen,
& Coyne, 2010). Vocabulary growth through shared storybook readings has also been
documented with children who are English Learners (Collins, 2010; Hickman,
Pollard-Durodola, & Vaughn, 2004; Silverman, 2007). Importantly, the most effective
approach for promoting vocabulary growth through shared storybook approaches

21
includes purposeful selection of Tier Two words, providing student-friendly
definitions, and planning lessons and activities to promote target word use in rich
contexts (Coyne et al., 2004). Incidental exposure to words through storybook reading
is less effective for promoting vocabulary knowledge, particularly for students with
limited vocabulary or students who are English Language Learners (Collins, 2010;
Coyne et al., 2005; Coyne, McCoach, & Kapp, 2007; Maynard et al., 2010).
While educators can select storybooks, Tier Two words, student-friendly
definitions, and develop activities and lessons to promote vocabulary growth, many
educators prefer using available curricula for vocabulary instruction. Early vocabulary
curricula are available for educators to use, with pre-selected Tier Two words, stories,
and rich oral language activities included. A small number of commercially available
early vocabulary curricula have been developed, allowing educators the opportunity to
use systematic, evidence-based direct vocabulary instruction. Of the handful of
commercially available vocabulary curricula, one of the most widely used is the
Elements of Reading: Vocabulary curriculum by Beck and McKeown (2004).
The Elements of Reading: Vocabulary curriculum has been supported by
research (Apthorp et al., 2012; Resendez & Azin, 2007) as an effective program for
bolstering proximal (target word) vocabulary knowledge. The Elements of Reading:
Vocabulary program is available for use in Kindergarten through fifth grade. The
Kindergarten curriculum includes 20 minute daily lessons, 5 days a week over the
course of 24 weeks. Each week, five new words are taught in a whole-class (Tier I)
setting, using a variety of activities, including read-alouds, viewing photo cards,
learning examples and non-examples of target words, and participating in increasingly

22
challenging discussions and activities using the target words in various contexts. The
target words that are used are sophisticated, unfamiliar, Tier Two words (Beck et al.,
2002), such as inquire, reluctant, glance, pursue, lively, peculiar, describe, ancient,
enormous, expectation, and memorable. For each of the target words (120 total target
words in the curriculum) a student-friendly definition is provided. For example, the
definition for the word reluctant is “not sure that you want to do something”, the
definition for the word describe is “tell what something looks like or feels like”, and
the definition for the word peculiar is “strange, unusual, or weird”. When
implemented with fidelity, research has indicated that the Elements of Reading:
Vocabulary curriculum promotes vocabulary growth for young children (Apthorp et
al., 2012; Resendez & Azin, 2007).
Even with the use of evidence-based vocabulary curricula, a major challenge to
effective instruction is the heterogeneity of student vocabulary knowledge in a given
classroom. Research has documented that children enter formal schooling with widely
differing levels of language and literacy skills (Hart & Risley, 1995; Dickinson &
Tabors, 2002). Given these findings, it is important that educators not only use
evidence-based instructional practices in the classroom (Tier I), but also that the
instruction is differentiated depending on the instructional needs of individual
children. The most effective and appropriate method for differentiating instruction is
to use technically adequate formative assessments to guide instructional decision-
making (Good & Kaminski, 1996).

23
Early Vocabulary Assessment within a Multi-Tiered Framework
Research has shown that direct assessment of early language and literacy skills
provides stronger predictive validity compared to teacher judgments, in terms of
correctly identifying students who are at risk for poor literacy achievement (Cabell,
Justice, Zucker, & Kilday, 2009). While technically adequate curriculum-based
assessments have been developed for early literacy skills such as phonemic awareness,
grapheme-phoneme knowledge, phonics, and fluency (Hosp et al., 2007) there is a
need for valid and efficient assessments of vocabulary knowledge and growth (Loftus
& Coyne, 2013). As Paris (2005) pointed out, “there has been increased assessment
and instruction on alphabet knowledge, phonemic awareness, and oral reading fluency
as the main enabling skills and significant predictors of later reading achievement.
There has been relatively less research and classroom emphasis on vocabulary and
comprehension to date, perhaps because of the difficulty of assessing and teaching
these skills to children who are beginning to read.” (p. 187).
While vocabulary is considered one of the five “pillars” of reading acquisition
(NRP, 2000), there are fundamental differences between vocabulary and the other
pillars of reading acquisition. Paris (2005) described phonemic awareness, phonics
and fluency as linear, constrained skills. For example, within a few years of
instruction, most students are able to demonstrate complete mastery of skills such as
letter naming, letter-sound knowledge, phonemic awareness, and decoding. However,
the same is not true for vocabulary knowledge. Unlike constrained skills, vocabulary
development has no ceiling for mastery. Vocabulary acquisition is an unconstrained
skill that continues to develop across a lifetime (Paris, 2005).
24
Different methods have been developed to aid in measuring an individual’s
word knowledge. Some methods are intended to measure “shallow” word knowledge,
while other methods aim to measure “deep” word knowledge (Beck et al., 2002). In a
review of the research on vocabulary instruction and assessment, the National Reading
Panel found,
…most of the researchers [use] their own instruments to evaluate vocabulary,
suggesting the need for this to be adopted in pedagogical practice. That is, the
more closely the assessment matches the instructional context, the more
appropriate the conclusions about the instruction will be… instruments that
match the instruction will provide better information about the specific
learning of the students related directly to that instruction. (NRP, 2000,
Chapter 4, pp. 26-27).
In other words, tools that aim to measure vocabulary knowledge and growth should be
closely aligned with the vocabulary instruction or curriculum. Curriculum-based
assessments have received a great deal of attention and use for instructional decision-
making in constrained areas of reading acquisition (e.g., letter-sound knowledge,
phoneme awareness, phonics). With CBA’s, a student’s progress toward mastery of
constrained skills can be monitored over time, and instruction can be differentiated
based on a student’s progress (or lack of progress) towards short or long-term
outcomes. In order for vocabulary assessments to be useful to teachers, the content of
the assessment and vocabulary curriculum must be closely aligned. However, many
educators do not use a curriculum for direct vocabulary instruction, and instead rely on
indirect or incidental vocabulary instruction. An unstructured, incidental approach to

25
vocabulary instruction limits the availability and use of vocabulary assessments that
are aligned with target words. In other words, curriculum-based vocabulary
assessment is only possible with a vocabulary curriculum in place. The words that are
taught directly should be the same words that are assessed (NRP, 2000).
With a high quality vocabulary curriculum in place, educators can identify a
“ceiling” for mastering target vocabulary words over a long period of time (e.g., over
the course of an academic year, or multiple years). For example, if a teacher uses a
vocabulary curriculum to directly teach 100 new Tier Two words throughout the
school year, the “ceiling” could be defined as mastery of the 100 target words. In this
context, teachers could have an opportunity to measure the specific words that were
taught directly throughout the year, and to make decisions regarding individual student
learning. Using a Tier I (whole-class) vocabulary curriculum provides educators with
an opportunity to use curriculum-based vocabulary assessments to make decisions
regarding the effectiveness of instruction for individual students. A variety of
approaches, tools, and procedures exist for measuring vocabulary knowledge.
However, research is needed to explore and identify best-practices for measuring
vocabulary knowledge within a multi-tiered framework (Loftus & Coyne, 2013).
The methods available for measuring Kindergarten children’s vocabulary are
limited, as young children are not yet able to read and write proficiently to express
their knowledge. Therefore, Kindergarten vocabulary assessments for must involve
oral language tasks or the use of pictures to appropriately capture students’ word
knowledge. Recent research on early vocabulary instruction has relied on the use of
published, multiple choice, receptive vocabulary assessments (e.g., Wasik &
26
Hindman, 2011; Silverman & Hines, 2009), as well as experimenter-developed,
multiple choice, receptive vocabulary assessments (Loftus, Coyne, McCoach, Zipoli,
& Pullen, 2010; Biemiller & Boote, 2006). The National Reading Panel identified
vocabulary assessment practices as an area needing additional research, asking, “What
are the best ways to evaluate vocabulary size, use, acquisition, and retention? What is
the role of standardized tests, what other measures should be used, and under what
circumstances?”(NRP, 2000, Chapter 4, p. 27). Many of the nationally normed
vocabulary assessments (e.g., the PPVT-4, Dunn & Dunn, 2007; EVT-2, Williams,
2007) do not have adequate sensitivity to measure short-term gains in target word
knowledge. Furthermore, many of the available standardized measures of general
vocabulary knowledge are not practical measures to use for universal screenings or for
monitoring student progress (Loftus & Coyne, 2013). Technically adequate (reliable,
valid) and useful indicators of student learning are essential in a proactive and
preventative model for instructional decision-making (Deno & Mirkin, 1977).
A disadvantage of many mastery measurement curriculum-based assessments
is that technical properties such as reliability and validity are often not established
(Shinn, 1998). Reliability is a test property that reflects the degree to which
differences in observed scores are aligned with differences in true scores (Furr &
Bacharach, 2008). Adequate reliability is necessary but not sufficient for validity. The
conceptualization of validity has evolved over time. Furr and Bacharach (2008)
discuss traditional conceptualizations of test validity, including content validity,
criterion validity and construct validity. Content validity refers to the match between
the actual content of a test and the content that should be on a test. Criterion validity

27
(concurrent or predictive) refers to the degree to which test results correlate with
specific criterion variables. Construct validity refers to the degree to which test scores
reflect a specific psychological construct (e.g., intelligence). A contemporary
definition of validity describes it as “the degree to which evidence and theory support
the interpretations of test scores entailed by the proposed uses” of a test (American
Education Research Association, American Psychological Association, & National
Council on Measurement in Education, 1999, p. 9).
Researchers have pointed out the need to use precise language when referring
to the concept of validity (Furr & Bacharach, 2008; Scriven, 2002). Scriven suggested
that “there are no valid tests of future affairs, only indicators… the use of test results
may be a valid or invalid indicator of future performance” (2002, p. 258). In other
words, the actual question is whether the inferences we make using test results are
valid for a given purpose. Messick, suggested that “the essence of unified validity is
that the appropriateness, meaningfulness, and usefulness of score-based inferences are
inseparable and that the unifying force behind this integration is the trustworthiness of
empirically grounded score interpretation” (1989, p. 5). Data based decision making
within a Response to Intervention framework requires the use of tools that can
efficiently and accurately predict student risk for poor outcomes in important domains.
Therefore, it is appropriate to examine the predictive validity of screening
assessments, or the degree to which assessments accurately classify students at risk or
students not at risk for poor outcomes.
28
Curriculum-Based Vocabulary Assessments
In using formative assessments and screening assessments, it is important to
determine whether the assessment data have predictive validity. That is, do assessment
results correlate highly with future learning outcomes? It is expected that through
direct vocabulary instruction, learning outcomes will include expressive or productive
knowledge of target words (i.e., ability to generate definitions of words) and receptive
or discriminate knowledge of target words (i.e., ability to select an accurate
representation of a word, or the ability to discriminate between examples and non-
examples of target words). These learning expectations are based on research on early
vocabulary instruction (Coyne et al., 2010; Coyne et al., 2009; McKeown & Curtis,
1987; NRP, 2000).
In the classroom, teachers benefit from using assessments that are efficient to
administer and that will guide instructional decision-making (Hosp et al., 2007). While
multiple choice measures are convenient and efficient to use, disadvantages to this
approach can include the availability of context clues and the possibility that the
student will guess correctly. However, ongoing results from well-designed multiple
choice assessments could provide a general indication regarding a student’s
understanding of target words. A primary advantage of receptive or discriminative
methods of vocabulary assessment is the efficiency of administration; an entire
classroom could be assessed in minutes using multiple choice assessments.
Classrooms that use a multi-tiered service delivery model require ongoing
assessments to inform the teacher of student progress or lack of progress (Burns &
Gibbons, 2008; Coyne, Kame’enui, & Simmons, 2001). As vocabulary instruction is
29
just beginning to be emphasized in early elementary school, there is a need for
vocabulary assessments that are accurate indicators of student learning. Two
curriculum-based assessments are currently available in one of the most widely used
commercially available Kindergarten vocabulary programs, Elements of Reading:
Vocabulary (Beck & McKeown, 2004). In the program, five new vocabulary words
are taught to Kindergarten classes each week through story book reading and a variety
of other language and literacy activities. The two curriculum-specific vocabulary
assessments are administered at the end of each week (i.e., the end of each unit).
While teachers are encouraged to use these assessments, it is unclear whether they are
technically adequate assessments of student vocabulary development, and whether the
assessments are efficient and useful for teachers to administer. Research is needed to
determine the practical and predictive validity of the measures, and to inform best
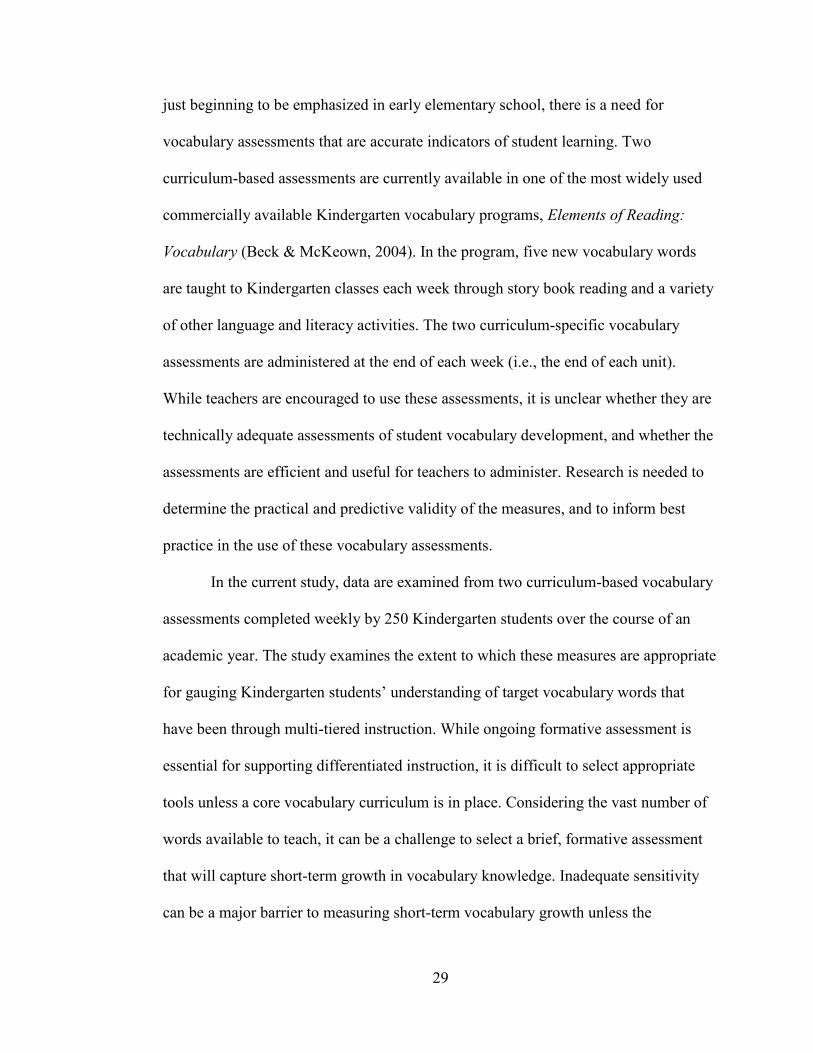
practice in the use of these vocabulary assessments.
In the current study, data are examined from two curriculum-based vocabulary
assessments completed weekly by 250 Kindergarten students over the course of an
academic year. The study examines the extent to which these measures are appropriate
for gauging Kindergarten students’ understanding of target vocabulary words that
have been through multi-tiered instruction. While ongoing formative assessment is
essential for supporting differentiated instruction, it is difficult to select appropriate
tools unless a core vocabulary curriculum is in place. Considering the vast number of
words available to teach, it can be a challenge to select a brief, formative assessment
that will capture short-term growth in vocabulary knowledge. Inadequate sensitivity
can be a major barrier to measuring short-term vocabulary growth unless the

30
assessment is aligned with words that have been taught (i.e., aligned with the
curriculum or curriculum-based). With this in mind, it is evident that vocabulary
assessments must be closely aligned with a curriculum or structured framework for
direct vocabulary instruction. In the current study, the utility of two curriculum-based
vocabulary assessments are examined within a multi-tiered vocabulary instructional
framework.
Research Questions
The current study examined the predictive validity and social validity of two
weekly curriculum based vocabulary assessments included in an evidence-based
Kindergarten vocabulary program (Beck & McKeown, 2004). The study examines the
extent to which the measures are appropriate for guiding instructional decision-making
within a multi-tiered or RtI context. The following research questions are addressed in
the present study:
1. Reliability of the Curriculum Based Vocabulary Assessments. The study
examined alternate form reliability for each of the two curriculum-based
vocabulary assessments in the Elements of Reading: Vocabulary curriculum.
Correlations were examined between each of the 24 weekly probes, for both of
the vocabulary assessments.
2. Predictive validity of the Curriculum Based Vocabulary Assessments. The
current study examines the extent to which each of the curriculum-based
vocabulary assessments included in the Elements of Reading: Vocabulary
curriculum predict important end-of-year vocabulary outcomes for
Kindergarten students. Correlations between measures of general vocabulary

31
knowledge (PPVT-4 and EVT-2) and end-of-year vocabulary outcomes were
compared with correlations between curriculum-based vocabulary assessments
and end-of-year proximal and distal vocabulary outcomes. Classification
accuracy was examined regarding the correct classification of students at risk
for poor vocabulary outcomes (sensitivity), and for correct classification of
students not at risk for poor vocabulary outcomes (specificity). Classification
accuracy of the curriculum based vocabulary assessments was compared with
the classification accuracy of standardized measures of general vocabulary
knowledge (the PPVT-4 and EVT-2).
3. Tier I vs. Tier II Group Differences on Curriculum Based Vocabulary
Assessment Performance. The current study examined whether the curriculum
based vocabulary assessments included in the Elements of Reading:
Vocabulary curriculum captured group differences in target word vocabulary
knowledge between at risk students receiving Tier I instruction and at risk
students receiving Tier I and Tier II instruction. Tier I and Tier II group
differences were also examined using end-of-year proximal and distal
vocabulary outcome measures.
4. Social Validity of the Curriculum Based Vocabulary Assessments. This study
examined teacher ratings regarding the social validity of the curriculum based
vocabulary assessments included in the Elements of Reading: Vocabulary
curriculum. Teacher feedback regarding the strengths and weaknesses of the
two curriculum based vocabulary assessments is reported.

32
CHAPTER 2
METHODOLOGY
Design
In the current study, Kindergarten students completed weekly vocabulary
assessments over the course of an academic year, and the predictive and social validity
of the assessments were examined. The present study was conducted in the context of
Project Early Vocabulary Instruction and Intervention (Project EVI). Project EVI is an
experimental vocabulary intervention developed with funding from the U.S.
Department of Education Institute of Educational Sciences. Through Project EVI, Tier
I (whole-class) and Tier II (supplemental, small group) vocabulary instruction was
provided to Kindergarten students over the course of a school year. In Project EVI,
several pre-intervention and post-intervention assessments of early language and
literacy skills were administered to participants. In the current study, Project EVI
participants’ vocabulary knowledge was assessed weekly over the course of the year
using two assessments. The design of Project EVI is described below, to aid the reader
in understanding the context of the current study.
Project EVI design. Project EVI focuses on early vocabulary acquisition
within a multi-tiered or Response to Intervention (RtI) framework. Through Project
EVI, 19 Kindergarten teachers were trained to provide Tier I whole-class vocabulary
instruction every day for 30 minutes throughout the academic year (over the course of
24 weeks). The curriculum used for Tier I instruction was Elements of Reading:
Vocabulary by Beck and McKeown (2004). Kindergarten teachers were trained to use

33
this evidence-based curriculum to deliver direct, whole-class vocabulary instruction.
Five new target vocabulary words were taught each week in Tier I instruction, through
a variety of lessons and activities in the Elements of Reading: Vocabulary curriculum.
The target vocabulary words taught to all participants are listed in Table 3.
Table 3
Words Taught Each Week (i.e., Lesson) Through Elements of Reading: Vocabulary
Tier I Instruction.
Lesson 1 comforting, fleet, glimmer, expression, lively
Lesson 2 drenched, gorgeous, peculiar, linger, vain
Lesson 3 glance, timid, frantic, reluctant, intimidated
Lesson 4 journey, glide, soar, adventure, roam
Lesson 5 stumble, pursue, collide, lounge, absurd
Lesson 6 alert, narrow, wavy, swirl, relief
Lesson 7 active, describe, broad, whisk, scamper
Lesson 8 ancient, mischievous, observe, track, hefty
Lesson 9 discouraged, hesitate, desire, respect, extraordinary
Lesson 10 splendid, celebrate, option, village, appreciate
Lesson 11 amble, displeased, request, bare, fetch
Lesson 12 snare, nestle, perilous, pounce, unlikely
Lesson 13 sprinkle, solitude, muddle, progression, expectation
Lesson 14 enormous, sway, struggle, delighted, cooperate
Lesson 15 baffled, startle, slumber, plea, flustered
Lesson 16 creak, stalk, communicate, chatter, action
Lesson 17 scraggly, prod, plump, witty, aware
Lesson 18 romp, gather, creative, fad, entertain
Lesson 19 slime, hatch, haven, slither, eager
Lesson 20 beacon, labor, memorable, survey, mammoth
Lesson 21 stroke, yank, idle, task, dive
Lesson 22 underneath, spin, lovely, transform, cycle
Lesson 23 drift, mighty, seek, swerve, inquire
Lesson 24 cramped, mimic, prowl, rhythm, dazzling
34
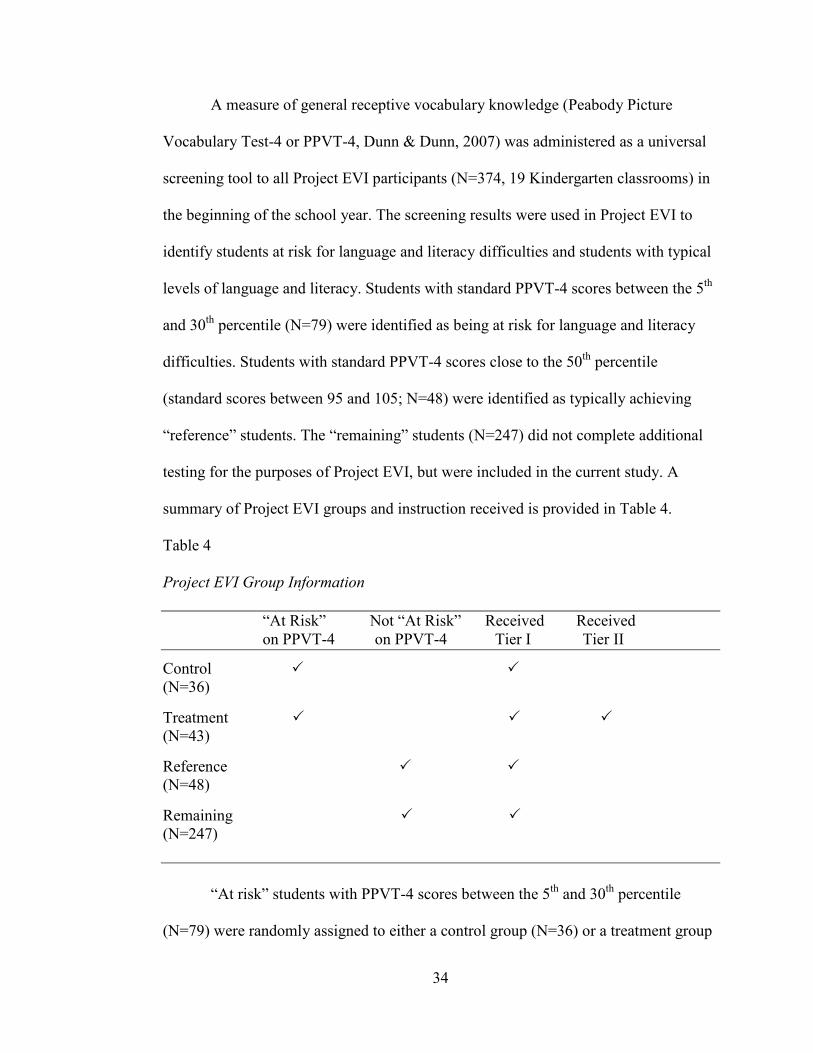
A measure of general receptive vocabulary knowledge (Peabody Picture
Vocabulary Test-4 or PPVT-4, Dunn & Dunn, 2007) was administered as a universal
screening tool to all Project EVI participants (N=374, 19 Kindergarten classrooms) in
the beginning of the school year. The screening results were used in Project EVI to
identify students at risk for language and literacy difficulties and students with typical
levels of language and literacy. Students with standard PPVT-4 scores between the 5th
and 30th
percentile (N=79) were identified as being at risk for language and literacy
difficulties. Students with standard PPVT-4 scores close to the 50th
percentile
(standard scores between 95 and 105; N=48) were identified as typically achieving
“reference” students. The “remaining” students (N=247) did not complete additional
testing for the purposes of Project EVI, but were included in the current study. A
summary of Project EVI groups and instruction received is provided in Table 4.
Table 4
Project EVI Group Information
“At Risk” Not “At Risk” Received Received
on PPVT-4 on PPVT-4 Tier I Tier II
Control
(N=36)
Treatment
(N=43)
Reference
(N=48)
Remaining
(N=247)
“At risk” students with PPVT-4 scores between the 5th
and 30th
percentile
(N=79) were randomly assigned to either a control group (N=36) or a treatment group

35
(N=43). The control group only received Tier I (whole class) vocabulary instruction
throughout the year. The treatment group received Tier I (whole class) vocabulary
instruction and Tier II (small group) vocabulary instruction throughout the year. The
“reference” group and “remaining” group only received Tier I (whole class)
vocabulary instruction throughout the year. In other words, all students except the
treatment group received only Tier I (whole class) vocabulary instruction throughout
the year. The treatment group received Tier I and Tier II vocabulary instruction
throughout the year. The primary goal of Project EVI is to examine the effects of Tier
II vocabulary instruction for at risk students, compared to a control group and
reference group.
Interventionists (school-based reading specialists, paraprofessionals, teaching
assistants, etc.) were trained through Project EVI to provide Tier II instruction to the
treatment students. Tier II instruction was delivered four days per week for 20 minutes
each day to groups of 2-4 students. Students in the treatment group received 80
additional minutes of small group vocabulary instruction a week, compared to the
control, reference, and remaining students. Tier II interventionists reviewed and
reinforced three out of the five target words that were taught each week in Tier I
instruction. For example, in Week One of Tier I instruction, five words were taught
directly in a whole-class lesson (comforting, fleet, glimmer, expression, and lively).
Only three of the five words were reviewed throughout the week in the Tier II
intervention (comforting, fleet, and glimmer). Within the Tier II instruction, treatment
students had extended opportunities to use and interact with the target words through
various activities. For example, in one activity students discern between examples and

36
non-examples of target word meanings using picture cards. In other activities, students
used target words in sentences or used word webs to make connections between target
words and other words. In the Tier II instruction, students received scaffolded
instruction and immediate corrective feedback. Given the extended instruction and
increased support, students in the treatment group were expected to develop higher
levels of target word knowledge compared to the control group.
Trained Project EVI researchers collected pre-intervention and post-
intervention data from the treatment, control, and reference groups related to early
language and literacy skills. The pre-intervention and post-intervention data captured
information regarding proximal vocabulary gains (knowledge of the target words
directly taught) and distal vocabulary gains (transfer knowledge of general
vocabulary). The proximal measures were developed by Project EVI researchers and
included Receptive Target Word and Expressive Target Word measures. The distal or
transfer measures used included the Peabody Picture Vocabulary Test-4 (PPVT-4,
Dunn & Dunn, 2007), and the Expressive Vocabulary Test-2 (EVT-2, Williams,
2007). Additional information for each of the measures is included in the Measures
section.
The current study collected weekly vocabulary assessment data over the course
of the academic year (each week for 24 weeks), in addition to the pre and posttest data
collected for Project EVI. A summary of the groups and data collected from each
group is provided in Table 5. The design of the current study is described next,
building from the context of Project EVI.
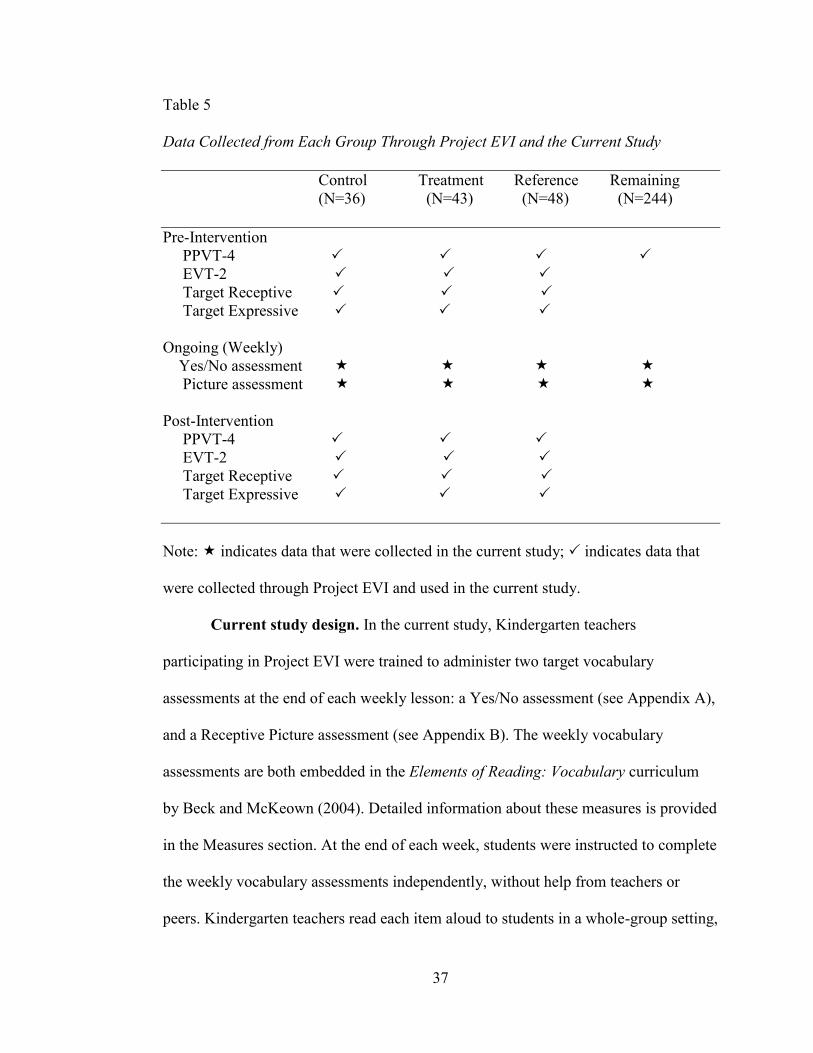
37
Table 5
Data Collected from Each Group Through Project EVI and the Current Study
Control Treatment Reference Remaining
(N=36) (N=43) (N=48) (N=244)
Pre-Intervention
PPVT-4
EVT-2
Target Receptive
Target Expressive
Ongoing (Weekly)
Yes/No assessment
Picture assessment
Post-Intervention
PPVT-4
EVT-2
Target Receptive
Target Expressive
Note: indicates data that were collected in the current study; indicates data that
were collected through Project EVI and used in the current study.
Current study design. In the current study, Kindergarten teachers
participating in Project EVI were trained to administer two target vocabulary
assessments at the end of each weekly lesson: a Yes/No assessment (see Appendix A),
and a Receptive Picture assessment (see Appendix B). The weekly vocabulary
assessments are both embedded in the Elements of Reading: Vocabulary curriculum
by Beck and McKeown (2004). Detailed information about these measures is provided
in the Measures section. At the end of each week, students were instructed to complete
the weekly vocabulary assessments independently, without help from teachers or
peers. Kindergarten teachers read each item aloud to students in a whole-group setting,

38
and monitored independent completion of each assessment. The degree to which
students actually worked independently was examined using two data sources:
classroom fidelity observations and teacher reports on a questionnaire.
Fidelity observations. Two research assistants received academic credit to
conduct fidelity observations in participating classrooms during the administration of
the weekly target vocabulary assessments. Observers were trained to use a checklist
(see Appendix C) to record teacher and classroom behavioral observations during the
administration of the target vocabulary assessments. A maximum of six points were
possible for the observation of each target vocabulary measure (six representing a
perfect score). The three observers completed fidelity observations for the first six
classrooms together to establish inter-observer agreement. Inter-observer agreement
was 94% (number of agreements divided by the total number of agreements and
disagreements). The remaining fidelity observations were done independently by one
of three observers.
Fidelity observations were completed in 16 of the 19 Kindergarten classrooms.
The three classrooms that were not observed were excluded from analyses in the
current study. Of the 16 classrooms observed, two were eliminated from further
analyses due to low fidelity ratings (i.e., fidelity scores below six), leaving 14
Kindergarten classrooms with high fidelity observation ratings.
Teacher questionnaires. A teacher questionnaire was completed by 18 of the
Kindergarten teachers at the end of the school year (see Appendices D and E). The
questionnaire included teacher reports regarding the ease of administering the two
target vocabulary assessments, perceived strengths and weaknesses of the assessments,

39
and other information. One of the items asked teachers to report the degree to which
students in their classrooms completed each target vocabulary assessment
independently. Teachers provided a rating from 1-10, with 10 representing the highest
level of independent work from students. Classrooms with ratings lower than six on
this item were excluded from further analyses. Of the 18 teachers who completed the
questionnaire, four teachers reported low levels of independent student work. Three of
these classrooms had already been eliminated from analyses due to low observation
fidelity levels. After eliminating classrooms with either low observation fidelity scores
or low teacher ratings for independent work, 13 classrooms remained for further
analyses.
Participants
The participants in the current study initially included teachers and students
from 19 Kindergarten classrooms in Rhode Island and Connecticut. Participants were
recruited from four elementary schools in Rhode Island and Connecticut through their
participation in Project EVI. The initial number of Kindergarten student participants
was 374 (Mage=5 years 5 months, age range: 4 years 8 month to 6 years 8 months).
Through Project EVI, all of the initial 374 student participants were screened at the
beginning of the academic year with the Peabody Picture Vocabulary Test-4 (Dunn &
Dunn, 2007) to determine their initial level of risk for language and literacy outcomes.
Using screening results, 127 of the 374 students were assigned to one of three groups:
treatment (n=43), control (n=36), or reference (n=48). The remaining students (n=244)
were not selected for follow-up testing for Project EVI, but were included in analyses
for the current study.
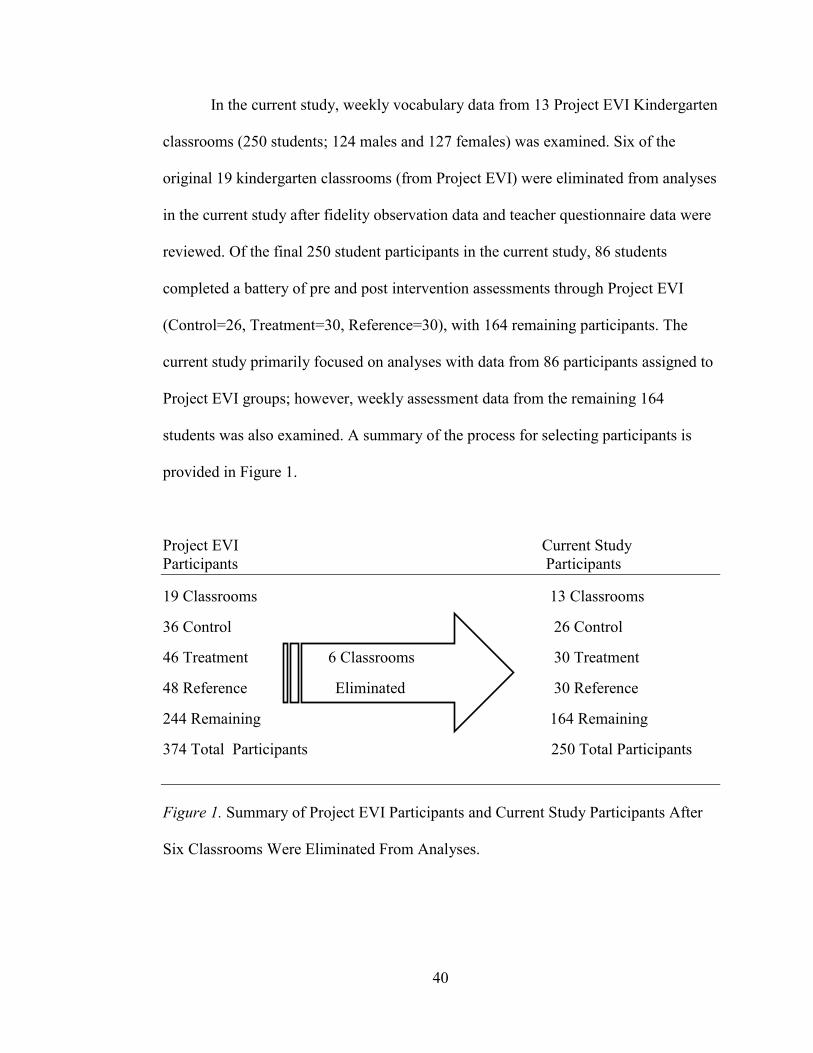
40
In the current study, weekly vocabulary data from 13 Project EVI Kindergarten
classrooms (250 students; 124 males and 127 females) was examined. Six of the
original 19 kindergarten classrooms (from Project EVI) were eliminated from analyses
in the current study after fidelity observation data and teacher questionnaire data were
reviewed. Of the final 250 student participants in the current study, 86 students
completed a battery of pre and post intervention assessments through Project EVI
(Control=26, Treatment=30, Reference=30), with 164 remaining participants. The
current study primarily focused on analyses with data from 86 participants assigned to
Project EVI groups; however, weekly assessment data from the remaining 164
students was also examined. A summary of the process for selecting participants is
provided in Figure 1.
Project EVI Current Study
Participants Participants
19 Classrooms 13 Classrooms
36 Control 26 Control
46 Treatment 6 Classrooms 30 Treatment
48 Reference Eliminated 30 Reference
244 Remaining 164 Remaining
374 Total Participants 250 Total Participants
Figure 1. Summary of Project EVI Participants and Current Study Participants After
Six Classrooms Were Eliminated From Analyses.

41
Participants in the current study were from four Title 1 elementary schools in
Rhode Island and Connecticut. Table 6 presents demographic information regarding
the student population in each of the four participating schools. School demographic
information was obtained from the National Center for Education Statistics (2012).
Table 6
Demographic Information from Each of the Four Participating Schools
School 1 School 2 School 3 School 4
Race/Ethnicity
American Indian/Alaskan 0.18% 1.02% 1.08% 2.80%
Asian/Pacific Islander 6.42% 6.71% 2.69% 1.05%
Black 10.09% 19.72% 11.85% 27.62%
Hispanic 28.81% 23.98% 39.14% 29.72%
White 45.32% 45.33% 38.96% 25.52%
Two or More Races 9.17% 3.25% 6.28% 13.29%
Eligible for Free/Reduced Lunch
Eligible 45.87% 50.00% 68.58% 87.76%
Demographic information was collected through Project EVI for the 86 participants in
the Control, Treatment, and Reference groups. Of the participants in these three
groups, 60.5% were female, 11.6% were English Language Learners, 4.7% were
Asian, 18.6% were Black, 30.2% were Hispanic, 19.8% were Multi-racial, and 26.7%
were White.

42
Measures
Peabody Picture Vocabulary Test-4 (Dunn & Dunn, 2007). All
Kindergartener participants completed universal screening with the Peabody Picture
Vocabulary Test-4 (PPVT-4). The PPVT-4 was used to screen and assign students to
control, treatment, and reference groups for an early vocabulary intervention. The
PPVT-4 is a standardized measure of receptive vocabulary knowledge. The test-retest
reliability of the PPVT-4 is .77 (Dunn & Dunn, 2007). In Project EVI, students with
standard scores between 75 and 92 were considered at risk for language and learning
disabilities. At risk students were randomly assigned to either a treatment or control
group. Students selected to be in the reference group had standard PPVT-4 scores
between 95 and 105.
Weekly curriculum based vocabulary assessments from the Elements of
Reading: Vocabulary Curriculum (Beck & McKeown, 2004). All student
participants completed two brief target vocabulary assessments at the end of each
week. The Elements of Reading: Vocabulary curriculum (Beck & McKeown, 2004)
includes two target vocabulary assessments for each week of instruction. The target
vocabulary assessments were administered to the whole class by the classroom teacher
at the end of each lesson (typically on Fridays). Teachers were trained by the
investigator to administer these assessments, and materials for student responses were
provided to each teacher as part of the Project EVI study.
Each of the curriculum based vocabulary assessments contains five items, with
one item for each of the five target vocabulary words taught each week. The format of
the assessments and the administration of the assessments were standardized

43
(consistent) from week to week, but the five target words that were assessed changed
from week to week. For example, the weekly vocabulary assessments administered at
the end of the first week (Lesson 1) measured student knowledge of the words
comforting, fleet, glimmer, expression, and lively. At the end of the second week
(Lesson 2), student knowledge of five new target words (drenched, gorgeous,
peculiar, linger, and vain) were assessed. Data from the Yes/No and Receptive weekly
assessments are intended to be used as indicators of student vocabulary knowledge at
the end of each week. The current study examines the practical and predictive validity
of these target vocabulary assessments.
Yes/No curriculum based vocabulary assessment. The first assessment is
referred to in the current study as the Yes/No Curriculum Based Vocabulary
Assessment (Yes/No assessment, see Appendix A). In this assessment, the teacher
reads a yes or no question out loud to the class and students respond by circling “Yes”
or “No” on their response probe. The yes/no format requires students to use word
knowledge and comprehension of contextual clues to determine the correct response.
There are five yes/no questions each week, one for each of the target words. For
example, the question for the the target word gorgeous is, “Can a sunset be
gorgeous?” (yes). For the target word peculiar, the question is, “Is it peculiar to see a
giraffe in the zoo?” (no).
Receptive curriculum based vocabulary assessment. The other weekly
assessment is referred to in the current study as the Receptive Curriculum Based
Vocabulary Assessment (Receptive Picture assessment, see Appendix B). In this
assessment, the teacher reads a question out loud and asks the students to mark the

44
picture that best demonstrates the meaning of the word. For each question there are
three possible choices (pictures) for the student to select. For example, one question
asks, “Which picture shows something peculiar?” Students have a choice between a
white duck standing, a white duck swimming, or a black and white striped duck
swimming. This task is similar to the PPVT-4 receptive vocabulary task, except
students mark their answers in their workbook instead of pointing to their answers.
This allows the test to be administered to an entire classroom at once, rather than
testing students individually. While the PPVT-4 measures general receptive
vocabulary, this task refers to words specifically targeted in the classroom vocabulary
instruction.
Expressive Vocabulary Test-2 (Williams, 2007). In the current study, the
control group, treatment group, and reference group (N=86) completed the Expressive
Vocabulary Test-2 (EVT-2) at the beginning of the year and again at the end of the
year. The EVT-2 is a standardized assessment of expressive vocabulary. In this
assessment, the student is shown a picture and asked to provide a one-word response
to a stimulus question related to the picture. For example, a child is shown a picture of
a dog and asked, “What do you see?” The test-retest reliability is .95 for the EVT-2
(Williams, 2007).
Target Word Expressive Vocabulary Test (Project EVI experimenter
developed). In the current study, the control group, treatment group, and reference
group (N=86) completed the Expressive Measure of Target Word Definitions. This
measure was developed by the researchers of Project EVI. The Expressive Measure of
Target Word Definitions is administered to students individually, and measures

45
students’ expressive knowledge of target word definitions (i.e., words taught in the
Elements of Reading: Vocabulary program). In the assessment, students are asked,
“What does ____ mean?” for a sample of words taught throughout the year. Responses
are scored as incorrect (0), partially correct (1) or completely correct (2).
Target Word Receptive Vocabulary Test (Project EVI experimenter
developed). In the current study, the control group, treatment group, and reference
group (N=86) completed a Target Word Receptive Vocabulary Test. This measure
was developed by the researchers of Project EVI. It is administered to students
individually, and measures students’ receptive knowledge of target words (i.e., words
taught in the Elements of Reading: Vocabulary program). In the assessment, students
are told a target word, and asked to select one of four pictures that best correspond
with the target word. Students are instructed, “Point to the picture that shows ____”.
Responses are scored as incorrect (0) or correct (1).
Teacher Questionnaire. A Teacher Questionnaire (see Appendices D and E)
was developed in the current study to collect information about the weekly Yes/No
and Receptive Picture assessments. The questionnaire was completed by all
participating classroom teachers at the end of the study. The purpose of the
questionnaire was to learn about teachers’ attitudes towards the assessments and
recommendations related to using the weekly assessments.
Procedure
Classroom teachers were trained to administer the weekly Yes/No and
Receptive Picture assessments during a teacher training in early October. Through
Project EVI, Kindergarten teachers and interventionists were trained to implement
46
Tier I and Tier II instruction. Materials for Tier I instruction were purchased and
provided by the Project EVI research team, and materials for Tier II instruction were
created and provided by the Project EVI research team.
In the current study, several steps were taken to promote high fidelity during
the administration of the weekly target vocabulary assessments. One copy of the
weekly Yes/No assessment is included in the Elements of Reading: Vocabulary
curriculum. To facilitate efficient and organized teacher administration, the Yes/No
assessment response booklets were created for each initial participant (N=374), and
sorted into containers for each teacher/classroom. Each student’s Yes/No assessment
response booklet contained a cover page indicating the student and teacher’s names.
Each booklet contained yes/no response pages for each of the 24 weeks of instruction
(see Appendix A for a sample page). The Yes/No response pages were almost
identical to the version provided in the Elements or Reading: Vocabulary curriculum.
In the current study, lesson numbers were added to the bottom of each week’s Yes/No
assessment. A unique picture was included at the bottom of each page, next to the
lesson number. This was done to ensure that students responded on the correct probe,
assuming that some students might have difficulty locating page numbers alone.
Teachers were trained to instruct students to turn to the correct page in the
Yes/No response booklet by referring to the lesson number and a description of the
picture at the bottom of the probe (e.g., “Turn to Lesson 7 with picture of a squirrel at
the bottom of the page”). The Receptive Picture assessments were included in the
Elements of Reading: Vocabulary student workbooks. Each student had a workbook
with his or her name written on the cover. Given that the participants were in

47
Kindergarten, teachers were trained to take steps to ensure that students were
responding on the correct page, and also to ensure that students were responding
independently.
Teacher feedback midway through the study indicated that some students had
difficulty circling their intended responses on the Yes/No assessment. For example,
some students circled both “Yes” and “No” as a response for the same item. The
original version of the response probe did not include lines separating each item,
which seemed to create visual-spatial confusion for some students. For this reason,
revised Yes/No assessment booklets with lines separating each item were delivered to
classroom teachers beginning on Lesson 11. Response booklets for Lessons 1-10 were
stored in the classroom for teachers to access until the end of the study.
Two research assistants were trained to conduct fidelity observations of
classrooms during target word measure administration (see Appendix C for
observation criteria). Observations were conducted with sixteen Project EVI
classrooms. The remaining three Project EVI classrooms were not observed due to
limited time, and were removed from further analyses in the current study. Fidelity
observations and teacher ratings were taken into consideration when selecting
classroom data for analysis. Six of the 19 Project EVI classrooms were eliminated
from analysis in the current study due to low fidelity levels, no fidelity observation, or
teacher reports of low fidelity (i.e., students were not completing the measures
independently).
After all of the classrooms completed the final vocabulary lesson of the year,
weekly target word data were collected from the original 19 classrooms. Each Project
48
EVI teacher received a questionnaire regarding his or her experience administering the
weekly target word measures. Teachers were asked to complete the questionnaires
honestly, and were given two weeks to complete them. The Yes/No responses
booklets and Receptive workbooks were collected from all students (N=374) and
stored in a secure location until data entry.
Data from the weekly curriculum based vocabulary assessments were entered
into a Microsoft Excel spreadsheet. Over 90,000 data points were entered in total for
the current study, in addition to over 2,000 data points that were obtained from Project
EVI testing. Three research assistants received academic credit for aiding in data entry
for the current project. For the weekly Yes/No assessment, the research assistants were
trained to enter student responses for each item into a spreadsheet. Student responses
on each item were coded in the following manner: “Y” for a clear response of “Yes”,
“N” for a clear response of “No”, “Both” if both yes and no were circled or marked,
“No Answer” if the item was left blank, “Unclear” if the response was ambiguous, and
“Absent” if all five items were left blank. For the weekly Receptive Picture
assessment, research assistants were trained to code student responses on each item in
the following manner: “A”, “B”, or “C” for a clear response to one of the three
multiple choice options, “Multiple” if more than one option was circled or marked,
“No Answer” if the item was left blank, “Unclear” if the response was not clear, and
“Absent” if all five items were left blank. Items that were coded as “Unclear” were
reviewed by the primary investigator, and a decision was made regarding the correct
coding.

49
After all raw data were entered into a spreadsheet formulas were created in
Excel to automatically score student responses. Automated scoring was done to
minimize the human error in scoring. Unique formulas were created to score each item
of the Yes/No assessment (120 items) and each item of the Receptive Picture
assessment (120 items). For each item, the formula coded a score of “1” for a correct
response, and “0” for an incorrect response. Missing data (“Absent”, “Both”,
“Unclear”, or “No Answer” responses) were coded as “missing”. If any items were
“missing” in a given week, the student’s score for that week was eliminated from
analyses. This was done to prevent artificial deflation of scores for students with
missing data. For example, rather than scoring a missing response as “0”, the entire
test was considered invalid for interpretation, and the student’s score for the week was
coded as “missing”.
The conservative approach taken to address missing data from absences and
ambiguity of item responses resulted in a relatively high incidence of missing data.
After student absences and unclear responses to items were considered, 18% of
weekly data was coded as “missing” for the Yes/No assessment (1078 missing out of
6000). For the Receptive Picture assessment, 16% of weekly data was coded as
“missing” (965 missing out of 6000). An individual student’s score for each weekly
assessment was coded as “missing” or invalid for interpretation if one or more of the
five items contained a missing score due to ambiguity of item responses or absences.

50
CHAPTER 3
RESULTS
After the data entry and coding process was complete, the Microsoft Excel
spreadsheet was uploaded into the statistical analysis program SPSS Version 20.
Descriptive statistics, graphs, and inferential statistics were examined to assess the
utility of the weekly Yes/No and Receptive picture assessments. In all inferential
analyses, missing data were excluded pairwise. In other words, a participant’s score
was excluded from a given analysis only if the data required for the specific analysis
was missing. If the same participant had the necessary data to be included in other
analyses, those results were included.
The Yes/No and Receptive Picture assessment each consist of five items per week,
consistent with the target vocabulary words taught on a given week. Therefore, the
lowest score possible for each measure was a score of “0” and the highest score
possible for each measure was a “5”. Given that the assessments were administered
weekly over the course of 24 weeks, many options were possible for data analysis. For
example, scores could be examined separately for individual weeks, or scores could be
averaged across a number of weeks, among many other options.
In the current study, weekly vocabulary data were analyzed using two methods.
First, data were examined separately for each of the 24 weeks. In other words, Yes/No
and Receptive scores from Week 1, Week 2, Week 3, etc. were examined
independently. Next, participants’ scores for each week were averaged with scores
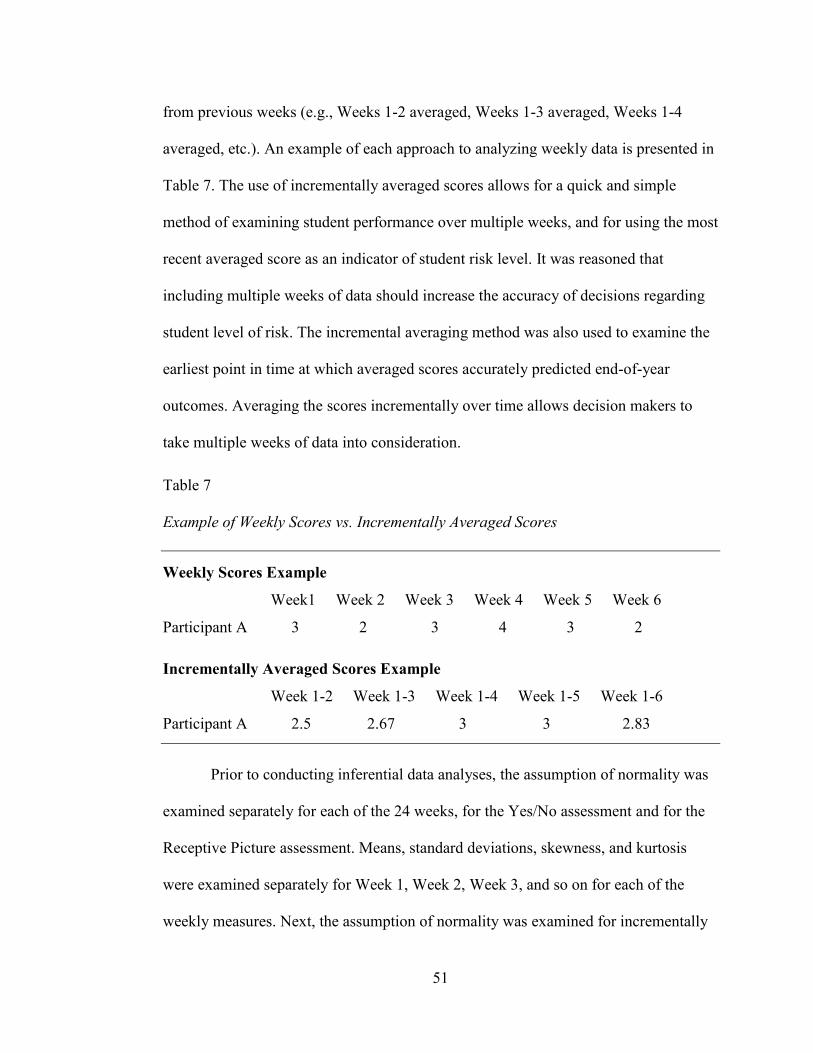
51
from previous weeks (e.g., Weeks 1-2 averaged, Weeks 1-3 averaged, Weeks 1-4
averaged, etc.). An example of each approach to analyzing weekly data is presented in
Table 7. The use of incrementally averaged scores allows for a quick and simple
method of examining student performance over multiple weeks, and for using the most
recent averaged score as an indicator of student risk level. It was reasoned that
including multiple weeks of data should increase the accuracy of decisions regarding
student level of risk. The incremental averaging method was also used to examine the
earliest point in time at which averaged scores accurately predicted end-of-year
outcomes. Averaging the scores incrementally over time allows decision makers to
take multiple weeks of data into consideration.
Table 7
Example of Weekly Scores vs. Incrementally Averaged Scores
Weekly Scores Example
Week1 Week 2 Week 3 Week 4 Week 5 Week 6
Participant A 3 2 3 4 3 2
Incrementally Averaged Scores Example
Week 1-2 Week 1-3 Week 1-4 Week 1-5 Week 1-6
Participant A 2.5 2.67 3 3 2.83
Prior to conducting inferential data analyses, the assumption of normality was
examined separately for each of the 24 weeks, for the Yes/No assessment and for the
Receptive Picture assessment. Means, standard deviations, skewness, and kurtosis
were examined separately for Week 1, Week 2, Week 3, and so on for each of the
weekly measures. Next, the assumption of normality was examined for incrementally

52
averaged sets of data (Weeks 1-2, Weeks 1-3, Weeks 1-4, etc.). The assumption for
normality was examined for the total sample (N=250), and again for the Project EVI
sub-sample (N=86).
Assumption of Normality for Weekly Scores
The normality of distributions was first examined for the entire sample
(N=250). The assumption of normality was examined for independent Yes/No weekly
scores. The distribution of scores varied from week to week, and ranged from -2.29 to
-.01. The majority of distributions were negatively skewed but greater than -1.00 on
the Yes/No assessment (i.e., the skewness was closer to zero than -1.00). Figure 2
shows sample histograms from Lessons 3, 9, 13 and 17 of the Yes/No data. The
assumption of normality was not met for the Yes/No assessments when scores were
examined for individual weeks (Kolmogorov-Smirnov=.00 for each week) for the total
sample (N=250).
Figure 2. Sample Distributions of Yes/No Scores on Individual Weeks.
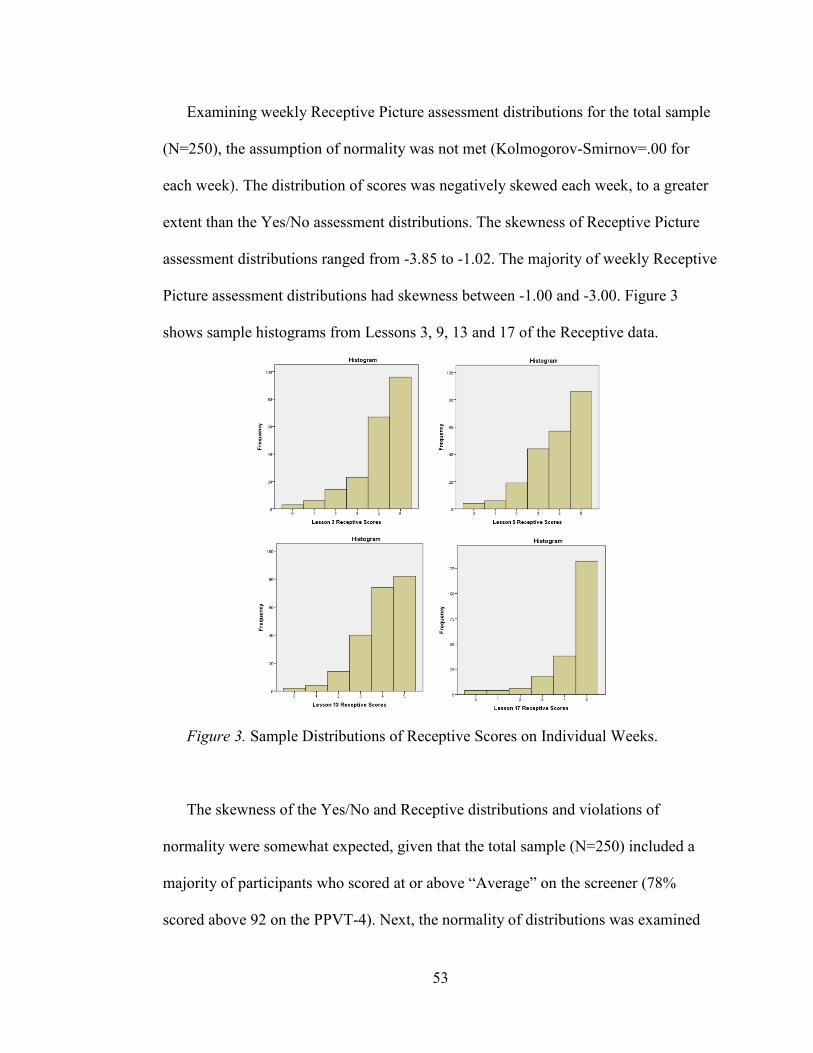
53
Examining weekly Receptive Picture assessment distributions for the total sample
(N=250), the assumption of normality was not met (Kolmogorov-Smirnov=.00 for
each week). The distribution of scores was negatively skewed each week, to a greater
extent than the Yes/No assessment distributions. The skewness of Receptive Picture
assessment distributions ranged from -3.85 to -1.02. The majority of weekly Receptive
Picture assessment distributions had skewness between -1.00 and -3.00. Figure 3
shows sample histograms from Lessons 3, 9, 13 and 17 of the Receptive data.
Figure 3. Sample Distributions of Receptive Scores on Individual Weeks.
The skewness of the Yes/No and Receptive distributions and violations of
normality were somewhat expected, given that the total sample (N=250) included a
majority of participants who scored at or above “Average” on the screener (78%
scored above 92 on the PPVT-4). Next, the normality of distributions was examined

54
for the sub-sample of Project EVI participants in the treatment, control or reference
groups (N=86). It was expected that these distributions would be closer to normal,
given that only 34% of participants (the reference group) scored in the “Average”
range on the PPVT-4 screener.
Assumption of normality for the sub-sample (N=86). The assumption of
normality was examined for the Yes/No scores each week, in the sub-sample of 86
participants in the Project EVI control, treatment or reference groups. The distribution
of scores varied from week to week. The skewness of distributions ranged from -1.23
to .20. The majority of distributions were negatively skewed but greater than -.80 on
the Yes/No assessment for the sub-sample (i.e., the skewness of distributions was
closer to zero than -.80). As expected, the distribution of scores for the sub-sample of
treatment, control and reference participants was more normal than the distribution of
the total sample. However, the assumption of normality was not met for the Yes/No
assessments when scores were examined for individual weeks (Kolmogorov-
Smirnov=.00 for each week) for the sub-sample (N=86).
Next, the assumption of normality was examined for the sub-sample (N=86)
distributions of Receptive scores each week. The distribution of scores varied from
week to week. The skewness of distributions ranged from -2.87 to -.69 on the
Receptive Picture assessment. The majority of distributions were negatively skewed
but greater than -2.00 on the Receptive Picture assessments (i.e., the skewness of
distributions was closer to zero than -2.00). The assumption of normality was not met
for the Receptive Picture assessments when scores were examined for individual
weeks (Kolmogorov-Smirnov=.00 for each week) for the sub-sample (N=86).
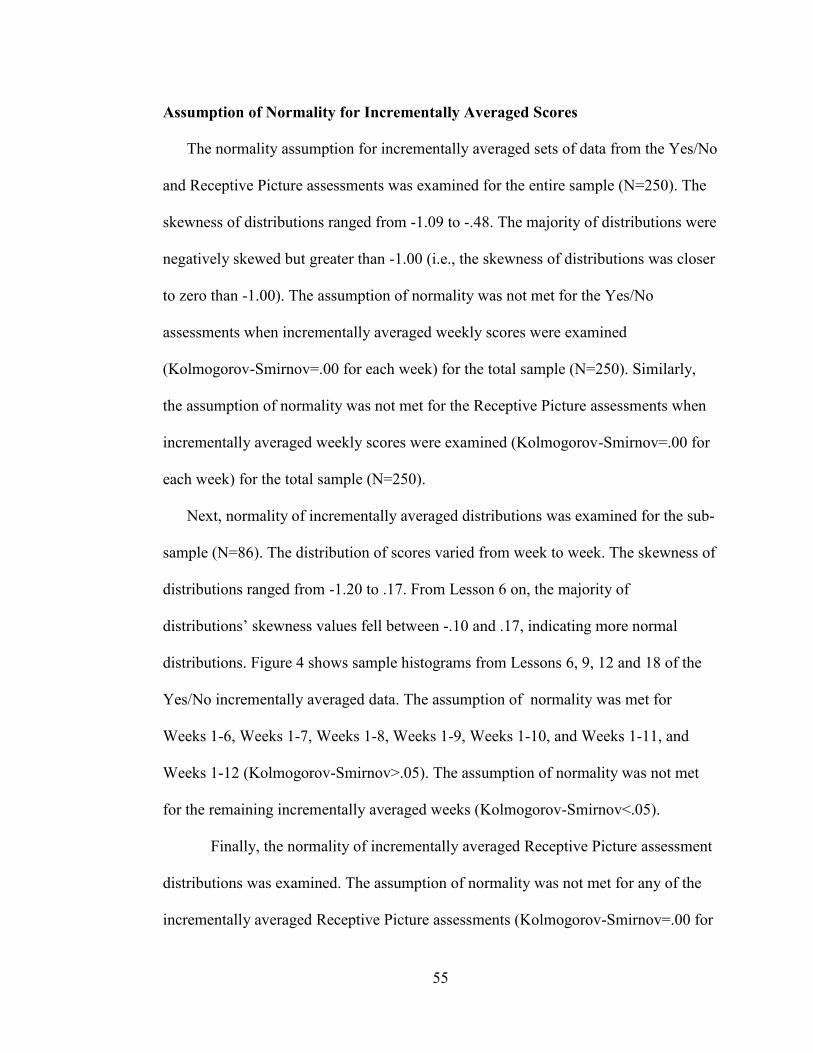
55
Assumption of Normality for Incrementally Averaged Scores
The normality assumption for incrementally averaged sets of data from the Yes/No
and Receptive Picture assessments was examined for the entire sample (N=250). The
skewness of distributions ranged from -1.09 to -.48. The majority of distributions were
negatively skewed but greater than -1.00 (i.e., the skewness of distributions was closer
to zero than -1.00). The assumption of normality was not met for the Yes/No
assessments when incrementally averaged weekly scores were examined
(Kolmogorov-Smirnov=.00 for each week) for the total sample (N=250). Similarly,
the assumption of normality was not met for the Receptive Picture assessments when
incrementally averaged weekly scores were examined (Kolmogorov-Smirnov=.00 for
each week) for the total sample (N=250).
Next, normality of incrementally averaged distributions was examined for the sub-
sample (N=86). The distribution of scores varied from week to week. The skewness of
distributions ranged from -1.20 to .17. From Lesson 6 on, the majority of
distributions’ skewness values fell between -.10 and .17, indicating more normal
distributions. Figure 4 shows sample histograms from Lessons 6, 9, 12 and 18 of the
Yes/No incrementally averaged data. The assumption of normality was met for
Weeks 1-6, Weeks 1-7, Weeks 1-8, Weeks 1-9, Weeks 1-10, and Weeks 1-11, and
Weeks 1-12 (Kolmogorov-Smirnov>.05). The assumption of normality was not met
for the remaining incrementally averaged weeks (Kolmogorov-Smirnov<.05).
Finally, the normality of incrementally averaged Receptive Picture assessment
distributions was examined. The assumption of normality was not met for any of the
incrementally averaged Receptive Picture assessments (Kolmogorov-Smirnov=.00 for

56
each week). The distribution was negatively skewed, with most participants achieving
high scores on the incrementally averaged weekly Receptive Picture assessments.
Figure 4. Sample Distributions of Incrementally Averaged Yes/No Data.
Stability of Yes/No and Receptive Picture Scores from Week to Week
To assess the stability of scores on the Yes/No and Receptive Picture
assessments from week to week, means and standard deviations were calculated on
individual weeks for the entire sample (N=250). The mean score on the Yes/No
assessment ranged from 2.66 (Lesson 9, SD=1.27) to 4.56 (Lesson 19, SD=0.84). The
mean score on the Receptive Picture assessment ranged from 3.86 (Lesson 9,
SD=1.27) to 4.74 (Lesson 19, SD=0.73). In Figure 5, mean scores for the Yes/No
assessment and Receptive Picture assessment are displayed. As shown in the figure,
mean scores varied across weeks on both the Yes/No and Receptive Picture
assessments. However, as shown in Figure 5 the trajectories for mean scores on the

57
0
1
2
3
4
5
Receptive Mean Score
Yes/No Mean Score
Receptive StandardDeviation
Yes/No StandardDeviation
Yes/No and Receptive weekly measures were similar. It is helpful to compare the
trajectories between two measures that assessed the same target words, because it can
provide information regarding the cause of the variability. Given that the trajectories
are similar, it is likely that the source of variability of mean scores across weeks is
related to the difficulty of the target words assessed on a given week. For example
with both measures, participants performed the lowest on Lesson 9 (target words
discouraged, hesitate, desire, respect, and extraordinary). Similarly, on both measures
the highest mean score was for Lesson 19 (target words slime, hatch, haven, slither,
and eager).
Figure 5. Weekly Mean Scores and Standard Deviations for the Yes/No Assessment
(Solid Line) and Receptive Picture assessment (Dashed Line).
To provide a more accurate (or typical) representation of individual student
data, sample Weekly Yes/No scores are presented in Figure 6, with graphs from
sample Control, Treatment, and Reference students. These graphs are displayed to

58
0
1
2
3
4
5
Sample Control Student: Weekly Yes/No Scores
0
1
2
3
4
5
Sample Treatment Student: Weekly Yes/No Scores
0
1
2
3
4
5
Sample Reference Student: Yes/No Weekly Scores
provide a visual of data for individual students. Reviewing such graphs could provide
important information regarding instructional decision-making.
Figure 6. Weekly Scores on the Yes/No Assessment from a Control, Treatment, and
Reference Students.

59
For example, the sample Control student’s graph in Figure 6 indicates that he or she
may have struggled to learn some of words that were taught during Lessons 1 and 2.
The information provided in the graph could prompt a teacher to provide additional
instruction and support to the student to bolster his or her understanding of the target
words. Additionally, teachers can use individualized graphs to make decisions about
the effectiveness of instruction for individual students, by examining overall patterns
of achievement over time.
Next, Pearson product-moment correlation analyses were conducted to
compare Yes/No scores across weeks. The purpose of these analyses was to examine
the relative standings of participant scores from week to week. Pearson product-
moment correlation coefficients were examined between all of the weeks for each
measure. On the Yes/No assessment, 99.95% of the pairs of weekly scores were
positively correlated (261 out of 276). The Pearson product-moment correlations
ranged from r=.17 to r=.58, indicating small to large correlations between Yes/No
weekly measures. Of the 15 pairs of Yes/No assessments that were not correlated,
seven were associated with Lesson 9 scores.
Pearson product-moment correlation analyses were also conducted to compare
Receptive scores across weeks. Correlation coefficients were again examined between
weeks on the Receptive Picture assessment, and 100% of the pairs of weekly scores
were positively correlated. The Pearson product-moment correlations ranged from
r=.22 to r=.70, with the majority of pairs having large, positive correlations (r>.50).
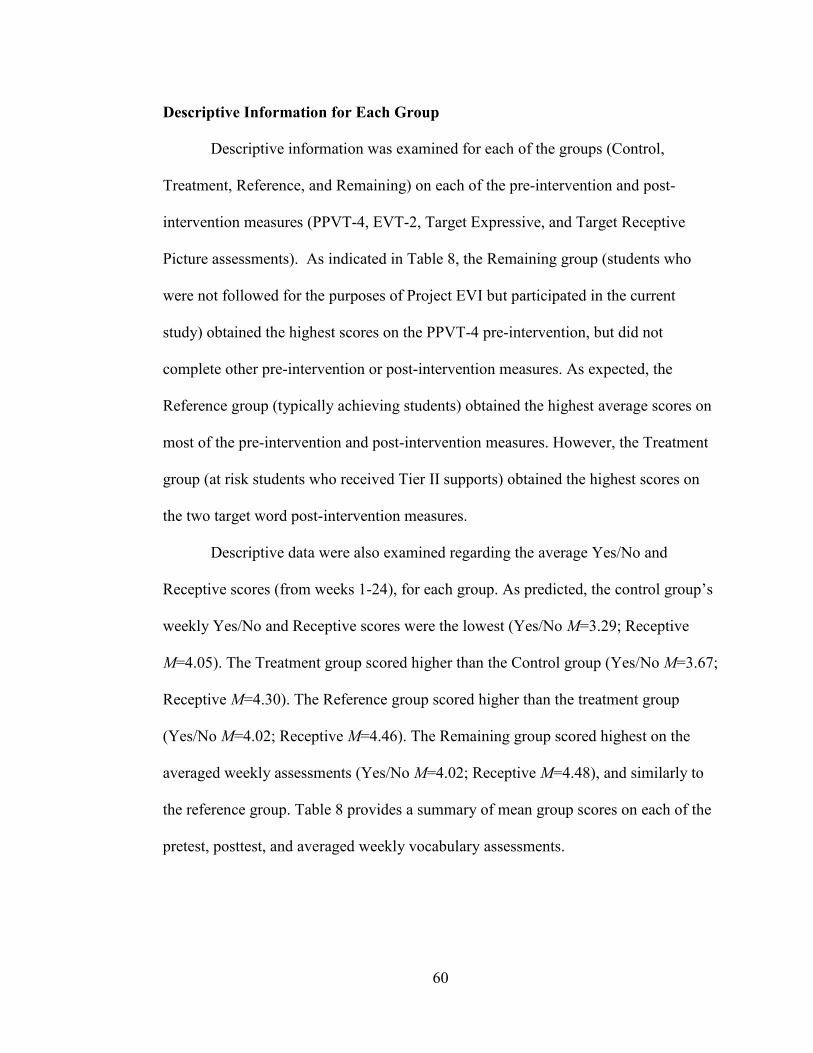
60
Descriptive Information for Each Group
Descriptive information was examined for each of the groups (Control,
Treatment, Reference, and Remaining) on each of the pre-intervention and post-
intervention measures (PPVT-4, EVT-2, Target Expressive, and Target Receptive
Picture assessments). As indicated in Table 8, the Remaining group (students who
were not followed for the purposes of Project EVI but participated in the current
study) obtained the highest scores on the PPVT-4 pre-intervention, but did not
complete other pre-intervention or post-intervention measures. As expected, the
Reference group (typically achieving students) obtained the highest average scores on
most of the pre-intervention and post-intervention measures. However, the Treatment
group (at risk students who received Tier II supports) obtained the highest scores on
the two target word post-intervention measures.
Descriptive data were also examined regarding the average Yes/No and
Receptive scores (from weeks 1-24), for each group. As predicted, the control group’s
weekly Yes/No and Receptive scores were the lowest (Yes/No M=3.29; Receptive
M=4.05). The Treatment group scored higher than the Control group (Yes/No M=3.67;
Receptive M=4.30). The Reference group scored higher than the treatment group
(Yes/No M=4.02; Receptive M=4.46). The Remaining group scored highest on the
averaged weekly assessments (Yes/No M=4.02; Receptive M=4.48), and similarly to
the reference group. Table 8 provides a summary of mean group scores on each of the
pretest, posttest, and averaged weekly vocabulary assessments.

61
Table 8
Summary of Descriptive Results for Each Group
Control (n=26) Treatment (n=30) Reference (n=30) Remaining (n=164)
Test M (SD) M (SD) M (SD) M (SD)
Pretest PPVT 86.00 (4.08) 85.80 (5.67) 101.30 (2.48) 110.66 (12.94)
Pretest EVT 88.38 (6.86) 91.47 (7.92) 99.72 (8.05) - - - - - - - -
Yes/No Average 3.29 (0.52) 3.67 (0.60) 4.02 (0.56) 4.02 (0.62)
Receptive Average 4.05 (0.82) 4.30 (0.67) 4.46 (0.51) 4.48 (0.48)
Posttest PPVT 89.96 (8.84) 95.21 (7.99) 104.39 (9.93) - - - - - - - -
Posttest EVT 91.12 (8.09) 97.17 (7.53) 103.83 (9.50) - - - - - - - -
Posttest Receptive 10.39 (4.05) 14.57 (2.47) 13.70 (3.03) - - - - - - - -
Posttest Expressive 10.73 (10.79) 22.90 (11.21) 20.17 (9.64) - - - - - - - -
Note: Yes/No and Receptive Picture average scores represent the mean score from all (24) weeks.

62
Inferential Findings
Next, inferential statistics were calculated to examine the following:
1. Correlations between Predictor Measures and Outcome Measures. Pearson
product momentary correlation coefficients were calculated to examine the
correlation between the Yes/No and Receptive Picture assessments and end-of-
year vocabulary outcomes. Additionally, the correlation between two pre-
intervention vocabulary measures (PPVT-4 and EVT-2) and end-of-year
vocabulary outcomes was explored, as a comparison.
2. Between-Group Differences on the Weekly Vocabulary Assessments. Mann-
Whitney U Tests were conducted to examine whether the weekly vocabulary
assessments differentiate between at-risk students who receive Tier II
interventions (Project EVI treatment group), at risk students who do not
receive Tier II interventions (Project EVI control group), and typically
achieving students who do not receive Tier II interventions (Project EVI
reference group). Additional analyses examined treatment and control group
differences on Tier I words and Tier II. It was expected that the treatment
group’s performance would be higher than the control group’s performance for
Tier II words; however, group differences were not expected for Tier I words.
3. Classification Accuracy of the Weekly Vocabulary Assessments. Sensitivity,
specificity, positive predictive power, and negative predictive power were
examined for the weekly vocabulary assessments (Yes/No and Receptive
Picture assessments) and general vocabulary measures (PPVT-4 and EVT-2),
using target vocabulary and general vocabulary outcome measures. Receiver
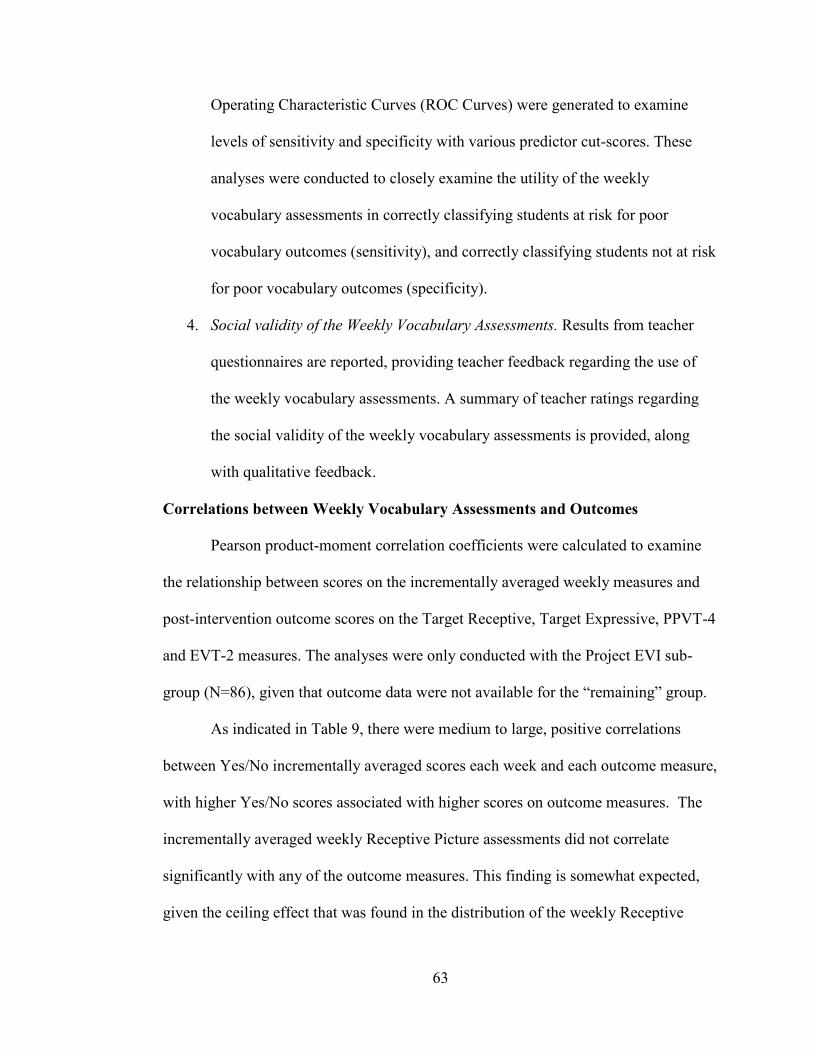
63
Operating Characteristic Curves (ROC Curves) were generated to examine
levels of sensitivity and specificity with various predictor cut-scores. These
analyses were conducted to closely examine the utility of the weekly
vocabulary assessments in correctly classifying students at risk for poor
vocabulary outcomes (sensitivity), and correctly classifying students not at risk
for poor vocabulary outcomes (specificity).
4. Social validity of the Weekly Vocabulary Assessments. Results from teacher
questionnaires are reported, providing teacher feedback regarding the use of
the weekly vocabulary assessments. A summary of teacher ratings regarding
the social validity of the weekly vocabulary assessments is provided, along
with qualitative feedback.
Correlations between Weekly Vocabulary Assessments and Outcomes
Pearson product-moment correlation coefficients were calculated to examine
the relationship between scores on the incrementally averaged weekly measures and
post-intervention outcome scores on the Target Receptive, Target Expressive, PPVT-4
and EVT-2 measures. The analyses were only conducted with the Project EVI sub-
group (N=86), given that outcome data were not available for the “remaining” group.
As indicated in Table 9, there were medium to large, positive correlations
between Yes/No incrementally averaged scores each week and each outcome measure,
with higher Yes/No scores associated with higher scores on outcome measures. The
incrementally averaged weekly Receptive Picture assessments did not correlate
significantly with any of the outcome measures. This finding is somewhat expected,
given the ceiling effect that was found in the distribution of the weekly Receptive
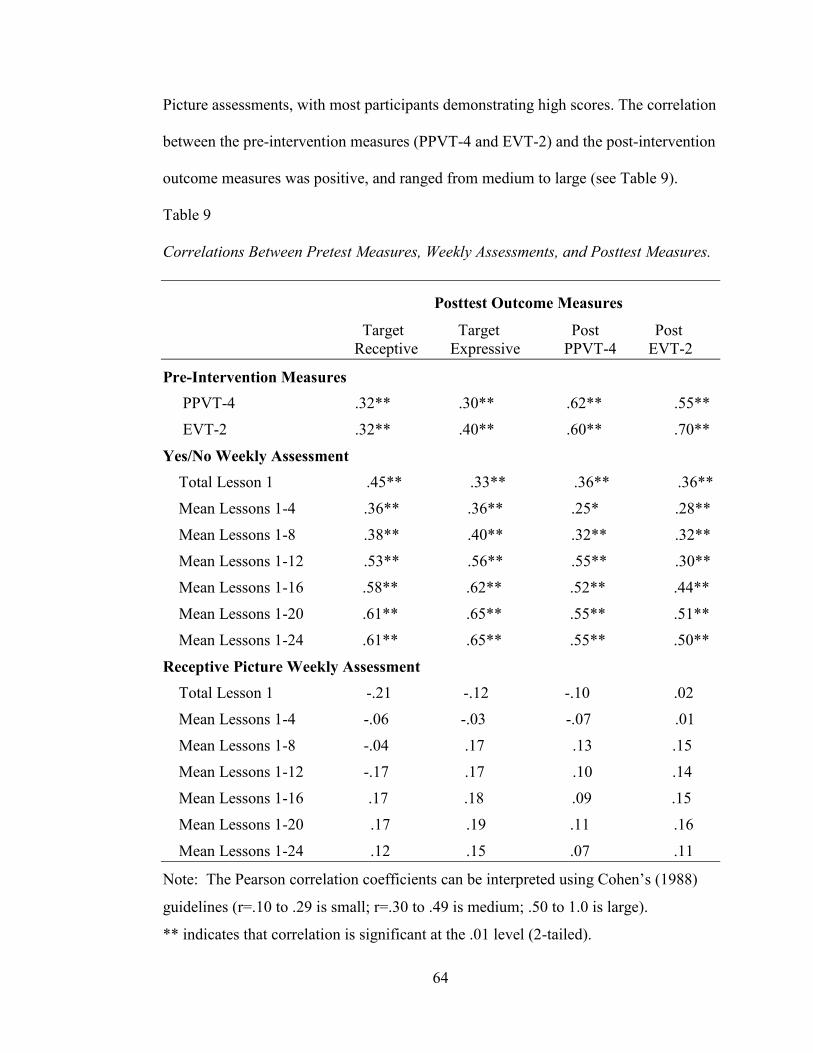
64
Picture assessments, with most participants demonstrating high scores. The correlation
between the pre-intervention measures (PPVT-4 and EVT-2) and the post-intervention
outcome measures was positive, and ranged from medium to large (see Table 9).
Table 9
Correlations Between Pretest Measures, Weekly Assessments, and Posttest Measures.
Posttest Outcome Measures
Target Target Post Post
Receptive Expressive PPVT-4 EVT-2
Pre-Intervention Measures
PPVT-4 .32** .30** .62** .55**
EVT-2 .32** .40** .60** .70**
Yes/No Weekly Assessment
Total Lesson 1 .45** .33** .36** .36**
Mean Lessons 1-4 .36** .36** .25* .28**
Mean Lessons 1-8 .38** .40** .32** .32**
Mean Lessons 1-12 .53** .56** .55** .30**
Mean Lessons 1-16 .58** .62** .52** .44**
Mean Lessons 1-20 .61** .65** .55** .51**
Mean Lessons 1-24 .61** .65** .55** .50**
Receptive Picture Weekly Assessment
Total Lesson 1 -.21 -.12 -.10 .02
Mean Lessons 1-4 -.06 -.03 -.07 .01
Mean Lessons 1-8 -.04 .17 .13 .15
Mean Lessons 1-12 -.17 .17 .10 .14
Mean Lessons 1-16 .17 .18 .09 .15
Mean Lessons 1-20 .17 .19 .11 .16
Mean Lessons 1-24 .12 .15 .07 .11
Note: The Pearson correlation coefficients can be interpreted using Cohen’s (1988)
guidelines (r=.10 to .29 is small; r=.30 to .49 is medium; .50 to 1.0 is large).
** indicates that correlation is significant at the .01 level (2-tailed).

65
Between-Group Differences in the Weekly Vocabulary Assessments
Group differences on the Yes/No assessment were explored by conducting
Mann-Whitney U Tests. The Mann-Whitney U Test is a non-parametric method of
analyzing between-group variance. This method was used given that not all of the
distributions of incrementally averaged data conformed to the assumption of
normality. The Mann-Whitney U test was conducted to examine differences in Yes/No
incrementally averaged scores between the treatment and control groups. It was
expected that the treatment group scores would be significantly higher than the control
group scores on the Yes/No assessment. This finding was expected given that the
treatment group received supplementary (Tier II) instruction throughout the year that
the control group did not receive. Group differences were explored separately for each
incrementally averaged week (e.g., Weeks 1-2, Weeks 1-3, Weeks 1-4, etc.). This
approach allowed the researcher to explore the earliest point in time at which group
differences emerge between the treatment, control, and reference groups.
First, differences were explored between the treatment and control group
performance on the Yes/No assessment. The treatment group scores were higher than
the control group scores on each incrementally averaged week. A series of Mann-
Whitney U tests revealed that from Weeks 9 to 24, there were significant group
differences in scores on the Yes/No incrementally averaged measure between the
treatment group and the control groups (p<.03), with small to medium effect sizes (see
Table 10).

66
Table 10
Mann-Whitney U Test Results for Incrementally Averaged Yes/No assessments
Treatment > Reference > Reference >
Control Control Treatment
p r p r p r
Lessons 1-2 .23 .13 .01* .28 .06 .20
Lessons 1-4 .14 .16 .00* .34 .02* .25
Lessons 1-6 .05* .21 .00* .38 .01* .29
Lessons 1-8 .14 .16 .00* .36 .01* .27
Lessons 1-10 .04* .22 .00* .36 .09 .18
Lessons 1-12 .02* .26 .00* .40 .03* .24
Lessons 1-14 .02* .26 .00* .43 .02* .25
Lessons 1-16 .01* .26 .00* .44 .03* .24
Lessons 1-18 .01* .28 .00* .45 .03* .24
Lessons 1-20 .02* .26 .00* .45 .03* .25
Lessons 1-22 .02* .25 .00* .43 .02* .24
Lessons 1-24 .02* .25 .00* .44 .02* .25
Note: * Indicates significant at the p<0.05 level. Using Cohen’s (1988) criteria for
effect size r, .1= small effect, .3= medium effect, .5=large effect.
Next, differences between the reference and control group scores on the
Yes/No assessment were explored. The reference group scores were higher than the
control group scores on each incrementally averaged week. Mann-Whitney U tests
were conducted and effect sizes were calculated to determine the magnitude of the
group differences. It was expected that the reference group scores would be
significantly higher than the control group. A series of Mann-Whitney U tests revealed
that from Weeks 4 to 24, there were significant group differences in scores on the
67
Yes/No incrementally averaged measure between the reference group and the control
group (p=.00), with medium effect sizes (see Table 10).
Group differences were also examined between the treatment and reference
groups. The reference group scores were higher than the treatment group scores on
each incrementally averaged week. Mann-Whitney U tests were conducted and effect
sizes were calculated to determine the magnitude of the group differences. It was
expected that the reference group scores would be significantly higher than the
treatment group. A series of Mann-Whitney U tests revealed significant differences
between the reference and treatment group scores on incrementally averaged Yes/No
scores for the majority of weeks (p<.05), with small to medium effect sizes. No
significant group differences were found between the treatment and reference group
incrementally averaged scores on Week 2 and Week 10 (p>.05).
In summary, the Yes/No assessment captured statistically significant
differences in scores between the treatment, control, and reference groups in Project
EVI, with small to medium effect sizes. As expected, the Yes/No incrementally
averaged scores were higher for the treatment group compared to the control group.
However, statistically significant group differences did not emerge until Week 6 of
instruction. Statistically significant differences were seen between the treatment and
reference group by Week 4 (p<.02, r=.25), and statistically significant differences
were found between the control and reference groups by Week 2 (p<.01, r=.28). These
findings provide support for the utility of the Yes/No assessment in measuring varying
levels of target word knowledge.

68
Given that the treatment group received additional instruction for the Tier II
words, it was expected that the treatment group would demonstrate higher
performance for Tier II words. A Mann-Whitney U test revealed that the treatment
group’s performance on the Yes/No Tier II words (Md=2.16, n=30) was significantly
greater than the control group’s performance (Md=2.00, n=26), U=265.50, z=-2.05,
p=.04. The effect size was small to medium (r=.27). This finding indicates that, as
expected, the Yes/No assessment distinguished between the treatment group and
control group on Tier II word learning.
Next, the same analysis was done to compare the treatment and control group
performances on Tier I words. A Mann-Whitney U test revealed that the treatment
group’s performance on the Yes/No Tier I words (Md=1.54, n=30) was significantly
greater than the control group’s performance (Md=1.28, n=26), U=238.00, z=-2.50,
p=.01. The effect size was medium (r=.33). This finding indicates that the Yes/No
assessment distinguished between the treatment group and the control group on Tier I
word learning. Interestingly, the treatment group’s performance was higher than the
control group for Tier I words, despite the fact that the two groups received the same
instruction for Tier I words throughout the study.
A series of Mann-Whitney U tests were also conducted to examine Receptive
Picture assessment group differences between the treatment and control group on Tier
I and II words. Results indicated that there were no significant differences in Tier II
Receptive scores between the treatment group and the control group, U=313.50, z=-
1.26, p=.21. Similarly, there were no significant differences in Tier I Receptive scores
between the treatment and control group, U=339.50, z=-.83, p=.41. This finding
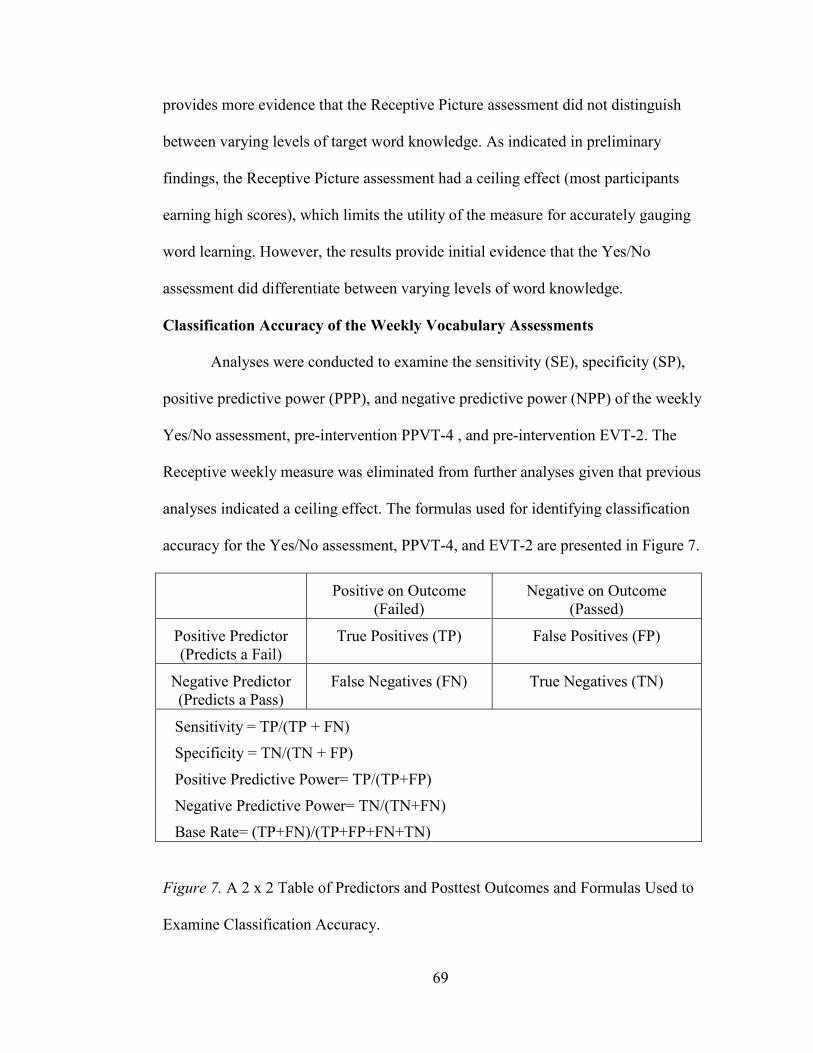
69
provides more evidence that the Receptive Picture assessment did not distinguish
between varying levels of target word knowledge. As indicated in preliminary
findings, the Receptive Picture assessment had a ceiling effect (most participants
earning high scores), which limits the utility of the measure for accurately gauging
word learning. However, the results provide initial evidence that the Yes/No
assessment did differentiate between varying levels of word knowledge.
Classification Accuracy of the Weekly Vocabulary Assessments
Analyses were conducted to examine the sensitivity (SE), specificity (SP),
positive predictive power (PPP), and negative predictive power (NPP) of the weekly
Yes/No assessment, pre-intervention PPVT-4 , and pre-intervention EVT-2. The
Receptive weekly measure was eliminated from further analyses given that previous
analyses indicated a ceiling effect. The formulas used for identifying classification
accuracy for the Yes/No assessment, PPVT-4, and EVT-2 are presented in Figure 7.
Positive on Outcome
(Failed)
Negative on Outcome
(Passed)
Positive Predictor
(Predicts a Fail)
True Positives (TP) False Positives (FP)
Negative Predictor
(Predicts a Pass)
False Negatives (FN) True Negatives (TN)
Sensitivity = TP/(TP + FN)
Specificity = TN/(TN + FP)
Positive Predictive Power= TP/(TP+FP)
Negative Predictive Power= TN/(TN+FN)
Base Rate= (TP+FN)/(TP+FP+FN+TN)
Figure 7. A 2 x 2 Table of Predictors and Posttest Outcomes and Formulas Used to
Examine Classification Accuracy.
70
To calculate classification accuracy results, multiple pass/fail cut-scores were
selected for each of the predictor measures (the Yes/No weekly measure, the pre-
intervention PPVT-4, and the pre-intervention EVT-2). Cut-scores were also selected
to dichotomize “passing” and “failing” for each of the target word outcome measures
(post-intervention Target Receptive and post-intervention Target Expressive).
Multiple cut-scores were examined for each of the predictor measures (Yes/No
assessment, Pretest PPVT-4 and Posttest EVT-2). For the Yes/No incrementally
averaged measures, the cut-scores examined were scores below 3.25, 3.50, and 3.75
(see Table 11). The goal in examining classification accuracy using multiple pass/fail
cut-scores was to find the most appropriate cut-scores to maximize sensitivity and
specificity. For example, setting a very high pass/fail predictor cut-score would likely
result in high levels of sensitivity, but low levels of specificity. Setting a very low
pass/fail predictor cut-core would likely result in high levels of specificity but low
levels of sensitivity. Conducting multiple classification analyses using a range of cut-
scores aided decision-making regarding the most appropriate cut-score for predictor
measures.
The cut-scores for post-intervention Receptive Target and post-intervention
Expressive Target measures were determined by examining base rates of “failing”
participants using various cut-scores. Cut-scores on the Target Expressive and
Receptive Picture assessments that categorized the lowest 30% of scores in the sample
as “failing” were used for the classification analyses. Participants scoring below the
30th
percentile on the Target Receptive Picture assessment achieved scores under 12;
therefore, 12 was used as the pass/fail cut-score for the classification analyses.

71
Similarly, participants scoring below the 30th
percentile on the Target Expressive
measure achieved scores under 10; therefore, 10 was used as the pass/fail cut-score for
the classification analyses.
Using the formulas presented in Figure 6, the sensitivity (SE), specificity (SP),
positive predictive power (PPP), and negative predictive power (NPP), the weekly
Yes/No assessment, pre-intervention PPVT-4 , and pre-intervention EVT-2 were
calculated for each of the target word outcome measures. Table 11 presents the
classification accuracy of Yes/No incrementally averaged data sets, using the post-
intervention Target Receptive outcome measure. Table 12 presents classification
accuracy results for the pre-intervention PPVT-4 and EVT-2, also using the post-
intervention Target Receptive outcome measure. The purpose of conducting these
analyses was to examine the predictive validity of the Yes/No incrementally averaged
measure in comparison to other methods (the PPVT-4 and the EVT-2).
As shown in Table 11, the Yes/No incrementally averaged data sets provided
adequate levels of sensitivity and specificity on a number of occasions. For example,
setting the Yes/No predictor cut-score at 3.25, the Yes/No incrementally averaged
measure showed a sensitivity of .83 and a specificity of .71 (Kappa=.46) as early as
Week 4 of instruction. In other words, of the participants who achieved low scores on
the Target Receptive outcome measure (24 out of 86 participants, or 27.9% of the
sample), 83% (20 out of 24 participants) were identified as at-risk by the Yes/No
incrementally averaged data at Week 4. Similarly, of the participants who achieved
high scores on the Target Receptive outcome measure (62 out of 86 participants, or
72.1% of the sample), 71% (44 out of 62 participants) were identified as not being at-

72
risk using the Yes/No incrementally averaged data at Week 4. In Table 11,
incrementally averaged Yes/No data sets with adequate classification accuracy are
highlighted in bold font.
In Table 12, classification accuracy data is displayed for the pre-intervention
PPVT-4 and EVT-2 data. Again, the outcome measure used was the post-intervention
Target Receptive Picture assessment with a “failing” base rate of 27.9%. A cut-score
of 90 yielded the highest trade-of regarding the level of sensitivity (.75) and specificity
(.61) for the PPVT-4. A cut-score of 92 yielded the highest trade-off for sensitivity
(.71) and specificity (.68) on the EVT-2. Comparing the classification accuracy of the
Yes/No assessment and the PPVT-4 and EVT-2 measures, there is evidence that
incrementally averaged Yes/No data were more useful for accurately predicting
students who were at risk for low performance on an end-of-year target word outcome
measure (Target Receptive outcome). Comparing classification accuracy data from
Tables 11 and 12, the Yes/No assessment was more accurate than the pre-intervention
PPVT-2 or EVT-2 in predicting performance on the Target Receptive outcome
measure, beginning with data from Week 3 (SE=.79; SP=.68; K=.39).

73
Table 11
Classification Accuracy of the Yes/No Incrementally Averaged Measures in Predicting
the Target Receptive Post-Intervention Outcome (Base Rate of Fails=27.9%).
Measure Cutoff Score SE SP PPP NPP K
Yes/No assessment
Lessons 1-2 3.25 .63 .75 .52 .84 .38
Lessons 1-2 3.50 .63 .77 .52 .84 .38 Lessons 1-2 3.75 .75 .61 .43 .87 .30
Lessons 1-3 3.25 .79 .68 .49 .89 .39
Lessons 1-3 3.50 .88 .60 .46 .93 .37
Lessons 1-3 3.75 .92 .45 .39 .93 .26
Lessons 1-4 3.25 .83 .71 .53 .92 .46
Lessons 1-4 3.50 .83 .55 .42 .90 .29
Lessons 1-4 3.75 .92 .44 .39 .93 .25
Lessons 1-5 3.25 .83 .66 .49 .91 .41
Lessons 1-5 3.50 .88 .60 .46 .93 .37
Lessons 1-5 3.75 .92 .45 .39 .93 .26
Lessons 1-6 3.25 .83 .69 .51 .92 .44
Lessons 1-6 3.50 .83 .61 .46 .91 .36
Lessons 1-6 3.75 .92 .45 .39 .93 .26
Lessons 1-8 3.25 .79 .68 .49 .89 .39
Lessons 1-8 3.50 .83 .63 .47 .91 .37
Lessons 1-8 3.75 .92 .45 .39 .93 .26
Lessons 1-10 3.25 .79 .68 .49 .89 .39
Lessons 1-10 3.50 .88 .65 .49 .93 .42
Lessons 1-10 3.75 .96 .47 .41 .97 .30
Lessons 1-12 3.25 .88 .74 .57 .94 .53
Lessons 1-12 3.50 .92 .65 .50 .95 .45
Lessons 1-12 3.75 1.00 .55 .46 1.00 .40
Lessons 1-24 3.25 .67 .84 .62 .87 .49
Lessons 1-24 3.50 .88 .73 .55 .94 .51
Lessons 1-24 3.75 1.00 .66 .53 1.00 .52

74
Table 12
Classification Accuracy of the PPVT-4 and EVT-2 Measures in Predicting the Target
Receptive Post-Intervention Outcome (Base Rate of Fails=27.9%).
Measure Cutoff Score SE SP PPP NPP K
Pretest PPVT-4
25th Percentile 85 .56 .87 .56 .79 .31
86 .50 .81 .50 .81 .30
87 .50 .79 .48 .80 .29
88 .54 .81 .48 .81 .30
89 .63 .66 .42 .82 .25
90 .75 .61 .43 .86 .30
91 .75 .53 .38 .85 .22
30th
Percentile 92 .75 .47 .35 .83 .16
93 .75 .44 .34 .82 .14
94 .75 .39 .32 .80 .10
Pretest EVT-2 25
th Percentile 85 .25 .89 .46 .75 .16
86 .29 .84 .41 .75 .14
87 .42 .77 .42 .77 .19
88 .42 .77 .42 .77 .19
89 .50 .71 .40 .79 .20
90 .50 .69 .39 .78 .18
91 .54 .68 .39 .79 .20
30th
Percentile 92 .71 .68 .46 .86 .33
93 .71 .61 .42 .84 .26
94 .83 .58 .44 .90 .32
Next, classification accuracy was examined using the post-intervention Target
Expressive measure as the outcome. The classification accuracy of the Yes/No
incrementally averaged data was again compared with the pre-intervention PPVT-4
and EVT-2 measures. As shown in Table 13, the Yes/No incrementally averaged data
sets provided adequate levels of sensitivity and specificity on a number of occasions
(highlighted in bold font). For example, setting the Yes/No predictor cut-score at 3.25,
the Yes/No incrementally averaged measure achieved a sensitivity of .78 and a

75
specificity of .68 (Kappa=.39) as early as Week 4 of instruction. In other words, of the
participants who achieved low scores on the Target Expressive outcome measure (23
out of 86 participants, or 26.7% of the sample), 78% (18 out of 23 participants) were
identified as at-risk by the Yes/No incrementally averaged data at Week 4. Similarly,
of the participants who achieved high scores on the Target Expressive outcome
measure (63 out of 86 participants, or 73.3% of the sample), 68% (43 out of 63
participants) were identified as not being at-risk using the Yes/No incrementally
averaged data at Week 4.
In Table 14, classification accuracy data are displayed for the pre-intervention
PPVT-4 and EVT-2 data. Again, the outcome measure used was the post-intervention
Target Expressive measure with a base rate of 26.7% of the sample “failing”. A cut-
score of 90 yielded the highest trade-off regarding the level of sensitivity (.74) and
specificity (.60) on the PPVT-4. A cut-score of 92 yielded the highest trade-off
regarding the level of sensitivity (.70) and specificity (.67) on the EVT-2.
Comparing the classification accuracy findings between the Yes/No
assessment and the PPVT-4 and EVT-2 measures, there is evidence that incrementally
averaged Yes/No data were more useful for accurately predicting students who were at
risk for low performance on an end-of-year target word outcome measure (Target
Expressive outcome). Comparing classification accuracy data from Tables 13 and 14,
the Yes/No assessment was more accurate than the pre-intervention PPVT-2 or EVT-2
in predicting performance on the Target Expressive outcome measure, beginning at
Week 4 (SE=.78; SP=.68; K=.39).
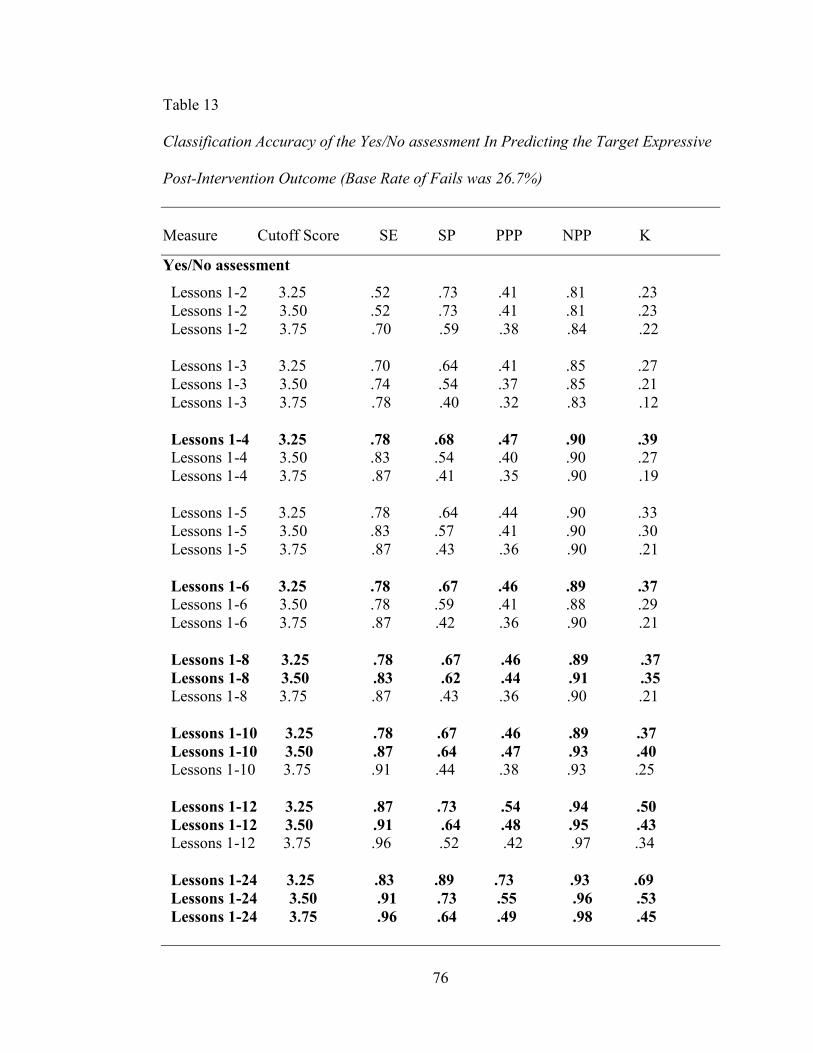
76
Table 13
Classification Accuracy of the Yes/No assessment In Predicting the Target Expressive
Post-Intervention Outcome (Base Rate of Fails was 26.7%)
Measure Cutoff Score SE SP PPP NPP K
Yes/No assessment
Lessons 1-2 3.25 .52 .73 .41 .81 .23
Lessons 1-2 3.50 .52 .73 .41 .81 .23
Lessons 1-2 3.75 .70 .59 .38 .84 .22
Lessons 1-3 3.25 .70 .64 .41 .85 .27
Lessons 1-3 3.50 .74 .54 .37 .85 .21
Lessons 1-3 3.75 .78 .40 .32 .83 .12
Lessons 1-4 3.25 .78 .68 .47 .90 .39
Lessons 1-4 3.50 .83 .54 .40 .90 .27
Lessons 1-4 3.75 .87 .41 .35 .90 .19
Lessons 1-5 3.25 .78 .64 .44 .90 .33
Lessons 1-5 3.50 .83 .57 .41 .90 .30
Lessons 1-5 3.75 .87 .43 .36 .90 .21
Lessons 1-6 3.25 .78 .67 .46 .89 .37
Lessons 1-6 3.50 .78 .59 .41 .88 .29
Lessons 1-6 3.75 .87 .42 .36 .90 .21
Lessons 1-8 3.25 .78 .67 .46 .89 .37
Lessons 1-8 3.50 .83 .62 .44 .91 .35
Lessons 1-8 3.75 .87 .43 .36 .90 .21
Lessons 1-10 3.25 .78 .67 .46 .89 .37
Lessons 1-10 3.50 .87 .64 .47 .93 .40
Lessons 1-10 3.75 .91 .44 .38 .93 .25
Lessons 1-12 3.25 .87 .73 .54 .94 .50
Lessons 1-12 3.50 .91 .64 .48 .95 .43
Lessons 1-12 3.75 .96 .52 .42 .97 .34
Lessons 1-24 3.25 .83 .89 .73 .93 .69
Lessons 1-24 3.50 .91 .73 .55 .96 .53
Lessons 1-24 3.75 .96 .64 .49 .98 .45

77
Table 14
Classification Accuracy of the Pre-Intervention PPVT-4 Measure and the Pre-
Intervention EVT-2 Measure in Predicting the Post-Intervention Target Expressive
Outcome (Base Rate of Fails was 26.7%)
Measure Cutoff Score SE SP PPP NPP K
Pretest PPVT-4
25th Percentile 85 .44 .81 .56 .81 .33
86 .52 .81 .50 .82 .33
87 .52 .79 .48 .82 .31
88 .57 .78 .48 .83 .33
89 .65 .67 .42 .84 .27
90 .74 .60 .41 .60 .27
91 .78 .54 .38 .87 .24
92 .78 .47 .35 .86 .19
93 .83 .46 .36 .88 .20
94 .83 .41 .34 .88 .16
Pretest EVT-2 25
th Percentile 85 .26 .89 .46 .77 .17
86 .30 .84 .41 .77 .16
87 .48 .79 .46 .81 .27
88 .48 .79 .46 .81 .27
89 .57 .73 .43 .82 .27
90 .57 .71 .42 .82 .25
91 .61 .70 .42 .83 .27
92 .70 .67 .43 .86 .30
93 .74 .62 .42 .87 .29
94 .83 .57 .41 .90 .30
Receiver Operating Characteristic Curve (ROC Curve) Analyses
Next, Receiver Operating Characteristic (ROC) curve analyses were conducted
with each of the predictors (Yes/No assessment, pre-intervention PPVT-4, and pre-
intervention EVT-2). ROC curves plot the true-positive rate against the false-positive
rate for varying cut off scores on a predictor measure (Compton, Fuchs, Fuchs, &
Bryant, 2006). The ROC curve analysis allows for the examination of the

78
combinations of sensitivity and specificity that are possible for a given predictor and a
given outcome. The Area Under the Curve (AUC) is an indicator of the overall
classification accuracy of a predictor. In the current analysis the AUC indicates the
degree to which a predictor measure correctly classifies students according to end-of-
year outcomes. According to Compton et al. (2006) an AUC below .70 is poor;
between .70 and .80 is fair; .80 to .90 is good; and .90 and above is considered
excellent. The AUC may be interpreted as the average percent correct achievable for
classifications using a given pair of predictor and criterion variables, across all
possible cut-off values of the predictor variable.
The purpose of conducting ROC curve analyses was to examine the utility of
incrementally averaged Yes/No scores for correctly classifying students at risk for
poor end-of-year outcomes. Additionally, ROC curve analyses were conducted using
the pre-intervention PPVT-4 and EVT-2 scores. These analyses allowed for a
comparison of the predictive validity between the Yes/No assessment and pre-
intervention PPVT-4 and EVT-2 measures. ROC curve analyses were conducted with
each predictor measure (Yes/No assessment incrementally averaged, pre-intervention
PPVT-4, and pre-intervention EVT-2) to examine classification accuracy for each of
the outcome measures (post-intervention scores on the PPVT-4, EVT-2, Target
Expressive, and Target Receptive). Table 15 summarizes the Area Under the Curve
(AUC) for each predictor, on each of the outcomes.
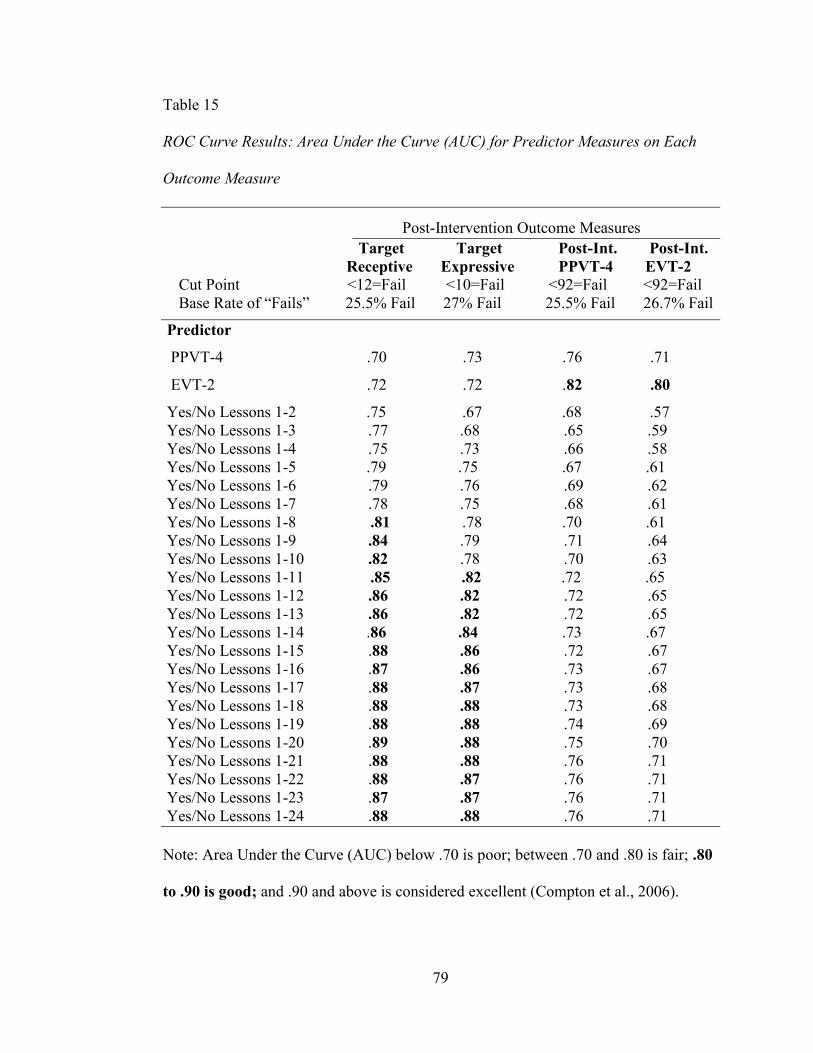
79
Table 15
ROC Curve Results: Area Under the Curve (AUC) for Predictor Measures on Each
Outcome Measure
Post-Intervention Outcome Measures
Target Target Post-Int. Post-Int.
Receptive Expressive PPVT-4 EVT-2
Cut Point <12=Fail <10=Fail <92=Fail <92=Fail
Base Rate of “Fails” 25.5% Fail 27% Fail 25.5% Fail 26.7% Fail
Predictor
PPVT-4 .70 .73 .76 .71
EVT-2 .72 .72 .82 .80
Yes/No Lessons 1-2 .75 .67 .68 .57
Yes/No Lessons 1-3 .77 .68 .65 .59
Yes/No Lessons 1-4 .75 .73 .66 .58
Yes/No Lessons 1-5 .79 .75 .67 .61
Yes/No Lessons 1-6 .79 .76 .69 .62
Yes/No Lessons 1-7 .78 .75 .68 .61
Yes/No Lessons 1-8 .81 .78 .70 .61
Yes/No Lessons 1-9 .84 .79 .71 .64
Yes/No Lessons 1-10 .82 .78 .70 .63
Yes/No Lessons 1-11 .85 .82 .72 .65
Yes/No Lessons 1-12 .86 .82 .72 .65
Yes/No Lessons 1-13 .86 .82 .72 .65
Yes/No Lessons 1-14 .86 .84 .73 .67
Yes/No Lessons 1-15 .88 .86 .72 .67
Yes/No Lessons 1-16 .87 .86 .73 .67
Yes/No Lessons 1-17 .88 .87 .73 .68
Yes/No Lessons 1-18 .88 .88 .73 .68
Yes/No Lessons 1-19 .88 .88 .74 .69
Yes/No Lessons 1-20 .89 .88 .75 .70
Yes/No Lessons 1-21 .88 .88 .76 .71
Yes/No Lessons 1-22 .88 .87 .76 .71
Yes/No Lessons 1-23 .87 .87 .76 .71
Yes/No Lessons 1-24 .88 .88 .76 .71
Note: Area Under the Curve (AUC) below .70 is poor; between .70 and .80 is fair; .80
to .90 is good; and .90 and above is considered excellent (Compton et al., 2006).

80
Cut-scores for “passing” or “failing” outcome measures were again selected
based on scores that yielded a “failing” base rate for less than 30% of participants.
This method categorized the lowest 30% of scores as “failing” outcome vocabulary
assessments. Cut-scores for the Posttest PPVT-4 and EVT-2 were selected using
nationally normed base rates for standard scores (Dunn & Dunn, 2007 for the PPVT-4;
Williams, 2007 for the EVT-2).With the PPVT-4 and EVT-2, scores that fell under the
30th
percentile (standard scores under 92) were categorized as “failing” scores for the
purposes of classification analyses.
PPVT-4 and EVT-2 ROC curves. As indicated in Table 15, the Area Under
the Curve (AUC) for the pre-intervention PPVT-4 measure was “fair” for each
outcome measure. On the Target Receptive outcome, the pre-intervention PPVT-4
AUC was .70. On the Target Expressive outcome, the pre-intervention PPVT-4 AUC
was .73. On the post-intervention EVT-2 outcome, the pre-intervention PPVT-4 AUC
was .71. On the post-intervention PPVT-4 outcome, the pre-intervention PPVT-4
AUC was .76. Overall, the results indicate that pre-intervention PPVT-4 measure
provided fair classification accuracy for target word outcomes, and fair classification
accuracy for general or distal vocabulary outcomes.
Next, the AUC for the pre-intervention EVT-2 measure was examined for each
of the outcome measures. On the Target Receptive and Target Expressive outcomes,
the pre-intervention EVT-2 AUC was considered “fair” (AUC=.72). On the post-
intervention PPVT-4, the pre-intervention EVT-2 AUC was considered “good”
(AUC=.82). On the post-intervention EVT-2, the pre-intervention EVT-2 AUC was

81
also considered “good” (AUC=.80). Overall, the results indicate that the pre-
intervention EVT-2 measure provided fair classification accuracy for the target word
outcomes, and good classification accuracy for general or distal vocabulary outcomes.
Yes/No assessment ROC curves. The AUC for the incrementally averaged
Yes/No assessments varied across outcome measures and number of weeks (see Table
15). On the Target Receptive outcome, the Yes/No AUC ranged from .75 (Lessons 1-
2) to .88 (Lessons 1-24). The Target Receptive results provide evidence that the
incrementally averaged data from the Yes/No assessment provided stronger target
word classification accuracy by Week 2 (AUC=.75) than the pre-intervention PPVT-4
(AUC=.70) and the pre-intervention EVT-2 (AUC=.72).The Yes/No AUC was
considered to be “fair” by Week 2 (AUC=.75), and the AUC was considered to be
“good” by Week 8 (AUC=.81). As shown in Figure 8, the Yes/No assessment had
stronger classification accuracy by Week 8 than the pre-intervention PPVT-4 measure.
PPVT-4
Screener
AUC= .70
Yes/No
Weeks 1-8
AUC= .82

82
Figure 8. ROC Curves Comparing the PPVT-4 Screener (left, AUC=.70) and the
Incrementally Averaged Yes/No assessment for Weeks 1-8 (right, AUC=.81), Using
the Target Receptive Picture assessment as the Outcome.
On the Target Expressive outcome measure, the Yes/No AUC ranged from .67
(Lessons 1-2) to .88 (Lessons 1-24). The AUC was considered “fair” by Week 4
(AUC=.73), and the AUC was considered to be “good” by Week 11 (AUC=.81). The
Yes/No AUC was greater than the PPVT-4 and EVT-2 AUC by Week 5. However, the
AUC for the PPVT-4 and EVT-2 was greater than or equal to the AUC for the Yes/No
assessment from Weeks 1 to 4. This finding indicates that the PPVT-4 and EVT-2
provide stronger target word classification accuracy than the Yes/No assessment up
until Week 4. However, with four weeks of Yes/No data, the classification accuracy
becomes stronger using the Yes/No data compared to the PPVT-4 and EVT-2 pre-
intervention screening data. As shown in Figure 9, the Yes/No AUC at Week 11 is
substantially greater than the pre-intervention PPVT-4 AUC on the Target Expressive
outcome.
Yes/No
Weeks 1-11
AUC= .82
PPVT-4
Screener
AUC= .73

83
Figure 9. ROC Curves Comparing the PPVT-4 Screener (left, AUC=.73) and the
Incrementally Averaged Yes/No assessment for Weeks 1-11 (right, AUC=.82), Using
the Target Expressive Measure as the Outcome.
On the post-intervention PPVT-4 outcome, the Yes/No AUC ranged from .68
(Lesson 1) to .76 (Lesson 24). The Yes/No AUC was considered to be “fair” by
Lesson 8 (AUC=.70). On the post-intervention EVT-2 outcome, the Yes/No AUC
ranged from .57 (Lesson 1) to .71 (Lesson 24). The Yes/No AUC was not considered
to be “fair” until Lesson 20 (AUC=.70). Compared to the pre-intervention PPVT-4
and EVT-2 measures, the Yes/No assessment showed weaker classification accuracy
for predicting post-intervention PPVT-4 and EVT-2 outcomes. This finding indicates
that the Yes/No assessments did not provide strong classification accuracy for
predicting general or distal vocabulary outcomes, as indicated in Figure 10.
Figure 10. ROC Curves Comparing the PPVT-4 Screener (left, AUC=.76) and the
Incrementally Averaged Yes/No assessment for Weeks 1-8 (right, AUC=.70), Using
the Post-Intervention PPVT-4 as the Outcome.
PPVT-4
Screener
AUC= .76
Yes/No
Weeks 1-8
AUC= .70

84
In summary, ROC Curve analyses indicated that the Yes/No assessment
provided greater classification accuracy for target word outcomes compared to the pre-
intervention PPVT-4 and EVT-2 measures. Area Under the Curve indicated that the
Yes/No assessment was “good” by Week 8 for predicting Target Receptive outcomes,
and “good” by Week 11 for predicting Target Expressive outcomes. The findings also
indicate that the pre-intervention PPVT-4 measure did not provide “good”
classification accuracy for the target word outcomes (AUC=.73). Similarly, the pre-
intervention EVT-2 measure did not provide “good” classification accuracy for the
target word outcomes (AUC=.72). On the other hand, the pre-intervention PPVT-4
and EVT-2 measures did provide “good” classification accuracy for the general
vocabulary outcome measures (post-intervention PPVT-4 and EVT-2), while the
Yes/No assessments did not provide “good” classification accuracy for general
vocabulary outcomes. The findings indicate that the Yes/No assessments were
stronger in predicting target vocabulary word outcomes, while the PPVT-4 and EVT-2
measures were stronger in predicting general vocabulary outcomes.
Teacher Questionnaire Results
Eighteen Kindergarten teachers from Project EVI completed brief
questionnaires (see Appendices E, F) regarding their experiences administering and
using the weekly vocabulary assessments (Yes/No and Receptive). Responses from
the 13 teachers who participated in the current project are presented in Table 16.
As summarized in Table 16, participating teachers reported that the Yes/No and
Receptive Picture assessments were somewhat time consuming to administer. As
measured during the fidelity observations in the current study, the average time
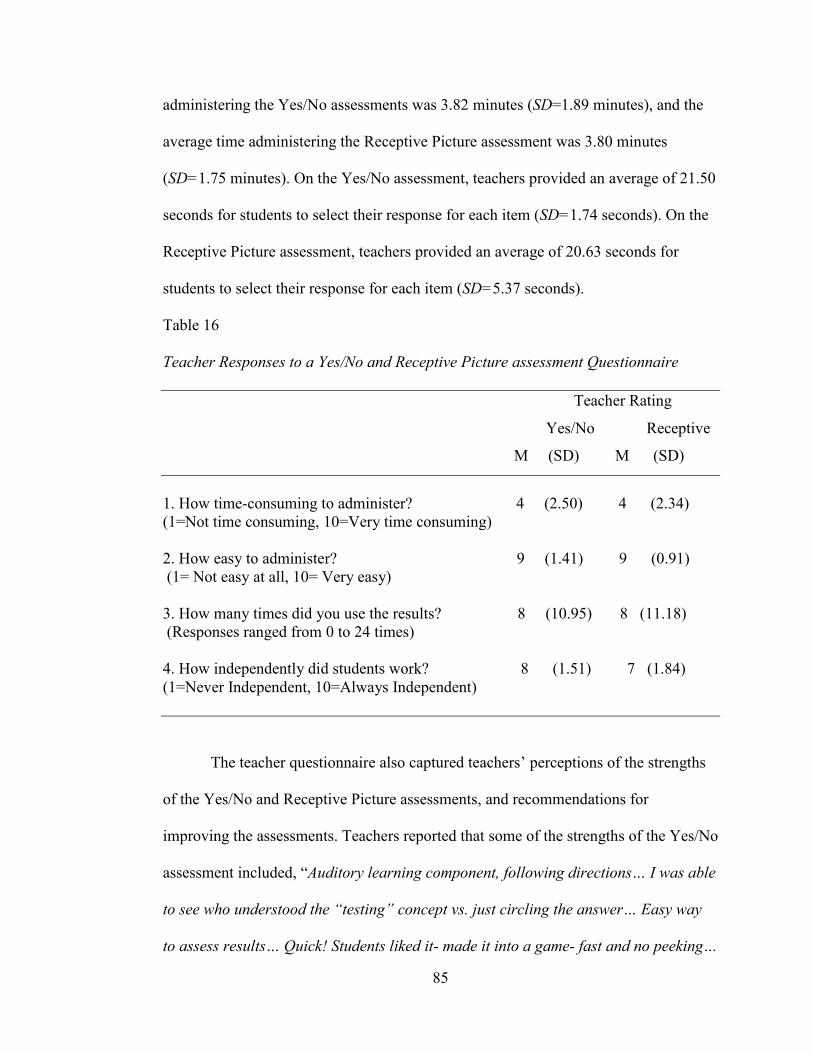
85
administering the Yes/No assessments was 3.82 minutes (SD=1.89 minutes), and the
average time administering the Receptive Picture assessment was 3.80 minutes
(SD=1.75 minutes). On the Yes/No assessment, teachers provided an average of 21.50
seconds for students to select their response for each item (SD=1.74 seconds). On the
Receptive Picture assessment, teachers provided an average of 20.63 seconds for
students to select their response for each item (SD=5.37 seconds).
Table 16
Teacher Responses to a Yes/No and Receptive Picture assessment Questionnaire
Teacher Rating
Yes/No Receptive
M (SD) M (SD)
1. How time-consuming to administer? 4 (2.50) 4 (2.34)
(1=Not time consuming, 10=Very time consuming)
2. How easy to administer? 9 (1.41) 9 (0.91)
(1= Not easy at all, 10= Very easy)
3. How many times did you use the results? 8 (10.95) 8 (11.18)
(Responses ranged from 0 to 24 times)
4. How independently did students work? 8 (1.51) 7 (1.84)
(1=Never Independent, 10=Always Independent)
The teacher questionnaire also captured teachers’ perceptions of the strengths
of the Yes/No and Receptive Picture assessments, and recommendations for
improving the assessments. Teachers reported that some of the strengths of the Yes/No
assessment included, “Auditory learning component, following directions… I was able
to see who understood the “testing” concept vs. just circling the answer… Easy way
to assess results… Quick! Students liked it- made it into a game- fast and no peeking…

86
the simple yes/no format… Clear questions… Good questions- made students think
deeper… You see if the students remember the meaning of the words… Students
learned how to take a test, stay seated, no talking, and listening to directions… and, A
useful, quick check for understanding; shows who is struggling”.
Teachers also provided weaknesses or areas for improvement on the Yes/No
assessment, including, “At the beginning of the year, many students didn’t know the
number names and it was very difficult to administer… Adding lines between each
item helped… The assessment in the workbook showed “more accurate” results of
their knowledge because of the pictures. Yes/no questions had too many unknown
words… Thumb icons could be placed next to each “Yes,No” because beginning of
year Kindergarten students need a visual… Maybe put a picture next to each number
like a star, circle, etc. for those who can’t identify numbers at the beginning of the
year… No visuals so really hard to pay attention to verbal questions… The wording of
the questions confused the students at times- the term “might” was confusing.”
Teachers reported that strengths of the Receptive Picture assessment included,
“The pictures were very helpful as were the colorful borders on the pages… Visual
component… It gave kids the visual for assessments- that some tend to need…Great
pictures, easy to follow…Children were able to do independently… Great pictures,
easy to track… Assesses all words…Clear illustrations… Re-enforced vocabulary
weekly words… Put words in context, gave good visual examples of words… It
reinforces the vocabulary words and meanings… The pictures made it easy for this
age kids…The pictures were helpful at times…. Another nice quick check for
understanding”.

87
Teachers also reported weaknesses or areas for improvement on the Receptive
Picture assessment, including, “Finding page numbers is difficult at the beginning of
the year… Some pictures were difficult to interpret… Some items were too easy as the
year went on… Some of the pictures were not appropriate for this age level- or too
similar… The pictures were confusing and often subjective or didn’t match the
meaning of the word.”
Teachers were asked if they would use the Yes/No assessment in the future.
Eleven out of 13 teachers (85%) responded that they would use the Yes/No assessment
in the future. Teacher responses included, “Yes, it gives a lot of useful information
about the students’ understanding of the vocabulary words… Yes, it tunes their
comprehension and distractibility… I would use it to have results and to see who is
retaining information… Yes, it would help to know if I needed more exaggeration for
teaching the vocabulary… and, Yes, good auditory practice”.
Teachers were asked if they would use the Receptive Picture assessment in the
future. Ten out of 13 teachers (77%) responded that they would use the Receptive
Picture assessment in the future. Teacher responses included, “Yes, it gives practice
with the words and is a good quick check for understanding… Yes, but I would do it in
smaller groups… Yes, to send home so families can see… Yes, to check
comprehension of word meanings… Yes, it wraps up each week… Yes, again it would
give me an idea as to how well I was getting the word across… Yes, but I would ask
students to explain their thinking behind wrong answers (sometimes pictures are
tricky)… Yes, if it was not too costly and there was funding available”.

88
CHAPTER 4
DISCUSSION
The implementation of multi-tiered systems of support in schools holds
promise for addressing low achievement for disadvantaged and struggling students.
Research has demonstrated that Kindergarten interventions are particularly effective in
preventing reading difficulties for at risk students (Cavanaugh, Kim, Wanzek, &
Vaughn, 2004). While there is extensive research informing instruction and
assessment for word recognition skills within a multi-tiered context, less attention has
been focused on promoting early vocabulary growth (Biemiller, 2001; Loftus &
Coyne, 2013; Paris, 2005). Recent research (Beck & McKeown, 2007; Blachowicz et
al., 2013; Coyne et al., 2004, 2007, 2009; Loftus et al., 2010) has contributed greatly
to inform educators of best practices regarding early vocabulary instruction and
intervention. However, within a multi-tiered framework, educators must have
adequate and useful tools for identifying students who are at risk.
While many curriculum-based assessments and tools have been developed to
identify student risk level for word recognition skills and reading comprehension skills
(e.g., DIBELS; University of Oregon, 2014; see Kaminski & Good, 1996), more
research is needed to examine methods of assessing early vocabulary knowledge
within an RtI framework (Loftus & Coyne, 2013; NRP, 2000). The purpose of the
current study was to examine the utility of two curriculum-based assessments of
vocabulary that are embedded within the Elements of Reading: Vocabulary curriculum

89
(Beck & McKeown, 2004). Specifically, the current study examined teacher
perceptions of the assessments (social validity) and the extent to which either or both
of the assessments accurately identified students who were at risk for poor end-of-year
vocabulary outcomes (predictive validity).
Summary of Results
The findings of the current study provided evidence that the Yes/No
assessment embedded within the Elements of Reading: Vocabulary curriculum (Beck
& McKeown, 2004) accurately identified students who were at risk for poor end-of-
year outcomes in target word knowledge. In other words, the results support the use of
the Yes/No assessment for identifying students who are at risk and therefore would
benefit from additional instructional support (i.e., Tier II or Tier III vocabulary
interventions). Furthermore, the findings indicate that averaged Yes/No assessment
data from Weeks 1-8 provided greater classification accuracy for end-of-year target
word outcomes than the PPVT-4 or EVT-2 screening measures. Additionally, the
Yes/No assessment data captured statistically significant differences in target word
vocabulary knowledge between at risk students who received Tier I support only
(Project EVI control group, lowest scores), at risk students who received Tier I and
Tier II support (Project EVI treatment group), and typically achieving students who
received Tier I supports (Project EVI reference group, highest scores).
On the Receptive Picture assessment embedded within the Elements of
Reading: Vocabulary curriculum, a ceiling effect (i.e., most students achieved high
scores) limited the ability to use the assessment to identify students who were at risk.
While there may be advantages to administering the Receptive Picture assessment

90
(e.g., providing students with an additional opportunity to practice using target words),
the current findings indicate that the Receptive Picture assessments in the Elements of
Reading: Vocabulary curriculum are not useful for predicting end-of-year vocabulary
outcomes, or for differentiating between students receiving Tier I versus Tier II
support.
Results from teacher questionnaires indicate that Kindergarten teachers found
the assessments to be very easy to administer and they did not believe that the
administration of the assessments was particularly time-consuming. While some
teachers chose to examine the results of student assessments often, other teachers
chose not to examine student responses at all. The majority of the teachers indicated
that they would be likely to use the assessments in the future (85% would use the
Yes/No assessment; 77% would use the Receptive Picture assessment). However,
teachers noted areas for improvement on the assessments. Recommendations for
improving the Receptive Picture assessment include increasing the difficulty of items,
and selecting pictures that were less ambiguous for interpretation. Recommendations
for the Yes/No assessment included changing the visual-spatial organization of probes
to clearly separate each item, and to include explicit visuals next to each item (e.g., a
thumbs up picture paired with each “Yes” and a thumbs down picture paired with each
“No”).
Limitations
While the findings of the current study provide initial evidence of the utility of
the Yes/No assessment for predicting end-of-year target word vocabulary outcomes,
many limitations must be noted. First, strong evidence for classification accuracy was

91
not established until Week 8 of the Yes/No assessment. Assessment methods with
good classification accuracy that could identify at risk students earlier than eight
weeks would be preferable. Additionally, the classification accuracy of the Yes/No
measure was “good” by Week 8 (AUC>.80), but not “excellent” (AUC>.90).
Educators using this assessment to identify students at risk should be mindful that the
measure does not have perfect classification accuracy. Some students who are truly at
risk might perform well on the Yes/No assessments, and some students who are not at
risk might perform poorly on the assessments. While the current study demonstrates
that the Yes/No assessment had good classification accuracy for identifying student
risk on target word assessments, the assessment was not accurate in classifying student
risk for end-of-year general vocabulary outcomes, as measured by the PPVT-4 and the
EVT-2.
In the current study, teachers administered the weekly assessments, rather than
researchers. While the teachers were trained and fidelity observations were conducted,
it is possible that the teachers did not always administer the assessments in a
standardized method. Additionally, the assessments were administered in a whole-
class format, which increases the possibility that students did not always complete the
assessments completely independently. Teachers were trained to take steps to ensure
that students completed the assessments independently, and fidelity observations noted
a few instances where students did not complete the assessments independently (i.e.,
‘peeking’ at neighbors’ responses); however, it was not possible for the researcher to
comprehensively monitor the degree to which assessments were completed
independently. To minimize error, six of the initial 19 classrooms (31.5%) were
92
eliminated from analyses in the current study due to low levels of independent work
on the assessments (either during fidelity observations, or as reported in the teacher
questionnaire). The relatively high percentage of classes that were not able to
complete the assessments independently brings into question the social validity of
whole-group test administration in early Kindergarten.
Finally, some students struggled with visual-spatial orientation for the Yes/No
assessments in early Kindergarten, and some student responses were ambiguous (e.g.,
both “Yes” and “No” were circled for the same item). For each item with an
ambiguous response, the student’s score for the entire week was omitted from
analyses, leading to the problem of occasional missing data. Additionally, because the
current study took place in elementary schools rather than a controlled environment,
student absences also led to missing data. While these limitations pose challenges for
research purposes, they accurately reflect the day to day considerations for assessment
practices at the early elementary level.
Considerations for Early Vocabulary Assessment
Given that vocabulary is an “unconstrained” skill (Paris, 2005) the method
used to identifying at risk students in the current study differs from the conventional
methods used to screen for poor word recognition skills. For example, most screening
tools do not align exactly with the content of the curriculum, yet contain at least some
material that is known to the student, even if the amount of known material is
minimal. It is expected that the target words selected for direct vocabulary instruction
will be unknown to students prior to instruction; therefore, it would not be appropriate
or useful to screen students prior to instruction using target words. Many researchers

93
have relied on measures of general vocabulary knowledge, which sample both known
and unknown words, to identify students at risk for poor vocabulary outcomes.
However, these methods have substantial limitations for use in a classroom context.
The current study examined the utility of standard, ongoing curriculum-based
vocabulary assessments to identify students at risk for poor vocabulary outcomes. In
other words, ongoing or formative curriculum-based vocabulary assessment results
were used to identify students who did not respond to Tier I instruction.
In selecting tools to identify students at risk, it is important to specify the
outcome. In other words, it is necessary to specify exactly what a student is or is not at
risk for. Within a Tier I direct vocabulary instruction curriculum such as the Elements
of Reading: Vocabulary, the primary instructional goal is for students to learn the
target words or proximal words that were taught directly. A secondary goal for
instruction is to expand students’ transfer or distal word learning and language
comprehension. Although a handful of studies have demonstrated initial evidence for
distal vocabulary gains through short term vocabulary instruction and intervention
(e.g., Coyne et al., 2010; Elleman, Lindo, Mophy, & Compton, 2009); there is strong
research supporting increases in target word learning through direct vocabulary
instruction (Beck et al., 2002; Biemiller & Boote, 2006; Loftus et al., 2010).
The use of standardized measures of general vocabulary knowledge as a
universal screener or outcome assessment for early vocabulary instruction is
problematic for several reasons. First, such measures lack sensitivity to capture
knowledge of the specific target words taught. For example, imagine a Kindergarten
student who learned over 100 “Tier Two” vocabulary words over the course of an

94
academic year through direct vocabulary instruction. An outcome assessment that
measured target word knowledge is more sensitive and appropriate for capturing the
student’s gains, compared to standardized measures of general vocabulary knowledge.
Within an RtI context, screeners typically provide teachers with two levels of
important information. First, screening results identify individual students who are at
risk for poor outcomes and are in need of additional support. Additionally, screening
results provide teachers with an overall conceptualization of Tier I instructional
effectiveness, by examining the number of students who are not responding to Tier I
instruction. A limitation to relying on standardized measures of general vocabulary
knowledge as screeners is that such measures do not allow teachers to examine the
overall effectiveness of their direct vocabulary instruction. For example, imagine that
most students in a kindergarten class were not responding to Tier I vocabulary
instruction. The use of curriculum based vocabulary assessments could inform the
teacher that there is a need to change Tier I instruction to increase the percentage of
students who respond positively. Unlike curriculum based assessments, measures of
general vocabulary knowledge do not provide specific information regarding the
effectiveness of the local instruction.
Another limitation to using standardized measures of general vocabulary
knowledge is that the scores are typically interpreted in terms of percentile ranks and
compared with national norms. This means that even if a student’s performance
improves (raw score increases), the student’s relative ranking (standard score) is not
likely to indicate an improvement unless the gain is substantial. Additionally, general
measures such as the PPVT-4 and EVT-2 are not designed to be administered

95
repeatedly within a short period of time. In schools, these measures are commonly
administered to students by specialists in schools, for the purposes of evaluations.
Using these tools too frequently can result in practice effects and invalidate the use of
the data for multiple purposes.
A practical limitation to using standardized measures of general vocabulary
knowledge is the amount of time and training needed to administer the measures and
score the protocols. Such measures require individual administration, and can take 20
to 30 minutes to complete. In a classroom of 20 Kindergarten students, it would take
over six hours to complete testing using a measure such as the PPVT-4 or EVT-2, with
an additional two to three hours dedicated to scoring and interpreting results. In the
current study, the average time spent administering the Yes/No assessments was 3.82
minutes, and weekly results for an entire class could be calculated within several
minutes.
In early vocabulary intervention studies, researchers typically conduct pre-tests
of target word knowledge. Doing so allows researchers to account for initial target
word knowledge, and make accurate claims regarding growth in target word
knowledge at the time of the posttest. In practice, it may not be appropriate to
administer such pretests of target word knowledge, particularly if “Tier Two” words
are selected for instruction and it is not likely that students have prior word knowledge
(Beck & McKeown, 2002). Instead, assessment of target word knowledge can provide
valuable information for teachers when administered after direct instruction has
occurred. Collecting multiple weeks of data can aid teachers in identifying students
who are not responding to Tier I instruction, and are in need of additional support.

96
In the current study, assessments were administered on a weekly basis,
following direct vocabulary instruction. The weekly scores were averaged
incrementally over time for each participant, and interpreted as students’ response to
the vocabulary instruction. Students with higher averaged scores (i.e., scores above
3.50) were considered to be responding well to the Tier I instruction, with low levels
of risk for poor end-of-year vocabulary outcomes. Students with lower averaged
scores (i.e., scores below 3.50) were considered to be struggling to learn with Tier I
instruction alone, with high levels of risk for poor end-of-year vocabulary outcomes.
In the current study, at risk students who did not receive Tier II supports demonstrated
an average score of 3.29 on the Yes/No assessment, and at risk students who did
receive Tier II supports demonstrated an average score of 3.67 on the Yes/No
assessment. Students who were identified as low risk earned an average score of 4.02
on the Yes/No assessment.
Jenkins, Hudson and Johnson (2007) reviewed considerations to be made when
selecting appropriate screening tools, emphasizing the importance of efficiency and
classification accuracy. Criterion validity is often used by researchers to evaluate the
utility of measures. While criterion validity provides useful information regarding the
relationship between two measures, the information provided is insufficient for
establishing the utility of a screening or predicting measure. Effective screening
measures not only correlate with important and relevant outcomes, but also accurately
classify students as being at risk or not at risk for poor outcomes (Jenkins et al., 2007).
The National Center on Response to Intervention (2011) provides a review of
technical information regarding commonly used screening tools. Each measure is

97
given a rating of having “Convincing Evidence”, “Partially Convincing Evidence” or
“Unconvincing Evidence” on a number of criteria. The criteria include classification
accuracy, generalizability, reliability, validity, disaggregated data, efficiency of
administration, scoring time, and availability of benchmarks/norms. With screening
tools, classification accuracy, as measured by the Area Under the Curve (AUC)
statistic, is particularly important (Jenkins et al., 2007; NCRTI, 2011). Using the
standards outlined by the Technical Review Committee of the National Center on
Response to Intervention (2011), the Yes/No assessment would be rated as having
“Partially Convincing Evidence” in classification accuracy by Week 8 (AUC>.75) for
identifying students at risk for poor target word outcomes. Using the same standards,
the PPVT-4 and EVT-2 would have “Unconvincing Evidence” (AUC<.75) for correct
classification of students at risk for poor target word knowledge.
Using general receptive and expressive vocabulary knowledge as the “gold
standard” outcome measures, the Yes/No assessment did not demonstrate adequate
classification accuracy (AUC<.75). However, the PPVT-4 showed only fair
classification accuracy for predicting end-of-year risk as measured by end-of-year
PPVT-4 performance (AUC=.76). Furthermore, pre-intervention PPVT-4 scores were
not accurate in classifying students who were at risk for poor performance on the end-
of-year EVT-2 (AUC=.71) or the target word measures (AUC<.73). While the EVT-2
measure did not show adequate classification accuracy for target word outcomes
(AUC=.72), in the current study the EVT-2 had good classification accuracy for
general receptive and expressive vocabulary knowledge at the end of the year
(AUC>.80).

98
A challenge of identifying adequate vocabulary assessments in an RtI
framework is the necessity of a Tier I vocabulary curriculum. With a whole-class
vocabulary curriculum in place, educators have the opportunity to test the same words
that they teach, aligning the assessment with the curriculum. At the secondary level,
many educators use vocabulary curriculum-based assessments to monitor student
learning, however few assessment practices are currently available for early
vocabulary instruction. A common method of curriculum-based assessment for
vocabulary at the secondary level is the use of vocabulary matching CBAs (Espin,
Shin & Busch, 2005). However, at the Kindergarten level such methods are
unavailable because students have not yet learned to read and write to demonstrate
their vocabulary knowledge.
A recent review of early vocabulary intervention research (Hardy, Furey &
Loftus, 2013), examined the types of experimenter-developed target word measures
that have been used to evaluate the efficacy of vocabulary interventions in early
elementary grades (Kindergarten through Grade 3). From 2003 to 2013, 32 early
vocabulary intervention studies were conducted, and 26 studies included measures that
assessed target word knowledge. An overview of the types of experimenter developed
target word measures is provided in Table 17. The majority of experimenter developed
target word measures require one-to-one administration. In some circumstances, the
Contextual Word Knowledge: Yes/No assessment, Picture Receptive Vocabulary
assessment, and Categorical Word Knowledge assessment could be administered in a
whole-group setting; however, few studies have examined the efficacy of whole-group
administration of early vocabulary assessments.

99
Table 17
Review of Experimenter Developed Target Word Measures Used from 2003 to 2013
Type of Measure
Description of Measure
Studies Using
the Measure
1. Expressive Definition
Child produces an oral definition for
the word.
50% (n=16)
2. Picture Receptive
Vocabulary
Child identifies the picture that
corresponds with the target word.
34.4% (n=11)
3. Contextual Word
Knowledge: Open-Ended
Child answers a contextual question
about the target word orally.
28.1% (n=9)
4. Expressive Word
Knowledge
Child is shown a picture of a target
word or is given verbal definitions of
the word, and produces the target
word orally (i.e., says the word).
15.6% (n=5)
5. Contextual Word
Knowledge: Yes/No
Child answers a contextual question
about a target word, with a response of
“Yes” or “No”.
12.5% (n=4)
6. Story Retell Child listens to a story and retells the
story immediately following.
6.25% (n=2)
7. Metalinguistic
Awareness
Child demonstrates ability to reflect
on and manipulate language.
6.25% (n=2)
8. Language Samples Child’s use of general vocabulary is
observed and recorded by the
researcher.
6.25% (n=2)
9. Spelling Target Word Child listens to target words read
aloud and writes the words.
3.1% (n=1)
10. Categorical Word
Knowledge
Child demonstrates ability to sort
words into appropriate categories.
3.1% (n=1)
Note: This table was adapted from Hardy, Furey, & Loftus (2013). Twenty-six early
vocabulary intervention studies were examined, and some of the studies used more
than one experimenter developed target word measure.

100
Future Directions
Early vocabulary assessments that are aligned with Tier I instruction can
provide useful information regarding the effectiveness of Tier I instruction and
individual students’ level of risk for poor target word outcomes. However, the current
study only explored two methods of vocabulary measurement (Yes/No and picture
Receptive Picture assessments). More research is needed to examine other forms of
vocabulary assessment (e.g., expressive assessments), as well as other methods of
assessing vocabulary (e.g., one-to-one, peer assessments, computer-based assessments,
etc.).
A promising area of research on early vocabulary assessment involves the use
of technology (computers, tablets, etc.) to administer assessments and provide teachers
and students with immediate feedback. In the current study, only 56% of the teachers
took the time to examine assessment results. It is essential that teachers are able to
access assessment results in a timely manner, in order to make appropriate
instructional decisions (Fuchs & Fuchs, 1986; Stecker, Fuchs & Fuchs, 2005).
Technology-based assessments have the potential to provide teachers with immediate
feedback and store information regarding classroom outcomes and district outcomes.
Educators would benefit from easily accessible data regarding student progress and
level of risk. Additionally, researchers and practitioners are encouraged to collect local
screening data and conduct classification analyses using relevant “gold standard”
outcomes (National Center on Response to Intervention, 2010).
Another consideration for future research involves examining the trade-off
between using vocabulary assessments that provide comprehensive information and

101
using vocabulary assessments that are efficient and manageable to administer. For
example, most of the vocabulary assessments used at the Kindergarten level are
administered to students individually, given that Kindergarten students are not yet able
to read or write to express their word knowledge. Assessments that can be
administered individually have benefits in terms of the type of information that can be
gathered at the Kindergarten level, and individual administration ensures that students
respond independently. However, individually administered assessments are more
time consuming. Assessments that can be administered in a whole class or small group
setting have important benefits in terms of efficiency. Maximizing the quality of the
vocabulary assessments (psychometric and predictive properties) and the efficiency of
administering the assessment (time and ease of administration) is crucial for
promoting data-based instructional decision making for vocabulary development.
Conclusions
Findings from the current study suggest that the ongoing use and interpretation
of curriculum-based vocabulary assessments within a Response to Intervention
framework can provide useful and accurate information regarding student response to
instruction and level of risk. In fact, the findings demonstrated that curriculum based
assessments of vocabulary knowledge can provide more useful information than
standardized measures of general vocabulary knowledge, regarding risk level for
target word outcomes. Previous research on early vocabulary instruction and
intervention has largely used proximal or direct, experimenter-developed assessments
of target words as the gold standard outcome measures (Coyne et al., 2010; NRP,
2000). A primary reason for developing or selecting measures that assess target word
102
knowledge directly is that such “proximal” measures have higher levels of sensitivity
to growth in vocabulary, compared with standardized measures of general or “distal”
word knowledge. In short, researchers agree that the most direct method of capturing
student learning within a multi-tiered vocabulary curriculum is to assess the same
words that were taught, or to use curriculum-based assessments (NRP, 2000).
The current study incrementally averaged multiple weeks of Yes/No
assessment data were over time, with the goal of examining how well individual
students respond to Tier I vocabulary instruction, which students are at risk for poor
end-of-year target word outcomes, and how many data points are necessary for
accurate classification accuracy. It is not typical practice to use ongoing assessment
results as a universal screener to identify students at risk for poor outcomes. More
typically, researchers have used standardized measures of general vocabulary
knowledge to screen students and identify students who are likely to be at risk for poor
vocabulary outcomes (Coyne et al., 2009). Indeed, standardized measures of general
vocabulary knowledge such as the PPVT-4 or EVT-2 are more useful for identifying
at risk students prior to instruction when compared with curriculum-based
assessments. It stands to reason that most students would achieve low scores
vocabulary curriculum-based assessments that were administered prior to receiving
direct vocabulary instruction, because it is expected that the words assessed had not
yet been learned. However, the use of standard, ongoing curriculum-based vocabulary
assessments can allow educators and researchers to assess individual student response
to instruction or intervention.
103
If the intended use of assessment data is to accurately identify students who are
at risk for a given outcome, it is important to examine classification accuracy of the
assessment using relevant outcomes. Surprisingly, many of the widely used screening
measures in the domain of reading have not demonstrated adequate levels of
classification accuracy (National Center on Response to Intervention, 2011).
Considering that it is nearly impossible for an assessment to have perfect classification
accuracy, researchers have emphasized a need for balancing levels of sensitivity and
specificity. In recognition of the inherent measurement error that is associated with
assessments, researchers and educators must consider trade-offs between selecting cut
scores that yield high sensitivity (i.e., the screener detects almost all of the at risk
students) yet sacrifice specificity (i.e., some of the students identified as being at risk
are not actually at risk) (Petscher, Kim, & Foorman, 2011). While it is desirable to
provide every at risk student with additional supports, screeners with high sensitivity
and poor specificity will over-identify the number of students at risk. Given the
limited resources for Tier II and III (supplemental) instructional supports, it is in the
best interest of schools to use measures with adequate sensitivity and specificity for
important outcomes. However, in an RtI framework, researchers have emphasized the
need to maximize sensitivity in order to provide timely services for students who are
at risk (Jenkins et al., 2007; Petscher et al., 2011).
The current study provides a framework for examining the predictive validity
of curriculum based vocabulary assessments within a multi-tiered system of
instruction. Importantly, vocabulary assessments that are technically adequate and are
efficient to use will be the most useful in a classroom context. While more research is

104
being conducted regarding best practices for early vocabulary instruction and
intervention (e.g., Biemiller & Boote, 2006; Coyne et al., 2010), less research is
focused on early vocabulary assessments within an RtI framework. Perhaps one of the
greatest challenges to examining vocabulary assessment within an RtI framework is
the necessity of a Tier I vocabulary curriculum. With increased attention to early
vocabulary instruction and intervention, there are increased opportunities to
simultaneously evaluate the utility of vocabulary assessments. Researchers are
encouraged to examine the utility of vocabulary assessments within the context of
multi-tiered early vocabulary instruction and intervention. Appropriate and efficient
tools for identifying students at risk for poor vocabulary outcomes will permit
educators to intervene early and support learning outcomes for all students.

105
APPENDIX A
Sample Yes/No Curriculum Based Vocabulary Assessment
1. Can you be active on a playground? (yes)
2. Does a bird scamper while it flies in the sky? (no)
3. Is a piece of string broad? (no)
4. Can a cook whisk some cake batter? (yes)
5. Is blue a word that can sometimes describe the sky? (yes)

106
APPENDIX B
Sample Receptive Picture Curriculum Based Vocabulary Assessment

107
APPENDIX C
Fidelity Observation for Teacher Administration of Weekly Assessments
Teacher: ___________________________ Observer: ____________________
School: ____________________________ Date: ______________________
Yes/No assessment
(Booklet)
Observed
Not
Observed
Notes
1. Teacher does not provide target word
definitions before administering the
assessments.
2. Teacher ensures that each student has the
correct Yes/No Booklet (either by handing
booklets out individually, putting the
booklets on the appropriate desks, etc.).
3. Teacher ensures that all students have a
writing utensil for completing the Yes/No
assessment.
4. Teacher asks students to turn to
appropriate page in the Yes/No booklet (or, teacher takes steps to ensure that the
students are responding on the correct page
of the Yes/No Booklet).
5. Teacher reads each question loudly and
clearly, and gives students enough time to
respond.
6. Teacher ensures that each student
completes assessments independently; no
guidance is given related to the correct or
incorrect answers (until after responses have
been recorded).
Yes/No assessment Start Time: _____ Yes/No assessment End Time: _______
Time for Q1
____ seconds
Time for Q2
____seconds
Time for Q3
_____seconds
Time for Q4
_____seconds
Time for Q5
____seconds

108
APPENDIX C Continued
Fidelity Observation for Teacher Administration of Weekly Assessments
Receptive Picture assessment
(Workbook)
Observed
Not
Observed
Notes
7. Teacher does not provide target word
definitions before administering the
assessments.
8. Teacher ensures that each student has
the correct Receptive Workbook (either
by handing workbooks out individually,
putting the workbooks on the appropriate
desks, etc.).
9. Teacher ensures that all students have a
writing utensil for the completion of the
Receptive Picture assessment.
10. Teacher asks students to turn to
appropriate page in the Receptive
Workbook (or, teacher takes steps to
ensure that the students are responding on
the correct page of the workbook).
11. Teacher reads each question loudly
and clearly, and gives students enough
time to respond.
12. Teacher ensures that each student
completes assessments independently;
no guidance is given related to the correct
or incorrect answers (until after responses
have been recorded).
13. Teacher collects the Yes/No Booklets
and Receptive Workbooks.
Picture assessment Start Time: ___ Picture assessment End Time: ____
Time for Q1
___ seconds
Time for Q2
____seconds
Time for Q3
____seconds
Time for Q4
___seconds
Time for Q5
___seconds
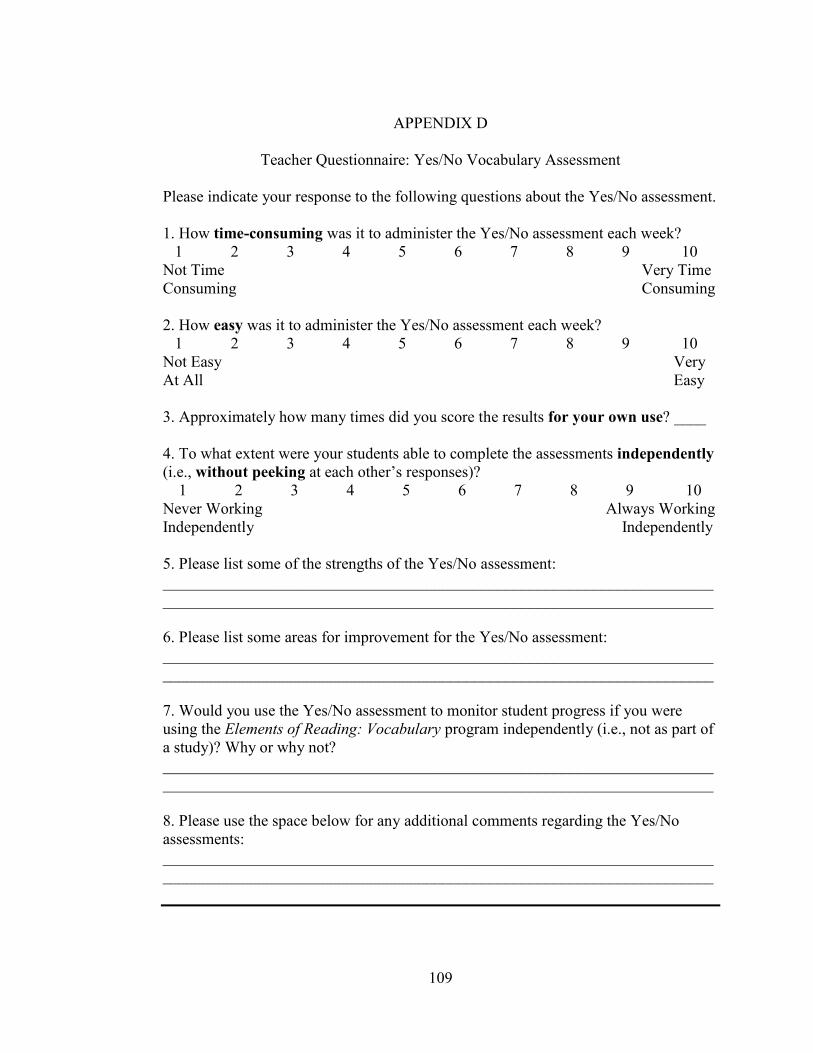
109
APPENDIX D
Teacher Questionnaire: Yes/No Vocabulary Assessment
Please indicate your response to the following questions about the Yes/No assessment.
1. How time-consuming was it to administer the Yes/No assessment each week?
1 2 3 4 5 6 7 8 9 10
Not Time Very Time
Consuming Consuming
2. How easy was it to administer the Yes/No assessment each week?
1 2 3 4 5 6 7 8 9 10
Not Easy Very
At All Easy
3. Approximately how many times did you score the results for your own use? ____
4. To what extent were your students able to complete the assessments independently
(i.e., without peeking at each other’s responses)?
1 2 3 4 5 6 7 8 9 10
Never Working Always Working
Independently Independently
5. Please list some of the strengths of the Yes/No assessment:
_____________________________________________________________________
_____________________________________________________________________
6. Please list some areas for improvement for the Yes/No assessment:
_____________________________________________________________________
_____________________________________________________________________
7. Would you use the Yes/No assessment to monitor student progress if you were
using the Elements of Reading: Vocabulary program independently (i.e., not as part of
a study)? Why or why not?
_____________________________________________________________________
_____________________________________________________________________
8. Please use the space below for any additional comments regarding the Yes/No
assessments:
_____________________________________________________________________
_____________________________________________________________________

110
APPENDIX E
Teacher Questionnaire: Receptive Vocabulary Assessment
Please indicate your response to the following questions about the Receptive Picture
assessment.
1. How time-consuming was it to administer the Receptive Picture assessment each
week?
1 2 3 4 5 6 7 8 9 10
Not Time Very Time
Consuming Consuming
2. How easy was it to administer the Receptive Picture assessment each week?
1 2 3 4 5 6 7 8 9 10
Not Easy Very
At All Easy
3. Approximately how many times did you score the results for your own use? ____
4. To what extent were your students able to complete the assessments independently
(i.e., without peeking at each other’s responses)?
1 2 3 4 5 6 7 8 9 10
Never Working Always Working
Independently Independently
5. Please list some of the strengths of the Receptive Picture assessment:
_____________________________________________________________________
_____________________________________________________________________
6. Please list some areas for improvement for the Receptive Picture assessment:
_____________________________________________________________________
_____________________________________________________________________
7. Would you use the Receptive Picture assessment to monitor student progress if you
were using the Elements of Reading: Vocabulary program independently (i.e., not as
part of a study)? Why or why not?
_____________________________________________________________________
_____________________________________________________________________
8. Please use the space below for any additional comments regarding the Receptive
Picture assessment:
_____________________________________________________________________

111
References
American Educational Research Association, American Psychological Association,
and National Council on Measurement in Education. (1999). Standards for
educational and psychological testing. Washington, DC: American
Educational Research Association.
Apthorp, H., Randel, B., Cherasaro, T., Tedra, C., McKeown, M., & Beck, I. (2012).
Effects of a supplemental vocabulary program on vocabulary knowledge and
passage comprehension. Journal of Research on Educational Effectiveness, 5,
160-188.
Baker, S.K., Kame’enui, E., Simmons, D., & Simonsen, B. (2007) Characteristics of
students with learning and curricular needs. In Coyne, M., Kame’enui, E., &
Carnine, D. (Eds.) Effective teaching strategies that accommodate diverse
learners, 3rd Edition, (pp. 23 – 43). Upper Saddle River, NJ: Pearson.
Baker, Simmons, & Kame'enui. (1997). Vocabulary acquisition: Research bases. In
Simmons, D. C. & Kame'enui, E. J. (Eds.), What reading research tells us
about children with diverse learning needs: Bases and basics. Mahwah, NJ:
Erlbaum.
Beck, I.L., & McKeown, M.G. (2004). Elements of reading: Vocabulary. Austin, TX:
Teck-Vaughn.
Beck, I.L., McKeown, M.G., & Kucan, L. (2002). Bringing words to life: Robust
vocabulary instruction. New York: Guilford.

112
Biemiller, A. (2001). Teaching vocabulary: Early, direct, and sequential. American
Educator, 25, 24-28. Washington, DC: American Federation of Teachers.
Biemiller, A. & Boote, C. (2006). An effective method for building meaning
vocabulary in primary grades. Journal of Educational Psychology, 98, 44-62.
Blachowicz, C., Fisher, P., Ogle, D., & Taffe, S.W. (2013). The importance of
academic vocabulary. In teaching academic vocabulary K-8: Effective
practices across the curriculum (pp. 1-15). New York, NY: Guilford Press.
Black, P., & Wiliam, D. (2009). Developing the theory of formative assessment.
Educational Assessment, Evaluation and Accountability, 21, 5-31.
Bloom, B.S., Hastings, J.T., & Madaus, G.F. (1971). Handbook on formative and
summative evaluation of student learning. New York, NY: McGraw-Hill Book
Company.
Bradley, R., Danielson, L., & Doolittle, J. (2005). Response to intervention, Journal of
Learning Disabilities, 38, 485-486.
Brown-Chidsey, R. & Steege, M. W. (2010). Response to intervention: Principles and
strategies for effective practice (2nd
Ed.) New York: Guilford.
Burns, M.K., & Gibbons, K. (2008). Implementing response-to-intervention in elementary
and secondary schools: Procedures to assure scientific-based practices. New
York, NY: Taylor & Francis Group.
Cabell, S.Q., Justice, L.M., Zucker, T.A., & Kilday, C.R. (2009).Validity of teacher report
for assessing the emergent literacy skills of at-risk preschoolers. Language,
Speech, and Hearing Services in Schools, 40, 161-173.

113
Carey, S. (1978). The child as word learner. In M. Halle, J. Bresnan, & G. Miller (Eds.),
Linguistic theory and psychological reality (pp. 264-293). Cambridge, MA: MIT
Press.
Carroll, John. (1963) A model of school learning. Teachers College Record. 64, 723-733.
Cavanaugh, C. L., Kim, A., Wanzek, J., & Vaughn, S. (2004). Kindergarten reading
interventions for at-risk students: Twenty years of research. Learning
Disabilities—A Contemporary Journal, 2, 9–21.
Collins, M. F. (2010). ELL preschoolers’ English vocabulary acquisition from
storybook reading. Early Childhood Research Quarterly, 25, 84-84-97
Compton, D.L., Fuchs, D., Fuchs, L.S., & Bryant, J.D. (2006). Selecting at-risk
readers in first grade for early intervention: A two-year longitudinal study of
decision rules and procedures. Journal of Educational Psychology, 98, 394-
409.
Coyne, M. D., Capozzoli, A., Ware, S., & Loftus, S. (2010). Beyond RTI for
decoding: Supporting early vocabulary development within a multitier
approach to instruction and intervention. Perspectives on Language and
Literacy, 18-21.
Coyne, M., McCoach, D. B., & Kapp, S. (2007). Teaching vocabulary to kindergarten
students at risk of reading difficulties: A comparison of rich instruction, basic
instruction, and incidental exposure. Learning Disabilities Quarterly, 30, 74–
88.
Coyne, M.D., McCoach, D.B., Loftus, S., Zipoli, R.& Kapp, S. (2009). Direct
vocabulary instruction in kindergarten: Teaching for breadth versus depth. The
Elementary School Journal, 110, 1-18.

114
Coyne, M. D., Simmons, D. C., Kame’enui, E. J., & Stoolmiller, M. (2004). Teaching
vocabulary during shared storybook readings: An examination of differential
effects. Exceptionality, 12, 145-162.
Cronbach, L.J. (1942). Measuring knowledge of precise word meaning. The Journal of
Educational Research, 36, 528–534.
Cunningham, A.E. & Stanovich, K.E. (1997). Early reading acquisition and its relation
to reading experience and ability 10 years later. Developmental Psychology,
33, 934-945.
Deno, S.L. (1987). Curriculum-based measurement. Teaching Exceptional Children,
20, 41.
Deno, S.L., & Mirkin, P.K. (1977). Data-based program modification: A manual.
Reston, VA: Council for Exceptional Children.
Dickinson, D.K., & Neuman, S.B. (2006). Handbook of Early Literacy Research,
Volume 2. New York: The Guilford Press.
Dickinson, D.K., & Tabors, P.O. (2002). Beginning Literacy with Language.
Baltimore: Paul H. Brooks Publishing Co.
Duncan, G.J., Dowsett, C.J., Claessens, A., Magnuson, K., Huston, A.C., Kelbanov,
P., Pagani, L.S., Feinstein, L. Engel, M., Brooks-Gunn, J., Sexton, H., &
Duckworth, K. (2007). School readiness and later achievement. Developmental
Psychology, 43, 1428-1446.
Dunn, L.M. & Dunn, L.M. (2007) Peabody Picture Vocabulary Test, Fourth Edition.
Circle Pines, MM: American Guidance Service.

115
Elleman, A. M., Lindo, E. J., Morphy, P., & Compton, D. L. (2009). The impact of
vocabulary instruction on passage-level comprehension of school-age children:
A meta-analysis. Journal of Research on Educational Effectiveness, 2, 1–44.
Espin, C.A., Shin, J., & Busch, T. (2005). Curriculum-based measurement in the
content areas: Vocabulary matching as an indicator of progress in social
studies learning. Journal of Learning Disabilities, 38, 353-363.
Evans, G.W. (2004). The environment of childhood poverty. American Psychologist,
59, 77-92.
Fuchs L.S., & Fuchs, D. (1986). Effects of systematic formative evaluation: A meta-
analysis. Exceptional Children, 53, 199-208.
Fuchs, L. S. Fuchs, D., & Vaughn, S. (2008). Response to intervention: A framework
for reading educators. Newark, DE: International Reading Association.
Furr, R.M., & Bacharach, V.R. (2008). Psychometrics: An introduction. Los Angeles,
CA: SAGE Publications.
Gickling, E.E., & Havertape, J. (1981). Curriculum-based assessment (CBA).
Minneapolis, MN: National School Psychology Inservice Training Network.
Good III, R. H., & Kaminski, R. A. (1996). Assessment for instructional decisions:
Toward a proactive/prevention model of decision-making for early literacy
skills. School Psychology Quarterly, 11, 326–336.
Gutkin, T.B. (2012). Ecological psychology: Replacing the medical model paradigm
for school-based psychological and psychoeducational services. Journal of
Educational and Psychological Consultation, 22, 1-20.

116
Hardy, S.E., Furey, J., Loftus-Rattan, S.M. (2013). Experimenter-developed
vocabulary measures: An overview. Poster presented at National School
Psychologists Convention, Seattle, February 14, 2013.
Hart, B., & Risley, T.R. (1995). Meaningful differences in the everyday experience of
young American children. Baltimore: Paul H. Brookes Publishing Co.
Hattie, J. (2009). Visible learning: A synthesis of over 800 meta-analyses relating to
achievement. New York, NY: Routledge.
Hickman, P., Pollard-Durodola, S., & Vaughn, S. (2004). Storybook reading:
Improving vocabulary and comprehension for English-language
learners. Reading Teacher, 57, 720-730.
Hintze, J.M., Christ, T., & Methe, S.A. (2006). Curriculum-based assessment.
Psychology in the Schools, 43, 45-56.
Hosp, M., Hosp, J., Howell, K. (2007). CMB for assessment and problem solving. The
ABCs of CBM: A Practical Guide to Curriculum-Based Measurement. New
York: Guilford Press.
Howell, K.W. (1986). Direct assessment of academic performance. School Psychology
Review, 15, 324–335.
Idol, L., Nevin, A., & Paolucci-Whitcomb, P. (1999). Models of curriculum-based
assessment: A blueprint for learning. Austin, TX: Pro Ed.
Jenkins, J.R., Graff, J.J., Miglioretti, D.L. (2009). Estimating reading growth using
intermittent CBM progress monitoring. Exceptional Children, 75, 151-163.
Kaminski, R. A., & Good, R. H. (1996). Toward a technology for assessing basic early
literacy skills. School Psychology Review, 25, 215–227.
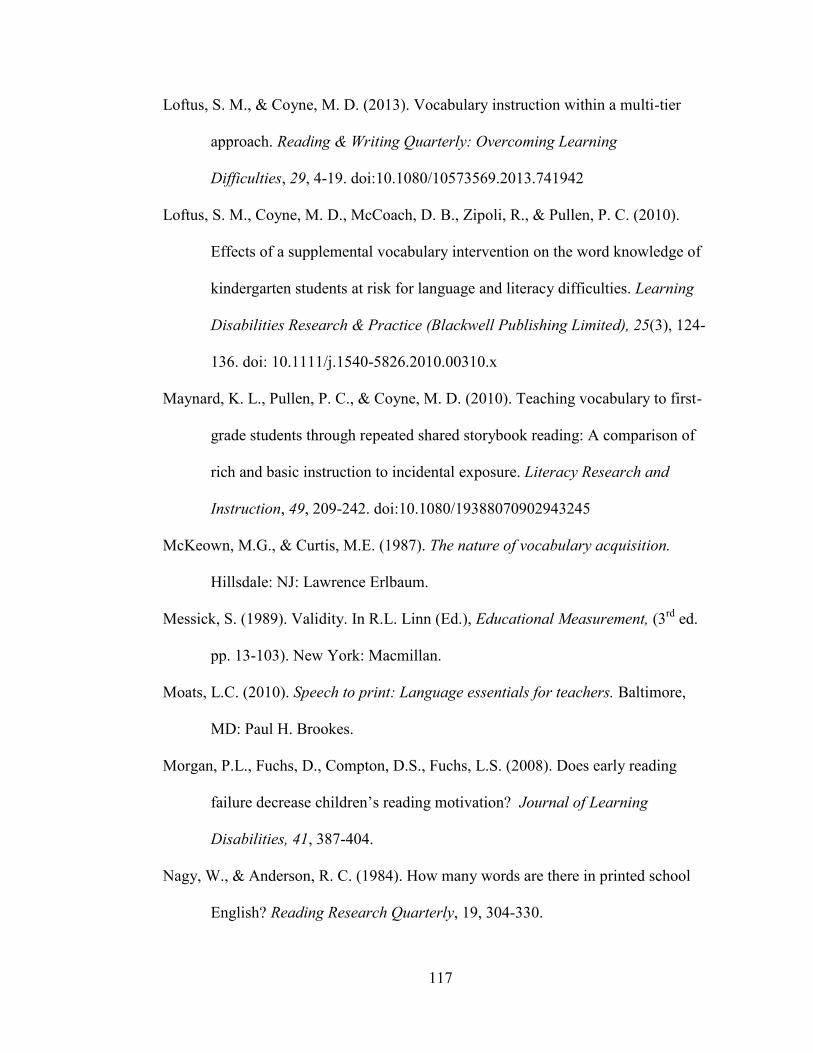
117
Loftus, S. M., & Coyne, M. D. (2013). Vocabulary instruction within a multi-tier
approach. Reading & Writing Quarterly: Overcoming Learning
Difficulties, 29, 4-19. doi:10.1080/10573569.2013.741942
Loftus, S. M., Coyne, M. D., McCoach, D. B., Zipoli, R., & Pullen, P. C. (2010).
Effects of a supplemental vocabulary intervention on the word knowledge of
kindergarten students at risk for language and literacy difficulties. Learning
Disabilities Research & Practice (Blackwell Publishing Limited), 25(3), 124-
136. doi: 10.1111/j.1540-5826.2010.00310.x
Maynard, K. L., Pullen, P. C., & Coyne, M. D. (2010). Teaching vocabulary to first-
grade students through repeated shared storybook reading: A comparison of
rich and basic instruction to incidental exposure. Literacy Research and
Instruction, 49, 209-242. doi:10.1080/19388070902943245
McKeown, M.G., & Curtis, M.E. (1987). The nature of vocabulary acquisition.
Hillsdale: NJ: Lawrence Erlbaum.
Messick, S. (1989). Validity. In R.L. Linn (Ed.), Educational Measurement, (3rd
ed.
pp. 13-103). New York: Macmillan.
Moats, L.C. (2010). Speech to print: Language essentials for teachers. Baltimore,
MD: Paul H. Brookes.
Morgan, P.L., Fuchs, D., Compton, D.S., Fuchs, L.S. (2008). Does early reading
failure decrease children’s reading motivation? Journal of Learning
Disabilities, 41, 387-404.
Nagy, W., & Anderson, R. C. (1984). How many words are there in printed school
English? Reading Research Quarterly, 19, 304-330.

118
National Center for Education Statistics (2013). The Nation's Report Card: Trends in
Academic Progress 2012 (NCES 2013–456). National Center for Education
Statistics, Institute of Education Sciences, U.S. Department of Education,
Washington, D.C.
National Center on Response to Intervention. (2010, April). Essential components of
RtI A closer look at response to intervention. Washington, DC: U.S.
Department of Education, Office of Special Education Programs, National
Center on Response to Intervention. Retrieved from
http://www.cldinternational.org/articles/rtiessentialcomponents.pdf
National Center on Response to Intervention. (2011). Screening Tools Chart.
Washington, DC: U.S. Department of Education, Office of Special Education
Programs, National Center on Response to Intervention. Retrieved from
http://www.rti4success.org/resources/tools-charts/screening-tools-chart
National Reading Panel. (2000). Teaching children to read: An evidence-based
assessment of the scientific research literature on reading and its implications
for reading instruction: Reports of the subgroups. Bethesda, MD: Institute of
Child Health and Human Development.
Paris, S.G. (2005). Reinterpreting the development of reading skills. Reading
Research Quarterly, 40, 184–202. doi:10.1598/RRQ.40.2.3
Petscher, Y., Kim, Y., & Foorman, B.R. (2011). The importance of predictive power
in early screening assessments: Implications for placement in the response to
intervention framework. Assessment for Effective Intervention, 36, 158-166.

119
Resendez, M., & Azin, M. (2007). A study on the effectiveness on Harcourt achieve’s
Elements of Reading: Vocabulary study. Planning, Research, & Evaluation
Services Inc.
Scarborough, H. (2001). Connecting early language and literacy to later reading
(dis)abilities Evidence, theory, and practice. In Neuman and Dickinson, Handbook
of Early Literacy Research, pgs. 97-110.
Scriven, M. (2002). Assessing six assumptions in assessment. In H.I. Braun, D.N.
Jackson, & D.E. Wiley (Eds.). The role of constructs in psychological and
educational measurement (pp. 255-275). Mahwah, NJ: Lawrence Erlbaum.
Shinn, M.R. (Ed.). (1998). Advanced Applications of Curriculum-Based Measurement.
New York:: Guilford.
Silverman, R. (2007). A comparison of three methods of vocabulary instruction during
read-alouds in kindergarten. The Elementary School Journal, 108, 97-113.
Silverman, R. & Hines, S. (2009). The effects of multimedia-enhanced instruction on the
vocabulary of English-language learners and non-English-language learners in
pre-kindergarten through second grade. Journal of Educational Psychology, 101,
305-314.
Snow, C.E., Burns, M.S., & Griffin, P. (1998). Prevention reading difficulties in
young children. Washington, DC: National Academy Press.
Stahl, S.A. (2003). How words are learned incrementally over multiple exposures. The
American Educator, 25, 18-30.
Stahl, K. A. D., & Bravo, M. A. (2010). Contemporary classroom vocabulary
assessment. The Reading Teacher, 63, 566-578.

120
Stanovich, K.E. (1986). Matthew effects in reading: Some consequences of individual
differences in the acquisition of literacy. Reading Research Quarterly, 21, 360-
407.
Stecker, P.M., Fuchs, L.S., & Fuchs, D. (2005). Using curriculum-based measurement
to improve student achievement: Review of the research. Psychology in the
Schools, 42(8), 795-819.
Stiggins, R.J. (2001). The unfulfilled promise of classroom assessment. Educational
Measurement: Issues and Practice, 5-15.
Torgesen, J.K. (2002). The prevention of reading difficulties. Journal of School
Psychology, 40¸7-26.
University of Oregon Center on Teaching and Learning. (2014). Dynamic Indicators
of Basic Early Literacy Skills. Retrieved February 10, 2014, from
http://dibels.uoregon.edu/
Wanzek, J., & Vaughn, S. (2007). Research-based implications from extensive early
reading interventions. School Psychology Review, 36, 541–561.
Wasik, B.A., & Hindman, A.H. (2011). Improving vocabulary and pre-literacy skills
of at-risk preschool students through teacher professional development.
Journal of Educational Psychology, 201, 455-469.
Williams, K.T. (2007). Expressive Vocabulary Test, Second Edition. San Antonio, TX:
Pearson Assessments.