earnings of fy2015/3 · imaging solutions information solutions document solutions (bln yen)...
TRANSCRIPT
1
Earnings of FY2015/3
Apr. 30, 2015
FORWARD-LOOKING STATEMENTSForward-looking statements, such as those relating to earnings forecasts and other projections contained in this material, are management’s current assumptions and beliefs based on currently available information. Such forward-looking statements are subject to a number of risks, uncertainties, and other factors. Accordingly, actual results may differ materially from those projected due to various factors.
2
2
Consolidated Performance for FY2015/3 Consolidated Performance for FY2015/3 ((((((((Apr. 2014 Apr. 2014 –– MarMar. 2015. 2015))))))))
Note: Analysis of operating income (YoY) Exchange rate fluctuations: + ¥ 7.4 billion, Raw material prices: ¥(2.3) billion
Performance Summary of FY2015/3Performance Summary of FY2015/3
(Billions of yen)
FY2014/3 FY2015/3 Change
2,440.0 2,492.6 52.6100.0% 100.0% +2.2%
140.8 172.4 31.65.8% 6.9% +22.4%
157.2 197.1 39.96.4% 7.9% +25.4%
81.0 118.6 37.63.3% 4.8% +46.4%
ROE 4.2% 5.6% +1.4%Exchange US$/¥ ¥100 ¥110 +¥10 Rates €/¥ ¥134 ¥139 +¥5
¥168.07 ¥245.94
Revenue
Operating Income
Income before Income Taxes
Net Income Attributable toFUJIFILM Holdings
Net Income Attributable toFUJIFILM Holdings per Share ¥77.87
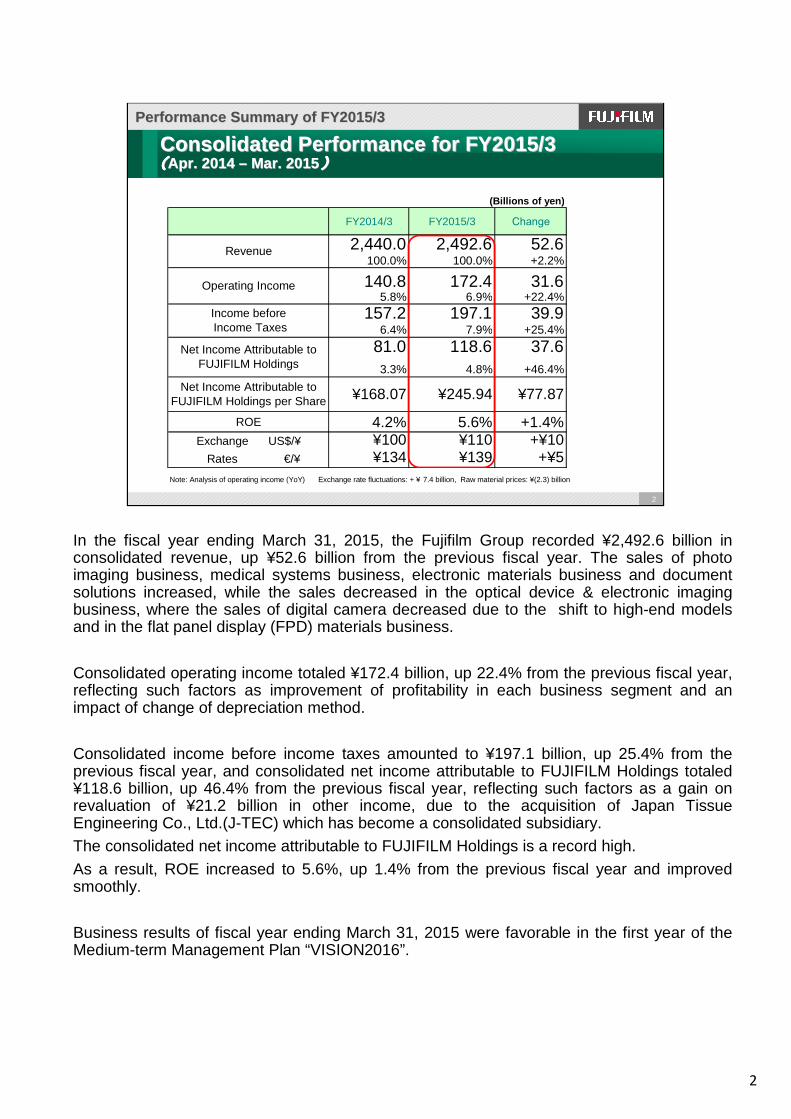
In the fiscal year ending March 31, 2015, the Fujifilm Group recorded ¥2,492.6 billion in consolidated revenue, up ¥52.6 billion from the previous fiscal year. The sales of photo imaging business, medical systems business, electronic materials business and document solutions increased, while the sales decreased in the optical device & electronic imaging business, where the sales of digital camera decreased due to the shift to high-end models and in the flat panel display (FPD) materials business.
Consolidated operating income totaled ¥172.4 billion, up 22.4% from the previous fiscal year, reflecting such factors as improvement of profitability in each business segment and an impact of change of depreciation method.
Consolidated income before income taxes amounted to ¥197.1 billion, up 25.4% from the previous fiscal year, and consolidated net income attributable to FUJIFILM Holdings totaled ¥118.6 billion, up 46.4% from the previous fiscal year, reflecting such factors as a gain on revaluation of ¥21.2 billion in other income, due to the acquisition of Japan Tissue Engineering Co., Ltd.(J-TEC) which has become a consolidated subsidiary.The consolidated net income attributable to FUJIFILM Holdings is a record high.
As a result, ROE increased to 5.6%, up 1.4% from the previous fiscal year and improved smoothly.
Business results of fiscal year ending March 31, 2015 were favorable in the first year of the Medium-term Management Plan “VISION2016”.
3
3
Consolidated Revenue and Operating Income by Segmen tsConsolidated Revenue and Operating Income by Segmen ts
Performance Summary of FY2015/3Performance Summary of FY2015/3
(Billions of yen)
Full YearFY2014/3 FY2015/3
Imaging Solutions 373.6 361.0 (12.6) (-3.4%)
Information Solutions 933.9 953.6 19.7 (+2.1%)
Document Solutions 1,132.5 1,178.0 45.5 (+4.0%)
Total 2,440.0 2,492.6 52.6 (+2.2%)
Note: After elimination of intersegment transaction.
(Billions of yen)
Full YearFY2014/3 FY2015/3
Imaging Solutions 3.6 20.7 17.1 (5.8 times)
Information Solutions 72.9 81.2 8.3 (+11.3%)
Document Solutions 96.0 101.3 5.3 (+5.6%)
Corporate Expenses &Eliminations (31.7) (30.8) 0.9
Total 140.8 172.4 31.6 (+22.4%)
Change
Change
Revenue
Operating Income
Revenue
933.9
373.6
1,132.5953.6
361.0
1,178.0
0
200
400
600
800
1,000
1,200
1,400
ImagingSolutions
InformationSolutions
DocumentSolutions
(bln yen)
Operating Income
3.6
72.9
96.0
20.7
81.2
101.3
0
20
40
60
80
100
120
ImagingSolutions
InformationSolutions
DocumentSolutions
(bln yen)
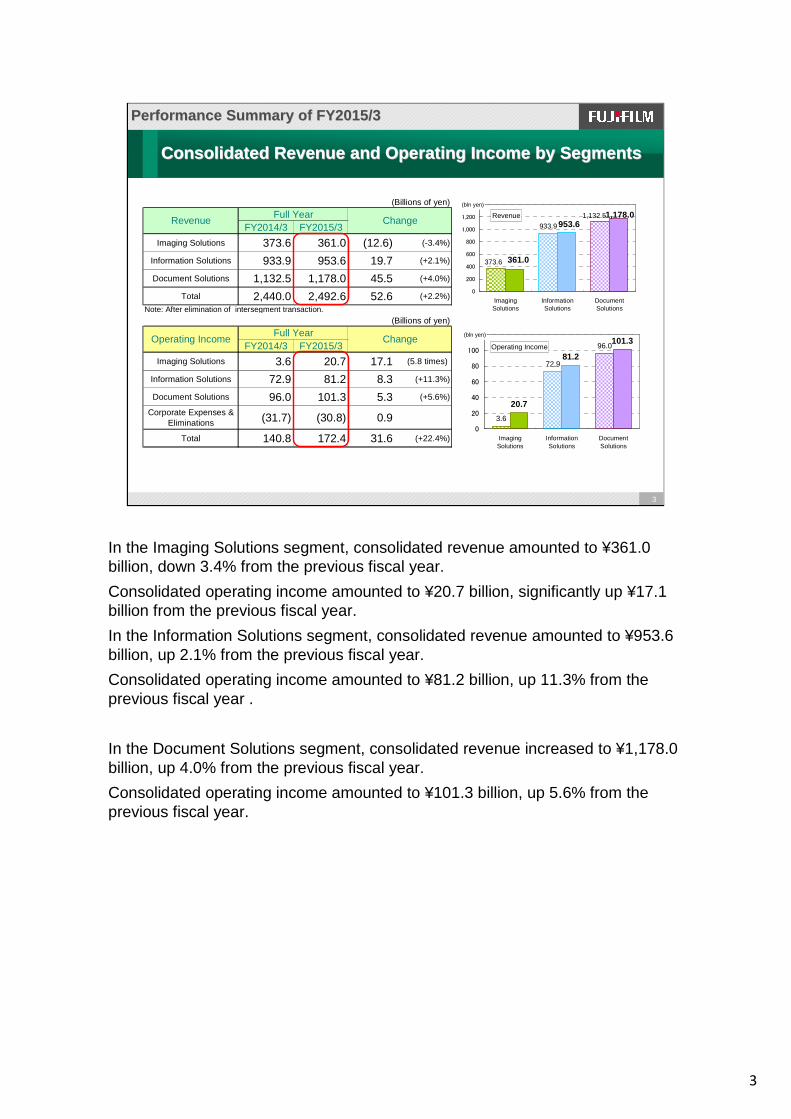
In the Imaging Solutions segment, consolidated revenue amounted to ¥361.0 billion, down 3.4% from the previous fiscal year.
Consolidated operating income amounted to ¥20.7 billion, significantly up ¥17.1 billion from the previous fiscal year.
In the Information Solutions segment, consolidated revenue amounted to ¥953.6 billion, up 2.1% from the previous fiscal year.
Consolidated operating income amounted to ¥81.2 billion, up 11.3% from the previous fiscal year .
In the Document Solutions segment, consolidated revenue increased to ¥1,178.0 billion, up 4.0% from the previous fiscal year.
Consolidated operating income amounted to ¥101.3 billion, up 5.6% from the previous fiscal year.
4
4
Summary by Operating SegmentSummary by Operating Segment
Imaging SolutionsImaging Solutions
� In the photo imaging business, overall sales increased due to the strong sales for instant cameras, smartphone printer and instant films worldwide. In addition, such high-value-added printing business as Year Album expanded and installation of photofinishing equipment proceeded.
� In the electronic imaging business, sales decreased due to reduction of compact digital camera’s lineup. The sales of premium digital cameras X Series and interchangeable lenses were strong.
� In the optical devices business, the sales of camera modules for smartphones decreased, while sales of TV lenses and other products were strong.
Though revenue decreased due to the sales decreases of Though revenue decreased due to the sales decreases of digital cameras and other products, profits increas ed digital cameras and other products, profits increas ed significantly reflecting strong sales of instant ph oto significantly reflecting strong sales of instant ph oto
systems and improvement of profitability in digital camera.systems and improvement of profitability in digital camera.
Performance Summary of FY2015/3Performance Summary of FY2015/3
(Billions of yen)
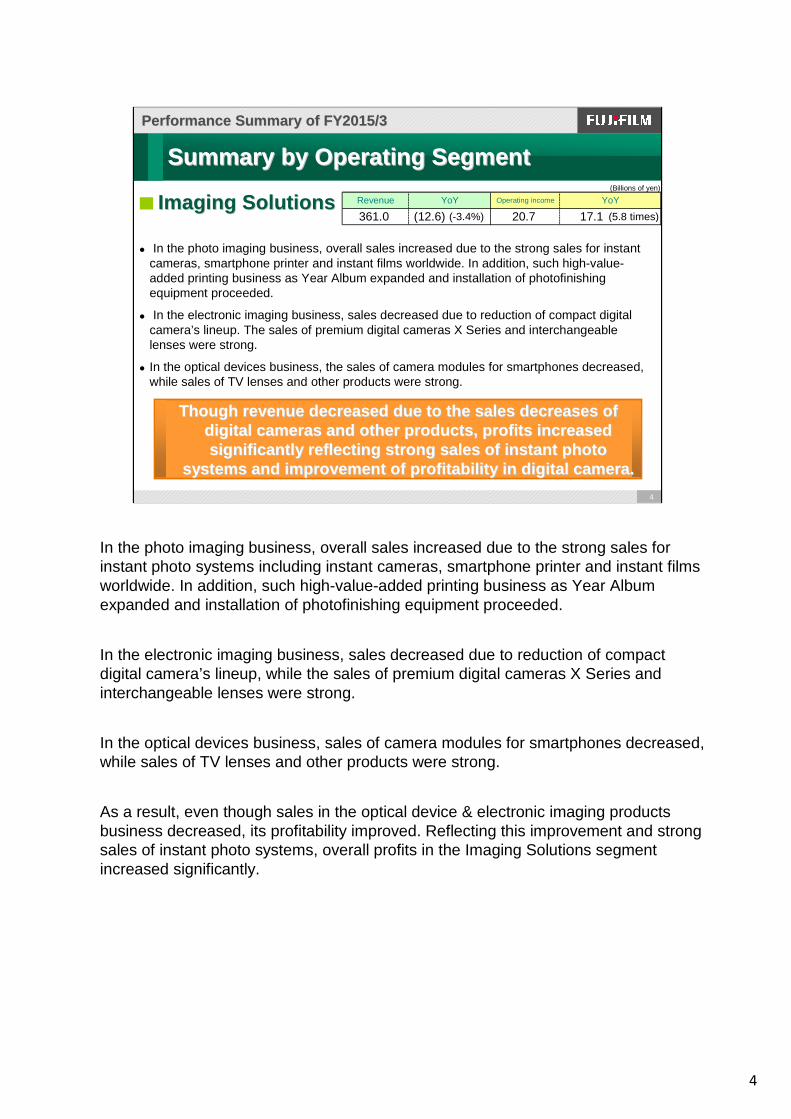
361.0 17.1 (5.8 times)20.7(12.6) (-3.4%)
Revenue YoY Operating income YoY
In the photo imaging business, overall sales increased due to the strong sales for instant photo systems including instant cameras, smartphone printer and instant films worldwide. In addition, such high-value-added printing business as Year Albumexpanded and installation of photofinishing equipment proceeded.
In the electronic imaging business, sales decreased due to reduction of compact digital camera’s lineup, while the sales of premium digital cameras X Series and interchangeable lenses were strong.
In the optical devices business, sales of camera modules for smartphones decreased, while sales of TV lenses and other products were strong.
As a result, even though sales in the optical device & electronic imaging products business decreased, its profitability improved. Reflecting this improvement and strong sales of instant photo systems, overall profits in the Imaging Solutions segment increased significantly.
5
5
Information SolutionsInformation Solutions
Performance Summary of FY2015/3Performance Summary of FY2015/3
Summary by Operating SegmentSummary by Operating Segment(Billions of yen)
Revenue YoY
953.6 19.7
Operating income YoY
(+2.1%) 81.2 8.3 (+11.3%)
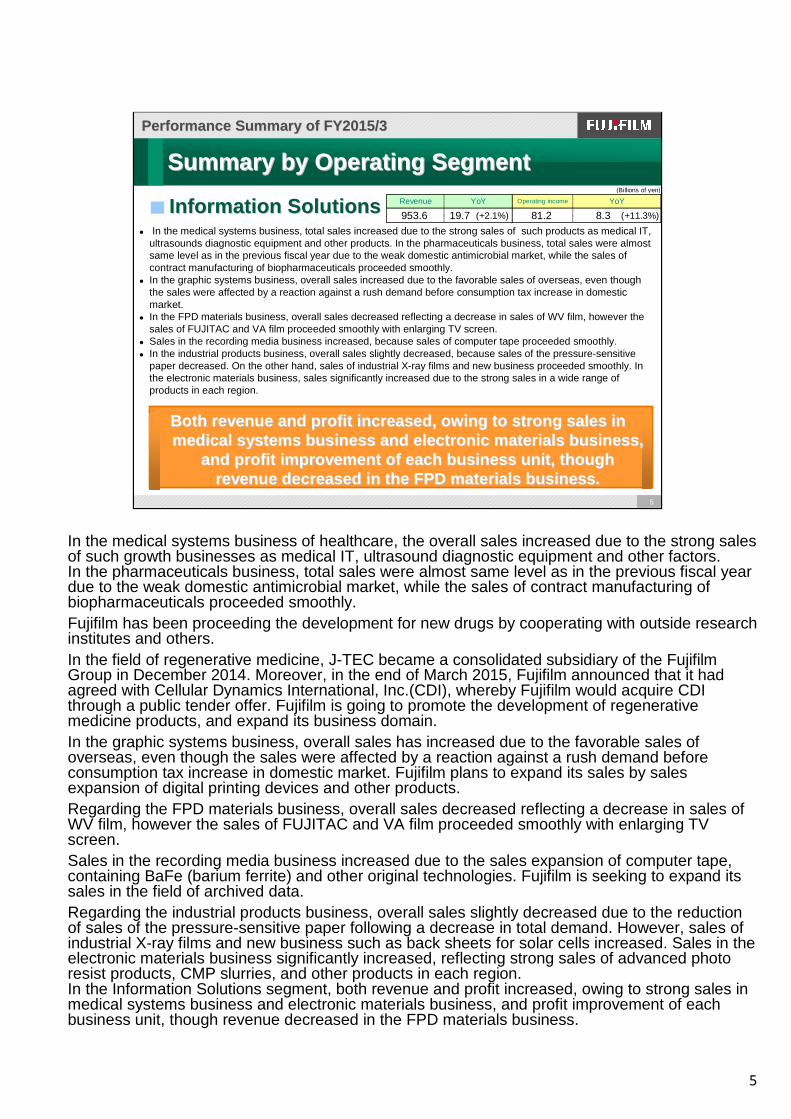
� In the medical systems business, total sales increased due to the strong sales of such products as medical IT, ultrasounds diagnostic equipment and other products. In the pharmaceuticals business, total sales were almost same level as in the previous fiscal year due to the weak domestic antimicrobial market, while the sales of contract manufacturing of biopharmaceuticals proceeded smoothly.
� In the graphic systems business, overall sales increased due to the favorable sales of overseas, even though the sales were affected by a reaction against a rush demand before consumption tax increase in domestic market.
� In the FPD materials business, overall sales decreased reflecting a decrease in sales of WV film, however the sales of FUJITAC and VA film proceeded smoothly with enlarging TV screen.
� Sales in the recording media business increased, because sales of computer tape proceeded smoothly.� In the industrial products business, overall sales slightly decreased, because sales of the pressure-sensitive
paper decreased. On the other hand, sales of industrial X-ray films and new business proceeded smoothly. In the electronic materials business, sales significantly increased due to the strong sales in a wide range of products in each region.
Both revenue and profit increased, owing to strong sales in Both revenue and profit increased, owing to strong sales in medical systems business and electronic materials b usiness, medical systems business and electronic materials b usiness,
and profit improvement of each business unit, thoug h and profit improvement of each business unit, thoug h revenue decreased in the FPD materials business.revenue decreased in the FPD materials business.
In the medical systems business of healthcare, the overall sales increased due to the strong sales of such growth businesses as medical IT, ultrasound diagnostic equipment and other factors.In the pharmaceuticals business, total sales were almost same level as in the previous fiscal year due to the weak domestic antimicrobial market, while the sales of contract manufacturing of biopharmaceuticals proceeded smoothly. Fujifilm has been proceeding the development for new drugs by cooperating with outside research institutes and others.In the field of regenerative medicine, J-TEC became a consolidated subsidiary of the Fujifilm Group in December 2014. Moreover, in the end of March 2015, Fujifilm announced that it had agreed with Cellular Dynamics International, Inc.(CDI), whereby Fujifilm would acquire CDI through a public tender offer. Fujifilm is going to promote the development of regenerative medicine products, and expand its business domain.In the graphic systems business, overall sales has increased due to the favorable sales of overseas, even though the sales were affected by a reaction against a rush demand before consumption tax increase in domestic market. Fujifilm plans to expand its sales by sales expansion of digital printing devices and other products. Regarding the FPD materials business, overall sales decreased reflecting a decrease in sales of WV film, however the sales of FUJITAC and VA film proceeded smoothly with enlarging TV screen.Sales in the recording media business increased due to the sales expansion of computer tape, containing BaFe (barium ferrite) and other original technologies. Fujifilm is seeking to expand its sales in the field of archived data.Regarding the industrial products business, overall sales slightly decreased due to the reduction of sales of the pressure-sensitive paper following a decrease in total demand. However, sales of industrial X-ray films and new business such as back sheets for solar cells increased. Sales in the electronic materials business significantly increased, reflecting strong sales of advanced photo resist products, CMP slurries, and other products in each region.In the Information Solutions segment, both revenue and profit increased, owing to strong sales in medical systems business and electronic materials business, and profit improvement of each business unit, though revenue decreased in the FPD materials business.
6
6
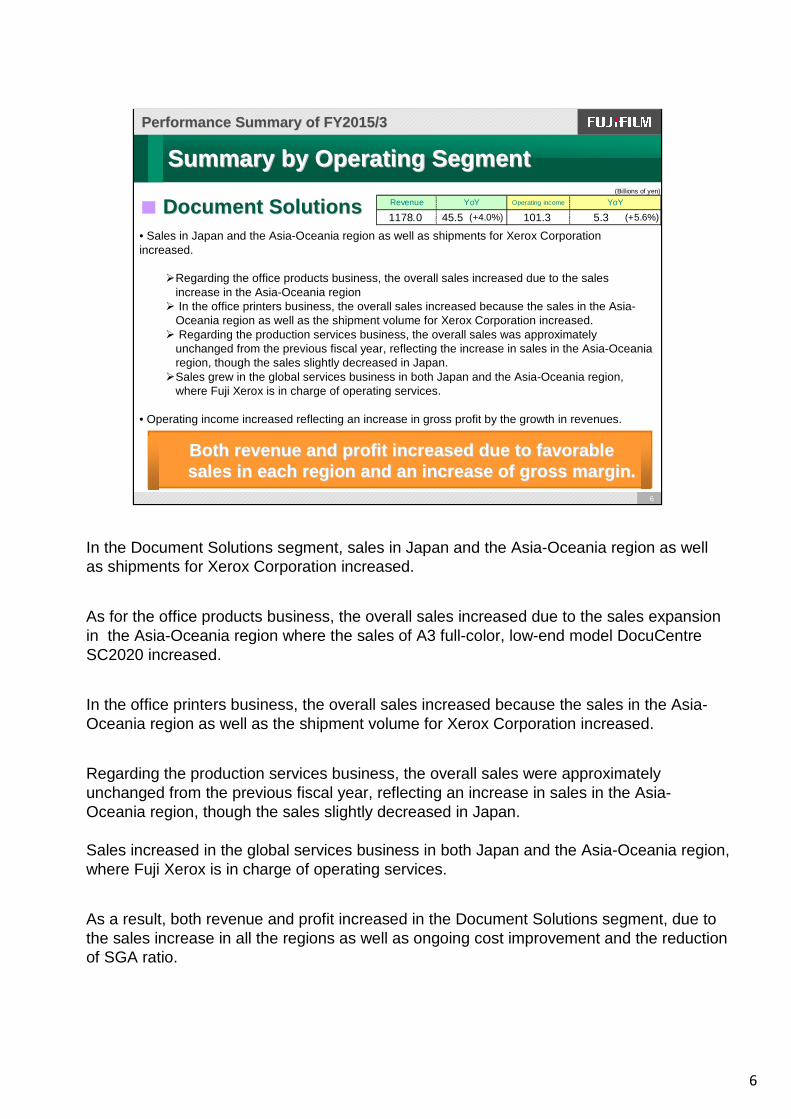
• Sales in Japan and the Asia-Oceania region as well as shipments for Xerox Corporation increased.
�Regarding the office products business, the overall sales increased due to the sales increase in the Asia-Oceania region � In the office printers business, the overall sales increased because the sales in the Asia-
Oceania region as well as the shipment volume for Xerox Corporation increased.� Regarding the production services business, the overall sales was approximately
unchanged from the previous fiscal year, reflecting the increase in sales in the Asia-Oceania region, though the sales slightly decreased in Japan. �Sales grew in the global services business in both Japan and the Asia-Oceania region,
where Fuji Xerox is in charge of operating services.
• Operating income increased reflecting an increase in gross profit by the growth in revenues.
Document SolutionsDocument Solutions
Both revenue and profit increased due to favorable Both revenue and profit increased due to favorable sales in each region and an increase of gross margi n.sales in each region and an increase of gross margi n.
Performance Summary of FY2015/3Performance Summary of FY2015/3
Summary by Operating SegmentSummary by Operating Segment(Billions of yen)
YoY Operating income YoY
5.3 (+5.6%)1178.0 45.5 (+4.0%) 101.3
Revenue
In the Document Solutions segment, sales in Japan and the Asia-Oceania region as well as shipments for Xerox Corporation increased.
As for the office products business, the overall sales increased due to the sales expansion in the Asia-Oceania region where the sales of A3 full-color, low-end model DocuCentreSC2020 increased.
In the office printers business, the overall sales increased because the sales in the Asia-Oceania region as well as the shipment volume for Xerox Corporation increased.
Regarding the production services business, the overall sales were approximately unchanged from the previous fiscal year, reflecting an increase in sales in the Asia-Oceania region, though the sales slightly decreased in Japan.
Sales increased in the global services business in both Japan and the Asia-Oceania region, where Fuji Xerox is in charge of operating services.
As a result, both revenue and profit increased in the Document Solutions segment, due to the sales increase in all the regions as well as ongoing cost improvement and the reduction of SGA ratio.
7
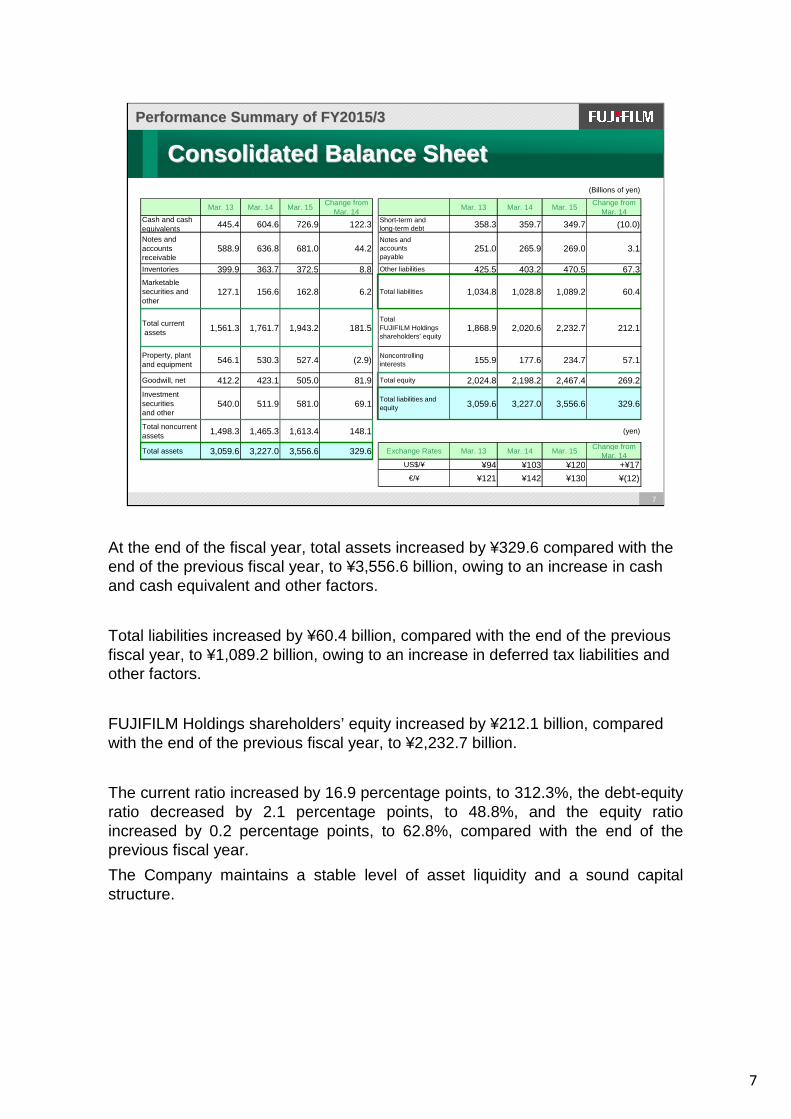
At the end of the fiscal year, total assets increased by ¥329.6 compared with the end of the previous fiscal year, to ¥3,556.6 billion, owing to an increase in cash and cash equivalent and other factors.
Total liabilities increased by ¥60.4 billion, compared with the end of the previous fiscal year, to ¥1,089.2 billion, owing to an increase in deferred tax liabilities and other factors.
FUJIFILM Holdings shareholders’ equity increased by ¥212.1 billion, compared with the end of the previous fiscal year, to ¥2,232.7 billion.
The current ratio increased by 16.9 percentage points, to 312.3%, the debt-equity ratio decreased by 2.1 percentage points, to 48.8%, and the equity ratio increased by 0.2 percentage points, to 62.8%, compared with the end of the previous fiscal year.
The Company maintains a stable level of asset liquidity and a sound capital structure.
7
Consolidated Balance SheetConsolidated Balance Sheet
Performance Summary of FY2015/3Performance Summary of FY2015/3
(Billions of yen)
Mar. 13 Mar. 14 Mar. 15Change from
Mar. 14Mar. 13 Mar. 14 Mar. 15
Change fromMar. 14
Cash and cashequivalents 445.4 604.6 726.9 122.3
Short-term andlong-term debt 358.3 359.7 349.7 (10.0)
Notes andaccountsreceivable
588.9 636.8 681.0 44.2Notes andaccountspayable
251.0 265.9 269.0 3.1
Inventories 399.9 363.7 372.5 8.8 Other liabilities 425.5 403.2 470.5 67.3Marketablesecurities andother
127.1 156.6 162.8 6.2 Total liabilities 1,034.8 1,028.8 1,089.2 60.4
Total current assets 1,561.3 1,761.7 1,943.2 181.5
TotalFUJIFILM Holdingsshareholders' equity
1,868.9 2,020.6 2,232.7 212.1
Property, plantand equipment 546.1 530.3 527.4 (2.9)
Noncontrollinginterests 155.9 177.6 234.7 57.1
Goodwill, net 412.2 423.1 505.0 81.9 Total equity 2,024.8 2,198.2 2,467.4 269.2
Investmentsecuritiesand other
540.0 511.9 581.0 69.1Total liabilities andequity 3,059.6 3,227.0 3,556.6 329.6
Total noncurrentassets 1,498.3 1,465.3 1,613.4 148.1 (yen)
Total assets 3,059.6 3,227.0 3,556.6 329.6 Exchange Rates Mar. 13 Mar. 14 Mar. 15Change from
Mar. 14US$/¥ ¥94 ¥103 ¥120 +¥17
€/¥ ¥121 ¥142 ¥130 ¥(12)
8
8
Cash FlowsCash Flows
Performance Summary of FY2015/3Performance Summary of FY2015/3
199.4
292.5263.7
(140.9)(125.5) (120.5)
58.5
167.0143.2
FY2013/3 FY2014/3 FY2015/3
C/F from operating activitiesC/F from investing activitiesFree cash flows
Cash Flows(Billions of yen)
(Billions of yen)FY2013/3 FY2014/3 FY2015/3
Net income 71.2 102.1 137.1Depreciation & amortization 141.5 141.4 122.9
Change in notes and accountsreceivable
9.0 (24.3) (11.4)
Change in inventories 11.8 58.0 8.9Change in notes and accounts
payable-trade(24.1) 7.2 (14.3)
Change in accrued income taxesand other liabilities
(31.9) (2.9) 11.1
Others 21.9 11.0 9.4C/F from operating activities 199.4 292.5 263.7
Capital expenditure (89.9) (70.3) (56.9)Purchases of software (20.2) (24.6) (26.6)
Sales and purchases of marketableand investment securities
13.3 (5.6) 1.2
Others (44.1) (25.0) (38.2)C/F from investing activities (140.9) (125.5) (120.5)Free cash flows 58.5 167.0 143.2C/F from operating activities +Capital expenditure
109.5 222.2 206.8
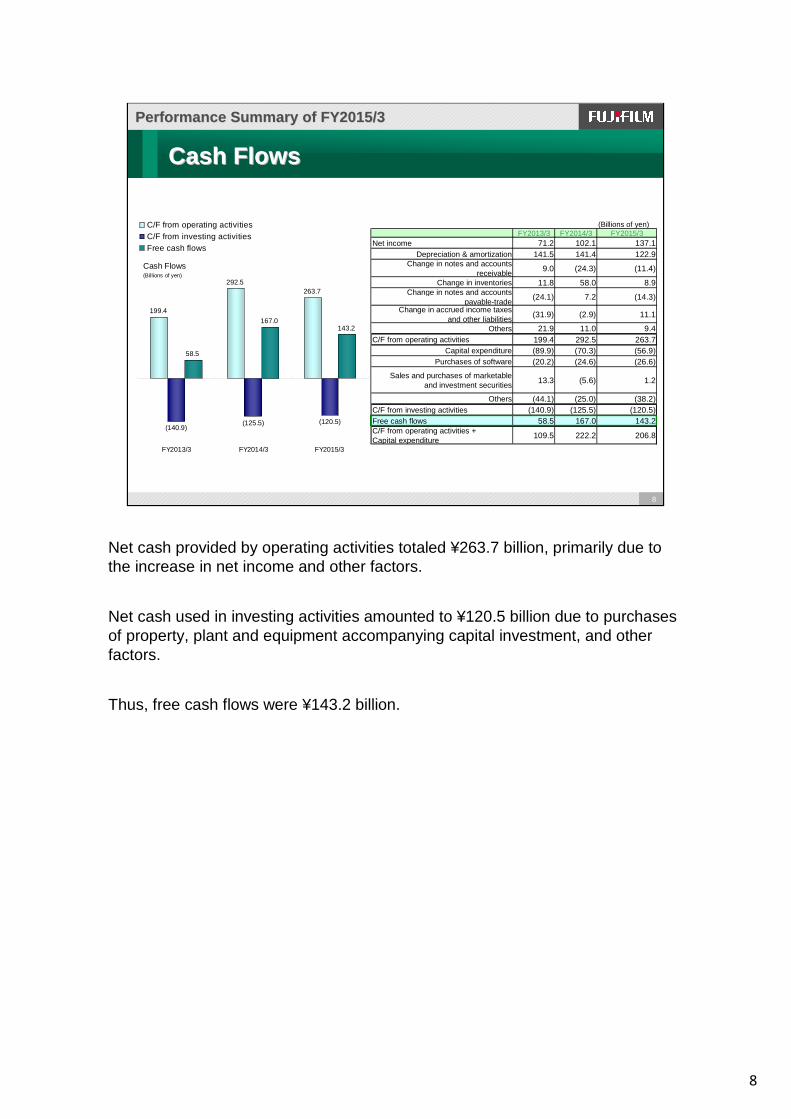
Net cash provided by operating activities totaled ¥263.7 billion, primarily due to the increase in net income and other factors.
Net cash used in investing activities amounted to ¥120.5 billion due to purchases of property, plant and equipment accompanying capital investment, and other factors.
Thus, free cash flows were ¥143.2 billion.
9
9
Earnings of FY2015/3
Forecast for FY2016/3
FORWARD-LOOKING STATEMENTSForward-looking statements, such as those relating to earnings forecasts and other projections contained in this material, are management’s current assumptions and beliefs based on currently available information. Such forward-looking statements are subject to a number of risks, uncertainties, and other factors. Accordingly, actual results may differ materially from those projected due to various factors.
Apr. 30, 2015
10
10
Note: Impact of exchange rate movements on operating inco me (FY2016/3 full year, ¥1 change) US$/¥: ¥0.8 billion €/¥: ¥0.8 billion
Consolidated Financial Forecast for FY2016/3 Consolidated Financial Forecast for FY2016/3 (as of Apr. 30, 2015)(as of Apr. 30, 2015)
Forecast for FY2016/3Forecast for FY2016/3
(Billions of yen)
FY2015/3FY2016/3(forecast)
Change fromprevious year
FY2017/3(VISION2016)
2,492.6 2,580.0 87.4 2,630.0100.0% 100.0% +3.5% 100.0%
172.4 190.0 17.6 220.06.9% 7.4% +10.2% 8.4%
Income before 197.1 190.0 (7.1) ―
Income Taxes 7.9% 7.4% -3.6%Net Income
Attributable to 118.6 120.0 1.4 120.0FUJIFILM Holdings 4.8% 4.7% +1.2% 4.6%
Net IncomeAttributable to
FUJIFILM Holdingsper Share
¥245.94 ¥248.85 ¥2.91 ―
ROE 5.6%Around middle of
5 and 6% ― 7.0%Exchange Rates
US$/¥ ¥110 ¥120 +¥10 ¥100
€/¥ ¥139 ¥130 ¥(9) ¥135Silver Price (/kg) ¥64,000 ¥65,000 +¥1,000 ¥76,000
Revenue
Operating Income
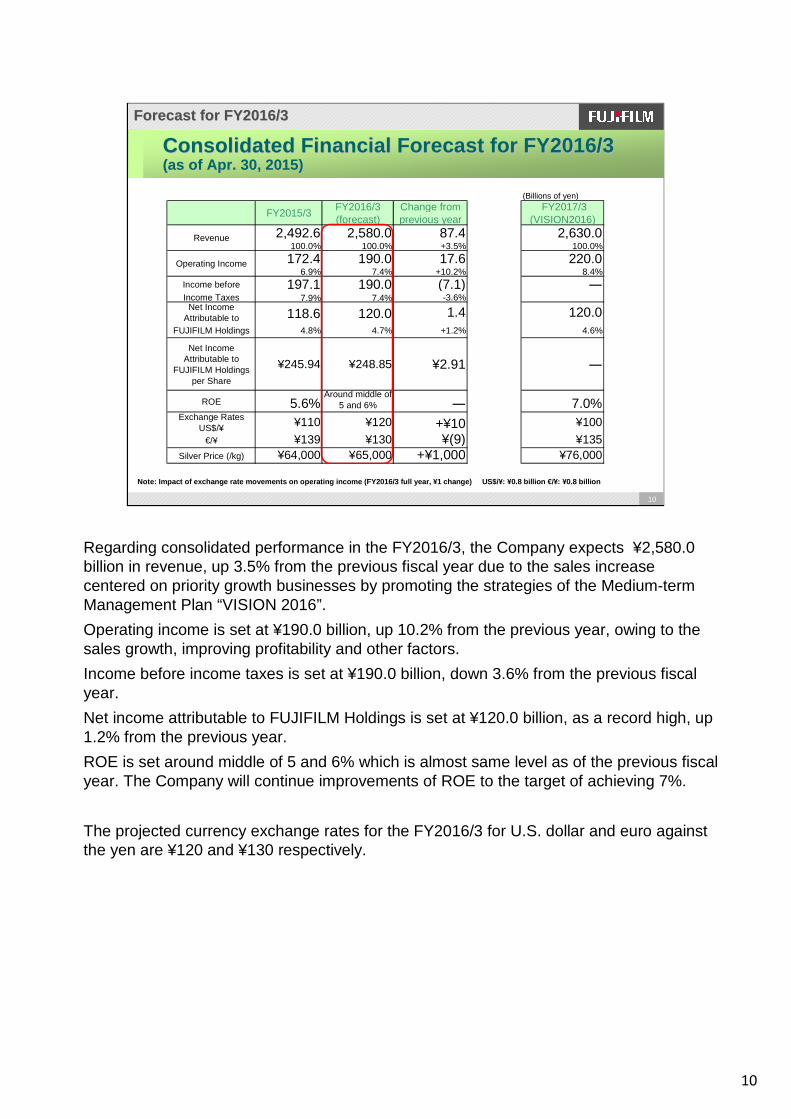
Regarding consolidated performance in the FY2016/3, the Company expects ¥2,580.0 billion in revenue, up 3.5% from the previous fiscal year due to the sales increase centered on priority growth businesses by promoting the strategies of the Medium-term Management Plan “VISION 2016”.
Operating income is set at ¥190.0 billion, up 10.2% from the previous year, owing to the sales growth, improving profitability and other factors.
Income before income taxes is set at ¥190.0 billion, down 3.6% from the previous fiscal year.
Net income attributable to FUJIFILM Holdings is set at ¥120.0 billion, as a record high, up 1.2% from the previous year.
ROE is set around middle of 5 and 6% which is almost same level as of the previous fiscal year. The Company will continue improvements of ROE to the target of achieving 7%.
The projected currency exchange rates for the FY2016/3 for U.S. dollar and euro against the yen are ¥120 and ¥130 respectively.
11
11
Forecast for FY2016/3Forecast for FY2016/3
Consolidated Financial Forecast for FY2016/3 by Seg ments Consolidated Financial Forecast for FY2016/3 by Seg ments (as of Apr. 30, 2015)(as of Apr. 30, 2015)
(Billions of yen)
Revenue FY2015/3FY2016/3(forecast)
Change fromprevious year
FY2017/3(VISION2016)
ImagingSolutions 361.0 355.0 (6.0) 360.0
InformationSolutions 953.6 1,005.0 51.4 1,030.0DocumentSolutions 1,178.0 1,220.0 42.0 1,240.0
Total 2,492.6 2,580.0 87.4 2,630.0 Note: After elimination ofintersegment transaction.
(Billions of yen)
OperatingIncome
FY2015/3FY2016/3(forecast)
Change fromprevious year
FY2017/3(VISION2016)
ImagingSolutions 20.7 23.0 2.3 25.0
InformationSolutions 81.2 95.0 13.8 105.0DocumentSolutions 101.3 105.0 3.7 125.0Corporate
Expenses &Eliminations
(30.8) (33.0) (2.2) (35.0)
Total 172.4 190.0 17.6 220.0
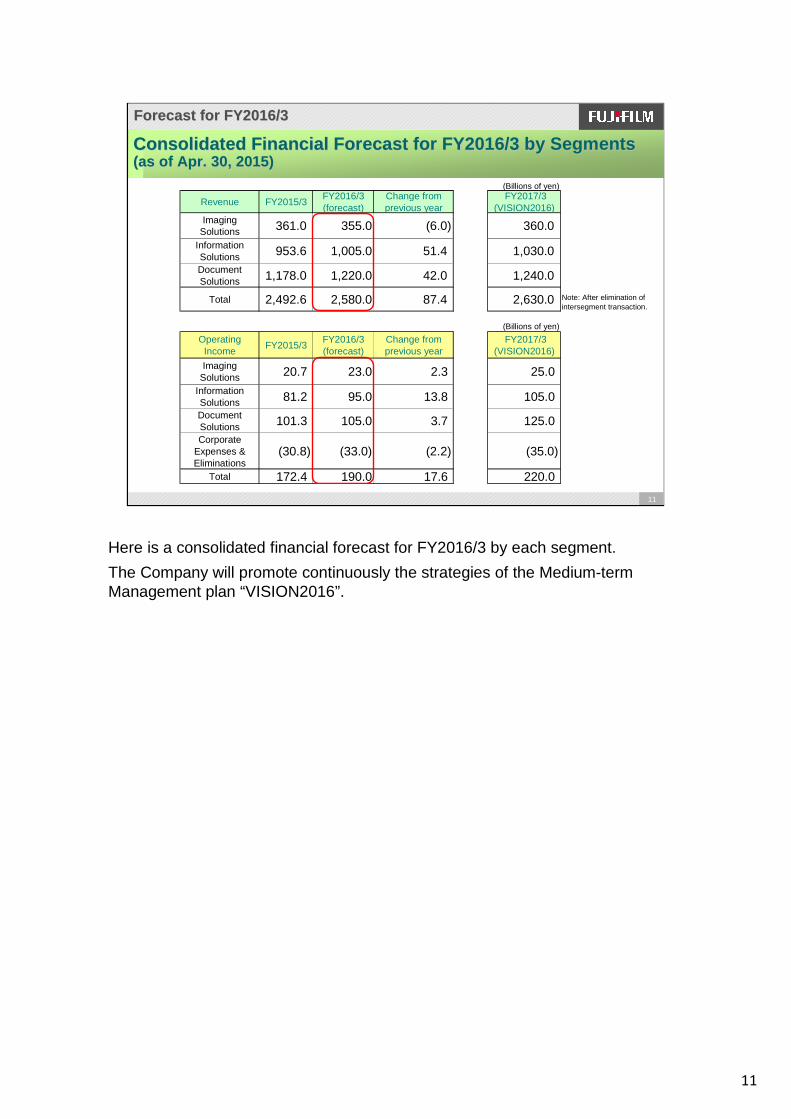
Here is a consolidated financial forecast for FY2016/3 by each segment.
The Company will promote continuously the strategies of the Medium-term Management plan “VISION2016”.
12
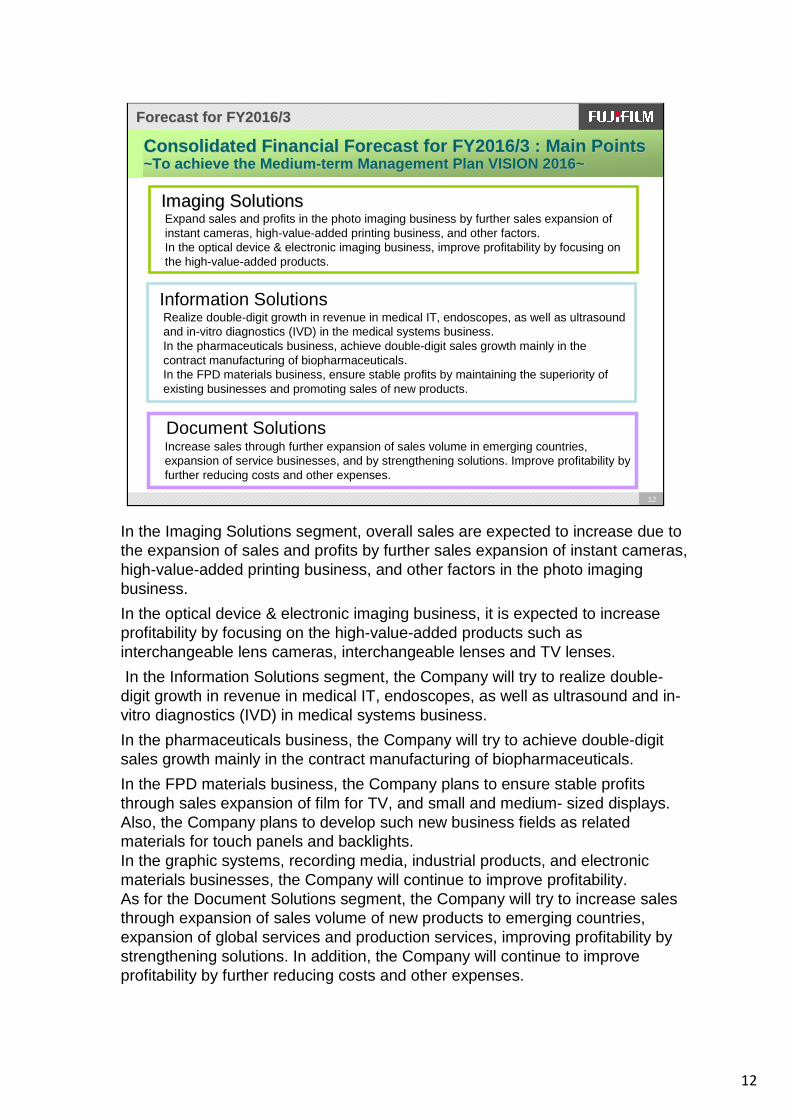
In the Imaging Solutions segment, overall sales are expected to increase due to the expansion of sales and profits by further sales expansion of instant cameras, high-value-added printing business, and other factors in the photo imaging business.
In the optical device & electronic imaging business, it is expected to increase profitability by focusing on the high-value-added products such as interchangeable lens cameras, interchangeable lenses and TV lenses.
In the Information Solutions segment, the Company will try to realize double-digit growth in revenue in medical IT, endoscopes, as well as ultrasound and in-vitro diagnostics (IVD) in medical systems business.
In the pharmaceuticals business, the Company will try to achieve double-digit sales growth mainly in the contract manufacturing of biopharmaceuticals.
In the FPD materials business, the Company plans to ensure stable profits through sales expansion of film for TV, and small and medium- sized displays. Also, the Company plans to develop such new business fields as related materials for touch panels and backlights.In the graphic systems, recording media, industrial products, and electronic materials businesses, the Company will continue to improve profitability.As for the Document Solutions segment, the Company will try to increase sales through expansion of sales volume of new products to emerging countries, expansion of global services and production services, improving profitability by strengthening solutions. In addition, the Company will continue to improve profitability by further reducing costs and other expenses.
12
Forecast for FY2016/3Forecast for FY2016/3
Consolidated Financial Forecast for FY2016/3 : Main PointsConsolidated Financial Forecast for FY2016/3 : Main Points~To achieve the Medium~To achieve the Medium --term Management Plan VISION 2016~term Management Plan VISION 2016~
Imaging SolutionsImaging Solutions
Information Solutions
Document Solutions
Realize double-digit growth in revenue in medical IT, endoscopes, as well as ultrasound and in-vitro diagnostics (IVD) in the medical systems business.In the pharmaceuticals business, achieve double-digit sales growth mainly in the contract manufacturing of biopharmaceuticals.In the FPD materials business, ensure stable profits by maintaining the superiority of existing businesses and promoting sales of new products.
Expand sales and profits in the photo imaging business by further sales expansion of instant cameras, high-value-added printing business, and other factors.In the optical device & electronic imaging business, improve profitability by focusing on the high-value-added products.
Increase sales through further expansion of sales volume in emerging countries, expansion of service businesses, and by strengthening solutions. Improve profitability by further reducing costs and other expenses.
13
13
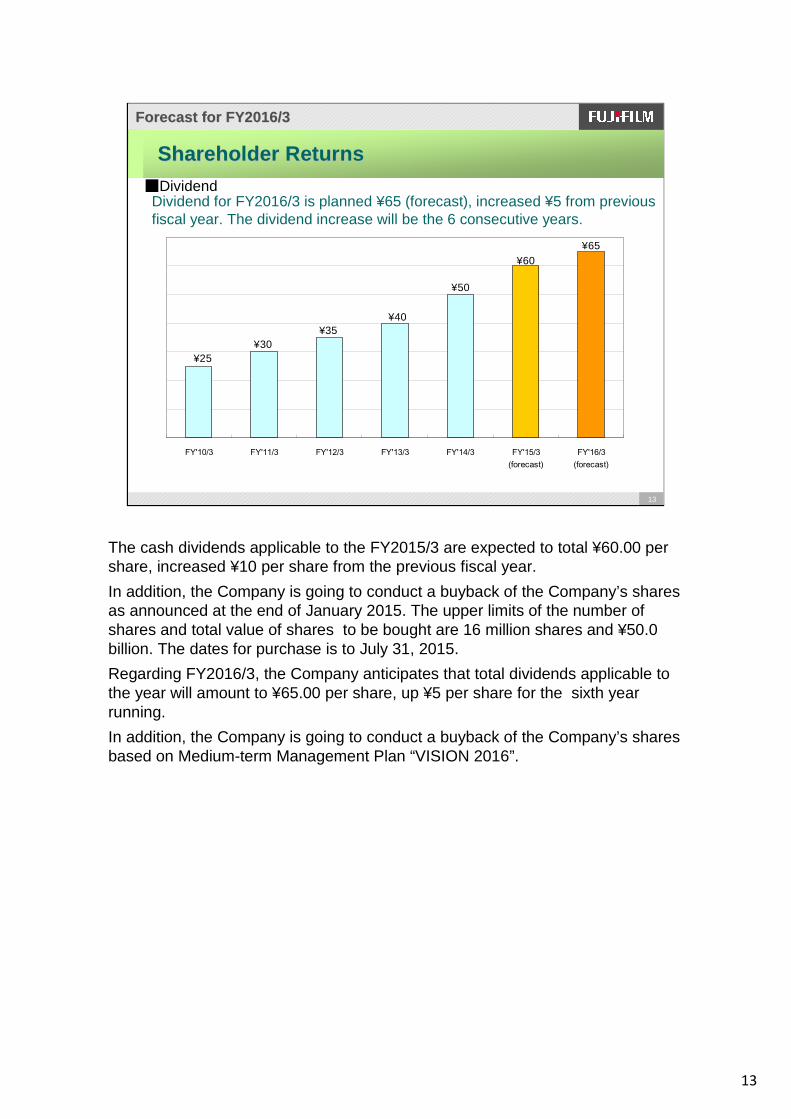
■DividendDividend for FY2016/3 is planned ¥65 (forecast), increased ¥5 from previous fiscal year. The dividend increase will be the 6 consecutive years.
Shareholder ReturnsShareholder Returns
Forecast for FY2016/3Forecast for FY2016/3
¥65¥60
¥50
¥40¥35
¥30¥25
FY'10/3 FY'11/3 FY'12/3 FY'13/3 FY'14/3 FY'15/3
(forecast)
FY'16/3
(forecast)
The cash dividends applicable to the FY2015/3 are expected to total ¥60.00 per share, increased ¥10 per share from the previous fiscal year.
In addition, the Company is going to conduct a buyback of the Company’s shares as announced at the end of January 2015. The upper limits of the number of shares and total value of shares to be bought are 16 million shares and ¥50.0 billion. The dates for purchase is to July 31, 2015.
Regarding FY2016/3, the Company anticipates that total dividends applicable to the year will amount to ¥65.00 per share, up ¥5 per share for the sixth year running.
In addition, the Company is going to conduct a buyback of the Company’s shares based on Medium-term Management Plan “VISION 2016”.
14
Corporate Communication Office, Corporate Planning Div.
http://www.fujifilmholdings.com/en/index.html
At Fujifilm, we are continuously innovating — creatingnew technologies, products and services that inspire
and excite people everywhere.Our goal is to empower the potential and expand
the horizons of tomorrow’s businesses and lifestyles.

15
15
Earnings for FY2015/3
AppendixAppendix
16
16
Earnings for FY2015/3 4Q/Full yearEarnings for FY2015/3 4Q/Full year
FY2015/3 AppendixFY2015/3 Appendix
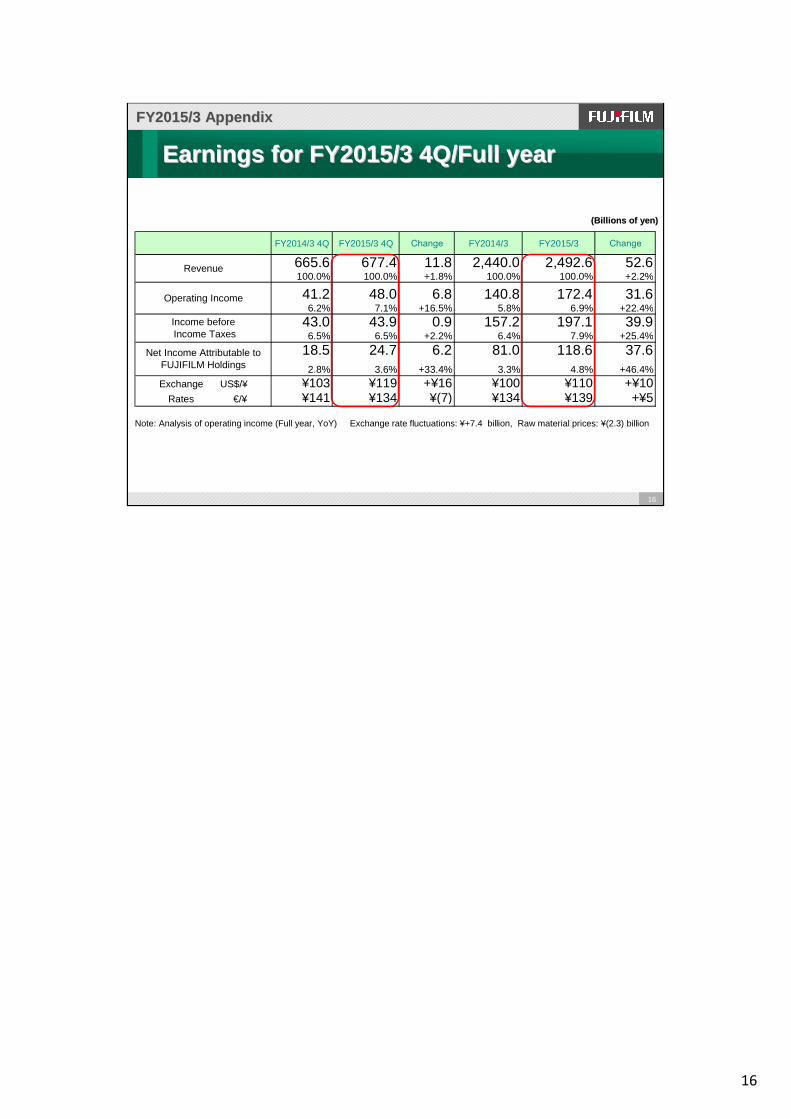
Note: Analysis of operating income (Full year, YoY) Exchange rate fluctuations: ¥+7.4 billion, Raw material prices: ¥(2.3) billion
(Billions of yen)(Billions of yen)
FY2014/3 4Q FY2015/3 4Q Change FY2014/3 FY2015/3 Change
665.6 677.4 11.8 2,440.0 2,492.6 52.6100.0% 100.0% +1.8% 100.0% 100.0% +2.2%
41.2 48.0 6.8 140.8 172.4 31.66.2% 7.1% +16.5% 5.8% 6.9% +22.4%
43.0 43.9 0.9 157.2 197.1 39.96.5% 6.5% +2.2% 6.4% 7.9% +25.4%
18.5 24.7 6.2 81.0 118.6 37.62.8% 3.6% +33.4% 3.3% 4.8% +46.4%
Exchange US$/¥ ¥103 ¥119 +¥16 ¥100 ¥110 +¥10 Rates €/¥ ¥141 ¥134 ¥(7) ¥134 ¥139 +¥5
Revenue
Operating Income
Income before Income Taxes
Net Income Attributable toFUJIFILM Holdings
17
17
FY2015/3 AppendixFY2015/3 Appendix
Earnings for FY2015/3 4Q/Full yearEarnings for FY2015/3 4Q/Full year(Billions of yen)
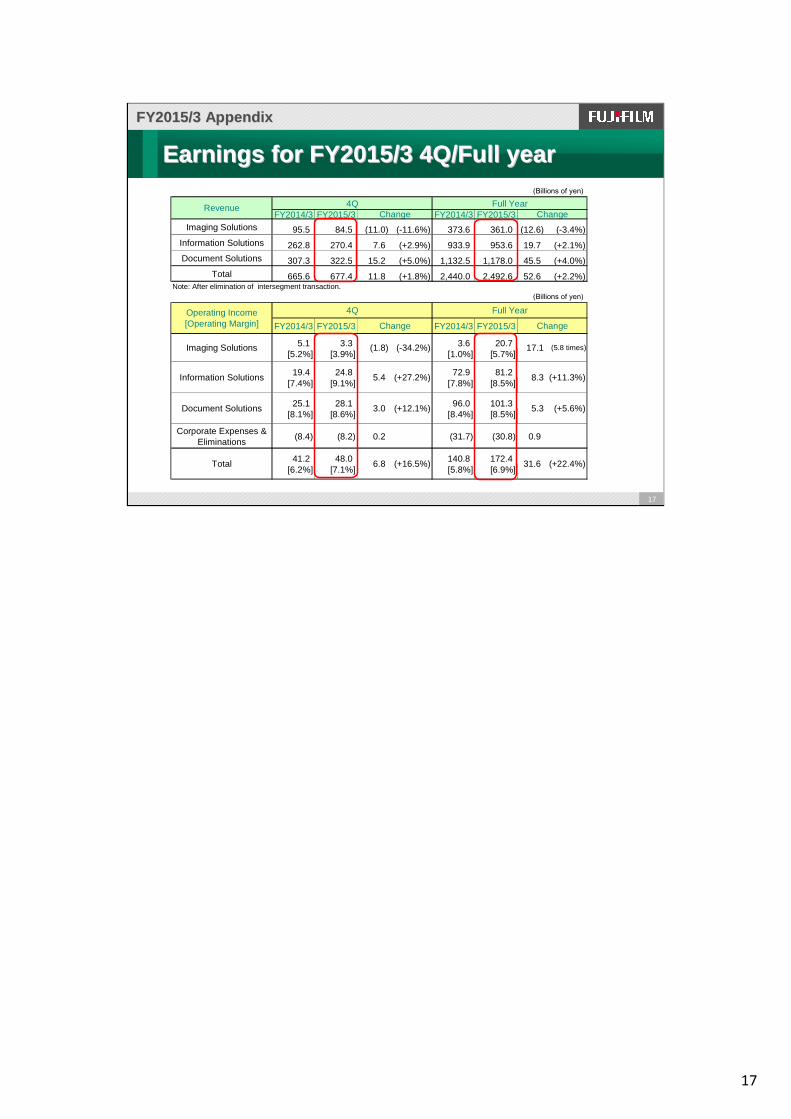
FY2014/3 FY2015/3 FY2014/3 FY2015/3Imaging Solutions 95.5 84.5 (11.0) (-11.6%) 373.6 361.0 (12.6) (-3.4%)
Information Solutions 262.8 270.4 7.6 (+2.9%) 933.9 953.6 19.7 (+2.1%)
Document Solutions 307.3 322.5 15.2 (+5.0%) 1,132.5 1,178.0 45.5 (+4.0%)
Total 665.6 677.4 11.8 (+1.8%) 2,440.0 2,492.6 52.6 (+2.2%)
(Billions of yen)
FY2014/3 FY2015/3 FY2014/3 FY2015/3
5.1 3.3 3.6 20.7[5.2%] [3.9%] [1.0%] [5.7%]
19.4 24.8 72.9 81.2[7.4%] [9.1%] [7.8%] [8.5%]
25.1 28.1 96.0 101.3[8.1%] [8.6%] [8.4%] [8.5%]
Corporate Expenses &Eliminations
(8.4) (8.2) 0.2 (31.7) (30.8) 0.9
41.2 48.0 140.8 172.4[6.2%] [7.1%] [5.8%] [6.9%]
Revenue 4Q Full YearChange Change
Note: After elimination of intersegment transaction.
Operating Income[Operating Margin]
4Q Full Year
Change Change
Imaging Solutions
Information Solutions
Document Solutions
Total
(5.8 times)(1.8) (-34.2%)
5.4 (+27.2%)
17.1
8.3
3.0 (+12.1%)
6.8 (+16.5%)
5.3
31.6
(+11.3%)
(+5.6%)
(+22.4%)
18
18
FY2015/3 4Q (3 Months) Performance by Operating Seg mentFY2015/3 4Q (3 Months) Performance by Operating Seg ment
FY2015/3 AppendixFY2015/3 Appendix
Imaging SolutionsImaging Solutions
Information SolutionsInformation Solutions
Document SolutionsDocument Solutions
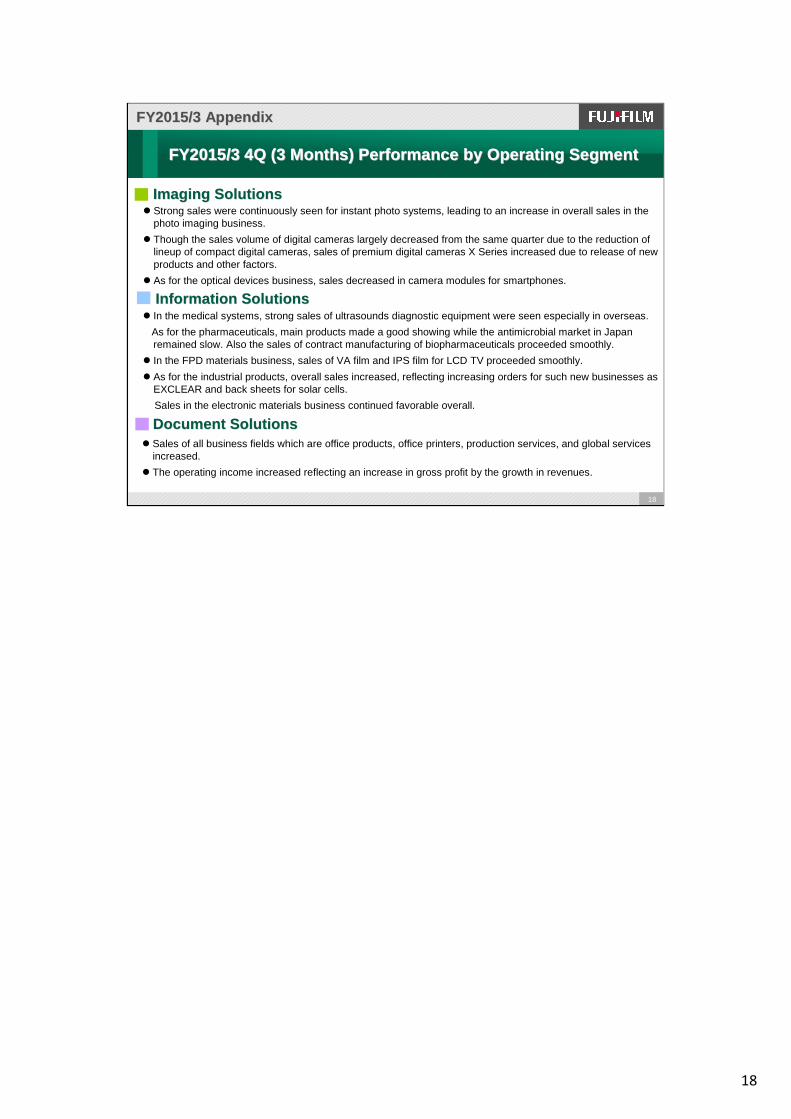
� Strong sales were continuously seen for instant photo systems, leading to an increase in overall sales in the photo imaging business.
� Though the sales volume of digital cameras largely decreased from the same quarter due to the reduction of lineup of compact digital cameras, sales of premium digital cameras X Series increased due to release of new products and other factors.
� As for the optical devices business, sales decreased in camera modules for smartphones.
� In the medical systems, strong sales of ultrasounds diagnostic equipment were seen especially in overseas.
As for the pharmaceuticals, main products made a good showing while the antimicrobial market in Japan remained slow. Also the sales of contract manufacturing of biopharmaceuticals proceeded smoothly.
� In the FPD materials business, sales of VA film and IPS film for LCD TV proceeded smoothly.
� As for the industrial products, overall sales increased, reflecting increasing orders for such new businesses as EXCLEAR and back sheets for solar cells.
Sales in the electronic materials business continued favorable overall.
� Sales of all business fields which are office products, office printers, production services, and global services increased.
� The operating income increased reflecting an increase in gross profit by the growth in revenues.
19
19
Imaging SolutionsImaging Solutions
FY2015/3 AppendixFY2015/3 Appendix
Earnings for FY2015/3 4Q/Full yearEarnings for FY2015/3 4Q/Full year
(Billions of yen)
4Q Full Year
FY2014/3 FY2015/3 Change FY2014/3 FY2015/3 Change
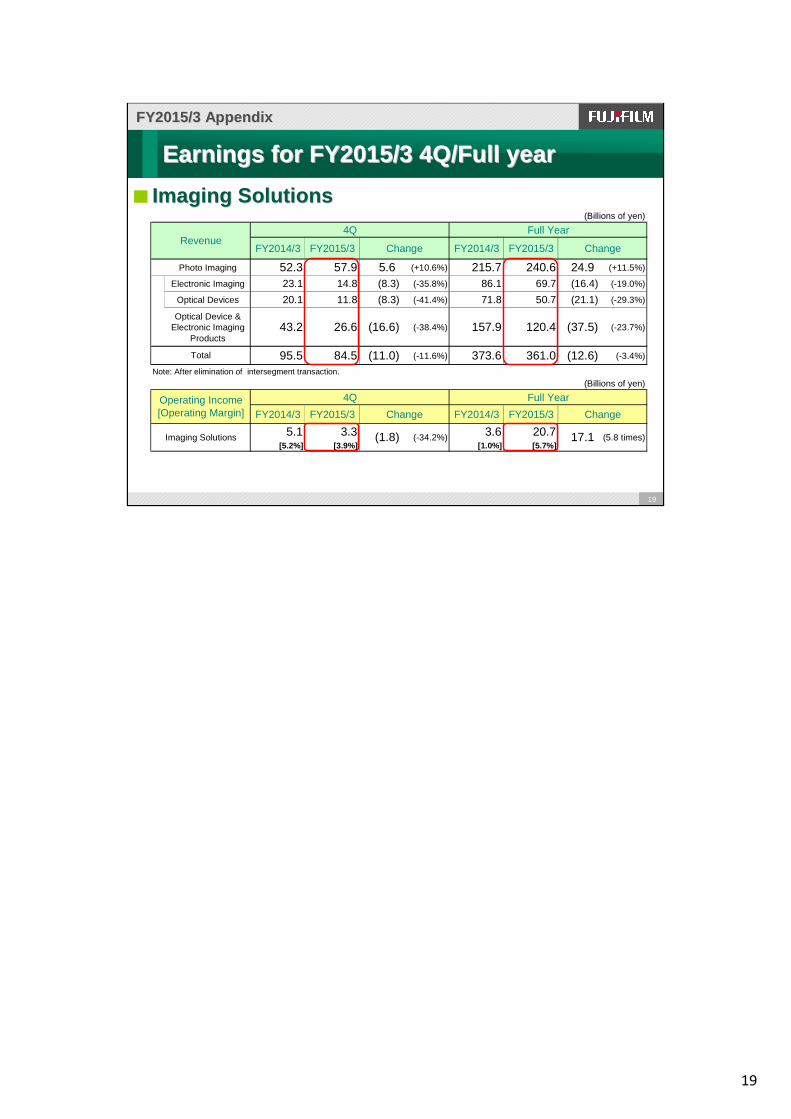
Photo Imaging 52.3 57.9 5.6 (+10.6%) 215.7 240.6 24.9 (+11.5%)
Electronic Imaging 23.1 14.8 (8.3) (-35.8%) 86.1 69.7 (16.4) (-19.0%)
Optical Devices 20.1 11.8 (8.3) (-41.4%) 71.8 50.7 (21.1) (-29.3%)
Optical Device &Electronic Imaging
Products43.2 26.6 (16.6) (-38.4%) 157.9 120.4 (37.5) (-23.7%)
95.5 84.5 (11.0) (-11.6%) 373.6 361.0 (12.6) (-3.4%)
Note: After elimination of intersegment transaction.
(Billions of yen)
4Q Full Year
FY2014/3 FY2015/3 Change FY2014/3 FY2015/3 Change
5.1 3.3 3.6 20.7[5.2%] [3.9%] [1.0%] [5.7%]
17.1(-34.2%) (5.8 times)(1.8)
Operating Income[Operating Margin]
Revenue
Imaging Solutions
Total
20
20
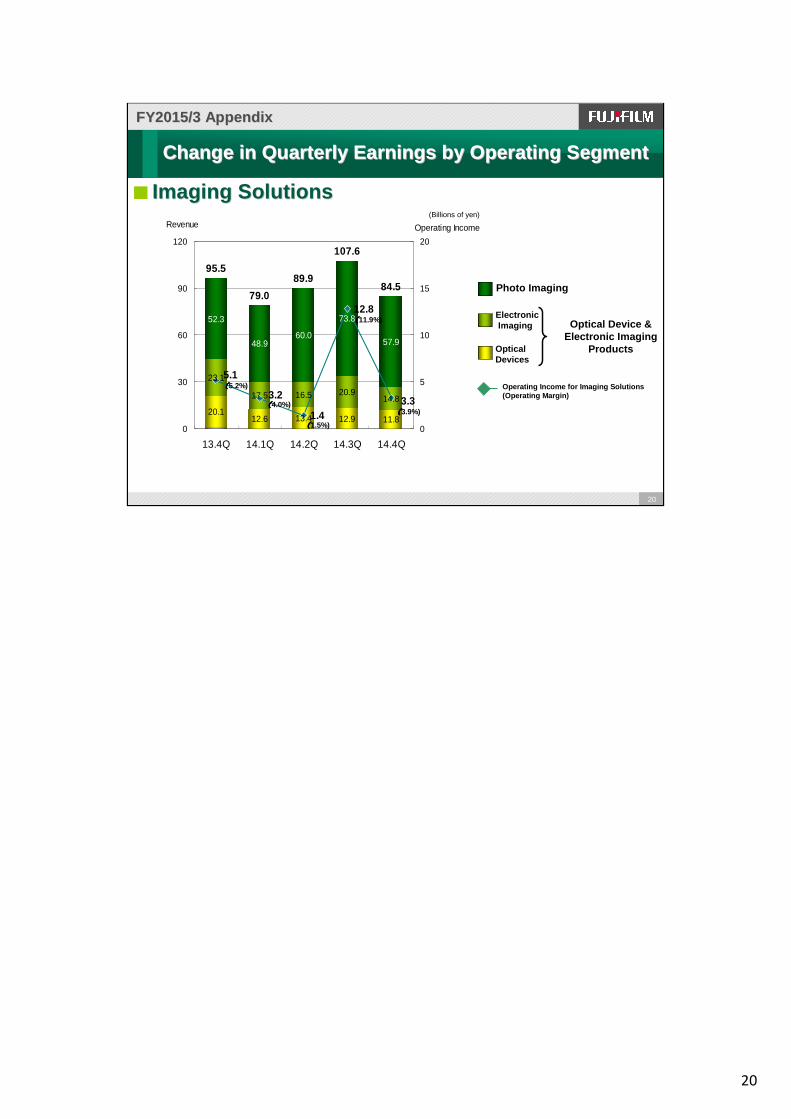
20.112.6 13.4 12.9 11.8
23.1
17.5 16.5 20.914.8
52.3
48.960.0
73.8
57.9
95.5
79.0
89.9
107.6
84.5
3.3
5.1
3.2
1.4
12.8
0
30
60
90
120
13.4Q 14.1Q 14.2Q 14.3Q 14.4Q
Revenue
0
5
10
15
20
Operating Income
Change in Quarterly Earnings by Operating Segment Change in Quarterly Earnings by Operating Segment
Imaging SolutionsImaging Solutions(Billions of yen)
Photo Imaging
ElectronicImaging
Operating Income for Imaging Solutions(Operating Margin)
Optical Devices
Optical Device & Electronic Imaging
Products
FY2015/3 AppendixFY2015/3 Appendix
((((5.2%)
((((4.0%)
((((1.5%)
((((11.9%)
((((3.9%)
21
21
Information SolutionsInformation Solutions
FY2015/3 AppendixFY2015/3 Appendix
Earnings for FY2015/3 4Q/Full yearEarnings for FY2015/3 4Q/Full year
(Billions of yen)
4Q Full Year
FY2014/3 FY2015/3 Change FY2014/3 FY2015/3 Change
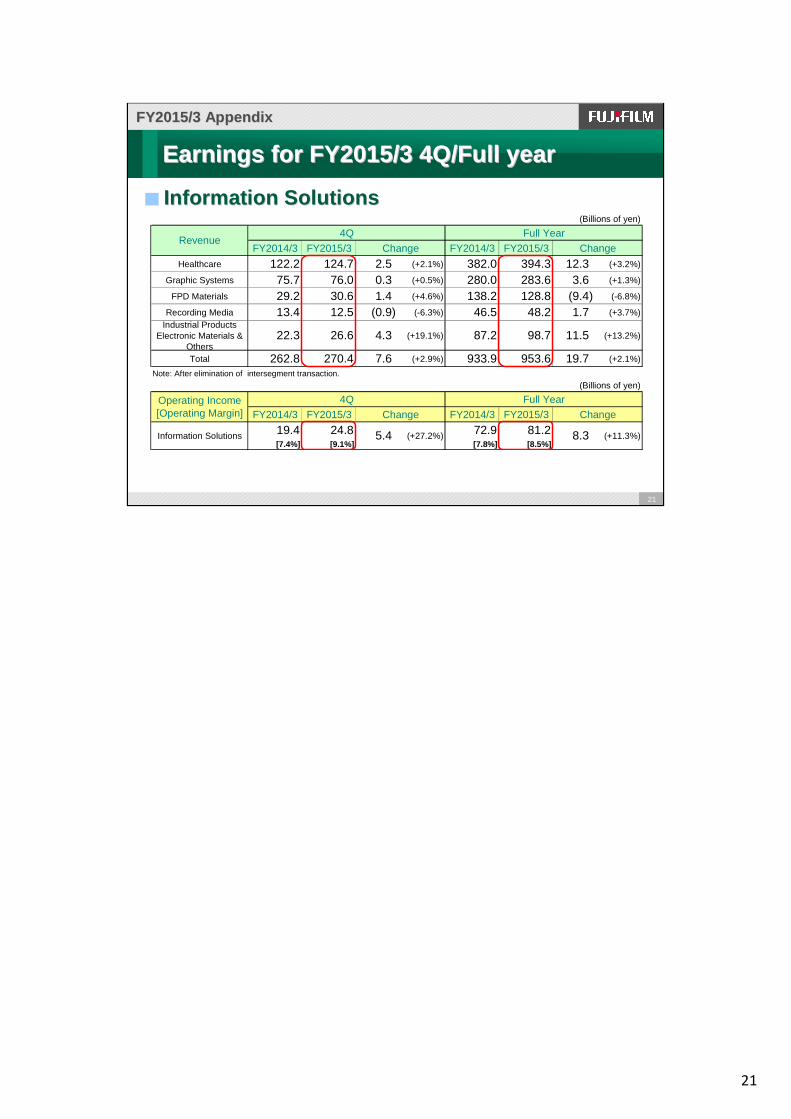
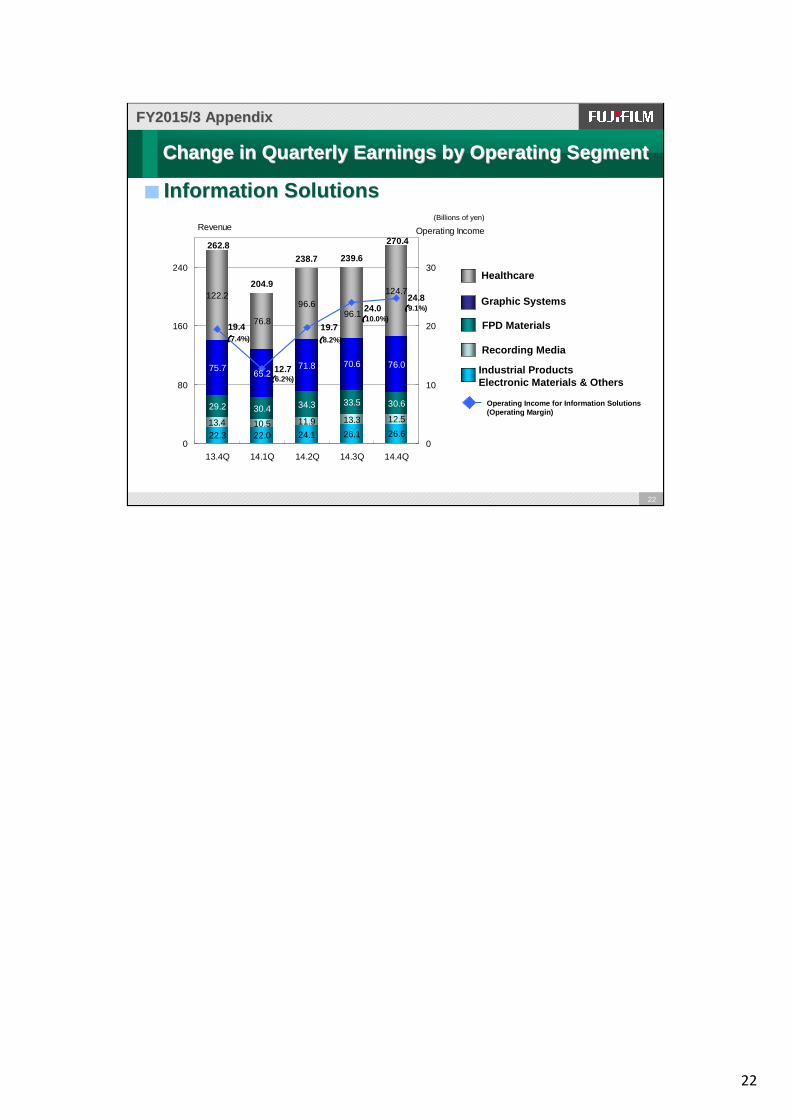
Healthcare 122.2 124.7 2.5 (+2.1%) 382.0 394.3 12.3 (+3.2%)
Graphic Systems 75.7 76.0 0.3 (+0.5%) 280.0 283.6 3.6 (+1.3%)
FPD Materials 29.2 30.6 1.4 (+4.6%) 138.2 128.8 (9.4) (-6.8%)
Recording Media 13.4 12.5 (0.9) (-6.3%) 46.5 48.2 1.7 (+3.7%)Industrial Products
Electronic Materials &Others
22.3 26.6 4.3 (+19.1%) 87.2 98.7 11.5 (+13.2%)
Total 262.8 270.4 7.6 (+2.9%) 933.9 953.6 19.7 (+2.1%)
Note: After elimination of intersegment transaction.
(Billions of yen)
4Q Full Year
FY2014/3 FY2015/3 Change FY2014/3 FY2015/3 Change
19.4 24.8 72.9 81.2[7.4%] [9.1%] [7.8%] [8.5%]
8.3(+27.2%) (+11.3%)
Revenue
Operating Income[Operating Margin]
Information Solutions 5.4
22
22
22.3 22.0 24.1 26.1 26.610.5 11.9 13.3 12.5
29.2 30.4 34.3 33.5 30.6
75.765.2
71.8 70.6 76.0
122.2
76.8
96.6
124.7204.9
238.7 239.6
13.4
96.1
270.4262.8
19.719.4
24.824.0
12.7
0
80
160
240
13.4Q 14.1Q 14.2Q 14.3Q 14.4Q
Revenue
0
10
20
30
Operating Income
Healthcare
Graphic Systems
Information SolutionsInformation Solutions
Change in Quarterly Earnings by Operating Segment Change in Quarterly Earnings by Operating Segment
FPD Materials
Recording Media
Industrial ProductsElectronic Materials & Others
Operating Income for Information Solutions(Operating Margin)
FY2015/3 AppendixFY2015/3 Appendix
(Billions of yen)
((((7.4%)
((((6.2%)
((((8.2%)
((((10.0%)((((9.1%)
23
23
Document SolutionsDocument Solutions
FY2015/3 AppendixFY2015/3 Appendix
Earnings for FY2015/3 4Q/Full yearEarnings for FY2015/3 4Q/Full year
(Billions of yen)
4Q Full Year
FY2014/3 FY2015/3 Change FY2014/3 FY2015/3 Change
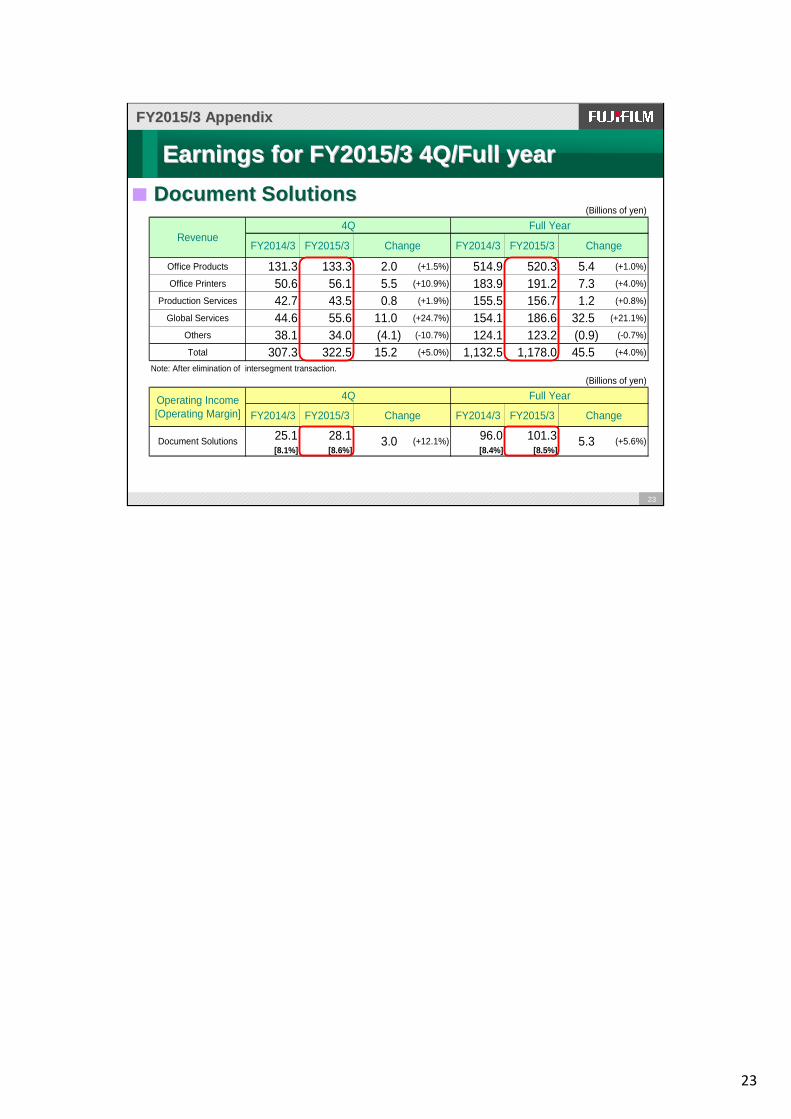
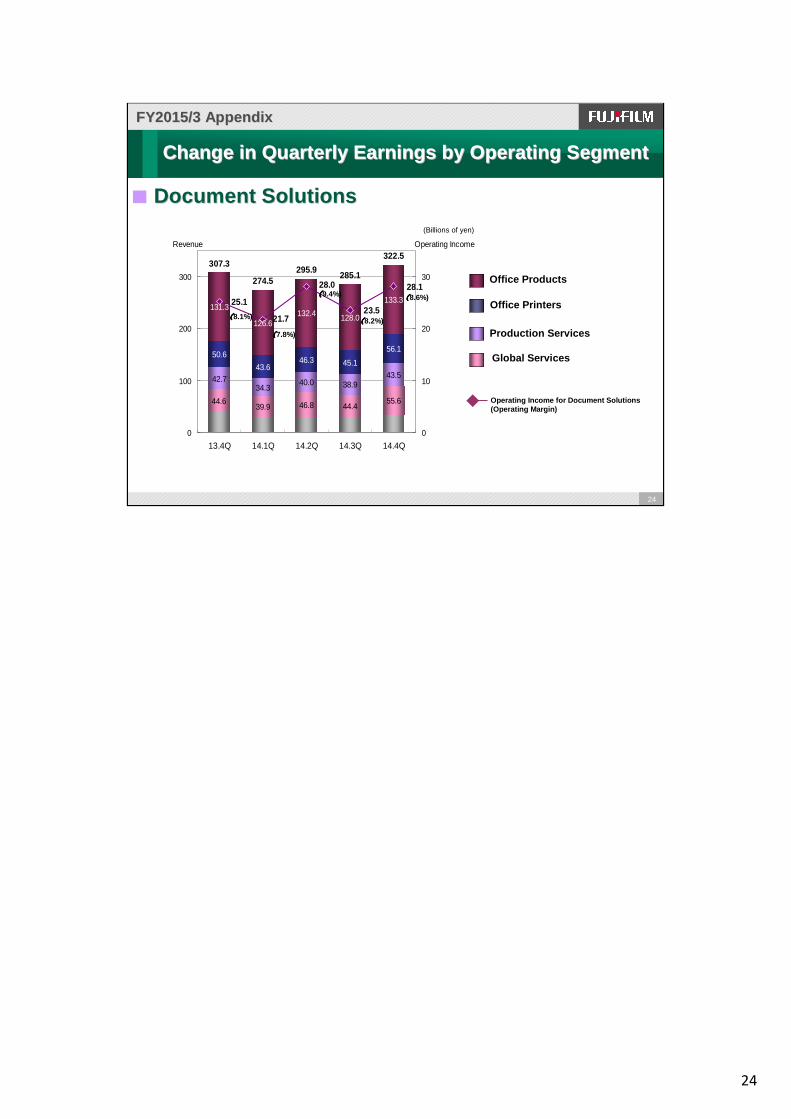
Office Products 131.3 133.3 2.0 (+1.5%) 514.9 520.3 5.4 (+1.0%)
Office Printers 50.6 56.1 5.5 (+10.9%) 183.9 191.2 7.3 (+4.0%)
Production Services 42.7 43.5 0.8 (+1.9%) 155.5 156.7 1.2 (+0.8%)
Global Services 44.6 55.6 11.0 (+24.7%) 154.1 186.6 32.5 (+21.1%)
Others 38.1 34.0 (4.1) (-10.7%) 124.1 123.2 (0.9) (-0.7%)
Total 307.3 322.5 15.2 (+5.0%) 1,132.5 1,178.0 45.5 (+4.0%)
Note: After elimination of intersegment transaction.(Billions of yen)
4Q Full Year
FY2014/3 FY2015/3 Change FY2014/3 FY2015/3 Change
25.1 28.1 96.0 101.3[8.1%] [8.6%] [8.4%] [8.5%]
5.3(+12.1%) (+5.6%)
Revenue
Operating Income[Operating Margin]
Document Solutions 3.0
24
24
39.9 46.8 44.455.6
42.734.3
40.0 38.943.5
50.6
43.646.3 45.1
56.1
131.3
126.6132.4 128.0
133.3
307.3
274.5295.9
285.1
322.5
44.6
23.5
28.0
21.7
25.1
28.1
0
100
200
300
13.4Q 14.1Q 14.2Q 14.3Q 14.4Q
Revenue
0
10
20
30
Operating Income
Office Products
Office Printers
Production Services
Global Services
Document SolutionsDocument Solutions(Billions of yen)
Operating Income for Document Solutions(Operating Margin)
Change in Quarterly Earnings by Operating Segment Change in Quarterly Earnings by Operating Segment
FY2015/3 AppendixFY2015/3 Appendix
((((8.1%)
((((7.8%)
((((9.4%)
((((8.2%)
((((8.6%)
25
25
Revenue from Domestic and OverseasRevenue from Domestic and Overseas
FY2015/3 AppendixFY2015/3 Appendix
(Billions of yen)
Ratio (%) Ratio (%)
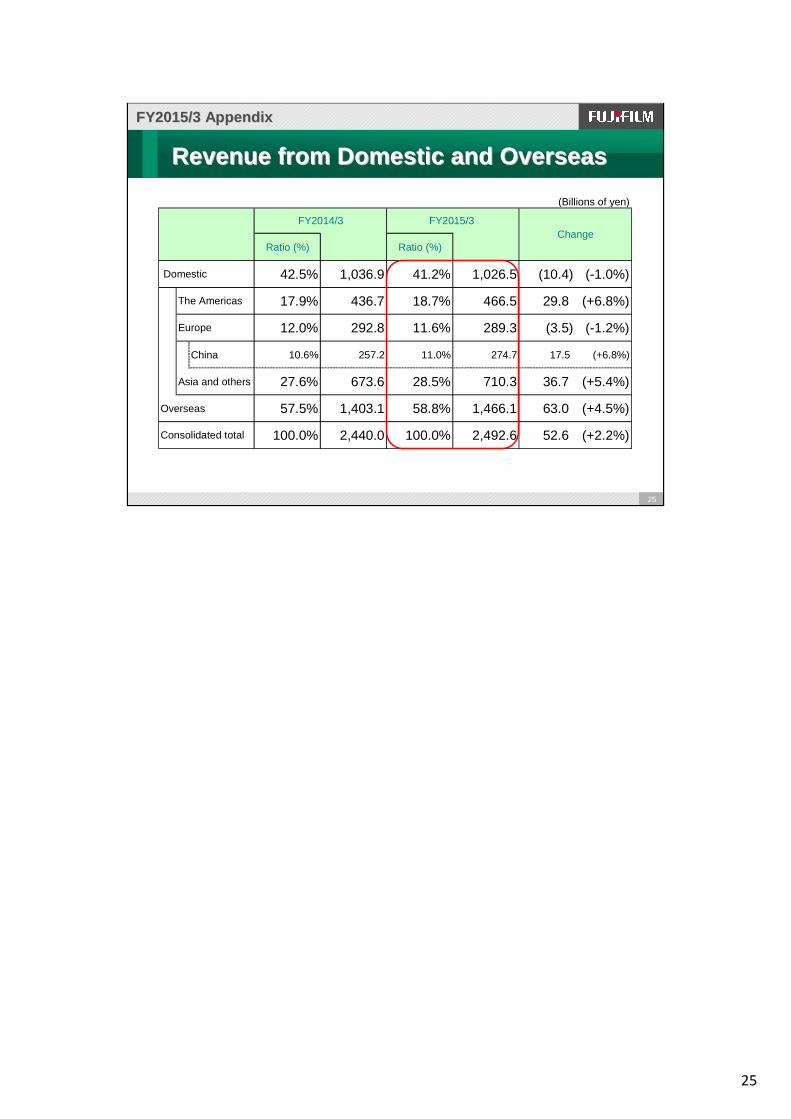
42.5% 1,036.9 41.2% 1,026.5 (10.4) (-1.0%)
17.9% 436.7 18.7% 466.5 29.8 (+6.8%)
12.0% 292.8 11.6% 289.3 (3.5) (-1.2%)
China 10.6% 257.2 11.0% 274.7 17.5 (+6.8%)
Asia and others 27.6% 673.6 28.5% 710.3 36.7 (+5.4%)
Overseas 57.5% 1,403.1 58.8% 1,466.1 63.0 (+4.5%)
100.0% 2,440.0 100.0% 2,492.6 52.6 (+2.2%)
Europe
Consolidated total
Domestic
The Americas
FY2014/3 FY2015/3 Change

26
26
Capital ExpenditureCapital Expenditure , Depreciation & Amortization, Depreciation & Amortization
FY2015/3 AppendixFY2015/3 Appendix
Capital Expenditure (Full year)
24.8 23.9 17.3
39.932.4
29.3
9.9
9.3
7.9
FY2013/3
FY2014/3
FY2015/3
Imaging Information Document Corporate
76.7
67.0
56.1
Depreciation & Amortization (Full year)
53.1 56.1 58.7
71.8 68.651.0
13.3 13.5
11.1
FY2013/3
FY2014/3
FY2015/3
122.9
141.4141.5
(Billions of yen)
4Q
FY2013/3
FY2014/3
FY2015/3
FY2013/3
FY2014/3
FY2015/3
FY2016/3(forecast)
Imaging 2.8 1.8 2.9 9.9 9.3 7.9 -
Information 9.1 10.6 9.9 39.9 32.4 29.3 -
Document 11.0 4.9 3.5 24.8 23.9 17.3 -
Corporate 0.7 0.3 0.5 2.1 1.4 1.6 -
Capex * 23.6 17.6 16.8 76.7 67.0 56.1 80.0
Imaging 4.5 4.1 3.2 13.3 13.5 11.1 -
Information 20.0 17.8 13.0 71.8 68.6 51.0 -
Document 13.7 14.4 15.5 53.1 56.1 58.7 -
Corporate 0.7 0.8 0.5 3.3 3.2 2.1 -
38.9 37.1 32.2 141.5 141.4 122.9 130.0
26.9 25.4 17.3 93.4 90.7 65.1 75.0
Full year
Depreciation*
Depreciation& Amortization
*Note: Figures do not include amounts for rental equipment handled by the Document Solutions segment and others.
27
27
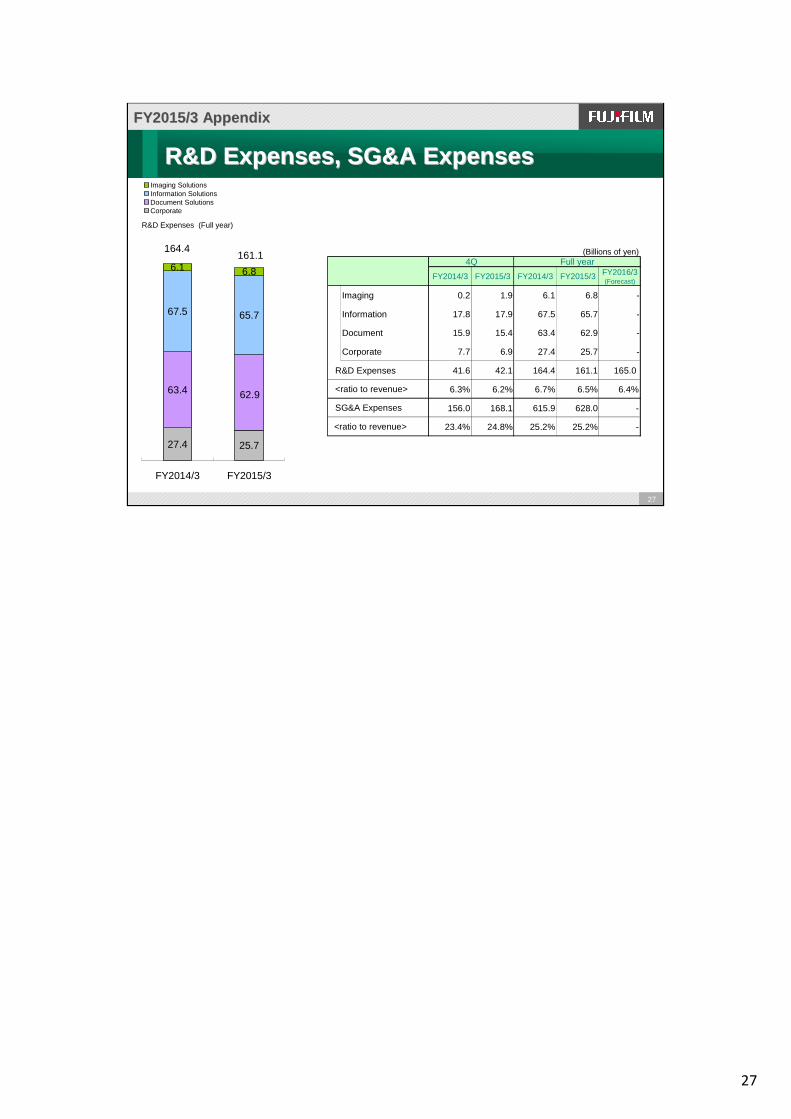
R&D Expenses, SG&A ExpensesR&D Expenses, SG&A Expenses
FY2015/3 AppendixFY2015/3 Appendix
(Billions of yen)
FY2014/3 FY2015/3 FY2014/3 FY2015/3 FY2016/3(Forecast)
Imaging 0.2 1.9 6.1 6.8 -
Information 17.8 17.9 67.5 65.7 -
Document 15.9 15.4 63.4 62.9 -
Corporate 7.7 6.9 27.4 25.7 -
R&D Expenses 41.6 42.1 164.4 161.1 165.0
6.3% 6.2% 6.7% 6.5% 6.4%
156.0 168.1 615.9 628.0 -
23.4% 24.8% 25.2% 25.2% -
4Q Full year
<ratio to revenue>
SG&A Expenses
<ratio to revenue>
R&D Expenses (Full year)
63.4
67.5 65.7
6.1 6.8
25.727.4
62.9
FY2014/3 FY2015/3
Imaging SolutionsInformation SolutionsDocument SolutionsCorporate
161.1164.4
28
28
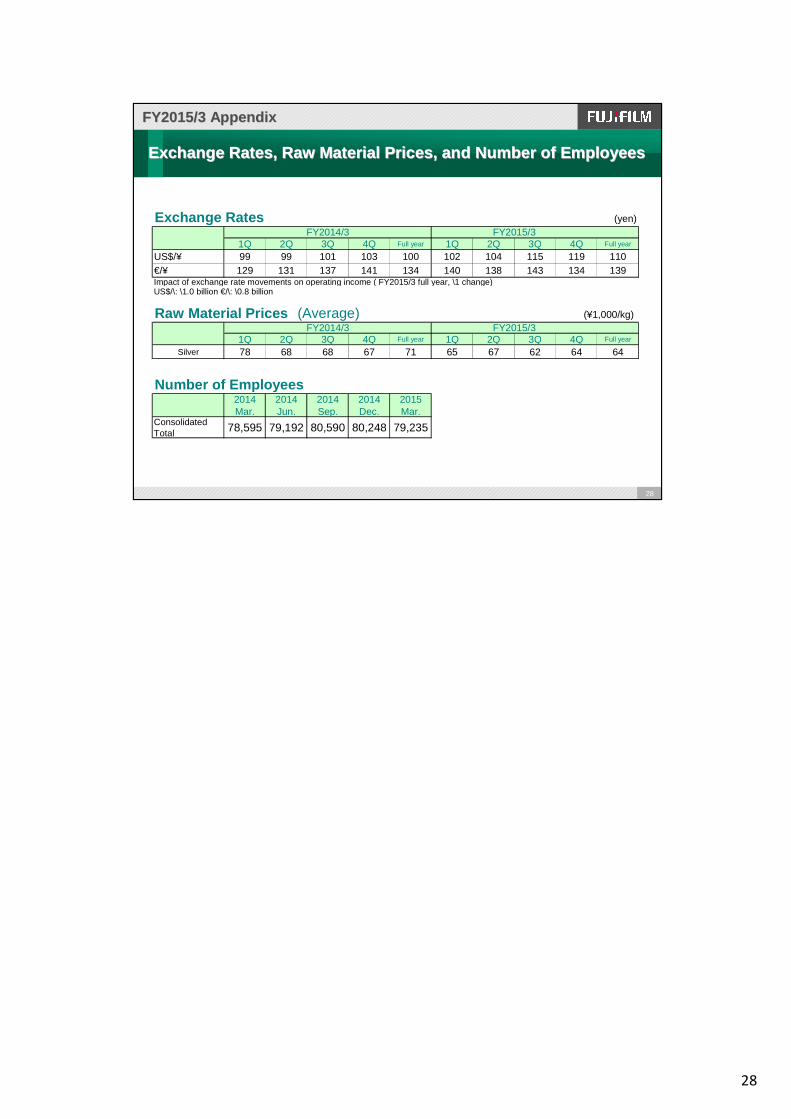
Exchange Rates, Raw Material Prices, and Number of EmployeesExchange Rates, Raw Material Prices, and Number of Employees
FY2015/3 AppendixFY2015/3 Appendix
Exchange Rates (yen)
1Q 2Q 3Q 4Q Full year 1Q 2Q 3Q 4Q Full year
US$/¥ 99 99 101 103 100 102 104 115 119 110€/¥ 129 131 137 141 134 140 138 143 134 139Impact of exchange rate movements on operating income ( FY2015/3 full year, \1 change) US$/\: \1.0 billion €/\: \0.8 billion
Raw Material Prices (Average) (¥1,000/kg)
1Q 2Q 3Q 4Q Full year 1Q 2Q 3Q 4Q Full year
Silver 78 68 68 67 71 65 67 62 64 64
Number of Employees2014Mar.
2014Jun.
2014Sep.
2014Dec.
2015Mar.
ConsolidatedTotal 78,595 79,192 80,590 80,248 79,235
FY2014/3 FY2015/3
FY2014/3 FY2015/3
29
29
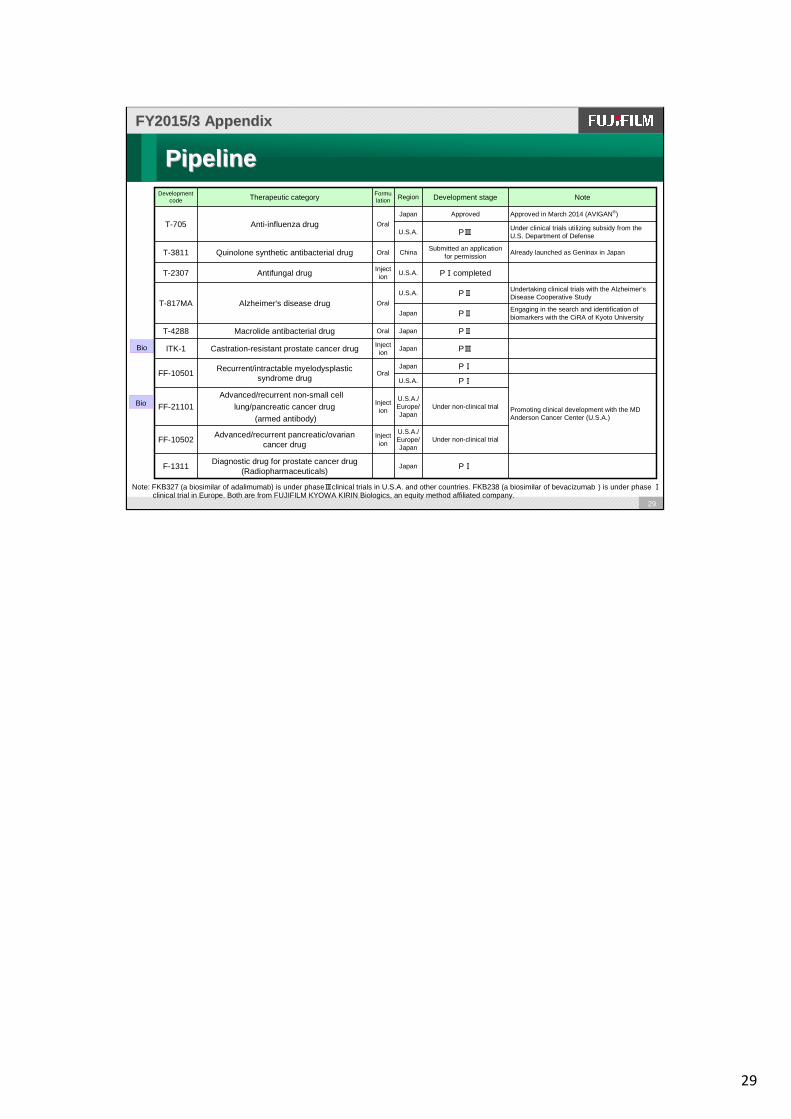
PipelinePipeline
FY2015/3 AppendixFY2015/3 Appendix
Note: FKB327 (a biosimilar of adalimumab) is under phaseⅢclinical trials in U.S.A. and other countries. FKB238 (a biosimilar of bevacizumab ) is under phase Ⅰ
Bio
Bio
Under clinical trials utilizing subsidy from the U.S. Department of DefensePⅢU.S.A.
Engaging in the search and identification of biomarkers with the CiRA of Kyoto University
Promoting clinical development with the MD Anderson Cancer Center (U.S.A.)
Under non-clinical trialU.S.A./Europe/Japan
Injection
Advanced/recurrent pancreatic/ovarian cancer drug
FF-10502
PⅠJapanDiagnostic drug for prostate cancer drug
(Radiopharmaceuticals)F-1311
Under non-clinical trialU.S.A./Europe/Japan
Injection
Advanced/recurrent non-small cell
lung/pancreatic cancer drug
(armed antibody)
FF-21101
PⅠU.S.A.
PⅠJapanOral
Recurrent/intractable myelodysplasticsyndrome drug
FF-10501
PⅢJapanInjectionCastration-resistant prostate cancer drugITK-1
PⅡJapanOralMacrolide antibacterial drugT-4288
PⅡJapan
Undertaking clinical trials with the Alzheimer’s Disease Cooperative Study PⅡU.S.A.
OralAlzheimer's disease drugT-817MA
PⅠcompletedU.S.A.InjectionAntifungal drugT-2307
Already launched as Geninax in JapanSubmitted an application
for permissionChinaOralQuinolone synthetic antibacterial drugT-3811
ApprovedJapan Approved in March 2014 (AVIGAN®)
OralAnti-influenza drugT-705
NoteDevelopment stageRegionFormulationTherapeutic category
Development code
clinical trial in Europe. Both are from FUJIFILM KYOWA KIRIN Biologics, an equity method affiliated company.
30
30
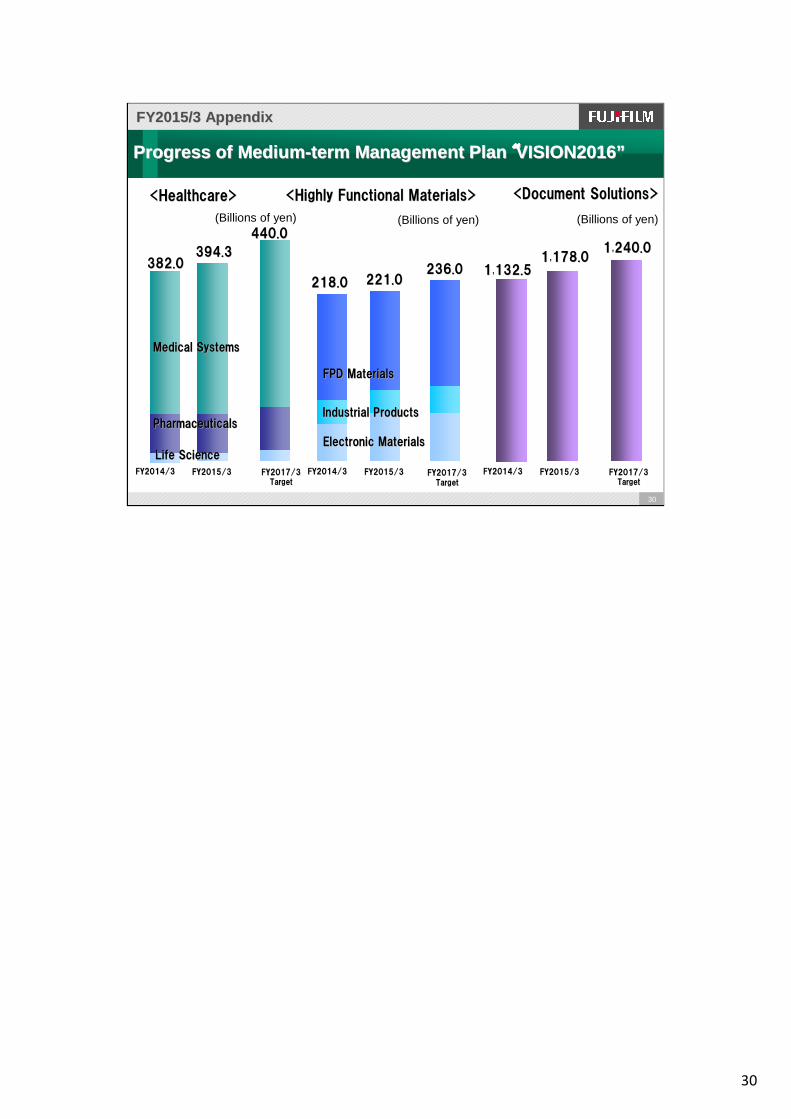
Progress of MProgress of M ediumedium --term term MManagement anagement PPlanlan ““““““““VISION2016VISION2016””
FY2014/3FY2014/3 FY2017/3FY2017/3
TargetTargetFY2015/3FY2015/3
<Healthcare><Healthcare> <Highly Functional Materials><Highly Functional Materials> <Document Solutions><Document Solutions>
FY2015/3 AppendixFY2015/3 Appendix
382382.0.0
Medical SystemsMedical Systems
PharmaceuticalsPharmaceuticals
Life ScienceLife Science
440440..00
39394.34.3
FPD MaterialsFPD Materials
Industrial ProductsIndustrial Products
Electronic MaterialsElectronic Materials
218218..00236236..00
221221..00
11,,240.0240.0
11,,132132..5511,,178178..00
(Billions of yen)
FY2014/3FY2014/3 FY2017/3FY2017/3
TargetTargetFY2015/3FY2015/3FY2014/3FY2014/3 FY2017/3FY2017/3
TargetTarget
FY2015/3FY2015/3
(Billions of yen)(Billions of yen)
31
31
AppendixAppendix
FUJIFILM Holdings FUJIFILM Holdings -------- Investor RelationsInvestor Relationshttp://www.fujifilmholdings.com/en/investors/index.html
What Kind of Company is Fujifilm?What Kind of Company is Fujifilm?http://www.fujifilmholdings.com/en/investors/guidance/index.html
IRIR Events MaterialsEvents Materialshttp://www.fujifilmholdings.com/en/investors/ir_events/business_presentations/index.html
・ Business presentation materials- Nov. 2014 Business Presentation for Pharmaceuticals Business - Feb. 2015 Business Presentation for Document Business
・ Conference Materials- Mar. 2015 Daiwa Investment Conference Tokyo 2015
FUJIFILM Holdings Annual Report 2014FUJIFILM Holdings Annual Report 2014http://www.fujifilmholdings.com/en/investors/annual_reports/2014/index.html
FY2015/3 AppendixFY2015/3 Appendix

32
Corporate Communication Office, Corporate Planning Div.
http://www.fujifilmholdings.com/en/index.html
At Fujifilm, we are continuously innovating — creatingnew technologies, products and services that inspire
and excite people everywhere.Our goal is to empower the potential and expand
the horizons of tomorrow’s businesses and lifestyles.