earnings signals in Þxed-price and dutch auction self
TRANSCRIPT
Journal of Financial Economics 49 (1998) 161—186
Earnings signals in fixed-price and Dutch auctionself-tender offers1
Erik Lie!,*, John J. McConnell"! School of Business Administration, College of William and Mary, Williamsburg, VA 23187, USA" Krannert Graduate School of Management, Purdue University, West Lafayette, IN 47907, USA
Received 24 October 1996; received in revised form 29 September 1997
Abstract
Studies by Vermaelen (1981) and others indicate that the positive excess stock returnsaround self-tender offer announcements are the result of a signal of future earningsimprovements. Comment and Jarrell (1991), Lee, Mikkelson and Partch (1992) andPersons (1994) argue that the signal in fixed-price self-tender offers should be strongerthan the signal in Dutch auction self-tender offers. This study tests whether the earningsimprovement following fixed-price self-tender offers is greater than that following Dutchauction self-tender offers. We find some evidence that earnings improve following bothtypes of self-tender offers. However, we find no difference in earnings improvementbetween the two types of offers. ( 1998 Elsevier Science S.A. All rights reserved.
JEL classification: G32; G35
Keywords: Stock repurchases; Signaling; Self-tender offers; Earnings forecasts
1. Introduction
Empirical investigations by Dann (1981), Masulis (1980), Vermaelen (1981),Comment and Jarrell (1991), and Howe et al. (1992) document that corporateself-tender offers are associated with statistically and economically significant
*Corresponding author. Tel.: 757 221 2865; fax: 757 221 2937; e-mail: [email protected].
1We thank Dave Denis, Diane Denis, Craig Dunbar (the referee), Scott Lee, and Wayne Mikkel-son for helpful comments and Eugene Fama and Wayne Mikkelson for providing us with data.
0304-405X/98/$19.00 ( 1998 Elsevier Science S.A. All rights reservedPII S 0 3 0 4 - 4 0 5 X ( 9 8 ) 0 0 0 2 1 - X
announcement-period excess stock returns. Dann et al. (1991), Hertzel and Jain(1991), and Vermaelen (1981) report that earnings improve following self-tenderoffers and that the earnings improvement is correlated with the announcement-period excess stock returns. Based on this evidence, one widely (though notuniversally) accepted explanation for the excess returns that accompany corpo-rate self-tender offers is that the announcement of the tender offer ‘signals’management’s expectations of improved future earnings performance for thefirm (Comment and Jarrell, 1991 and Weston and Copeland, 1992).
The studies of the relationship between earnings and excess returns usedsamples of fixed-price self-tender offers from the 1960s and 1970s.2 Dutchauction self-tender offers were introduced in 1981. Comment and Jarrell (1991),Lee et al. (1992), and Persons (1994) argue that the signal associated withfixed-price self-tender offers is likely to be stronger than the signal associatedwith Dutch auction self-tender offers. The proposition that self-tender offerssignal managers’ expectations for improved future earnings, implies that theearnings improvement associated with fixed-price self-tender offers should bestronger than that associated with Dutch auction self-tender offers. A primarypurpose of this study is to investigate that question empirically. Because ourstudy encompasses the 1980s and the first half of the 1990s, an importantby-product of our investigation is a determination of whether the earningsimprovements associated with self-tender offers during the 1960s and 1970spersisted during the more recent decades.
To conduct this study, we evaluate earnings improvements from before toafter the self-tender offers against three different benchmarks, which are de-scribed in Section 4. With none of these benchmarks do we find any differencesin earnings improvement between the two types of self-tender offers. Indeed,with two of the three benchmarks, we find no improvement in earnings for eithertype of self-tender offer. There is, however, more to the story. According to thedata, relative to own-industry benchmarks, both firms that undertake fixed-price self-tender offers and those that undertake Dutch auction self-tender offershave superior earnings performance prior to self-tender offers. On average, overthe five years prior to the self-tender offers, the rate of return on assets for thesefirms exceeds their industry medians by 2% to 5% per year. Furthermore, thissuperior performance continues for several years afterward. On this basis, thereis no improvement in earnings following self-tender offers. So where is theearnings signal?
Of the three earnings benchmarks, the one that does indicate an improvementin earnings is based on a procedure proposed by Barber and Lyon (1996).Barber and Lyon observe that corporate earnings tend to follow a mean
2To be precise, however, Hertzel and Jain (1991) include the first four years of the 1980s in theirsample and may have included a few Dutch auction self-tender offers.
162 E. Lie, J.J. McConnell/Journal of Financial Economics 49 (1998) 161—186
reverting process in which the earnings of firms with above or below normalearnings revert over time to their industry norm. When we construct a bench-mark of firms with similar pre-announcement performance as the tender-offerfirms using the procedure proposed by Barber and Lyon, we find that thebenchmark does exhibit reversion toward the industry median during theannouncement year, whereas firms that undertake self-tender offers do not.Thus, to the extent that there is an earnings signal in self-tender offer announce-ments during the period 1981—1994, it is that the above average earnings of thefirms conducting the offers will continue to be above average longer than mightotherwise have been expected, but even on this basis, the difference in earnings‘improvement’ between fixed-price and Dutch auction self-tender offers is notsignificant.
A related question is whether the market interprets fixed-price self-tenderoffers as providing a stronger signal of future earnings than Dutch auctionself-tender offers. If so, market participants should adjust their expectations offuture earnings upwards to a greater extent in response to announcements offixed-price than Dutch auction self-tender offers. To investigate that question,we use Value Line forecasts as a proxy for the market’s expectations of futureearnings. We compare Value Line forecasts before the announcement withValue Line forecasts afterward. We find no difference in the revisions in ValueLine earnings forecasts from before to after the announcement between the twotypes of self-tender offers. In fact, there is only modest evidence of improvementin earnings forecasts for either type of self-tender offer.
In sum, for both types of self-tender offers, the firms conducting the tenderoffers had superior performance (as measured by operating earnings) prior tothe tender offer, and this superior performance continued after the offers fora longer time period than might have been expected in the absence of the tenderoffers. On this basis, both firms that conducted fixed-price self-tender offers andthose that conducted Dutch auction self-tender offers during the 1980s and early1990s exhibited higher than expected earnings following the tender offers, butthere was no difference on this dimension between the two sets of firms. While itis possible that the signal provided by self-tender offers represents some factorthat does not show up in operating earnings, earnings are a broad-basedmeasure of performance and should capture the effects of any fundamentalchanges in the operations of the firms that lead to an increase in value. If there isa difference in the signal provided by fixed-price and Dutch auction self-tenderoffers, the challenge is to identify the source of this difference and to discoverwhy it does not show up more strongly as a difference in earnings improvementbetween the two types of self-tender offers.
Our investigation incidentally supports Barber and Lyon’s (1996) contentionthat when sample firms experience abnormal pre-event performance, matchingprocedures that ignore the pre-event performance may yield misspecified teststatistics. While the results presented here for self-tender offers do not indicate
E. Lie, J.J. McConnell/Journal of Financial Economics 49 (1998) 161—186 163
which procedure is optimal, both the simulation results in Barber and Lyon andour results suggest that researchers should carefully select the benchmarkagainst which they compare performance.
Section 2 reviews prior empirical and theoretical studies of self-tender offers.Section 3 describes the procedure used to compile our sample and providessummary statistics on the companies and self-tender offers in the sample.Section 4 presents our primary analysis of earnings and Section 5 presentssensitivity analysis. Section 6 provides a numerical example of the effect ofearnings changes on equity value. Section 7 concludes.
2. Prior studies of self-tender offers
Empirical investigations of fixed-price self-tender offers undertaken withsamples from the 1960s and 1970s document that announcements of corporateself-tender offers are associated with announcement-period excess stock returnsof 16% to 17% (Dann, 1981; Masulis, 1980; and Vermaelen, 1981). Studiesundertaken with samples from the 1980s document excess returns of approxim-ately 8% (Comment and Jarrell, 1991; and Howe et al., 1992). Thus, althoughthe announcement-period excess stock returns are somewhat diminished in the1980s relative to prior decades, they are still statistically significant and eco-nomically substantial.
One interpretation of the excess returns surrounding self-tender offers is thatthe offers provide a signal about the future prospects of the firm. For example,Dann (1981) concludes that “2overall, the results are consistent with thehypothesis that repurchase tender offer announcements constitute a revelationby management of favorable new information about the value of the firm’sfuture prospects” (p. 136). A specific interpretation is that they provide a positivesignal about the future earnings of the firm. Evidence to support this positionhas been presented by Vermaelen (1981), Dann et al. (1991), and Hertzel andJain (1991). Vermaelen’s sample encompasses the period 1962—1977. He com-pares post-tender-offer realized earnings with expected earnings where expectedearnings are an extrapolation of historical realized earnings. He concludes that“2firms offer to repurchase part of their shares at a premium when they havepositive information about future earnings” (p. 179). Dann et al. investigatea sample of self-tender offers that took place over the period 1969 through 1978.They also compare realized earnings with expected earnings. They computeexpected earnings in two ways, one of which is based on historical earnings, theother of which is based on historical earnings plus an industry adjustment. Theyreport that earnings improve (relative to either benchmark) following self-tenderoffers and that this improvement is positively correlated with announcement-period excess stock returns. Like Vermaelen, they conclude that self-tender offerannouncements convey positive information about future earnings.
164 E. Lie, J.J. McConnell/Journal of Financial Economics 49 (1998) 161—186
If tender offers do signal improved future earnings, rational investors shouldrevise upward their expectations of future earnings when self-tender offers areannounced. Hertzel and Jain (1991) investigate that question by using ValueLine forecasts as a proxy for the market’s earnings expectations. Specifically, fora sample of self-tender offers that took place between 1970 and 1984, they usepre-announcement Value Line forecasts as a proxy for the market’s pre-an-nouncement expected earnings and post-announcement Value Line forecasts asa proxy for the market’s post-announcement expected earnings. They findpositive revisions of the Value Line earnings forecasts around self-tender offerannouncements, and these revisions are positively correlated with announce-ment-period excess stock returns.
Since their introduction in 1981, Dutch auction self-tender offers have becomeincreasingly popular (Comment and Jarrell, 1991). In a fixed-price self-tenderoffer, managers specify a single price at which shareholders can tender. Ina Dutch auction self-tender offer, managers specify a range of prices withinwhich shareholders can tender and the responses to the self-tender offer deter-mine the price that will be paid to tendering shareholders. Comment and Jarrell(1991) argue that fixed-price self-tender offers provide a more effective signalingmechanism than do Dutch auction self-tender offers because informed managersset the premium in fixed-price offers, whereas shareholders determine the pre-mium to be paid in Dutch auction self-tender offers. Furthermore, Dutchauction self-tender offers in which managers set a relatively low minimumpremium should not be as convincing a signal since their potential wealth loss inthe event of ‘false signaling’ is minimal. Finally, because the minimum premiumsoffered in Dutch auction self-tender offers are substantially lower than those infixed-price self-tender offers, they argue that Dutch auction self-tender offersprovide weaker signals than do fixed-price self-tender offers. After revising theirsample to exclude events with contaminating information, Comment and Jarrellmeasure excess stock returns over the seven-day period surrounding the self-tender offer announcements. They report that the average excess stock return of11% measured over the seven-day interval surrounding the announcements fortheir sample of fixed-price self-tender offers is significantly greater than theaverage excess return of 8% for their sample of Dutch auction self-tender offers.They interpret this finding (along with the results of other tests) to indicate thatfixed-price self-tender offers are a more effective signaling mechanism than areDutch auction self-tender offers.
Persons (1994) constructs a more formal theoretical model in which firms canchoose between fixed-price and Dutch auction self-tender offers. In his model,the firm faces an uncertain upward-sloping supply curve and only the managerknows the true value of the firm. The manager can signal to the market that thetrue value is high by repurchasing shares at a premium. Persons’ model predictsthat fixed-price self-tender offers are a more effective signaling mechanism thanare Dutch auction self-tender offers.
E. Lie, J.J. McConnell/Journal of Financial Economics 49 (1998) 161—186 165
Consistent with the idea that fixed-price self-tender offers provide moreinformative signals than do Dutch auction self-tender offers, Lee et al. (1992),using a sample from 1977 through 1988, report that managers increase theirpurchases and decrease their sales of the firm’s shares prior to fixed-price tenderoffers, but managers’ buying and selling of the firm’s shares is normal prior toDutch auction tender offers.
Comment and Jarrell, Persons, and Lee et al. suggest that the signal (regard-less of what the information is that is being signaled) is stronger for fixed-pricethan for Dutch auction self-tender offers. None of their studies specifically tiesthe signal to earnings. However, as we noted, earnings is a broad-based measureof performance, and studies undertaken with samples from the 1960s and 1970shave documented that earnings increase following fixed-price self-tender offersand that the improvement is correlated with announcement-period stock re-turns. It is this line of reasoning that underlies our investigation of whether theearnings improvement is greater following fixed-price than following Dutchauction self-tender offers. Because the first Dutch auction self-tender offer tookplace in 1981, our study necessarily covers a later time period than that of priorstudies. Thus, a further contribution of this investigation is to update the studiesof Vermaelen, Dann et al. and Hertzel and Jain.3
3. Sample construction and description
Our sample covers the period September 1981, the month in which the firstDutch auction self-tender offer was announced, through December 1994. Fivesources are used to construct an initial sample of self-tender offers: (1) officialcorporate announcements in the Wall Street Journal (¼SJ); (2) the ‘reacquiredshares’ section of the Wall Street Journal Index (¼SJI); (3) the Dow JonesNews Retrieval (DJNR) service; (4) Comment and Jarrell (1991); and (5) a list ofself-tender offers used in Lee et al.4 Self-tender offers are excluded if they were (1)open only for preferred or special common stock; (2) open only to holders of oddlots; (3) part of a merger, liquidation, or going private transaction; or (4)conducted by a closed-end investment company.
The empirical analysis includes two primary investigations. The first dealswith changes in earnings from before to after the tender offers. The second dealswith changes in Value Line forecasts of earnings. To be included in the earnings
3Additional motivation for tests of whether earnings improve following self-tender offers comesfrom studies of seasoned equity (Loughran and Ritter, 1996) and initial public equity offers (Jain andKini, 1994), which document that earnings tend to decline following equity offerings.
4We thank Wayne Mikkelson for providing us with this list.
166 E. Lie, J.J. McConnell/Journal of Financial Economics 49 (1998) 161—186
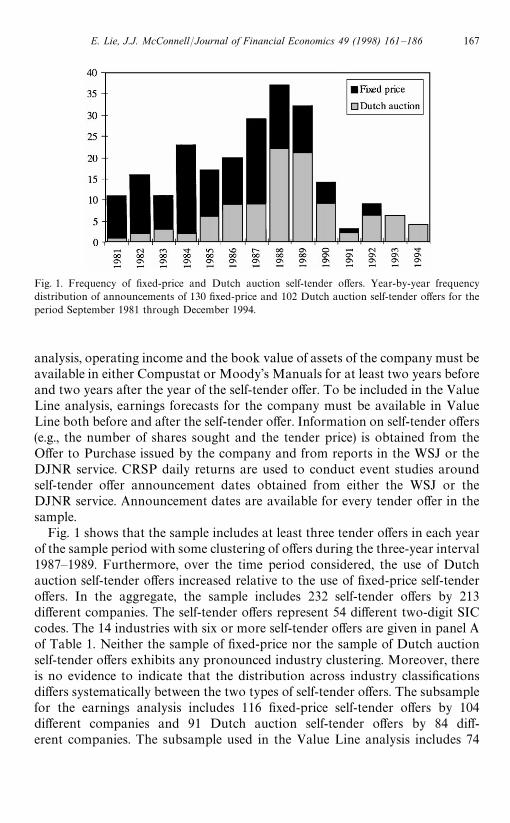
Fig. 1. Frequency of fixed-price and Dutch auction self-tender offers. Year-by-year frequencydistribution of announcements of 130 fixed-price and 102 Dutch auction self-tender offers for theperiod September 1981 through December 1994.
analysis, operating income and the book value of assets of the company must beavailable in either Compustat or Moody’s Manuals for at least two years beforeand two years after the year of the self-tender offer. To be included in the ValueLine analysis, earnings forecasts for the company must be available in ValueLine both before and after the self-tender offer. Information on self-tender offers(e.g., the number of shares sought and the tender price) is obtained from theOffer to Purchase issued by the company and from reports in the WSJ or theDJNR service. CRSP daily returns are used to conduct event studies aroundself-tender offer announcement dates obtained from either the WSJ or theDJNR service. Announcement dates are available for every tender offer in thesample.
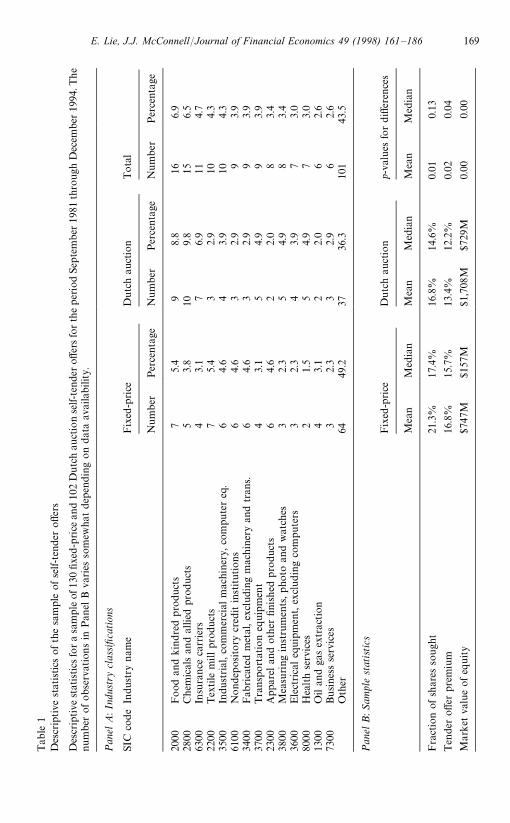
Fig. 1 shows that the sample includes at least three tender offers in each yearof the sample period with some clustering of offers during the three-year interval1987—1989. Furthermore, over the time period considered, the use of Dutchauction self-tender offers increased relative to the use of fixed-price self-tenderoffers. In the aggregate, the sample includes 232 self-tender offers by 213different companies. The self-tender offers represent 54 different two-digit SICcodes. The 14 industries with six or more self-tender offers are given in panel Aof Table 1. Neither the sample of fixed-price nor the sample of Dutch auctionself-tender offers exhibits any pronounced industry clustering. Moreover, thereis no evidence to indicate that the distribution across industry classificationsdiffers systematically between the two types of self-tender offers. The subsamplefor the earnings analysis includes 116 fixed-price self-tender offers by 104different companies and 91 Dutch auction self-tender offers by 84 diff-erent companies. The subsample used in the Value Line analysis includes 74
E. Lie, J.J. McConnell/Journal of Financial Economics 49 (1998) 161—186 167
fixed-price self-tender offers by 69 companies and 79 Dutch auction self-tenderoffers by 74 companies.
Panel B of Table 1 provides summary statistics for the sample. The meanfraction of shares sought is 21.3% for fixed-price self-tender offers and 16.8% forDutch auction self-tender offers, and the difference between the two is statist-ically significant (p-value"0.01). Further, the mean (median) tender premium is16.8% (15.7%) for fixed-price self-tender offers and 13.4% (12.2%) for Dutchauction self-tender offers, and the p-value for the difference between the two is0.02. (The premium is measured as the tender price divided by the stock pricefive days prior to the tender offer announcement.) Thus, if the fraction of sharessought or the size of the premium offered is an indicator of the ‘strength of thesignal’ conveyed by the self-tender offer, the signal should be stronger forfixed-price than for Dutch auction self-tender offers. As we noted, in Dutchauction tender offers, managers set a range for the tender price. The mean(median) of the minimum for this range is 1.6% (0.7%). Finally, the mean(median) value of equity for firms that conduct Dutch auction self-tender offersis more than twice (four times) as large as that of those firms that conductfixed-price self-tender offers.
To begin, we calculate the cumulative excess returns (CERs) for the twosamples using the traditional market model procedure (Linn and McConnell,1983) with parameters estimated with returns from 250 days to 10 days beforethe tender offer announcement. For the three-day period surrounding theannouncement (hereafter referred to as the announcement period), the mean(median) CER for fixed-price self-tender offers is 7.9% (6.8%) and for Dutchauction self-tender offers it is 7.7% (6.4%). We also calculate CERs over otherintervals around the announcements for up to as many as ten days beforethrough ten days after the announcements. In no case is the difference in themean CERs between the two samples significant at the 0.10 level. The differencein median CERs is significant at the 0.05 level for the seven-day interval, but thatis the only interval for which the difference in medians is significant at that level.If the excess returns around announcements of tender offers are the resultof a signal emanating from the self-tender offer, and if that signal providesinformation about future earnings, the implication from the CERs is thatself-tender offers continued to signal earnings improvements during the 1980sand 1990s, but that there is no difference between the two types of self-tenderoffers in terms of the earnings improvement signaled. We next investigate thosequestions.5
5 .One of the virtues, at least from our perspective, of analyzing earnings is that the stock-priceresponse to self-tender offers may reflect other benefits and costs associated with the self-tender offer,such as price pressure effects (Bagwell, 1992) and corporate control effects (Stulz, 1988).
168 E. Lie, J.J. McConnell/Journal of Financial Economics 49 (1998) 161—186
Tab
le1
Des
crip
tive
stat
istics
ofth
esa
mple
ofse
lf-t
ender
offe
rs
Des
crip
tive
stat
istics
fora
sam
ple
of13
0fixe
d-price
and
102
Dutc
hau
ctio
nse
lf-te
nde
roff
ersfo
rth
eper
iod
Septe
mber
1981
thro
ugh
Dec
ember
1994
.The
num
ber
ofobse
rvat
ions
inPan
elB
varies
som
ewha
tdep
endin
gon
dat
aav
aila
bili
ty.
Pan
elA
:Ind
ustr
ycl
assifica
tion
s
SIC
code
Indu
stry
nam
eFix
ed-p
rice
Dutc
hau
ctio
nTota
l
Num
ber
Per
cent
age
Num
ber
Per
cent
age
Num
ber
Per
cent
age
2000
Food
and
kindre
dpro
duct
s7
5.4
98.
816
6.9
2800
Che
mic
als
and
allie
dpr
oduct
s5
3.8
109.
815
6.5
6300
Insu
rance
carr
iers
43.
17
6.9
114.
722
00Tex
tile
millpr
oduct
s7
5.4
32.
910
4.3
3500
Indu
strial
,co
mm
erci
alm
achi
nery
,co
mpute
req
.6
4.6
43.
910
4.3
6100
Nonde
pos
itory
cred
itin
stitut
ions
64.
63
2.9
93.
934
00Fab
rica
ted
met
al,e
xclu
ding
mac
hiner
yan
dtr
ans.
64.
63
2.9
93.
937
00Tra
nsp
ort
atio
neq
uipm
ent
43.
15
4.9
93.
923
00A
ppar
elan
doth
erfin
ished
pro
duct
s6
4.6
22.
08
3.4
3800
Mea
suring
inst
rum
ents
,pho
toan
dw
atch
es3
2.3
54.
98
3.4
3600
Ele
ctrica
leq
uip
men
t,ex
clud
ing
com
put
ers
32.
34
3.9
73.
080
00H
ealth
serv
ices
21.
55
4.9
73.
013
00O
ilan
dga
sex
trac
tion
43.
12
2.0
62.
673
00Busines
sse
rvic
es3
2.3
32.
96
2.6
Oth
er64
49.2
3736
.310
143
.5
Pan
elB
:Sa
mpl
est
atistics
Fix
ed-p
rice
Dutc
hau
ctio
np-
valu
esfo
rdiff
eren
ces
Mea
nM
edia
nM
ean
Med
ian
Mea
nM
edia
n
Fra
ctio
nof
shar
esso
ugh
t21
.3%
17.4
%16
.8%
14.6
%0.
010.
13
Ten
der
offer
prem
ium
16.8
%15
.7%
13.4
%12
.2%
0.02
0.04
Mar
ket
valu
eofeq
uity
$747
M$1
57M
$1,7
08M
$729
M0.
000.
00
E. Lie, J.J. McConnell/Journal of Financial Economics 49 (1998) 161—186 169
4. Analysis of earnings
4.1. Procedure for analyzing changes in earnings
We measure earnings improvement as the difference between expected earn-ings and realized earnings. We use earnings before depreciation, interest andtaxes (EBDIT) divided by the book value of assets, hereafter referred to as ROA,as our measure of earnings.
Three procedures are used to produce the expected ROA. With the firstprocedure, for each firm, we compare each year’s ROA with the prior year’sROA. In this test, the prior year’s ROA is a proxy for the current year’s expectedROA. To implement this procedure, for each firm in the sample, EBDIT andtotal assets are extracted from either Compustat or the relevant Moody’sManual for up to five years before through five years after the year of the tenderoffer announcement. As we noted above, we require that such data be availablefor a minimum of two years before and two years after the year of the tenderoffer in order for the tender offer to be included in this analysis. Because ourearnings and assets data end with 1995, the 13 self-tender offers that occurred in1994 are not included in this analysis. Furthermore, for those self-tender offers in1991 and later, the number of years for which data are available following theyear of the tender offer is less than five. Thus, the number of tender offers in theanalysis declines progressively as the analysis moves from year #2 throughyear #5 following the offer. As we noted above, for this analysis, the fixed-pricesample includes 116 self-tender offers and the Dutch auction sample includes 91self-tender offers. These samples are used with all three procedures. The mean(median) announcement-period CERs associated with these fixed-price andDutch auction self-tender offers are 7.7% (6.7%) and 8.3% (6.9%), respectively,and the difference in means (medians) is not significant at the 0.10 level.
In our second procedure, we refine our proxy of expected earnings byadjusting last year’s ROA for the change in the industry median ROA during theyear. The industry median is computed as follows: for each firm in the sample,for the period beginning five years before and ending no later than five yearsafter the tender offer, we identify every firm in Compustat with the same SICcode. For each of these peer group firms for which sufficient data are available,we calculate the annual ROA. For each year relative to the self-tender offer, theindustry median ROA is determined. This median ROA is the industry bench-mark against which the firms in our sample are compared. Specifically, wecalculate the industry-adjusted ROA by subtracting the industry median ROAfrom the tender-offer firm’s ROA in the same year.
Our third procedure is a refinement of the proxy of expected earningsproposed by Barber and Lyon (1996). Barber and Lyon investigate variousmethods for constructing accounting-based benchmarks of corporate perfor-mance to determine the reliability of tests conducted with them. One of their
170 E. Lie, J.J. McConnell/Journal of Financial Economics 49 (1998) 161—186
primary conclusions is that when the firms in a sample exhibit abnormalperformance prior to the event, the benchmark should be composed of firmswith similarly abnormal performance. The reason is that performance mayexhibit mean reversion and it is the deviation from the expected reversion that isthe relevant measure of performance. To construct such a performance-adjustedbenchmark, for each firm in the sample, we identify firms with the sametwo-digit SIC code which have sufficient data to calculate the ROA for each yearfrom two years before through two years after the year of the announcement.From these firms, we choose as a benchmark the firm with the ROA closest tothe ROA of the sample firm during the year before the self-tender offer, so longas the ROA of the benchmark firm is within 90% to 110% of the self-tender offerfirm’s ROA. This procedure yields a benchmark for 178 firms. For those firmsfor which we cannot identify a benchmark using these criteria, we replicate thisprocedure using a one-digit SIC code. This procedure yields a benchmark for allbut four firms. For the remaining four firms, the procedure is replicated with noSIC code requirement. Finally, we calculate the performance-adjusted ROA bysubtracting the ROA of the benchmark firm from the sample firm’s ROA in thesame year.
4.2. Results of analysis of changes in earnings
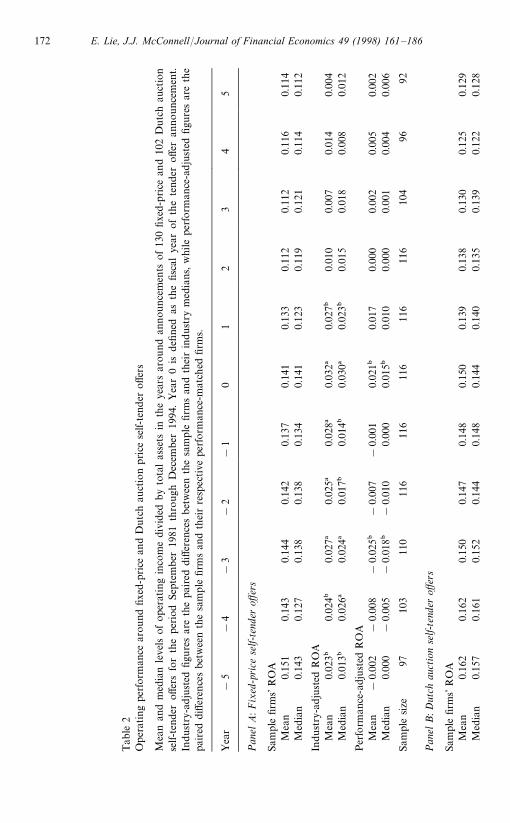
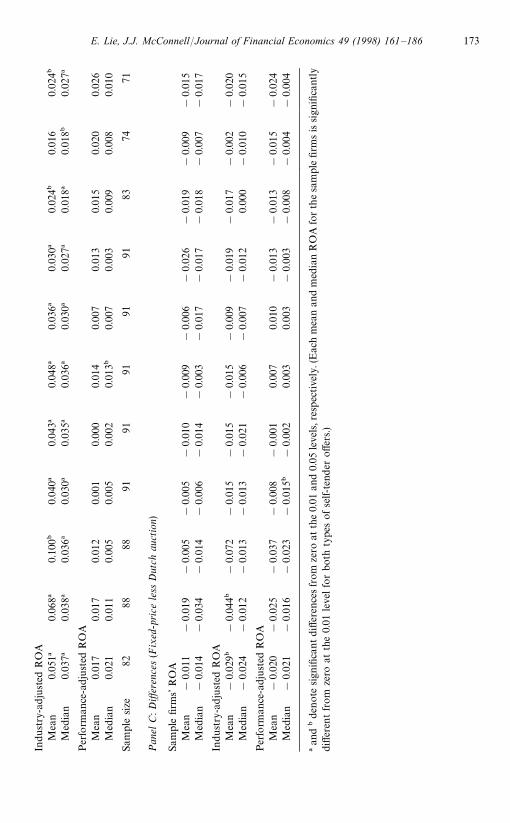
Table 2 presents the year-by-year mean and median ROAs, the mean andmedian industry-adjusted ROAs, and the mean and median performance-adjusted ROAs for both fixed-price (panel A) and Dutch auction (panel B)self-tender offers. Panel C presents the year-by-year differences between themeans and medians given in panels A and B. Similarly, Table 3 showsthe year-to-year changes in ROAs for fixed-price (panel A) and Dutch auction(panel B) self-tender offers, as well as the differences in the changes(panel C). Table 2 gives an indication of the year-to-year changes in ROA. Theexact changes and the statistical significance of the changes are provided inTable 3.
For both the fixed-price and the Dutch auction samples, the data in Table 2reveal little variation from year to year in the mean and median ROAs. Moreimportantly, there is no uptick in earnings from the year before to the year afterthe self-tender offer for either set of firms. Indeed, to the extent that there isa trend in ROA, it is a mild erosion following the tender offers. The data furtherreveal that, on average, firms that conduct fixed-price self-tender offers andthose that conduct Dutch auction self-tender offers performed significantlybetter than the median firm in their respective industries for up to five yearsprior to the year of the announcements. This superior industry-adjusted earn-ings performance before the offer is somewhat more pronounced for Dutchauction than fixed-price self-tender offers, but as shown in panel C, the differencein industry-adjusted ROA between the two samples typically is not significant.
E. Lie, J.J. McConnell/Journal of Financial Economics 49 (1998) 161—186 171
Tab
le2
Oper
atin
gpe
rfor
man
cear
ound
fixed
-price
and
Dut
chau
ctio
nprice
self-
tend
eroff
ers
Mea
nan
dm
edia
nle
vels
ofop
erat
ing
inco
me
divi
ded
by
tota
las
sets
inth
eye
ars
arou
ndan
nou
nce
men
tsof13
0fixe
d-price
and
102
Dutc
hau
ctio
nse
lf-te
nder
offer
sfo
rth
epe
riod
Sept
ember
1981
thro
ugh
Dec
embe
r19
94.
Yea
r0
isdefi
ned
asth
efis
cal
year
of
the
tend
eroffer
anno
unce
men
t.In
dust
ry-a
dju
sted
figure
sar
eth
epa
ired
differ
ence
sbet
wee
nth
esa
mple
firm
san
dth
eir
indust
rym
edia
ns,w
hile
perform
ance
-adju
sted
figu
res
are
the
paired
diff
eren
ces
bet
wee
nth
esa
mple
firm
san
dth
eir
resp
ective
perform
ance
-mat
ched
firm
s.
Yea
r!
5!
4!
3!
2!
10
12
34
5
Pan
elA
:Fix
ed-p
rice
self-
tend
eroff
ers
Sam
ple
firm
s’R
OA
Mea
n0.
151
0.14
30.
144
0.14
20.
137
0.14
10.
133
0.11
20.
112
0.11
60.
114
Med
ian
0.14
30.
127
0.13
80.
138
0.13
40.
141
0.12
30.
119
0.12
10.
114
0.11
2
Indu
stry
-adju
sted
RO
AM
ean
0.02
3"0.
024"
0.02
7!0.
025!
0.02
8!0.
032!
0.02
7"0.
010
0.00
70.
014
0.00
4M
edia
n0.
013"
0.02
6!0.
024!
0.01
7"0.
014"
0.03
0!0.
023"
0.01
50.
018
0.00
80.
012
Per
form
ance
-adj
ust
edR
OA
Mea
n!
0.00
2!
0.00
8!
0.02
5"!
0.00
7!
0.00
10.
021"
0.01
70.
000
0.00
20.
005
0.00
2M
edia
n0.
000
!0.
005
!0.
018"
!0.
010
0.00
00.
015"
0.01
00.
000
0.00
10.
004
0.00
6
Sam
ple
size
9710
311
011
611
611
611
611
610
496
92
Pan
elB
:D
utch
auct
ion
self-
tend
eroff
ers
Sam
ple
firm
s’R
OA
Mea
n0.
162
0.16
20.
150
0.14
70.
148
0.15
00.
139
0.13
80.
130
0.12
50.
129
Med
ian
0.15
70.
161
0.15
20.
144
0.14
80.
144
0.14
00.
135
0.13
90.
122
0.12
8
172 E. Lie, J.J. McConnell/Journal of Financial Economics 49 (1998) 161—186
Indu
stry
-adju
sted
RO
AM
ean
0.05
1!0.
068!
0.10
0"0.
040!
0.04
3!0.
048!
0.03
6!0.
030!
0.02
4"0.
016
0.02
4"M
edia
n0.
037!
0.03
8!0.
036!
0.03
0!0.
035!
0.03
6!0.
030!
0.02
7!0.
018!
0.01
8"0.
027!
Per
form
ance
-adj
ust
edR
OA
Mea
n0.
017
0.01
70.
012
0.00
10.
000
0.01
40.
007
0.01
30.
015
0.02
00.
026
Med
ian
0.02
10.
011
0.00
50.
005
0.00
20.
013"
0.00
70.
003
0.00
90.
008
0.01
0
Sam
ple
size
8288
8891
9191
9191
8374
71
Pan
elC
:Diff
eren
ces
(Fix
ed-p
rice
less
Dut
chau
ctio
n)
Sam
ple
firm
s’R
OA
Mea
n!
0.01
1!
0.01
9!
0.00
5!
0.00
5!
0.01
0!
0.00
9!
0.00
6!
0.02
6!
0.01
9!
0.00
9!
0.01
5M
edia
n!
0.01
4!
0.03
4!
0.01
4!
0.00
6!
0.01
4!
0.00
3!
0.01
7!
0.01
7!
0.01
8!
0.00
7!
0.01
7
Indu
stry
-adju
sted
RO
AM
ean
!0.
029"
!0.
044"
!0.
072
!0.
015
!0.
015
!0.
015
!0.
009
!0.
019
!0.
017
!0.
002
!0.
020
Med
ian
!0.
024
!0.
012
!0.
013
!0.
013
!0.
021
!0.
006
!0.
007
!0.
012
0.00
0!
0.01
0!
0.01
5
Per
form
ance
-adj
ust
edR
OA
Mea
n!
0.02
0!
0.02
5!
0.03
7!
0.00
8!
0.00
10.
007
0.01
0!
0.01
3!
0.01
3!
0.01
5!
0.02
4M
edia
n!
0.02
1!
0.01
6!
0.02
3!
0.01
5"!
0.00
20.
003
0.00
3!
0.00
3!
0.00
8!
0.00
4!
0.00
4
!an
d"de
note
sign
ifica
ntdi
ffer
ence
sfrom
zero
atth
e0.
01an
d0.
05le
vels,r
espec
tive
ly.(
Eac
hm
ean
and
med
ian
RO
Afo
rth
esa
mpl
efirm
sis
sign
ifica
ntly
differ
entfrom
zero
atth
e0.
01le
velfo
rbo
thty
pes
ofse
lf-te
nder
offe
rs.)
E. Lie, J.J. McConnell/Journal of Financial Economics 49 (1998) 161—186 173
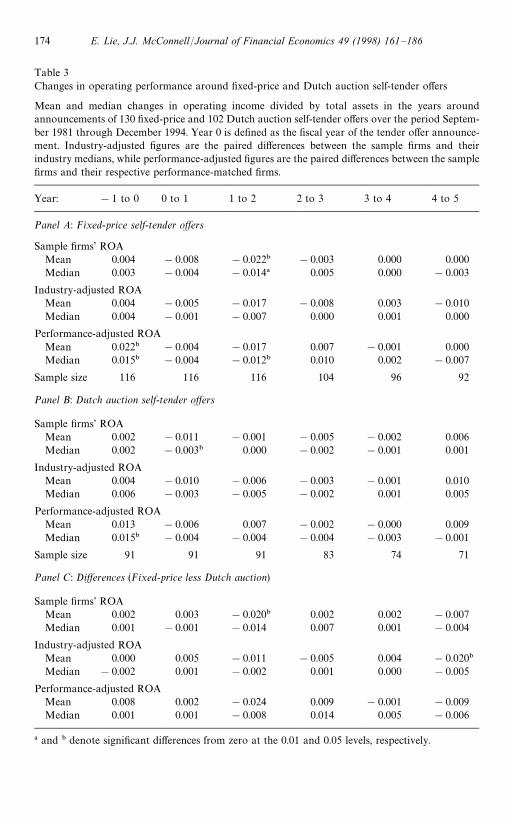
Table 3Changes in operating performance around fixed-price and Dutch auction self-tender offers
Mean and median changes in operating income divided by total assets in the years aroundannouncements of 130 fixed-price and 102 Dutch auction self-tender offers over the period Septem-ber 1981 through December 1994. Year 0 is defined as the fiscal year of the tender offer announce-ment. Industry-adjusted figures are the paired differences between the sample firms and theirindustry medians, while performance-adjusted figures are the paired differences between the samplefirms and their respective performance-matched firms.
Year: !1 to 0 0 to 1 1 to 2 2 to 3 3 to 4 4 to 5
Panel A: Fixed-price self-tender offers
Sample firms’ ROAMean 0.004 !0.008 !0.022" !0.003 0.000 0.000Median 0.003 !0.004 !0.014! 0.005 0.000 !0.003
Industry-adjusted ROAMean 0.004 !0.005 !0.017 !0.008 0.003 !0.010Median 0.004 !0.001 !0.007 0.000 0.001 0.000
Performance-adjusted ROAMean 0.022" !0.004 !0.017 0.007 !0.001 0.000Median 0.015" !0.004 !0.012" 0.010 0.002 !0.007
Sample size 116 116 116 104 96 92
Panel B: Dutch auction self-tender offers
Sample firms’ ROAMean 0.002 !0.011 !0.001 !0.005 !0.002 0.006Median 0.002 !0.003" 0.000 !0.002 !0.001 0.001
Industry-adjusted ROAMean 0.004 !0.010 !0.006 !0.003 !0.001 0.010Median 0.006 !0.003 !0.005 !0.002 0.001 0.005
Performance-adjusted ROAMean 0.013 !0.006 0.007 !0.002 !0.000 0.009Median 0.015" !0.004 !0.004 !0.004 !0.003 !0.001
Sample size 91 91 91 83 74 71
Panel C: Differences (Fixed-price less Dutch auction)
Sample firms’ ROAMean 0.002 0.003 !0.020" 0.002 0.002 !0.007Median 0.001 !0.001 !0.014 0.007 0.001 !0.004
Industry-adjusted ROAMean 0.000 0.005 !0.011 !0.005 0.004 !0.020"
Median !0.002 0.001 !0.002 0.001 0.000 !0.005
Performance-adjusted ROAMean 0.008 0.002 !0.024 0.009 !0.001 !0.009Median 0.001 0.001 !0.008 0.014 0.005 !0.006
! and " denote significant differences from zero at the 0.01 and 0.05 levels, respectively.
174 E. Lie, J.J. McConnell/Journal of Financial Economics 49 (1998) 161—186
In the typical year before the tender offers, firms in each sample outperformedtheir industry benchmarks by 2% to 5%. Moreover, this superior industry-adjusted performance continues after the year of the tender offer for bothsamples, although, as with the pre-announcement ROA, it is somewhat strongerfor the Dutch auction than for the fixed-price sample.
According to Barber and Lyon (1996), it is such circumstances as thoserepresented by the data in our analysis that a performance-adjusted benchmarkis especially suited to ascertaining whether realized earnings are different fromexpected earnings. We should note that if we had perfectly matched perfor-mance-based benchmarks, performance-adjusted mean and median ROAswould equal zero in the year preceding the announcement. As shown in Table 2,both are close to or equal to zero for both samples of self-tender offers. In fact,even in year !2, the mean and median performance-adjusted ROAs are veryclose to zero. These observations indicate that our matching procedure pro-duces good performance-adjusted benchmarks.
Recall the premise of the Barber and Lyon procedure, that earnings exhibitmean reversion. Thus, in the normal course of events, firms that experienceunusually high or unusually low earnings should expect to see their earningsrevert over time toward the industry average. From our examination of ROAand industry-adjusted ROA we know that firms that undertake self-tender offersexhibit some erosion in ROA and industry-adjusted ROA in the years followingself-tender offers. However, this erosion may be less pronounced or take place ata slower rate than might have been expected by market participants prior to theself-tender offers. If so, and if the performance-adjusted benchmark is represen-tative of the ‘normal’ rate of mean reversion, performance-adjusted ROAsshould be positive in the year of and/or in one or more years following the yearof the announcement.
Indeed, as shown in panel A, the performance-adjusted mean and medianROAs for the announcement year (year 0) for the fixed-price self-tender offersare 2.1% and 1.5%, respectively, with p-values of 0.03 and 0.01. In panel B, forthe Dutch auction sample, the mean and median performance-adjusted ROAs inyear 0 are 1.4% and 1.3% with p-values of 0.07 and 0.04. As shown in panel C,the difference in the means and medians for the two samples in year zero is notsignificant (p-values are all greater than 0.10). The results in Table 3 reveal thatthe changes in performance-adjustedROAs from year 0 to year 1 are statisticallysignificant for both samples, but that there is no significant difference in thechanges between the two samples. Furthermore, although the industry-adjustedROAs tend to drift downward following the tender offer, in no year is either themean or median performance-adjusted ROA negative for either sample follow-ing the announcement year, and in no year is the difference between the meansor medians of the two samples significant at the 0.10 level. These results indicatethat firms that conduct fixed-price self-tender offers and firms that conductDutch auction self-tender offers exhibit a less-pronounced reversion to the mean
E. Lie, J.J. McConnell/Journal of Financial Economics 49 (1998) 161—186 175
than might have been expected by market participants prior to the announce-ment, but the rate of reversion is not different between the two samples.
We also investigate the changes in ROA for the performance-based bench-mark firms (i.e., the firms with similar pre-announcement ROA) and find thateach set of these firms exhibits a statistically significant mean reversion duringthe announcement year, but no significant changes in ROA during the followingfive years (not reported). In particular, the mean (median) change in the ROA inyear 0 for the fixed-price performance-based control sample is !1.7%(!0.5%); for the Dutch auction performance-based control sample it is!1.1% (!0.3%). With the exception of the median change in the ROA for theDutch auction performance-based benchmark, each of these declines in ROA issignificantly different from zero at the 0.05 level.
Finally, we investigate changes in ROA over longer intervals. Specifically, weinvestigate changes in ROA from year !1 to each of the five years after theannouncement year. The results indicate that industry-adjusted changes aremore significant for longer intervals, while unadjusted and performance-adjusted changes are insignificant for longer intervals. For example, industry-adjusted ROA decreases significantly at the 0.10 level from year !1 to year 2for both types of self-tender offers. However, there are no significant differencesin the changes in ROA between the two types even for longer intervals.
Collectively, the results presented in this section indicate that there is nodifference in the earnings signal between the samples of fixed-price and Dutchauction self-tender offers. The results indicate that firms that conduct self-tenderoffers are performing better than their industry peers before the year of theannouncement and continue to outperform their industry peers following theannouncement year (although not always by a statistically significant margin).To the extent that there is a signal about future earnings in self-tender offersduring the 1980s and 1990s, it is that the firms’ earnings will not revert to the‘normal’ level as rapidly as other above-average performers from the sameindustries. But even here, there is no statistically significant difference betweenfixed-price and Dutch auction self-tender offers.
4.3. Value Line forecasts
A related question is whether the market interprets fixed-price self-tenderoffers as providing a stronger earnings signal than Dutch auction self-tenderoffers. If so, market participants should adjust their expectations of futureearnings upwards to a greater extent in response to announcements of fixed-price than to announcements of Dutch auction self-tender offers. To investigatethat question, we compare pre-announcement Value Line forecasts with post-announcement Value Line forecasts for the two types of self-tender offers. Inthese tests, the pre-announcement Value Line forecasts are proxies for themarket’s pre-announcement expected earnings and the post-announcement
176 E. Lie, J.J. McConnell/Journal of Financial Economics 49 (1998) 161—186
Value Line forecasts are proxies for the market’s post-announcement expectedearnings.
Value Line publishes one-year and long-term earnings forecasts for a givenfirm every three months. We analyze both types of forecasts. We define thepre-announcement forecast as the last forecast published before the tender offerannouncement, and the post-announcement forecast as the first forecastpublished after the tender offer announcement, providing that the post-an-nouncement forecast was published at least five days after the tender offerannouncement. In those cases where the first post-announcement forecast waspublished within five days of the tender offer, the second post-announcementforecast is used as the post-announcement forecast to ensure that the forecastincludes information conveyed by the tender offer.
Value Line does not provide a forecast of EBDIT. Rather, Value Line givesa forecast of earnings after depreciation, interests and taxes (EAT). For ourpurposes, a deficiency with EAT is that it should decline following self-tenderoffers because of the way it is calculated. If assets are liquidated to finance therepurchase, EAT is reduced because of the lost income from those assets. If debtis used to finance the repurchase, EAT is reduced because of the incrementalinterest expense on the debt. Because the source of funds used to finance thetender offer cannot be determined, we estimate the expected reduction in EAT as
(Expected change in shares outstanding]Final tender price)]WACC,
(1)
where the expected change in shares outstanding is taken from Value Line andthe weighted average cost of capital (¼ACC) is calculated as:
Cost of debt](1!Expected tax rate)]Debt ratio
#Cost of equity](1!Debt ratio). (2)
The expected tax rate is taken from Value Line. The debt ratio is the book valueof debt divided by the sum of the book value of debt and the market value ofequity as of the year-end prior to the tender offer. For firm’s with outstandingpublicly traded bonds (69 firms), the cost of debt is measured as the weightedaverage yield to maturity of the firm’s outstanding bonds for the month prior tothe self-tender offer (collected from Moody’s Bond Guide). For all other firms,the bond yield on Baa corporate bonds at the time of the announcement is usedas the cost of debt. The cost of equity is estimated using the three-factor model ofFama and French (1993):
E(Ri)"R
f#b
i][E(R
m)!R
f]#s
i]E(SMB)#h
i]E(HM¸), (3)
where Rf
is the yield on the one-month T-bill as of the month of the tender offerannouncement, b
i, s
i, and h
iare estimated with OLS regression using CRSP
E. Lie, J.J. McConnell/Journal of Financial Economics 49 (1998) 161—186 177
monthly returns over the 60 months preceding the announcement, and[E(R
m)!R
f], E(SMB), and E(HM¸) are approximated by their respective
means over the ten years preceding the announcement.6Pre- and post-announcement Value Line forecasts are available for 74 fixed-
price and 79 Dutch auction self-tender offers. The mean (median) announce-ment-period CERs associated with these two samples are 7.2% (6.0%) and 6.8%(6.0%), respectively, and the p-value for the difference between the two is greaterthan 0.10. For these two samples, we repeat the analyses of Tables 2 and 3. Theresults are similar. In no case are the earnings improvements significantlydifferent between the samples of fixed-price and Dutch auction self-tender offers.
Table 4 presents the mean and median revisions in Value Line earningsforecasts from before to after the announcements for the two types of tenderoffers. Panel A gives the unadjusted revisions in EAT forecasts (i.e., the netincome without the adjustment for the lost earnings on liquidated assets and theincreased interest expense on debt) and panel B gives the revisions in adjustedEAT forecasts. The revisions in the Value Line forecasts are given as a percent-age of the pre-announcement Value Line forecast. As we noted, due to themechanical calculation of EAT, Value Line revisions to unadjusted EAT fore-casts are likely to be negative (assuming no other factors are at work in the data).In fact, that is the case: for both one-year and for long-term forecasts, Value Linerevisions to unadjusted EAT are significantly negative, but the difference inmean (median) revisions between the two types of tender offers is not significantat the 0.10 level.
As shown in panel B, on average, the adjusted EAT figures exhibit positiverevisions for both samples and for both one-year and long-term earnings fore-casts. None of the mean or median revisions are statistically significantly differentfrom zero at the 0.05 level; but both of the median revisions of the one-yearforecasts are significant at the 0.10 level. Thus, there is, at best, modest support forthe idea that Value Line revises its earnings forecasts upwards in response toself-tender offer announcements. However, as also reported in Table 4, neither themean nor median revisions in the forecasts of adjusted EAT is statisticallydifferent between fixed-price and Dutch auction self-tender offers for eitherone-year or long-term earnings forecasts (p-values all greater than 0.10).7
6The values for [(Rm)!R
f], SMB, and HM¸ were provided to us by Eugene Fama.
7The procedure for adjusting the earnings forecast in our Value Line analysis involves a host ofassumptions. We select parameters that would be biased toward rejecting the null hypothesis thatrevisions in earnings forecasts are zero. We also conduct numerous experiments with other para-meters and other ways of the adjusting the earnings forecast. For example, we also estimate the costof equity with the traditional Sharpe-Lintner CAPM, and we estimate the cost of debt as the annualinterest expense divided by the book value of debt outstanding. With none of the various experi-ments are we able to reject the null of no difference between the revisions in earnings for fixed-priceand Dutch auction self-tender offers.
178 E. Lie, J.J. McConnell/Journal of Financial Economics 49 (1998) 161—186
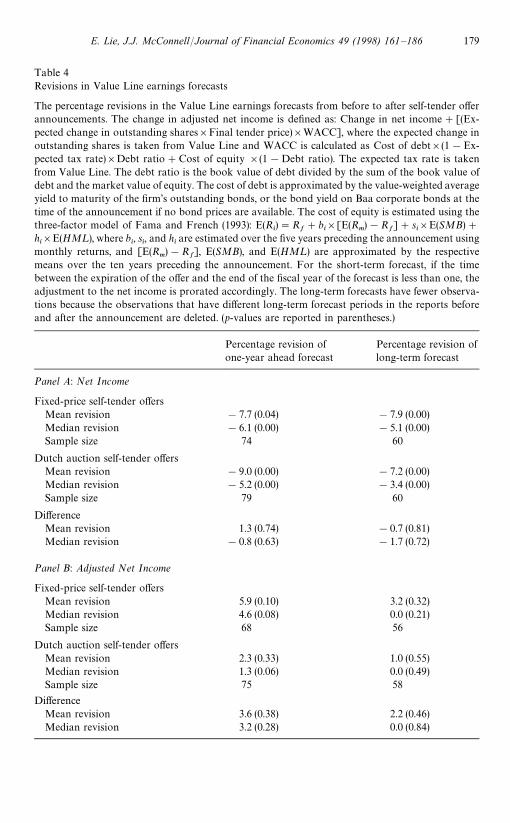
Table 4Revisions in Value Line earnings forecasts
The percentage revisions in the Value Line earnings forecasts from before to after self-tender offerannouncements. The change in adjusted net income is defined as: Change in net income#[(Ex-pected change in outstanding shares]Final tender price)]WACC], where the expected change inoutstanding shares is taken from Value Line and WACC is calculated as Cost of debt](1!Ex-pected tax rate)]Debt ratio#Cost of equity ](1!Debt ratio). The expected tax rate is takenfrom Value Line. The debt ratio is the book value of debt divided by the sum of the book value ofdebt and the market value of equity. The cost of debt is approximated by the value-weighted averageyield to maturity of the firm’s outstanding bonds, or the bond yield on Baa corporate bonds at thetime of the announcement if no bond prices are available. The cost of equity is estimated using thethree-factor model of Fama and French (1993): E(R
i)"R
f#b
i][E(R
m)!R
f]#s
i]E(SMB)#
hi]E(HM¸), where b
i, s
i, and h
iare estimated over the five years preceding the announcement using
monthly returns, and [E(Rm)!R
f], E(SMB), and E(HM¸) are approximated by the respective
means over the ten years preceding the announcement. For the short-term forecast, if the timebetween the expiration of the offer and the end of the fiscal year of the forecast is less than one, theadjustment to the net income is prorated accordingly. The long-term forecasts have fewer observa-tions because the observations that have different long-term forecast periods in the reports beforeand after the announcement are deleted. (p-values are reported in parentheses.)
Percentage revision of Percentage revision ofone-year ahead forecast long-term forecast
Panel A: Net Income
Fixed-price self-tender offersMean revision !7.7 (0.04) !7.9 (0.00)Median revision !6.1 (0.00) !5.1 (0.00)Sample size 74 60
Dutch auction self-tender offersMean revision !9.0 (0.00) !7.2 (0.00)Median revision !5.2 (0.00) !3.4 (0.00)Sample size 79 60
DifferenceMean revision 1.3 (0.74) !0.7 (0.81)Median revision !0.8 (0.63) !1.7 (0.72)
Panel B: Adjusted Net Income
Fixed-price self-tender offersMean revision 5.9 (0.10) 3.2 (0.32)Median revision 4.6 (0.08) 0.0 (0.21)Sample size 68 56
Dutch auction self-tender offersMean revision 2.3 (0.33) 1.0 (0.55)Median revision 1.3 (0.06) 0.0 (0.49)Sample size 75 58
DifferenceMean revision 3.6 (0.38) 2.2 (0.46)Median revision 3.2 (0.28) 0.0 (0.84)
E. Lie, J.J. McConnell/Journal of Financial Economics 49 (1998) 161—186 179
5. Sensitivity analysis
5.1. Alternative measures of performance
To investigate the robustness of the results in Tables 2 and 3, we consideredother measures of performance: (1) we standardized EBDIT by sales rather thanassets; (2) we standardized EBDIT by assets minus cash (which may give a betterindication of the size of the firm’s operating assets); (3) we used a cash-flowmeasure of EBDIT to mitigate any effects of earnings manipulation (Barber andLyon, 1996); and (4) we replicated the time-series analysis of Dann et al. (1991).The results (not reported) are similar to those in Tables 2 and 3. In no case didwe find a statistically significant difference in either the means or medians of thechange in performance from before to after the tender offer between firms thatundertook fixed-price self-tender offers and those that undertook Dutch auctionself-tender offers (all p-values'0.10).
5.2. Managers+ tendering behavior
Comment and Jarrell (1991) argue that the strength of the signal depends notonly on the type of self-tender offer, but also on whether managers tender theirshares and whether the offer provides a positive premium. Their argument isthat in such tender offers managers are ‘at risk’ if the tender offer is notaccompanied by an increase in earnings. In particular, they hypothesize that thesignal will be stronger in cases in which managers do not tender their shares andin which the minimum tender offer premium is at least 2%. If they are correct,we should control for whether managers tender their shares and for the level ofthe premium in comparing the two types of tender offers.
For our sample, we are able to determine definitively that managers tenderedshares in 18 of the fixed-price self-tender offers and in eight of the Dutch auctionself-tender offers. For 61 of the fixed-price tender offers and for 79 of the Dutchauction tender offers we can determine definitively that managers did not tender.For the remaining 51 fixed-price and 15 Dutch auction tender offers, we can findno information on whether managers tendered shares. We classify an offer as‘at risk’ if managers tendered and the minimum premium was at least 2%; allothers are classified as ‘not at risk’. Initially, we classify those cases in which wecannot determine whether managers tendered as cases in which they did nottender shares. Then, we exclude these cases and redo the tests.
Of the 112 fixed-price tender offers initially classified as offers in whichmanagers did not tender, earnings data are available for 99, of which the tenderpremium is at least 2% for all but eight, leaving 91 in which managers are‘at risk’. Of the 94 Dutch self-tender offers initially classified as tender offers inwhich managers did not tender, earnings data are available for 84, of which thetender premium is at least 2% in only 37.
180 E. Lie, J.J. McConnell/Journal of Financial Economics 49 (1998) 161—186
Based on our initial classification scheme, the announcement-period mean(median) CER of the fixed-price ‘at risk’ sample is 9.3% (8.5%); for the Dutchauction ‘at-risk’ sample it is 11.9% (10.3%) (p-value for the difference is 0.12(0.36)). Thus, based on the CERs, even for the at-risk samples, there is noevidence that fixed-price self-tender offers provide a stronger signal than doDutch auction self-tender offers.8
Also based upon the initial classification scheme, we replicate the earningsanalysis of Tables 2 and 3 for the two at-risk samples. The results (not shown)are nearly identical to those in Tables 2 and 3. In particular, neither differencesin the levels nor differences in the changes in the levels of industry-adjusted andperformance-adjusted mean and median ROAs between the two samples aresignificant at the 0.10 level. Furthermore, for both at risk samples, the perfor-mance-adjusted ROA indicates an improvement in earnings in year 0, but theother two benchmarks do not. The magnitudes of these statistics are almostidentical to those in Tables 2 and 3, but the statistical significance is lower,presumably because of the smaller samples.
We then delete those cases in which we can locate no information aboutwhether managers tendered, and recalculate the tests. The sample sizes forthe two at-risk samples are now 61 (fixed-price) and 37 (Dutch auction).The announcement-period mean (median) CERs of 9.5% (8.6%) and 11.3%(10.3%) for the two samples are not significantly different from each other (thep-value for the difference is 0.37 (0.53)). Similarly, none of the measures of ROAare significantly different between the two samples at the 0.10 level of signifi-cance.9
We also replicated the Value Line analysis for the fixed-price and Dutchauction samples in which managers were and were not at risk. Based on ourinitial classification scheme, there are 57 fixed-price and 33 Dutch auctiontender offers in which managers were at risk. For these samples, the results (notshown) are very similar to those in Table 4. After deleting cases in which wecannot determine definitively whether managers were at risk, the at-risk samplesizes are 35 and 31. Again, the results (not shown) are similar to those in Table 4.
5.3. Confounding news announcements
Comment and Jarrell (1991) report that the average announcement-periodexcess return is significantly higher for fixed-price self-tender offers than for
8We also calculated announcement period CERs for the two ’not-at-risk’ samples. The mean andmedian of the differences in CERs between the fixed-price and Dutch auction samples are notsignificant at the 0.10 level. Consistent with Comment and Jarrell, the mean and median announce-ment period CERs are higher for the ‘at-risk’ than for the ‘not-at-risk’ sample.
9All unreported results are available on request.
E. Lie, J.J. McConnell/Journal of Financial Economics 49 (1998) 161—186 181

Dutch auction self-tender offers, but only when they exclude offers with coinci-dent confounding news. To identify confounding news, we review the WSJ andthe DJNR service for confounding news within the five-day interval surroundingthe self-tender offer announcements. These include announcements related tocorporate control activity (14 offers), asset sales (12 offers), earnings forecasts(8 offers), asset purchases (5 offers) and other items (5 offers). Of these, 30 arefrom the fixed-price sample and 14 are from the Dutch auction sample. Theseoffers are deleted from the samples.
The mean (median) announcement-period CER of 10.2% (8.6%) is larger forthe fixed-price tender offers than is the mean (median) CER of 7.6% (6.2%) forthe Dutch auction tender offer and the difference is significant at the 0.05 level.However, when we replicate the earnings analysis of Tables 2 and 3 and theValue Line analysis of Table 4 for these samples, none of the differences betweenthe sample means or medians is significant at the 0.10 level.
5.4. Defensive versus non-defensive self-tender offers
Self-tender offers may be used to defend against hostile takeovers (Dann andDeAngelo, 1988; Stulz, 1988; Denis, 1990; and Bagwell, 1991). This motivationwas likely to have been especially prevalent during the late 1980s, whichwitnessed a particularly active market for corporate control (Comment andSchwert, 1995). This period includes a large portion of the self-tender offers inour sample. To investigate whether the inclusion of defensive self-tender offershas a consequential impact on our results, we repeated all of the analyses inTables 2—4, excluding defensive self-tender offers from the sample. We definea self-tender offer to be defensive if the announcement stated that the motivationfor the offer was to deter a takeover, or if there were takeover rumors in the WSJ,WSJI, or DJNR during the three months prior to the announcement. Sixteen ofthe 116 fixed-price and eight of the 91 Dutch auction self-tender offers in theearnings analysis are classified as defensive. For the samples in the Value Lineanalysis, 20 of the tender offers in the fixed-price sample and nine of the tenderoffers in the Dutch auction sample are classified as defensive. None of the resultsfor any of the tests is substantially changed when defensive self-tender offers aredeleted from the analyses.
5.5. Regression analysis
As a further test, we estimate a regression in which the dependent variable isthe change in performance-adjusted ROA from year !1 to year 0, and theindependent variables include an indicator variable identifying whether thetender offer was fixed-price or Dutch auction, an indicator variable to identifywhether management was ‘at risk’, and an indicator variable to identify whetherthe tender offer was defensive. Even after controlling for these factors, earnings
182 E. Lie, J.J. McConnell/Journal of Financial Economics 49 (1998) 161—186
performance is not significantly different between fixed-price and Dutch auctionself-tender offers. In fact, none of the coefficients is statistically significant at the0.10 level. We replicated the regression using the change in industry-adjustedperformance as the dependent variable, using other measures of change inperformance as the dependent variable, and measuring the change in perfor-mance over other intervals. In no case is the coefficient of the indicator variablefor fixed-price versus Dutch auction self-tender offers significant at the 0.10 level.
5.6. Multiple offers by the same company
In each of our analyses, we include some companies that have undertakenmore than one self-tender offer: 11 with two self-tender offers and four with threeself-tender offers. On average, these transactions were separated in time by 28.5months (median"20.5 months). It could be that either the first or a subsequentoffer provides a stronger signal, and rationales could be imagined for eitherfinding. If so, inclusion of the ‘weaker’ signal will reduce the ability of our tests toreject the null hypothesis. Initially, we include only the first tender offer bya firm. We then include the second offer for firms with multiple self-tender offers.We also devise a test in which the tender offer with the highest CER is used forfirms with multiple tender offers. For each set, we recalculate the tests ofTables 2—4. In no case is the difference between fixed-price and Dutch auctiontender offers for the various measures of ROA significant at the 0.10 level.
5.7. Correlation between earnings and excess returns
The earlier studies of self-tender offers (Hertzel and Jain, 1991 and Dann et al.,1991) not only document an improvement in average earnings, but also docu-ment a positive correlation between the improvement in earnings and excessstock returns. For completeness, we estimate this correlation for each type oftender offer. Regardless of the measure of earnings improvement employed, andregardless of the time interval over which excess returns are measured, we findno difference in the correlation between earnings improvement and excess stockreturns for the two types of tender offers. In fact, none of the correlationsbetween earnings improvements and excess stock returns for either sample issignificant at the 0.10 level.
6. Can the improvement in operating performance explain the excess stockreturns?
The improvement in operating performance following the self-tender offerannouncements in our sample appears modest. The obvious question is whetherthe magnitude of this improvement can possibly explain an average stock price
E. Lie, J.J. McConnell/Journal of Financial Economics 49 (1998) 161—186 183
increase of roughly 8%. To the extent that there is support for this proposition,it derives from the performance-adjusted ROA, which is roughly 2% in year 0,1% in year 1, and 0.5% per year thereafter. We use a simple numerical examplebased on the data from our sample to answer this question.
Suppose a firm has book value of assets of $100, total debt of $40, currentROA of 14%, a corporate tax rate of 40%, and a weighted average cost ofcapital of 12%. If the firm’s cash flow is approximated by its earnings after taxes,and the growth in cash flow is 3.3% per year, the firm’s total value is
Firm value"After-tax cash flow in year 1
Cost of capital!Growth in cash flow
"
0.14]$100](1!0.4)](1#0.033)
0.12!0.033+$100. (4)
Furthermore, the value of the equity equals $100!$40"$60.Suppose that the firm announces that it will repurchase 20% of its equity,
consistent with the actual figures for our sample. Further assume that thistransaction is to be financed entirely with debt. As a result, total debt increasesto $40#0.2]$60"$52. Moreover, assume that the weighted average cost ofcapital is unchanged by the repurchase and the change in leverage. Based uponthe performance-adjusted ROA in Table 2, suppose that the announcementsignals to the capital market that future operating performance will be higherthan previously expected, by 0.02 for the next fiscal year, by 0.01 for the fiscalyear two years from now, and by 0.005 for each fiscal year thereafter. Conse-quently, the firm’s value increases by
Increase in firm value"$2](1!0.4)
1.12#
$1](1!0.4)
1.122
#
$0.5](1!0.4)/0.12
1.122"$3.54. (5)
Moreover, the value of the equity following the announcement increases as
New equity value"New firm value!Total debt after repurchase
#Payout to equityholders
"$103.54!$52#$12"$63.54. (6)
The increase in value of equity is $3.54/$60"5.9%, a number consistent withvarious CERs calculated for our sample. Thus, the documented earnings im-provement, though modest, can justify an announcement-period CER of themagnitude observed for our sample.
184 E. Lie, J.J. McConnell/Journal of Financial Economics 49 (1998) 161—186
7. Conclusion
Prior investigations of fixed-price corporate self-tender offers indicate that:(1) fixed-price self-tender offers undertaken during the 1960s and 1970s wereassociated with positive and statistically significant announcement-period ex-cess stock returns of roughly 16%; (2) the tender offers were accompanied by animprovement in firms’ operating performance; and (3) announcement-periodexcess stock returns were correlated with the improvement in operating perfor-mance. One popular interpretation of this evidence is that the excess stockreturns are the result of a signal about future earnings that is conveyed by theself-tender offer announcement.
Dutch auction self-tender offers were introduced in 1981 and have since becomethe predominant form of self-tender offer. Several authors argue that the signal infixed-price self-tender offers should be stronger than the signal in Dutch auctionself-tender offers. We investigate that question empirically with large samples offixed-price and Dutch auction self-tender offers that took place between 1981 and1994. We find no difference in announcement-period excess stock returns betweenthe two types of self-tender offers (both are about 8%), and we find no difference inearnings improvement between the two types of offers. Indeed, for two of threebenchmarks, historical earnings and industry-adjusted earnings, we can detect noimprovement in earnings for firms that conduct either type of self-tender offer.However, we do find that both sets of firms exhibit superior earnings performancein comparison with an own-industry benchmark prior to the self-tender offers. Incircumstances such as these, Barber and Lyon (1996) argue that the appropriateprocedure for judging whether operating performance is ‘abnormal’ is the con-struction of a benchmark of firms with similarly superior performance prior to theevent in question. When we use such a performance-based benchmark, we findthat firms in both sets of tender offers exhibit superior performance during theyear of the tender offer. Firms that undertake self-tender offers exhibit slowermean reversion in their operating performance than does the ‘typical’ firm in thesame circumstances. Furthermore, a numerical example based upon the magni-tude of the earnings ‘surprise’ indicates that the observed ‘improvement’ couldsustain an excess stock return of the size observed. If there is an earnings signal inself-tender offers during the 1980s and early 1990s, it is that such firms willcontinue to exhibit superior performance longer than might otherwise have beenexpected, but, even on this basis, there is no difference in operating performancebetween firms that undertake fixed-price self-tender offers and firms that under-take Dutch auction self-tender offers. Consistent with our analysis of earnings, ananalysis of Value Line earnings forecasts gives no indication that the revisions inits earnings forecasts differ between the two types of self-tender offers. If self-tenderoffers signal an improvement in earnings, the data analyzed here indicate thatthere is no difference in the strength of the signal for fixed-price and Dutch auctionself-tender offers.
E. Lie, J.J. McConnell/Journal of Financial Economics 49 (1998) 161—186 185
References
Bagwell, L.S., 1991. Share repurchase and takeover deterrence. Rand Journal of Economics 22,72—88.
Bagwell, L.S., 1992. Dutch auction repurchases: an analysis of shareholder heterogeneity. Journal ofFinance 47, 71—105.
Barber, B.M., Lyon, J.D., 1996. Detecting abnormal operating performance: the empirical powerand specification of test-statistics. Journal of Financial Economics 41, 359—399.
Comment, R., Jarrell, G.A., 1991. The relative signaling power of Dutch-auction and fixed-priceself-tender offers and open-market share repurchases. Journal of Finance 46, 1243—1271.
Comment, R., Schwert, G.W., 1995. Poison or placebo? Evidence on the deterrence and wealtheffects of modern takeover measures. Journal of Financial Economics 39, 3—43.
Dann, L.Y., 1981. Common stock repurchases: an analysis of returns to bondholders and stock-holders. Journal of Financial Economics 9, 113—138.
Dann, L.Y., DeAngelo, H., 1988. Corporate financial policy and corporate control: a study ofdefensive adjustments in asset and ownership structure. Journal of Financial Economics 20,87—127.
Dann, L.Y., Masulis, R.W., Mayers, D., 1991. Repurchase tender offers and earnings information.Journal of Accounting and Economics 14, 217—251.
Denis, D.J., 1990. Defensive changes in corporate payout policy: share repurchases and specialdividends. Journal of Finance 45, 1433—1456.
Fama, E.F., French, K.R., 1993. Common risk factors in the returns on stocks and bonds. Journal ofFinancial Economics 33, 3—56.
Hertzel, M., Jain, P.C., 1991. Earnings and risk changes around stock repurchase tender offers.Journal of Accounting and Economics 14, 253—274.
Howe, K.M., He, J., Kao, G.W., 1992. One-time cash flow announcements and free cash-flow theory:share repurchases and special dividends. Journal of Finance 47, 1963—1975.
Jain, B.A., Kini, O., 1994. The post-issue operating performance of IPO firms. Journal of Finance 49,1699—1726.
Lee, D.S., Mikkelson, W.H., Partch, M.M., 1992. Managers’ trading around stock repurchases.Journal of Finance 47, 1947—1961.
Linn, S.C., McConnell, J.J., 1983. An empirical investigation of the impact of antitakeover amend-ments on common stock prices. Journal of Financial Economics 11, 361—399.
Loughran, T., Ritter, J.R., 1996. The operating performance of firms conducting seasoned equityofferings. Working paper, University of Iowa.
Masulis, R.W., 1980. Stock repurchase by tender offer: an analysis of the causes of common stockprice changes. Journal of Finance 35, 305—319.
Persons, J.C., 1994. Signaling and takeover deterrence with stock repurchases: Dutch auctionsversus fixed price tender offers. Journal of Finance 49, 1373—1402.
Stulz, R.M., 1988. Managerial control of voting rights: financing policies and the market forcorporate control. Journal of Financial Economics 20, 25—54.
Vermaelen, T., 1981. Common stock repurchases and market signaling: an empirical study. Journalof Financial Economics 9, 139—183.
Weston, J.F., Copeland, T.E., 1992. Managerial Finance. 9th Ed, Harcourt, Brace and Jovanovich,New York.
186 E. Lie, J.J. McConnell/Journal of Financial Economics 49 (1998) 161—186