earth and environmental science - board of · pdf fileearth and environmental science 2040...
TRANSCRIPT

Earth and EnvironmentalScience
2040
2012H I G H E R S C H O O L C E R T I F I C AT E
E X A M I N AT I O N
General Instructions
• Reading time – 5 minutes
• Working time – 3 hours
• Write using black or blue penBlack pen is preferred
• Draw diagrams using pencil
• Board-approved calculators maybe used
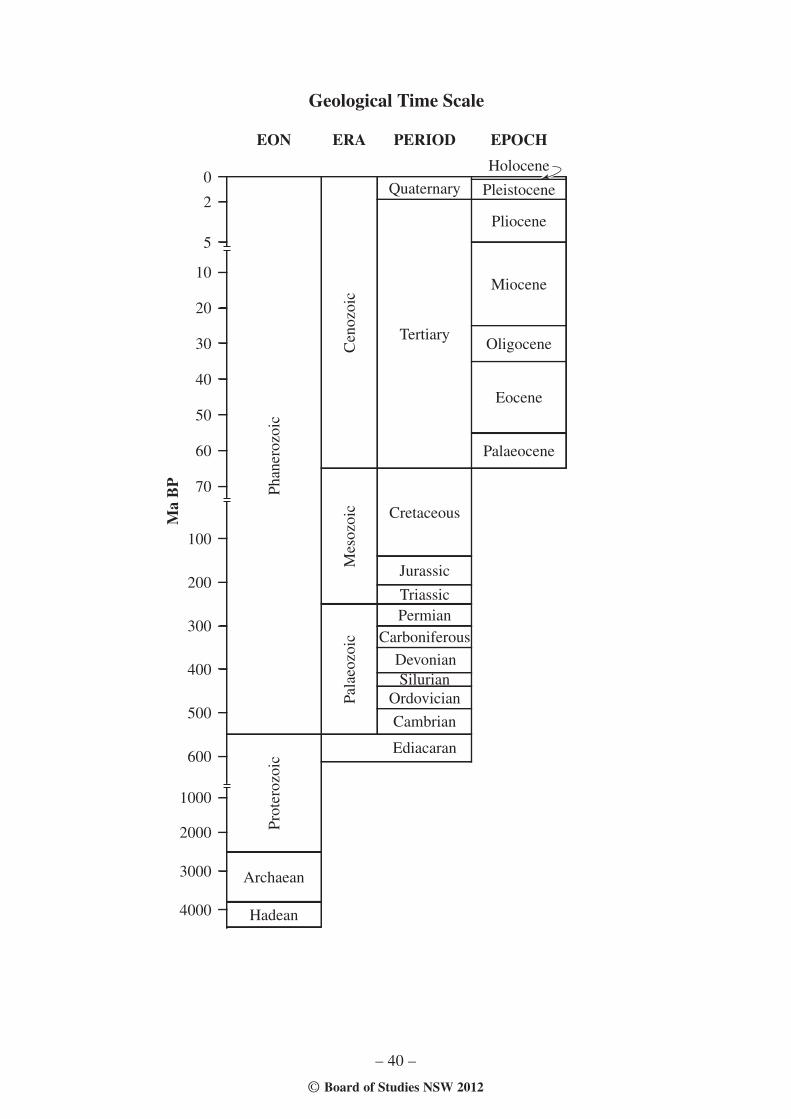
• A Geological Time Scaleis provided at the back of thispaper
• Write your Centre Number andStudent Number at the top ofpages 13, 17, 19, 21, 23, 25and 27
Total marks – 100
Pages 2–28
75 marks
This section has two parts, Part A and Part B
Part A – 20 marks
• Attempt Questions 1–20
• Allow about 35 minutes for this part
Part B – 55 marks
• Attempt Questions 21–31
• Allow about 1 hour and 40 minutes for this part
Pages 29–39
25 marks
• Attempt ONE question from Questions 32–35
• Allow about 45 minutes for this section
Section II
Section I
Section I75 marks
Part A – 20 marksAttempt Questions 1–20Allow about 35 minutes for this part
Use the multiple-choice answer sheet for Questions 1–20.
1 Why are there no active volcanoes on the Australian continent?
(A) The Australian continent is not located near any plate boundaries.
(B) Australian earthquakes are not intense enough to generate magma.
(C) Conservative plate boundaries are not usually associated with volcanic activity.
(D) The ancient cratons of western and central Australia are resistant to volcanicactivity.
2 Which products of a volcanic eruption are most likely to result in a decrease in globaltemperature?
(A) Lahars
(B) Lava flows
(C) Carbon dioxide emissions
(D) Sulphur dioxide emissions
– 2 –

– 3 –
3 The cross-section shows the tectonic setting of the Australian continent.
If the tectonic processes shown continue unchanged into the future, which of thefollowing will be the most likely outcome?
(A) The widening of the Timor Sea
(B) The growth of a new continent at the Indian-Pacific Ridge
(C) The closing of the ocean between Australia and Antarctica
(D) The formation of fold mountains at the northern edge of the Australian continent
Awaiting Copyright

4 The map shows areas of volcanic activity in Australia over the past 40 million years.
What is the cause of the volcanic activity shown?
(A) Movement over a hotspot
(B) Spreading at an old mid-ocean ridge
(C) Cratonisation of the Australian continent
(D) Subduction at an ocean–continent convergent plate boundary
5 Which row in the table correctly describes the magma composition and rock type formedat convergent and divergent plate boundaries?
Convergent plate boundaries Divergent plate boundaries
Magma composition Rock type Magma composition Rock type
Silica rich Granite Mg and Fe rich Gabbro
Mg and Fe rich Rhyolite Silica rich Basalt
Silica rich Gabbro Mg and Fe rich Granite
Mg and Fe rich Basalt Silica rich Rhyolite
(A)
(B)
(C)
(D)
– 4 –
Awaiting Copyright

– 5 –
6 The map shows the location of the Pacific Plate in relation to surrounding plates. Thedirection of motion of some plates is shown.
Which is the best tectonic model for the boundary located at X?
PacificPlate
SouthAmerican
Plate
North American Plate
Antarctic Plate
KeyPlate motion
X
N
(C)
(B)
(D)
(A)
KeyCold current Warm current
Mantle
Core
Mantle
Core
Mantle
Core
Mantle
Core

7 How is the recent disappearance of the Australian megafauna best described?
(A) Single species extinction
(B) Catastrophic extinction
(C) Small extinction
(D) Mass extinction
8 What is the name given to the changes in life forms at the end of the Proterozoic Eon?
(A) The K–T extinction
(B) The Cambrian event
(C) The conquest of land
(D) The Permian–Triassic extinction
9 Which of the following describes the evolutionary changes that occurred at the beginningof the Phanerozoic Eon?
(A) Vertebrates colonised land.
(B) Seed-bearing plants appeared.
(C) Aquatic invertebrates became the dominant animals.
(D) Giant reptiles evolved and dominated terrestrial environments.
10 The organism Dickinsonia costata lived 565 million years ago and the organismPliomerops canadensis lived 450 million years ago.
Which row in the table correctly identifies the difference between the organisms?
Dickinsonia costata Pliomerops canadensis
Carnivorous Herbivorous
Aquatic Terrestrial
Soft-bodied Hard-shelled
Free-swimming plankton Marine bottom dweller
(A)
(B)
(C)
(D)
– 6 –
– 7 –
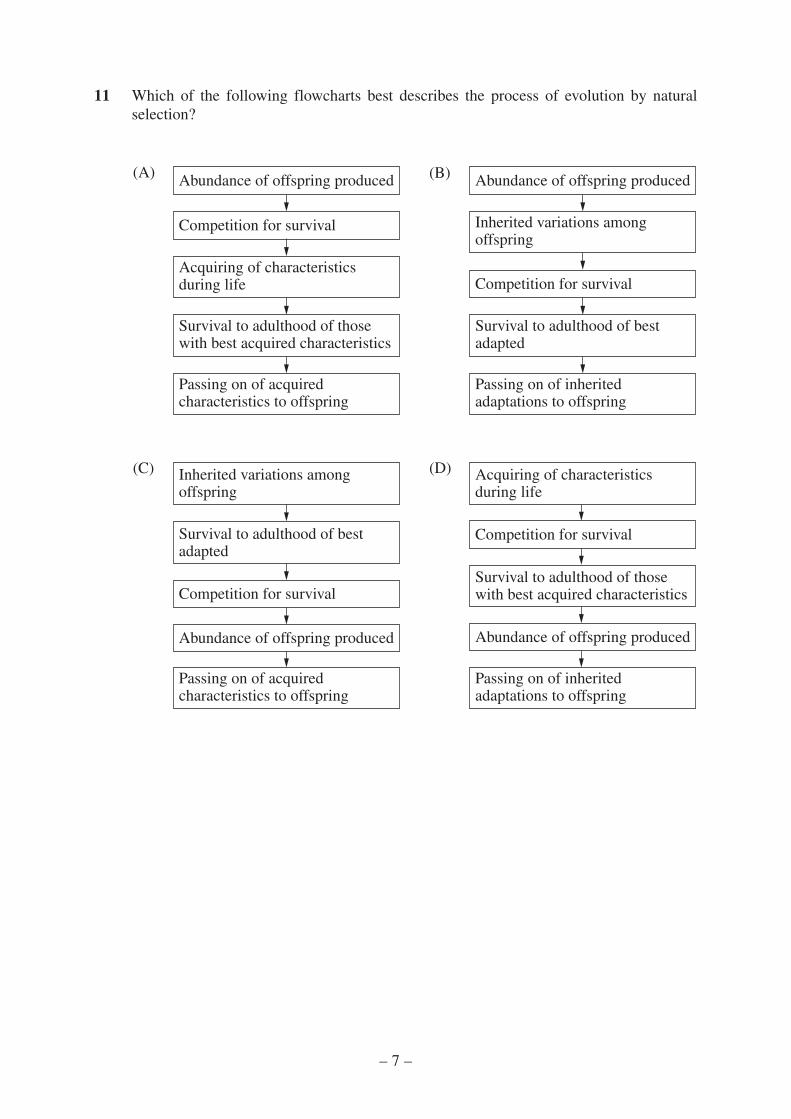
11 Which of the following flowcharts best describes the process of evolution by naturalselection?
(A) Abundance of offspring produced
Competition for survival
Acquiring of characteristicsduring life
Survival to adulthood of thosewith best acquired characteristics
Passing on of acquired characteristics to offspring
(B) Abundance of offspring produced
Inherited variations amongoffspring
Competition for survival
Survival to adulthood of bestadapted
Passing on of inheritedadaptations to offspring
(C) Inherited variations amongoffspring
Survival to adulthood of bestadapted
Competition for survival
Abundance of offspring produced
Passing on of acquired characteristics to offspring
(D) Acquiring of characteristicsduring life
Competition for survival
Survival to adulthood of thosewith best acquired characteristics
Abundance of offspring produced
Passing on of inheritedadaptations to offspring

12 In the diagram X, Y and Z are fossils within a stratigraphic sequence. Fossil Y is Triassicin age.
Which row in the table does NOT show possible relative ages for the fossils X and Z?
13 The ratio of the two stable isotopes of carbon, C-13 : C-12, is 1: 89.91 in the non-livingenvironment.
Which of the following C-13 : C-12 ratios indicates that carbon in an ancient rock camefrom a fossilised organism?
(A) 1: 50.00
(B) 1: 79.23
(C) 1: 89.91
(D) 1: 95.12
ZZ
YY
XX
228 Ma
Key
226 Ma
320 Ma
Granite
SiltstoneSandstone
Volcanic ash
Schist
X Z
Triassic Triassic
Devonian Tertiary
Carboniferous Cretaceous
Permian Jurassic
(A)
(B)
(C)
(D)
– 8 –
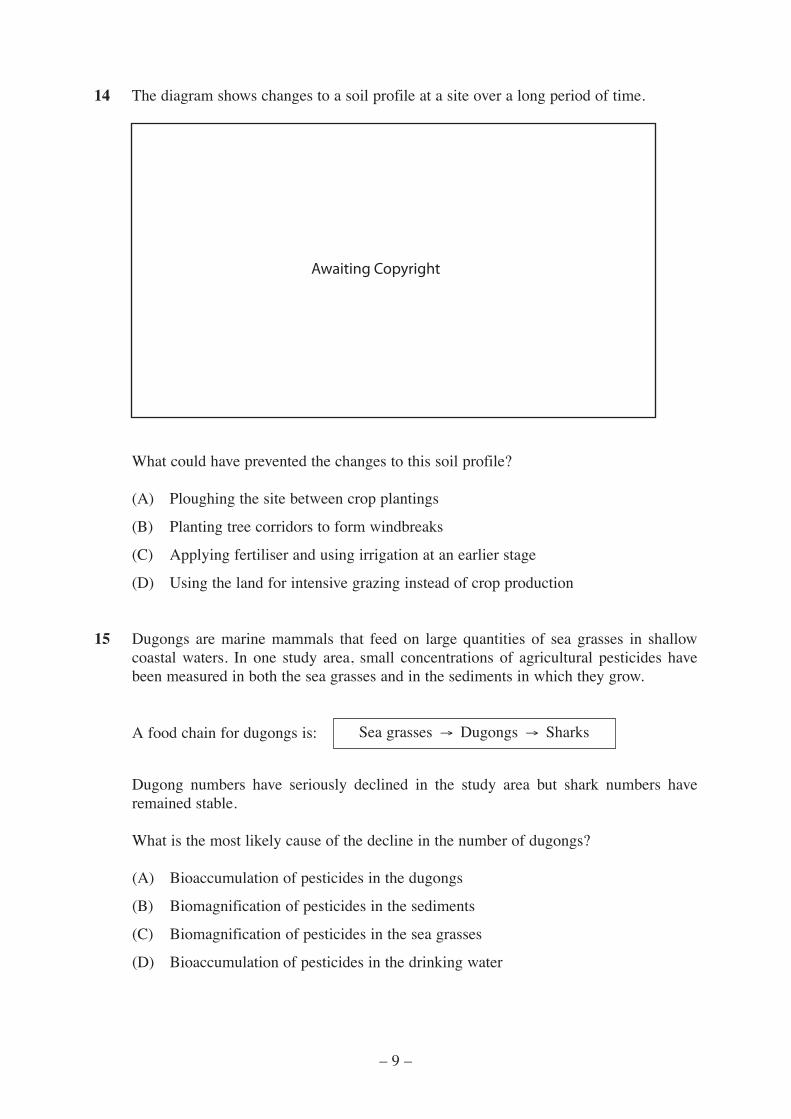
14 The diagram shows changes to a soil profile at a site over a long period of time.
What could have prevented the changes to this soil profile?
(A) Ploughing the site between crop plantings
(B) Planting tree corridors to form windbreaks
(C) Applying fertiliser and using irrigation at an earlier stage
(D) Using the land for intensive grazing instead of crop production
15 Dugongs are marine mammals that feed on large quantities of sea grasses in shallowcoastal waters. In one study area, small concentrations of agricultural pesticides havebeen measured in both the sea grasses and in the sediments in which they grow.
A food chain for dugongs is:
Dugong numbers have seriously declined in the study area but shark numbers haveremained stable.
What is the most likely cause of the decline in the number of dugongs?
(A) Bioaccumulation of pesticides in the dugongs
(B) Biomagnification of pesticides in the sediments
(C) Biomagnification of pesticides in the sea grasses
(D) Bioaccumulation of pesticides in the drinking water
Sea grasses → Dugongs → Sharks
– 9 –
Awaiting Copyright

16 During high temperature combustion, nitrogen reacts with oxygen to form nitrogendioxide which then combines with water in the atmosphere.
What is the result of these processes?
(A) Formation of acid rain
(B) Increased global temperatures
(C) Destruction of the ozone layer
(D) Depletion of nutrients in rivers
17 What is the major reason for the low fertility of most Australian soils?
(A) Low rainfall
(B) Type of parent rock
(C) Elevated soil temperature
(D) Geological stability over a long period
18 A lateritic soil is usually
(A) a rusty-red soil formed by prolonged weathering.
(B) an alluvial soil deposited by rivers on flood plains.
(C) a coarse-grained sandy soil derived from sandstone.
(D) a black soil found in areas which have had recent volcanic activity.
– 10 –
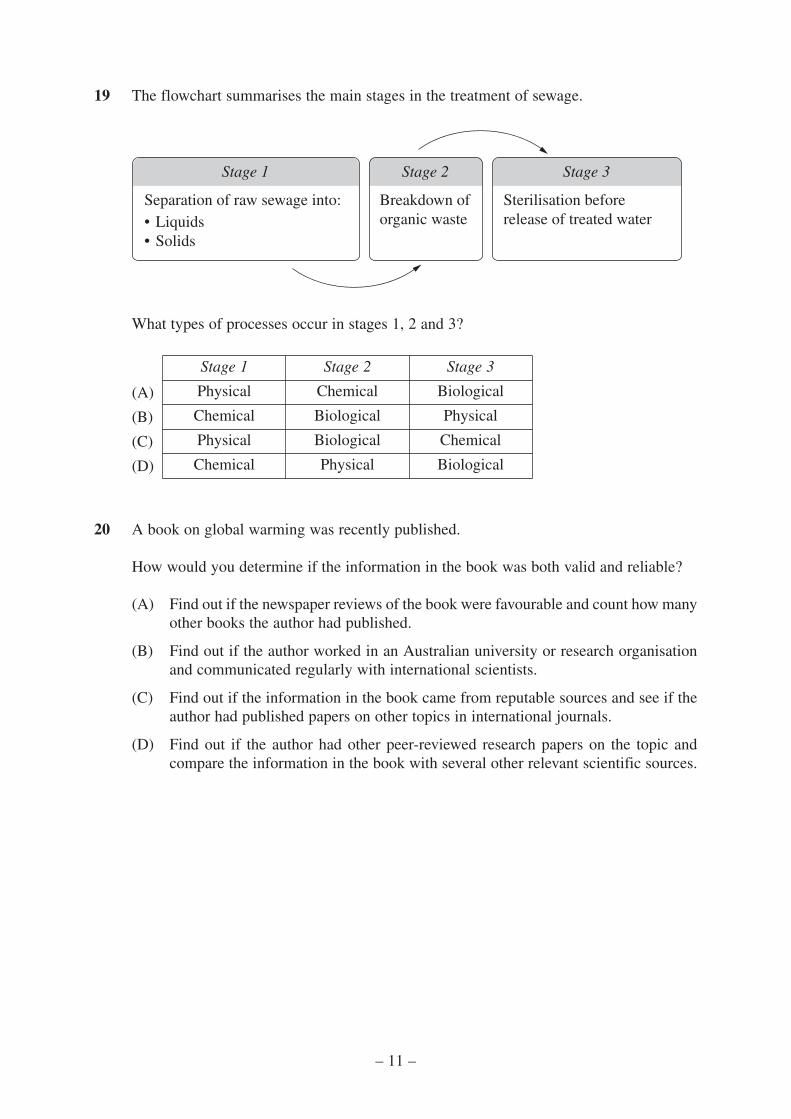
19 The flowchart summarises the main stages in the treatment of sewage.
What types of processes occur in stages 1, 2 and 3?
20 A book on global warming was recently published.
How would you determine if the information in the book was both valid and reliable?
(A) Find out if the newspaper reviews of the book were favourable and count how manyother books the author had published.
(B) Find out if the author worked in an Australian university or research organisationand communicated regularly with international scientists.
(C) Find out if the information in the book came from reputable sources and see if theauthor had published papers on other topics in international journals.
(D) Find out if the author had other peer-reviewed research papers on the topic andcompare the information in the book with several other relevant scientific sources.
Stage 1 Stage 2 Stage 3
Physical Chemical Biological
Chemical Biological Physical
Physical Biological Chemical
Chemical Physical Biological
(A)
(B)
(C)
(D)
Separation of raw sewage into:• Liquids• Solids
Stage 1
Breakdown of organic waste
Stage 2
Sterilisation before release of treated water
Stage 3
– 11 –

BLANK PAGE
– 12 –
© Board of Studies NSW 2012

2012 HIGHER SCHOOL CERTIFIC ATE EXAMINATION
Earth and Environmental Science
Section I (continued)
Part B – 55 marksAttempt Questions 21–31Allow about 1 hour and 40 minutes for this part
Answer the questions in the spaces provided. These spaces provide guidance for the expectedlength of response.
Question 21 (4 marks)
The cross-sections show two mountain belts. Complete the table to contrast these twomountain belts.
4
Mountain belt A Mountain belt B
Type of faultshown
Type of plateboundary
Direction offorces
One localitywhere found
– 13 –2041
Centre Number
Student Number
Awaiting Copyright

Question 22 (7 marks)
Table 1 and Table 2 give information on earthquakes.
Question 22 continues on page 15
– 14 –
Awaiting Copyright

Question 22 (continued)
(a) Propose one reason why three of the largest Australian earthquakes occurred atthe same location (Burakin, WA).
...............................................................................................................................
...............................................................................................................................
(b) Account for the differences in earthquake magnitude and fatalities between thetwo tables.
...............................................................................................................................
...............................................................................................................................
...............................................................................................................................
...............................................................................................................................
...............................................................................................................................
...............................................................................................................................
(c) Why should Australian scientists continue to research earthquakes given thatnone of the large Australian earthquakes from 2001 to 2007 resulted in anyfatalities?
...............................................................................................................................
...............................................................................................................................
...............................................................................................................................
...............................................................................................................................
...............................................................................................................................
...............................................................................................................................
End of Question 22
1
3
3
– 15 –
BLANK PAGE
– 16 –
© Board of Studies NSW 2012

2012 HIGHER SCHOOL CERTIFICATE EXAMINATION
Earth and Environmental Science
Section I – Part B (continued)
Question 23 (5 marks)
The table gives information on the depth and location of five earthquakes near theTonga Trench in the southwest Pacific Ocean.
(a) The positions of five additional earthquakes have been plotted on the graphbelow. Complete the graph by plotting the positions of the earthquakes given inthe table.
Question 23 continues on page 18
700
600
500
400
300
Focu
s de
pth
(km
) 200
100
0X X
180 179 178 177 176 175Longitude (°W) Tonga Trench
174 173 172 171 170
Sea floor
XX
X
Focus depth (km) Longitude (°W)
270 176.2
590 178.8
350 177.0
650 179.2
460 177.8
2
– 17 –2042
Centre Number
Student Number
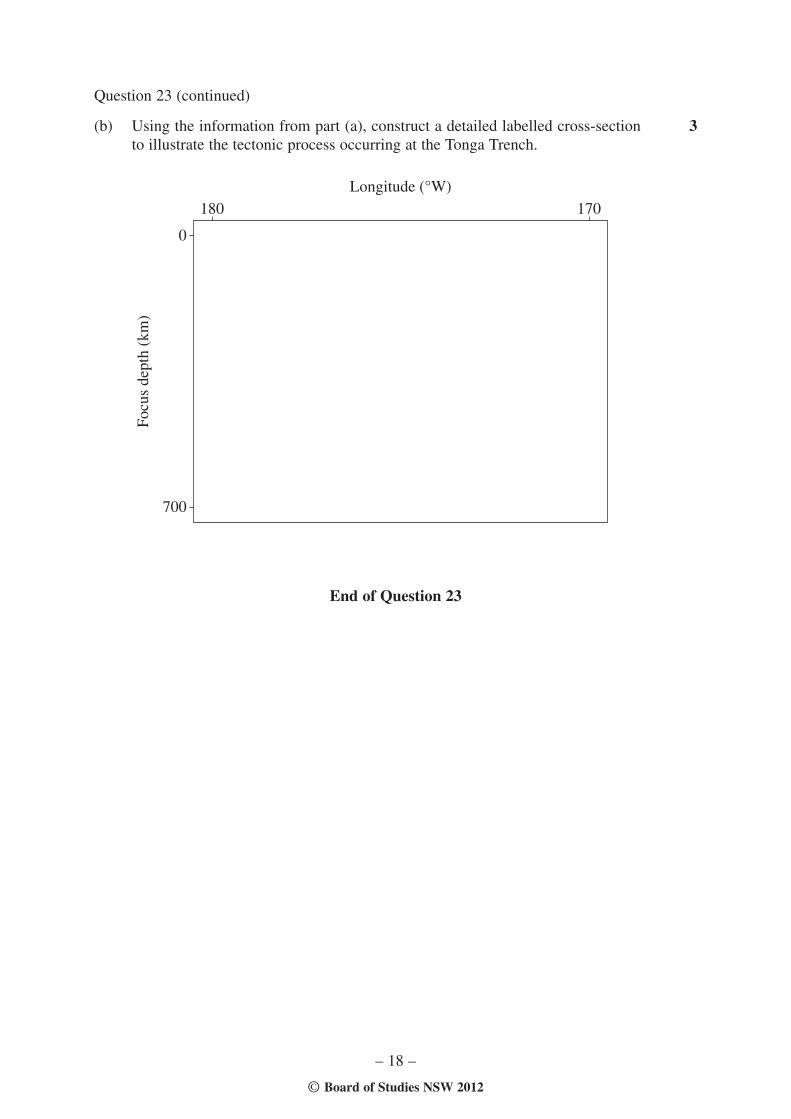
Question 23 (continued)
(b) Using the information from part (a), construct a detailed labelled cross-sectionto illustrate the tectonic process occurring at the Tonga Trench.
End of Question 23
180Longitude (°W)
170
700
Focu
s de
pth
(km
)
0
3
– 18 –
© Board of Studies NSW 2012
– 19 –XXX
2012 HIGHER SCHOOL CERTIFIC ATE EXAMINATION
Earth and Environmental Science
Section I – Part B (continued)
Question 24 (5 marks)
The graph shows changes in the number of genera of marine animals over the last550 Ma of Earth’s history.
(a) What events do the arrows represent?
...............................................................................................................................
Question 24 continues on page 20
1
2043
Centre Number
Student Number
Awaiting Copyright

Question 24 (continued)
(b) Choose one of the events in the graph and contrast TWO hypotheses that havebeen proposed to explain the event.
Event: ....................................................................................................................
...............................................................................................................................
...............................................................................................................................
...............................................................................................................................
...............................................................................................................................
...............................................................................................................................
...............................................................................................................................
...............................................................................................................................
...............................................................................................................................
End of Question 24
4
– 20 –
© Board of Studies NSW 2012

2012 HIGHER SCHOOL CERTIFICATE EXAMINATION
Earth and Environmental Science
Section I – Part B (continued)
Question 25 (4 marks)
(a) Describe the diversity and numbers of organisms at a fossil site you havestudied.
Fossil site: .............................................................................................................
...............................................................................................................................
...............................................................................................................................
...............................................................................................................................
...............................................................................................................................
(b) Using the information in part (a), explain what you have learnt about the natureof the site at the time the fossils formed.
...............................................................................................................................
...............................................................................................................................
...............................................................................................................................
...............................................................................................................................
2
2
– 21 –2044
Centre Number
Student Number
Question 26 (4 marks)
Stromatolites are abundant and widespread in the fossil record of the Archaean andProterozoic Eons.
(a) Identify the organism responsible for the formation of stromatolites.
...............................................................................................................................
(b) Account for differences in the occurrence of modern stromatolites compared tothat of the fossil forms.
...............................................................................................................................
...............................................................................................................................
...............................................................................................................................
...............................................................................................................................
...............................................................................................................................
...............................................................................................................................
Question 27 (3 marks)
Name ONE evolutionary advance made by early plants and explain how it helpedthem to spread into the terrestrial environment.
.........................................................................................................................................
.........................................................................................................................................
.........................................................................................................................................
.........................................................................................................................................
.........................................................................................................................................
.........................................................................................................................................
1
3
3
– 22 –
© Board of Studies NSW 2012

2012 HIGHER SCHOOL CERTIFIC ATE EXAMINATION
Earth and Environmental Science
Section I – Part B (continued)
Question 28 (7 marks)
The map shows grazing and crop-growing land in Australia.
(a) Explain how ONE agricultural practice could cause land degradation in theareas identified as being at risk.
...............................................................................................................................
...............................................................................................................................
...............................................................................................................................
...............................................................................................................................
...............................................................................................................................
...............................................................................................................................
Question 28 continues on page 24
3
– 23 –2045
Centre Number
Student Number
Awaiting Copyright
Question 28 (continued)
(b) Propose a management plan that could be used to minimise the damage youdescribed in part (a). Justify your plan.
...............................................................................................................................
...............................................................................................................................
...............................................................................................................................
...............................................................................................................................
...............................................................................................................................
...............................................................................................................................
...............................................................................................................................
...............................................................................................................................
End of Question 28
4
– 24 –
© Board of Studies NSW 2012

2012 HIGHER SCHOOL CERTIFICATE EXAMINATION
Earth and Environmental Science
Section I – Part B (continued)
Question 29 (5 marks)
Please turn over
– 25 –2046
Centre Number
Student Number
Question 29 (5 marks)
The table summarises a range of pest management practices that are available for usein the banana industry. The banana industry currently relies heavily on pesticides.
Rating scale for effectiveness of management practice:E = excellent (>90% control) G = good (75–90% control)P = poor (<75% control) – = has no effect
Use the information in the table to design an integrated pest-management strategy forbanana growers that would minimise the impact of pesticides on the environment.Justify this strategy.
.........................................................................................................................................
.........................................................................................................................................
.........................................................................................................................................
.........................................................................................................................................
.........................................................................................................................................
.........................................................................................................................................
.........................................................................................................................................
.........................................................................................................................................
.........................................................................................................................................
.........................................................................................................................................
5
– 26 –© Board of Studies NSW 2012
Awaiting Copyright
2012 HIGHER SCHOOL CERTIFICATE EXAMINATION
Earth and Environmental Science
Section I – Part B (continued)
Question 30 (4 marks)
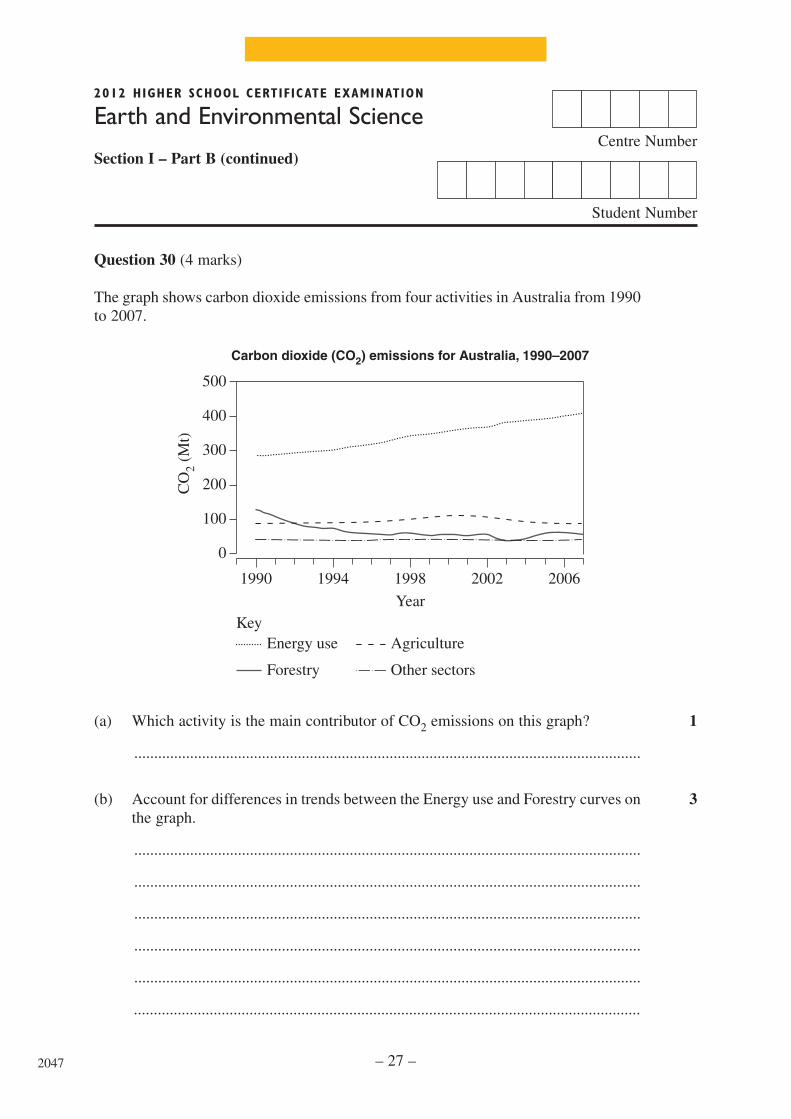
The graph shows carbon dioxide emissions from four activities in Australia from 1990to 2007.
(a) Which activity is the main contributor of CO2 emissions on this graph?
...............................................................................................................................
(b) Account for differences in trends between the Energy use and Forestry curves onthe graph.
...............................................................................................................................
...............................................................................................................................
...............................................................................................................................
...............................................................................................................................
...............................................................................................................................
...............................................................................................................................
1990 1994 1998 2002 2006
0
100
200
300
400
500
CO
2 (M
t)
YearKey
Energy use
Forestry
Agriculture
Other sectors
Carbon dioxide (CO2) emissions for Australia, 1990–2007
1
3
– 27 –2047
Centre Number
Student Number

Question 31 (7 marks)
Evaluate how advances in knowledge in the field of earth and environmental sciencehave given us a better understanding of the evolution of our continent and challengeus to use our resources more sustainably. Give examples in your answer.
.........................................................................................................................................
.........................................................................................................................................
.........................................................................................................................................
.........................................................................................................................................
.........................................................................................................................................
.........................................................................................................................................
.........................................................................................................................................
.........................................................................................................................................
.........................................................................................................................................
.........................................................................................................................................
.........................................................................................................................................
.........................................................................................................................................
.........................................................................................................................................
.........................................................................................................................................
.........................................................................................................................................
.........................................................................................................................................
.........................................................................................................................................
.........................................................................................................................................
.........................................................................................................................................
.........................................................................................................................................
.........................................................................................................................................
.........................................................................................................................................
.........................................................................................................................................
.........................................................................................................................................
.........................................................................................................................................
.........................................................................................................................................
7
– 28 –
© Board of Studies NSW 2012
2012 HIGHER SCHOOL CERTIFICATE EXAMINATION
Earth and Environmental Science
Section II
25 marksAttempt ONE question from Questions 32–35Allow about 45 minutes for this section
Answer parts (a)–(c) of the question in Section II Answer Booklet 1.Answer parts (d)–(e) of the question in Section II Answer Booklet 2.Extra writing booklets are available.
Pages
Question 32 Introduced Species and the Australian Environment ........... 31–33
Question 33 Organic Geology – a Non-renewable Resource .................. 34–35
Question 34 Mining and the Australian Environment ............................. 36–37
Question 35 Oceanography ...................................................................... 38–39
– 29 –2048

BLANK PAGE
– 30 –
Question 32 — Introduced Species and the Australian Environment (25 marks)
Answer parts (a)–(c) in Section II Answer Booklet 1.
(a) (i) Define the term introduced species.
(ii) Recent research has shown that dingoes arrived in Australia some timebetween 4 600 and 18 300 years ago. At present, there is debate aboutwhether the dingo should be classified as a native or introduced species.Give ONE reason for each viewpoint.
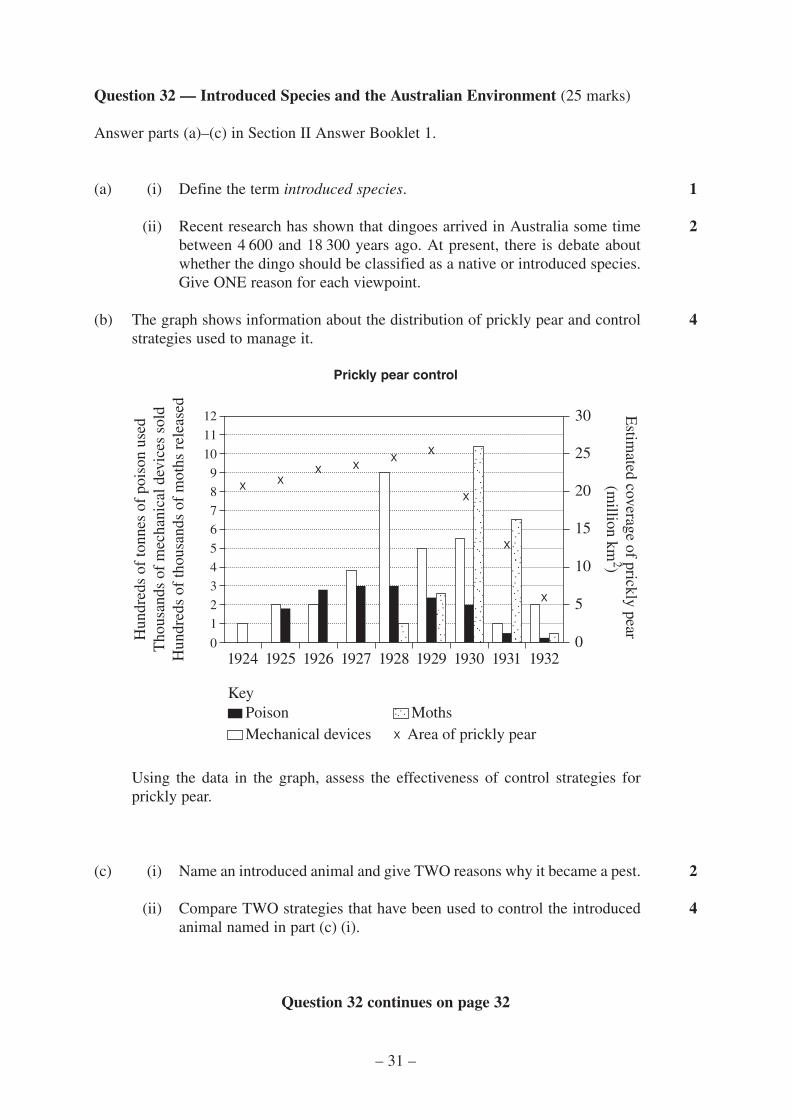
(b) The graph shows information about the distribution of prickly pear and controlstrategies used to manage it.
Prickly pear control
Using the data in the graph, assess the effectiveness of control strategies forprickly pear.
(c) (i) Name an introduced animal and give TWO reasons why it became a pest.
(ii) Compare TWO strategies that have been used to control the introducedanimal named in part (c) (i).
Question 32 continues on page 32
1
2
4
1924
Key
Hun
dred
s of
tonn
es o
f po
ison
use
dT
hous
ands
of
mec
hani
cal d
evic
es s
old
Hun
dred
s of
thou
sand
s of
mot
hs r
elea
sed
1925 1926 1927 1928 1929 1930 1931
Estim
ated coverage of prickly pear (m
illion km2)
1932
2
1
0 0
5
10
15
20
25
30
3
4
5
6
7
8
9
10
11
12
Area of prickly pearPoisonMechanical devices
Moths
2
4
– 31 –
Question 32 (continued)
Answer parts (d)–(e) in Section II Answer Booklet 2.
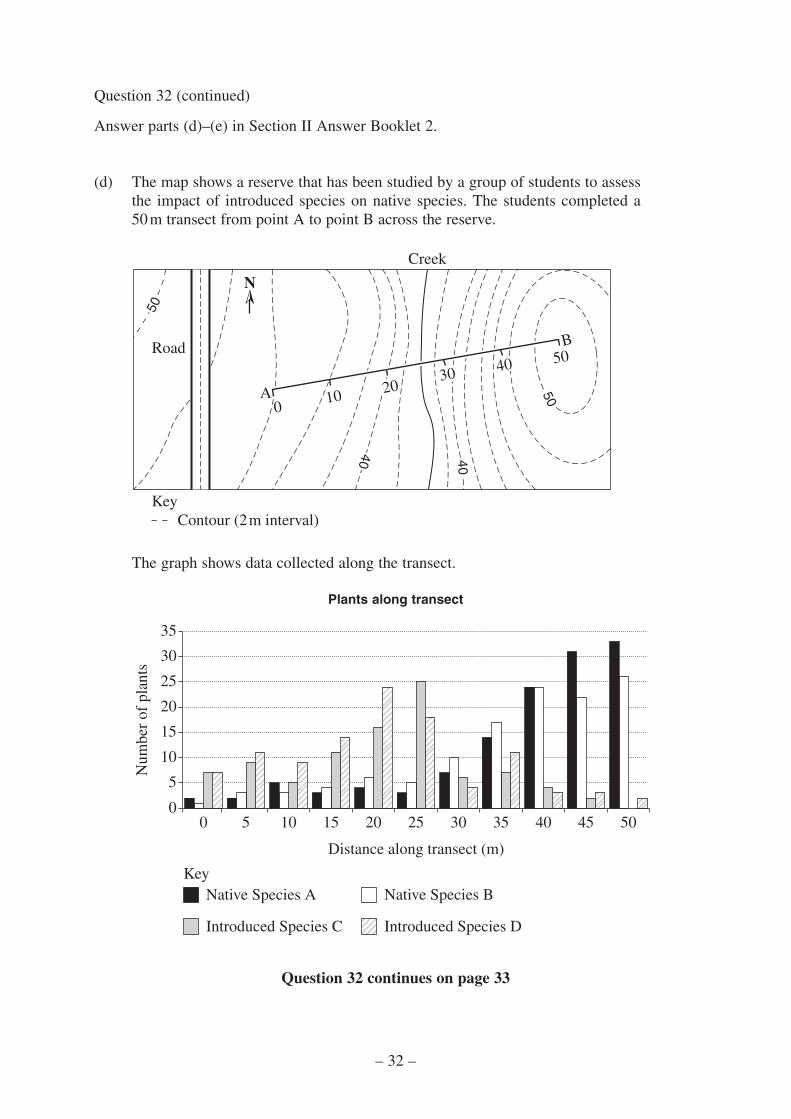
(d) The map shows a reserve that has been studied by a group of students to assessthe impact of introduced species on native species. The students completed a50m transect from point A to point B across the reserve.
The graph shows data collected along the transect.
Plants along transect
Question 32 continues on page 33
A
B
Creek
Road
001010 2020
3030 4040 5050
5050
4040
4040
5050
N
KeyContour (2m interval)
00 5 10 15 20 25
Distance along transect (m)
Num
ber
of p
lant
s
30 35 40 45 50
Key
5
10
15
20
25
30
35
Introduced Species D
Native Species B
Introduced Species C
Native Species A
– 32 –
Question 32 (continued)
(i) Outline how ONE feature of the reserve may have had an impact on thedistribution of the introduced species.
(ii) The students concluded that the introduced species were increasing inthe reserve. Their teacher told them this was not a valid conclusion. Whatadditional information would the students need to make this conclusionvalid?
(iii) Explain how the Bradley Method could be used to rehabilitate the nativespecies in the reserve.
(e) Some people have argued that Australian quarantine regulations should berelaxed to allow plant species from overseas to be introduced into Australia asgarden plants.
Evaluate the need for Australia to continue to apply quarantine regulations andrestrict the entry of plant species from overseas. Give examples in your answer.
End of Question 32
1
6
2
3
– 33 –
Question 33 — Organic Geology – a Non-renewable Resource (25 marks)
Answer parts (a)–(c) in Section II Answer Booklet 1.
(a) (i) Why is the term fossil fuel used to describe coal?
(ii) Outline the changes in composition and energy yield as the rank of coalincreases.
(b) The graphs show a breakdown of Australia’s actual and predicted energy supplyfor the period 1980 to 2020.
Account for the differences in the supply of wind and solar energy from 1980 to2020 compared to that supplied by coal over the same period. Use informationfrom the graphs.
(c) (i) How is knowledge of the geological features of known fossil fuelreserves useful to geologists when searching for new fossil fuel resources?
(ii) Compare the exploration methods used to determine the location andsize of new coal and new oil resources.
Question 33 continues on page 35
1
2
2
4
4
– 34 –
Awaiting Copyright
Question 33 (continued)
Answer parts (d)–(e) in Section II Answer Booklet 2.
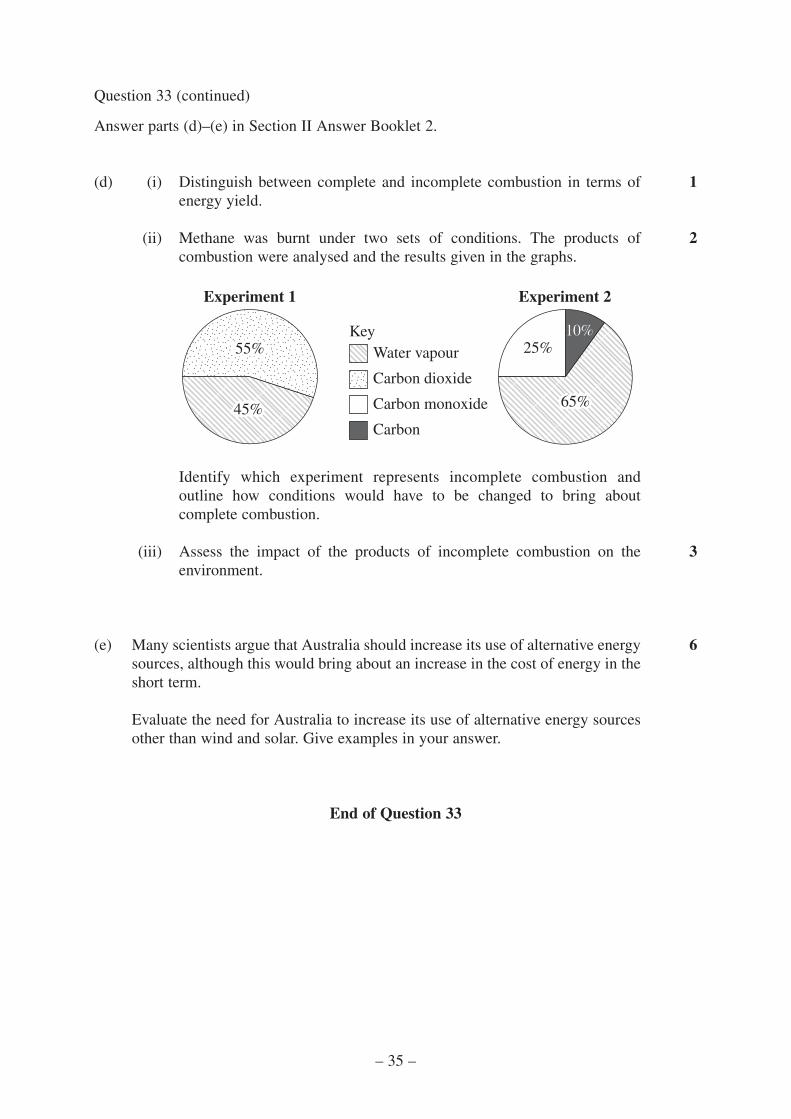
(d) (i) Distinguish between complete and incomplete combustion in terms ofenergy yield.
(ii) Methane was burnt under two sets of conditions. The products ofcombustion were analysed and the results given in the graphs.
Identify which experiment represents incomplete combustion andoutline how conditions would have to be changed to bring aboutcomplete combustion.
(iii) Assess the impact of the products of incomplete combustion on theenvironment.
(e) Many scientists argue that Australia should increase its use of alternative energysources, although this would bring about an increase in the cost of energy in theshort term.
Evaluate the need for Australia to increase its use of alternative energy sourcesother than wind and solar. Give examples in your answer.
End of Question 33
1
Experiment 1
Key55%55%
45%45%
Water vapour
Carbon dioxide
Carbon monoxide
Carbon
Experiment 2
65%65%
25%25%10%10%
3
6
2
– 35 –

Question 34 — Mining and the Australian Environment (25 marks)
Answer parts (a)–(c) in Section II Answer Booklet 1.
(a) (i) Identify ONE renewable and ONE non-renewable resource used bysociety.
(ii) Outline the impact of ONE modern technology on mineral exploration.
(b) A mining company discovered a large nickel deposit in 2005. Throughout 2006,the company carried out feasibility studies on the deposit and concluded that itwas economically viable to mine it if the price of nickel was $40 per kilogram.
The graph below shows the variation in nickel prices between 2007 and 2011.
Explain how the company could maintain economic viability of the depositbetween 2007 and 2011 even though the nickel price changed.
Question 34 continues on page 37
4
1
2
– 36 –
Awaiting Copyright
Question 34 (continued)
(c) (i) Outline how the size and grade of an ore deposit you studied wasdetermined.
(ii) Describe how the size and grade of the deposit influence the mining andconcentration process of the ore.
Answer parts (d)–(e) in Section II Answer Booklet 2.
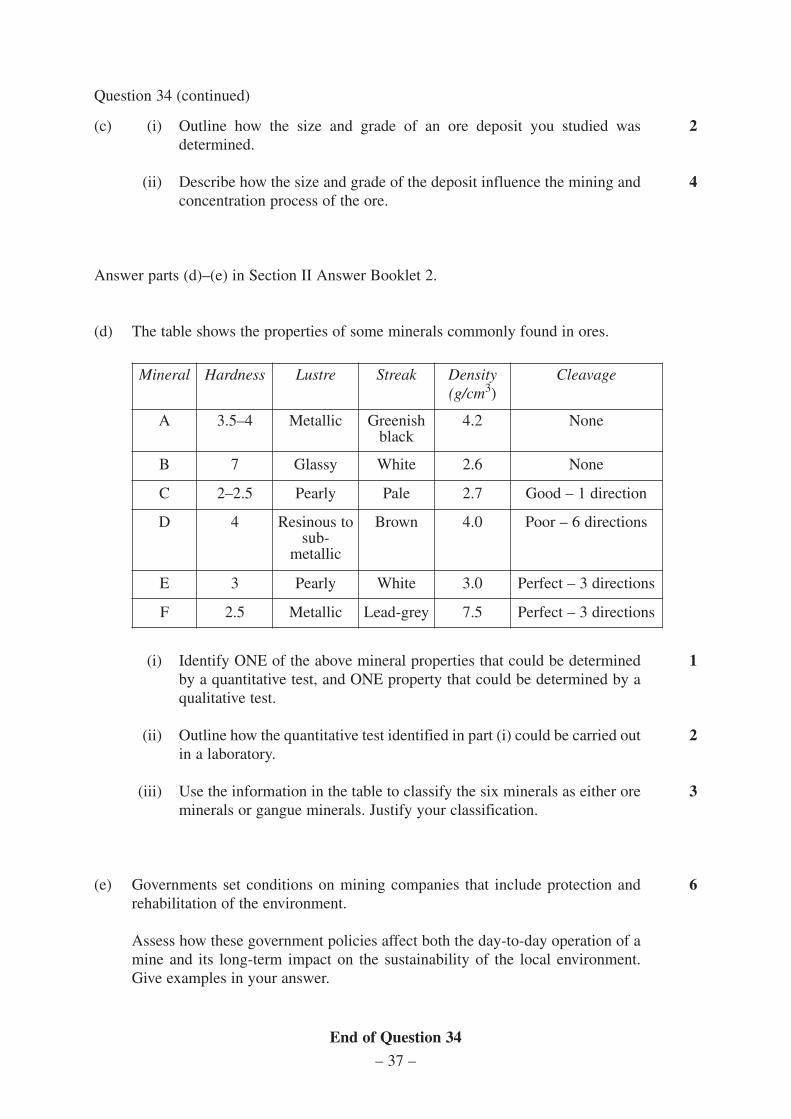
(d) The table shows the properties of some minerals commonly found in ores.
(i) Identify ONE of the above mineral properties that could be determinedby a quantitative test, and ONE property that could be determined by aqualitative test.
(ii) Outline how the quantitative test identified in part (i) could be carried outin a laboratory.
(iii) Use the information in the table to classify the six minerals as either oreminerals or gangue minerals. Justify your classification.
(e) Governments set conditions on mining companies that include protection andrehabilitation of the environment.
Assess how these government policies affect both the day-to-day operation of amine and its long-term impact on the sustainability of the local environment.Give examples in your answer.
2
4
1
3
Mineral Hardness Lustre Streak Density(g/cm3)
Cleavage
A 3.5–4 Metallic Greenishblack
4.2 None
B 7 Glassy White 2.6 None
C 2–2.5 Pearly Pale 2.7 Good – 1 direction
D 4 Resinous tosub-
metallic
Brown 4.0 Poor – 6 directions
E 3 Pearly White 3.0 Perfect – 3 directions
F 2.5 Metallic Lead-grey 7.5 Perfect – 3 directions
6
2
– 37 –
End of Question 34

Question 35 — Oceanography (25 marks)
Answer parts (a)–(c) in Section II Answer Booklet 1.
(a) (i) Name TWO technologies used to study the ocean floor.
(ii) Name ONE deep sea sediment and outline its origin and distribution.
(b) In 2011 the NASA satellite Aquarius sent back to Earth measurements of seasurface salinity collected over seventeen days.
The data was compiled into the following map.
Explain how processes occurring in the Pacific Ocean have resulted in thedistribution of salinities shown on the map.
(c) (i) How has an understanding of plate tectonics improved our knowledge ofthe nature of the deep sea floor?
(ii) Describe the biotic communities around deep ocean vents.
Question 35 continues on page 39
1
2
3
3
4
– 38 –
Awaiting Copyright
Question 35 (continued)
Answer parts (d)–(e) in Section II Answer Booklet 2.
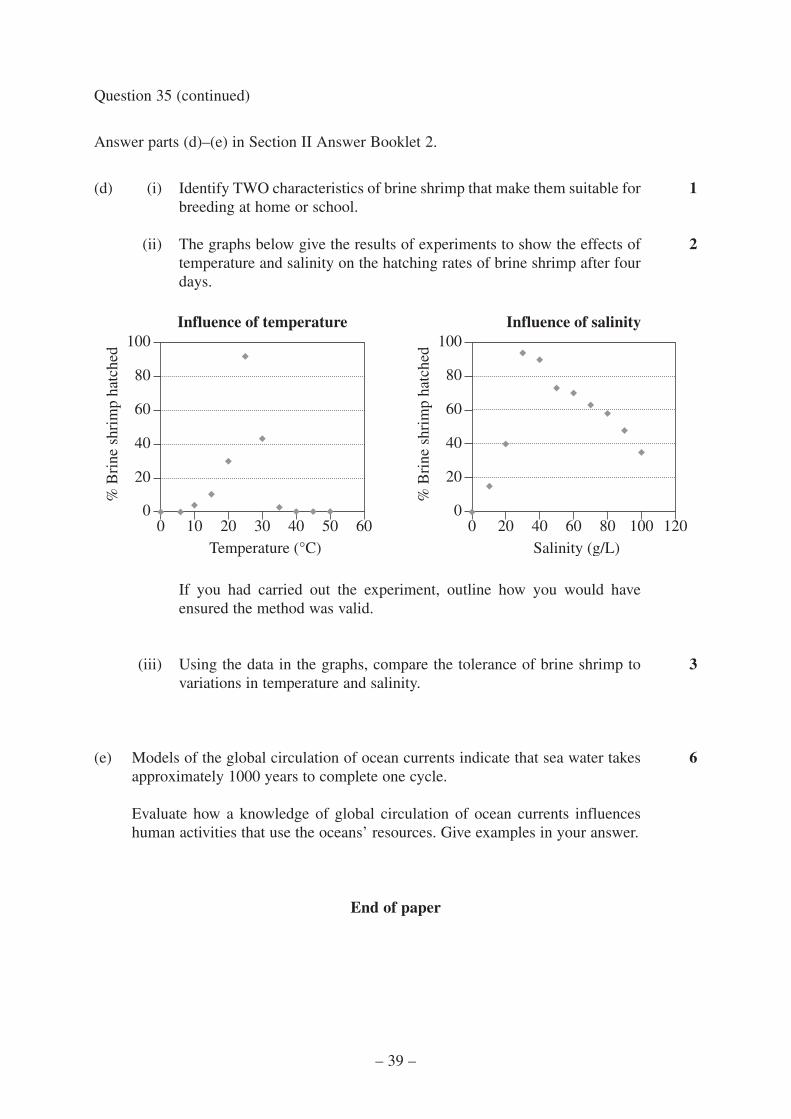
(d) (i) Identify TWO characteristics of brine shrimp that make them suitable forbreeding at home or school.
(ii) The graphs below give the results of experiments to show the effects oftemperature and salinity on the hatching rates of brine shrimp after fourdays.
If you had carried out the experiment, outline how you would haveensured the method was valid.
(iii) Using the data in the graphs, compare the tolerance of brine shrimp tovariations in temperature and salinity.
(e) Models of the global circulation of ocean currents indicate that sea water takesapproximately 1000 years to complete one cycle.
Evaluate how a knowledge of global circulation of ocean currents influenceshuman activities that use the oceans’ resources. Give examples in your answer.
End of paper
1
10 20 30
Influence of temperature
Temperature (°C)
% B
rine
shr
imp
hatc
hed
40 50 600
20
0
40
60
80
100
20 40 60
Influence of salinity
Salinity (g/L)
% B
rine
shr
imp
hatc
hed
80 100 1200
20
0
40
60
80
100
3
6
2
– 39 –
– 40 –
Geological Time Scale
0
2
5
10
20
30
40
50
60
70
100
200
300
400
500
600
1000
2000
3000
4000 Hadean
Archaean
EON ERA
Oligocene
Eocene
Pliocene
Pleistocene
EPOCH
Quaternary
PERIOD
Tertiary
Cretaceous
Permian
Jurassic
Triassic
DevonianSilurian
Ordovician
Cambrian
Ediacaran
Carboniferous
Miocene
Palaeocene
Prot
eroz
oic
Phan
eroz
oic
Cen
ozoi
cPa
laeo
zoic
Mes
ozoi
c
Ma
BP
Holocene
© Board of Studies NSW 2012