earth and planetary science - research school of...
TRANSCRIPT
JID:EPSL AID:14144 /SCO [m5G; v1.190; Prn:8/11/2016; 12:04] P.1 (1-11)
Earth and Planetary Science Letters ••• (••••) •••–•••
Contents lists available at ScienceDirect
Earth and Planetary Science Letters
www.elsevier.com/locate/epsl
The kinematics of crustal deformation in Java from GPS observations:
Implications for fault slip partitioning
A. Koulali a,∗, S. McClusky a, S. Susilo b, Y. Leonard a, P. Cummins a, P. Tregoning a, I. Meilano c, J. Efendi b, A.B. Wijanarto b
a Research School of Earth Sciences, Australian National University, Canberra, Australian Capital Territory, Australiab Bandan Informasi Geospatial, Cibinong, Indonesiac Institute of Technology Bandung, Bandung, Indonesia
a r t i c l e i n f o a b s t r a c t
Article history:Received 12 August 2016Received in revised form 18 October 2016Accepted 19 October 2016Available online xxxxEditor: P. Shearer
Keywords:JavaGPSearthquake cycledeformationactive tectonicsseismic hazard
Our understanding of seismic risk in Java has been focused primarily on the subduction zone, where the seismic records during the last century have shown the occurrence of a number of tsunami earthquakes. However, the potential of the existence of active crustal structures within the island of Java itself is less well known. Historical archives show the occurrence of several devastating earthquake ruptures north of the volcanic arc in west Java during the 18th and the 19th centuries, suggesting the existence of active faults that need to be identified in order to guide seismic hazard assessment. Here we use geodetic constraints from the Global Positioning System (GPS) to quantify the present day crustal deformation in Java. The GPS velocities reveal a homogeneous counterclockwise rotation of the Java Block independent of Sunda Block, consistent with a NE–SW convergence between the Australian Plate and southeast Asia. Continuous GPS observations show a time-dependent change in the linear rate of surface motion in west Java, which we interpret as an ongoing long-term post-seismic deformation following the 2006 Mw 7.7 Java earthquake. We use an elastic block model in combination with a viscoelastic model to correct for this post-seismic transient and derive the long-term inter-seismic velocity, which we interpret as a combination of tectonic block motions and crustal faults strain related deformation. There is a north–south gradient in the resulting velocity field with a decrease in the magnitude towards the North across the Kendeng Thrust in the east and the Baribis Thrust in the west. We suggest that the Baribis Thrust is active and accommodating a slow relative motion between Java and the Sunda Block at about 5 ± 0.2 mm/yr. We propose a kinematic model of convergence of the Australian Plate and the Sunda Block, involving a slip partitioning between the Java Trench and a left-lateral structure extending E–W along Java with most of the convergence being accommodated by the Java megathrust, and a much smaller parallel motion accommodated along the Baribis (∼5 ± 0.2 mm/yr) and Kendeng (∼2.3 ± 0.7 mm/yr) Thrusts. Our study highlights a correlation between the geodetically inferred active faults and historical seismic catalogs, emphasizing the importance of considering crustal fault activity within Java in future seismic assessments.
© 2016 Elsevier B.V. All rights reserved.
1. Introduction
Most of the great earthquakes in the world have occurred in subduction zone environments, where significant events larger than Mw 8 have ruptured areas extending hundreds of kilome-ters from the main epicenter (Lay, 2015). An extensive scientific effort has been dedicated to understand the setting of the occur-rence of these events in the context of plate tectonics. Geodetic observations have shown, in addition to the long term rotation
* Corresponding author.E-mail address: [email protected] (A. Koulali).
of tectonic plates, signatures of elastic strain energy accumulation on subduction megathrusts, where areas of high coupling dur-ing inter-seismic periods have been used to reveal stress build-up where seismic ruptures are likely to occur (Bürgmann et al., 2005;McCaffrey, 2005; Loveless and Meade, 2010). On the other hand, slip on subduction zones can also be accommodated aseismically on creeping areas within the seismogenic zone and/or the tran-sition zone below the top ∼40 km (e.g. Perfettini et al., 2010;Wallace and Beavan, 2010).
The Java subduction zone is one of the most tectonically ac-tive plate boundaries in the world, extending ∼1700 km from the Sunda Strait to eastern Indonesia. A distinctive feature of this sub-
http://dx.doi.org/10.1016/j.epsl.2016.10.0390012-821X/© 2016 Elsevier B.V. All rights reserved.
JID:EPSL AID:14144 /SCO [m5G; v1.190; Prn:8/11/2016; 12:04] P.2 (1-11)
2 A. Koulali et al. / Earth and Planetary Science Letters ••• (••••) •••–•••
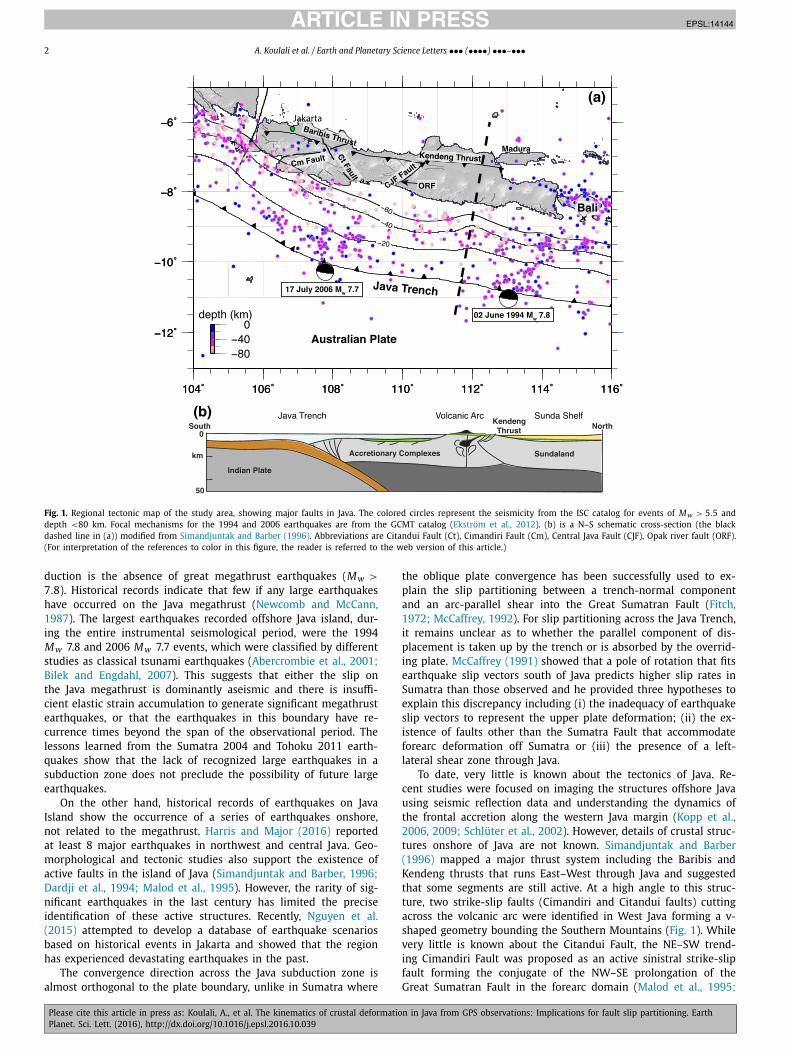
Fig. 1. Regional tectonic map of the study area, showing major faults in Java. The colored circles represent the seismicity from the ISC catalog for events of Mw > 5.5 and depth <80 km. Focal mechanisms for the 1994 and 2006 earthquakes are from the GCMT catalog (Ekström et al., 2012). (b) is a N–S schematic cross-section (the black dashed line in (a)) modified from Simandjuntak and Barber (1996). Abbreviations are Citandui Fault (Ct), Cimandiri Fault (Cm), Central Java Fault (CJF), Opak river fault (ORF). (For interpretation of the references to color in this figure, the reader is referred to the web version of this article.)
duction is the absence of great megathrust earthquakes (Mw >
7.8). Historical records indicate that few if any large earthquakes have occurred on the Java megathrust (Newcomb and McCann, 1987). The largest earthquakes recorded offshore Java island, dur-ing the entire instrumental seismological period, were the 1994 Mw 7.8 and 2006 Mw 7.7 events, which were classified by different studies as classical tsunami earthquakes (Abercrombie et al., 2001;Bilek and Engdahl, 2007). This suggests that either the slip on the Java megathrust is dominantly aseismic and there is insuffi-cient elastic strain accumulation to generate significant megathrust earthquakes, or that the earthquakes in this boundary have re-currence times beyond the span of the observational period. The lessons learned from the Sumatra 2004 and Tohoku 2011 earth-quakes show that the lack of recognized large earthquakes in a subduction zone does not preclude the possibility of future large earthquakes.
On the other hand, historical records of earthquakes on Java Island show the occurrence of a series of earthquakes onshore, not related to the megathrust. Harris and Major (2016) reported at least 8 major earthquakes in northwest and central Java. Geo-morphological and tectonic studies also support the existence of active faults in the island of Java (Simandjuntak and Barber, 1996;Dardji et al., 1994; Malod et al., 1995). However, the rarity of sig-nificant earthquakes in the last century has limited the precise identification of these active structures. Recently, Nguyen et al.(2015) attempted to develop a database of earthquake scenarios based on historical events in Jakarta and showed that the region has experienced devastating earthquakes in the past.
The convergence direction across the Java subduction zone is almost orthogonal to the plate boundary, unlike in Sumatra where
the oblique plate convergence has been successfully used to ex-plain the slip partitioning between a trench-normal component and an arc-parallel shear into the Great Sumatran Fault (Fitch, 1972; McCaffrey, 1992). For slip partitioning across the Java Trench, it remains unclear as to whether the parallel component of dis-placement is taken up by the trench or is absorbed by the overrid-ing plate. McCaffrey (1991) showed that a pole of rotation that fits earthquake slip vectors south of Java predicts higher slip rates in Sumatra than those observed and he provided three hypotheses to explain this discrepancy including (i) the inadequacy of earthquake slip vectors to represent the upper plate deformation; (ii) the ex-istence of faults other than the Sumatra Fault that accommodate forearc deformation off Sumatra or (iii) the presence of a left-lateral shear zone through Java.
To date, very little is known about the tectonics of Java. Re-cent studies were focused on imaging the structures offshore Java using seismic reflection data and understanding the dynamics of the frontal accretion along the western Java margin (Kopp et al., 2006, 2009; Schlüter et al., 2002). However, details of crustal struc-tures onshore of Java are not known. Simandjuntak and Barber(1996) mapped a major thrust system including the Baribis and Kendeng thrusts that runs East–West through Java and suggested that some segments are still active. At a high angle to this struc-ture, two strike-slip faults (Cimandiri and Citandui faults) cutting across the volcanic arc were identified in West Java forming a v-shaped geometry bounding the Southern Mountains (Fig. 1). While very little is known about the Citandui Fault, the NE–SW trend-ing Cimandiri Fault was proposed as an active sinistral strike-slip fault forming the conjugate of the NW–SE prolongation of the Great Sumatran Fault in the forearc domain (Malod et al., 1995;
JID:EPSL AID:14144 /SCO [m5G; v1.190; Prn:8/11/2016; 12:04] P.3 (1-11)
A. Koulali et al. / Earth and Planetary Science Letters ••• (••••) •••–••• 3
Schlüter et al., 2002). However, the lack of a clear trend of seis-micity makes it difficult to identify the active deformation patterns related to this fault. Hall et al. (2007) indicated that the Cimandiri Fault does not have the sharp surface character of a strike-slip fault and suggested that it is more likely a thrust structure that is not active. Further to the east, the Central Java Fault (CJF) is an-other strike-slip fault trending NE–SW, marking the transition from central Java to the eastern Kendeng Basin (Hoffmann-Rothe et al., 2001). The 2006 Mw 6.3 Yogyakarta earthquake was related to the Opak River Fault (Tsuji et al., 2009), a lineament parallel to the main CJF, which might suggest that the CJF is a laterally segmented system. Nevertheless, there is no conclusive evidence of activity along this boundary. More recently, Koulali et al. (2016) identi-fied an active westward extension of the Flores back-arc thrust for 300 km onshore into East Java along the Kendeng Thrust. However, the western termination of this structure is not yet understood and this system might continue even further westward to link with the Baribis Thrust (∼25 km south of Jakarta) (Fig. 1).
Initial geodetic investigations of the present-day crustal defor-mation in Java were either focused on a local spatial extent using observation networks in the vicinity of potential sources of activity (Abidin et al., 2009; Meilano et al., 2012), or concerned with deriv-ing the pattern of inter-seismic coupling along the Java Trench by inverting GPS inter-seismic velocities (Hanifa et al., 2014). Gaining more knowledge on the rate of strain accumulation and partition-ing on this plate boundary is essential to understand the seismic hazard in Java. Here we present a new GPS velocity field cov-ering the entire Java Island, including a combination of existing and newly acquired observations from continuous as well as cam-paign sites. We identify a post-seismic contribution to the present horizontal surface velocities following the 2006 Mw 7.7 Java earth-quake and we propose an approach to correct for this transient. We use the corrected velocity field to constrain the tectonic motion of the Java forearc and to identify the distribution of the deformation within the continental Java forearc. We quantify, for the first time, the kinematics of the present-day surface deformation on Java Is-land and discuss the seismic hazard implications.
2. GPS observations and analysis
GPS observations used in our study were obtained from the continuous network of Badan Informasi Geospasial (BIG), supple-mented with few campaign stations surveyed between 2000 and 2008 (Table S1). The continuous network includes 63 stations de-ployed in two stages. The first sub-network started collecting data from 2008 until 2011 and was mainly concentrated in west Java. These stations were densified later with a larger network extend-ing across all of Java in 2011. In the present study, we derived hor-izontal velocities using data between 2008 and 2014. Fig. 2 shows velocities in the Sunda Block reference frame plotted with different colors indicating the span of time series used in our processing.
We analyzed GPS data using GAMIT-GLOBK software (Herring et al., 2010). We have used a classical two-step approach to derive the velocity field (e.g. Reilinger et al., 2006; Koulali et al., 2015). In the first stage, we estimated the loosely-constrained positions from two sub-networks, by including a set of 70 globally distributed IGS stations (Tregoning and Watson, 2009). In the second stage, we combined the two obtained solutions using the Kalman Filter (GLOBK) to derive a consistent set of positions and velocities. To estimate realistic uncertainties and account for the temporally cor-related noise in the GPS time series, we have used a first-order Gauss Markov extrapolation (FOGMEX) algorithm (Herring et al., 2010).
During the last decade, the Sunda Arc has known a sequence of great earthquakes (>Mw 8), which not only caused large co-seismic offsets in GPS time series but also induced spatially and
temporally significant post-seismic transients. These effects are considered as a limitation to the assumption of the linear veloci-ties. Tregoning et al. (2013) showed that the cumulative co-seismic displacements induced from far-field large earthquakes can bias the estimation of linear velocities by up to 0.3 mm/yr, influenc-ing significantly the consistency of the realization of the reference frame. Similarly, DeMets et al. (2014) have shown that viscoelas-tic deformation triggered by large earthquakes can potentially also induce significant inconsistencies in the estimation of plate motion velocities. In our case, we have corrected for co-seismic offsets by manually inspecting the GPS time series. In Java the only long-spanning GPS time series (i.e. >10 years) is the IGS site of BAKO. We found that this site was affected by at least three far-field earthquakes: the 2000 Mw 7.9 Enggano earthquake, the 2004 Mw 9.1 Sumatra earthquake, and the 2012 Mw 8.6 Whar-ton Basin earthquake. We have estimated a co-seismic offset for each of these events when calculating the velocities of BAKO and the neighboring sites on the Australian Plate (COCO, DARW). As the BIG continuous GPS network in Java started operating in the beginning of 2008, the only significant co-seismic displacements detected in our time series are related to the 2012 Mw 8.6 Whar-ton Basin earthquakes (Hill et al., 2015). We have corrected all the sites in West Java where we observed an offset. However, we have not observed any non-linear behavior in our time series due to this earthquake.
Unlike the co-seismic displacement, viscoelastic relaxation in-duces surface deformation that occurs over a long-term temporal scale which can persist decades after the earthquake. The empiri-cal correction of this type of transient, made by fitting exponential or logarithmic functions, can be trivial if enough data are available before and after the earthquake to constrain the curvature in the displacements. Characterizing the long-term behavior of this sig-nal becomes more critical, mainly due to its spatial coherence. In this situation, the time series show very small changes in slope, which can be detected only with long-term continuous time series (Ergintav et al., 2009). The Java 2006 Mw 7.7 earthquake ruptured along ∼200 km at shallow depth offshore of the western part of Java (Fig. 1). The absence of continuous GPS sites at that time means that we cannot measure the co-seismic displacement. The only site operating in Java at that time was BAKO, for which we fitted a logarithmic function to its time series after the earthquake and the only campaign observations we have before 2006 are from 3 sites in southwest Java (Figs. S1–S3). These sites were not used in the present study because of the large uncertainty in their ve-locities. The effect of the post-seismic deformation on the rest of the observations cannot be modeled with the empirical fitting ap-proach, since two years separate the time of the earthquake and the start of the observations and thus the bulk of the post-seismic signal was not observed. Hence, a physical model is required to predict the spatial and the temporal evolution of this transient. The modeling and the signature of post-seismic deformation treat-ment are considered in Section 4.3 of this paper.
During the Kalman filter step, we treat the sites affected by the post-seismic deformation using a spatially dependent noise model with standard deviation defined as: σs.(D/dist)2 (Herring et al., 2010), where σs is the specified spatial standard deviation, D is the depth of the earthquake and dist is the distance of the GPS site from the epicenter location. This simple model allows a proper scaling of the velocity covariance matrix during the block model inversion.
One of the challenges associated with the calculation of sur-face velocities from GPS in Java is the groundwater subsidence signal observed mainly in the coastal areas. Interferometric syn-thetic aperture radar (InSAR) time-series analysis shows significant signal related to land subsidence up to 22 mm/yr (Chaussard et al., 2013). Although this signal affects mainly the vertical component
JID:EPSL AID:14144 /SCO [m5G; v1.190; Prn:8/11/2016; 12:04] P.4 (1-11)
4 A. Koulali et al. / Earth and Planetary Science Letters ••• (••••) •••–•••
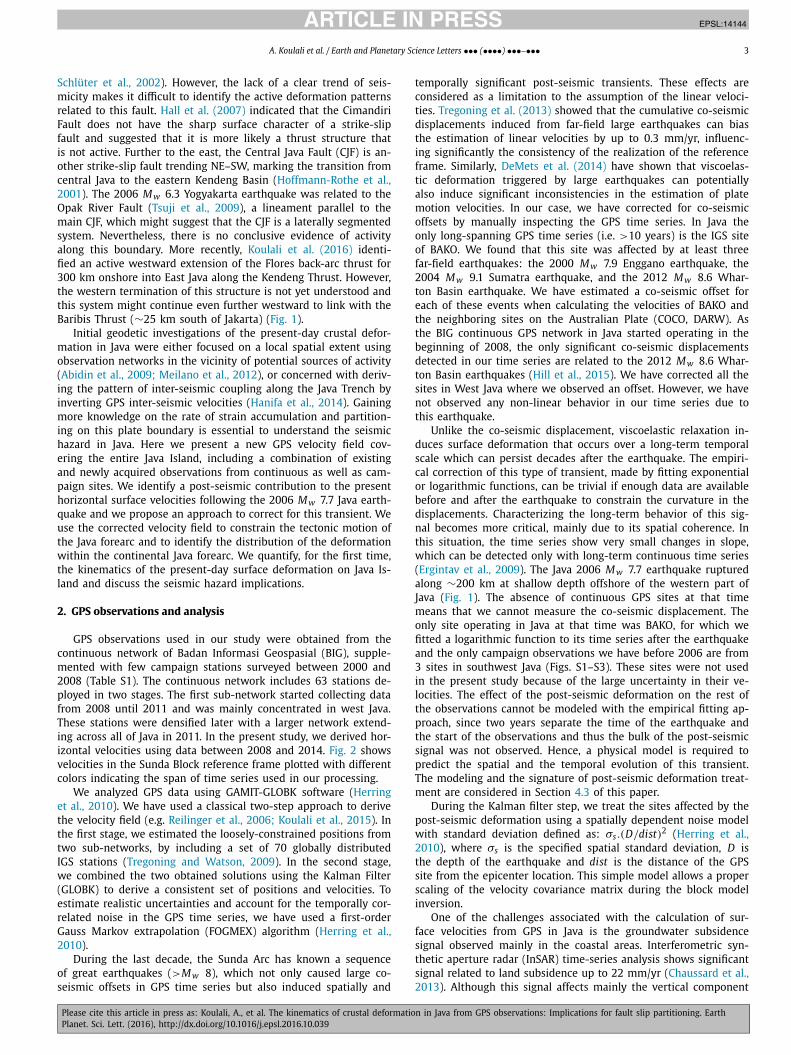
Fig. 2. GPS velocities determined in this study with respect to the Sunda Block. Uncertainty ellipses represent 95% confidence levels. The inset (bottom left) figure shows the time span of each derived velocity in West Java. The dashed red line in the regional map (top right) corresponds to the study area (main figure outline). (For interpretation of the references to color in this figure legend, the reader is referred to the web version of this article.)
of the positions, it can potentially bias the horizontal velocity es-timates. Fortunately, the subsidence signal is much more localized and observed mainly near cities. However, we have excluded from our solution two sites with subsidence rates >20 mm/yr in an at-tempt to mitigate contaminating our tectonic interpretation with local hydrology effects.
3. GPS velocities in Java
We present the velocities in the Sunda reference frame defined in the same manner as in Koulali et al. (2016). We use only stable continuous sites within the Sunda Block, where we have available data before the Sumatra–Andaman 2004 earthquake. We then es-timate the Sunda Block Euler vector using the linear velocities and their covariances. The obtained velocity field shows a dominant counterclockwise rotation of the whole Java forearc with a rate increasing towards the east (Fig. 2). The magnitude of the veloc-ities vary from ∼3 mm/yr in west Java to ∼7 mm/yr in the East. This motion is consistent with the convergence direction between the Australian Plate and southeast Asia (Tregoning et al., 1994;Simons et al., 2007). Another feature apparent in our velocity field is the northward decrease of velocities towards the Baribis thrust, indicating that the Java forearc is presently moving relative to Sunda Block. This correlates with geological observations where Paleogene arc rocks have been thrusted northwards towards the Sunda Shelf (Hall et al., 2007).
One of the most striking features of the GPS velocity field in west Java is the coherent anomalous southeastward site motions. Hanifa et al. (2014) showed an even more southward motion of the CLDO, CSGT, CPTN, CTVI, and CUJG sites in their analysis, which they interpreted as an indication of a north–south shortening in West Java. Their velocities with respect to Sunda Block were de-rived using the Euler pole definition of Simons et al. (2007), which included BAKO as part of the stable Sunda Block. However, in our
realization we consider that BAKO is part of the Java Block which moves independently from the Sunda Block. Moreover, the site BAKO has been affected by the 2006 Mw 7.7 Java earthquake as we will show later; therefore, a linear velocity from a time series after 2006 includes a significant post-seismic effect (Fig. S6) which we correct for using a viscoelastic model discussed in section 4.3.
In addition to the sites above, our solution includes new sites in the same region, observed between 2011 and 2014 (CMIS, CTAN, CANG, CJUR, CPTU in Fig. 2). These sites show a somewhat differ-ent motion, with a more eastward velocity than observed between 2008 and 2011. Furthermore, the inset of Fig. 2 shows a case of two co-located stations BCLP and CCLP observed in two different intervals before and after the 2006 earthquake. While the velocity of the BCLP (2002–2006) station is consistent with the expected NE motion of the forearc, CCLP shows a more southeastward mo-tion similar in direction to the other velocities observed during the same time interval. The only GPS observations obtained be-fore and after the 2006 Mw 7.7 earthquake in west Java were from three campaign observations (BRTU, LIPI and GLSK, Figs. S1–S3). The time series at these stations show a clear logarithmic decay that continues for at least 4 yrs following the 2006 earthquake. Therefore, a plausible explanation for the divergence in motion we see in the continuous GPS velocities results from the persis-tence of a long-term post-seismic transient following the 2006 Mw7.7 Java earthquake, which leads to a small change in the appar-ent linear rate through time. This means that time series sampled close in time following the earthquake would produce velocities with directions similar to the co-seismic displacement pattern. This postseismic transient would influence velocities measured over 2008–2011 more strongly than those averaged over 2011–2014, yet even the 2011–2014 velocities are likely biased relative to those measured before 2006. This implies that the observed ve-locities are the combination of the inter-seismic deformation re-lated to block rotations and fault locking as well as post-seismic
JID:EPSL AID:14144 /SCO [m5G; v1.190; Prn:8/11/2016; 12:04] P.5 (1-11)
A. Koulali et al. / Earth and Planetary Science Letters ••• (••••) •••–••• 5
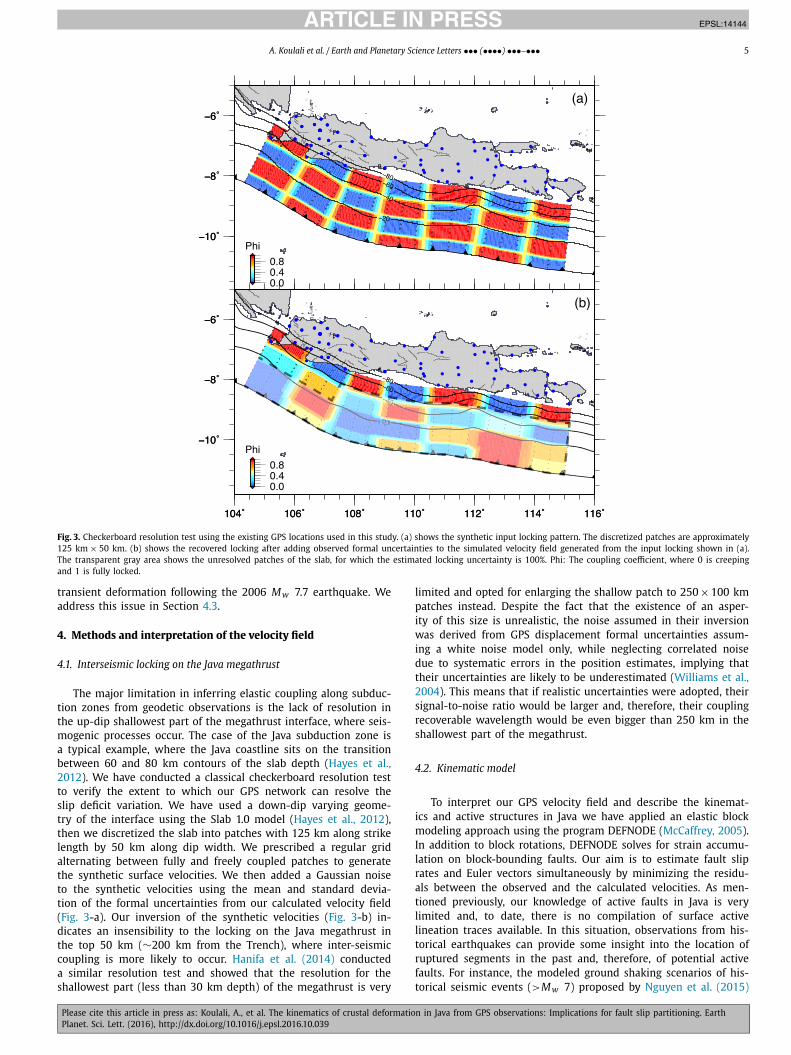
Fig. 3. Checkerboard resolution test using the existing GPS locations used in this study. (a) shows the synthetic input locking pattern. The discretized patches are approximately 125 km × 50 km. (b) shows the recovered locking after adding observed formal uncertainties to the simulated velocity field generated from the input locking shown in (a). The transparent gray area shows the unresolved patches of the slab, for which the estimated locking uncertainty is 100%. Phi: The coupling coefficient, where 0 is creeping and 1 is fully locked.
transient deformation following the 2006 Mw 7.7 earthquake. We address this issue in Section 4.3.
4. Methods and interpretation of the velocity field
4.1. Interseismic locking on the Java megathrust
The major limitation in inferring elastic coupling along subduc-tion zones from geodetic observations is the lack of resolution in the up-dip shallowest part of the megathrust interface, where seis-mogenic processes occur. The case of the Java subduction zone is a typical example, where the Java coastline sits on the transition between 60 and 80 km contours of the slab depth (Hayes et al., 2012). We have conducted a classical checkerboard resolution test to verify the extent to which our GPS network can resolve the slip deficit variation. We have used a down-dip varying geome-try of the interface using the Slab 1.0 model (Hayes et al., 2012), then we discretized the slab into patches with 125 km along strike length by 50 km along dip width. We prescribed a regular grid alternating between fully and freely coupled patches to generate the synthetic surface velocities. We then added a Gaussian noise to the synthetic velocities using the mean and standard devia-tion of the formal uncertainties from our calculated velocity field (Fig. 3-a). Our inversion of the synthetic velocities (Fig. 3-b) in-dicates an insensibility to the locking on the Java megathrust in the top 50 km (∼200 km from the Trench), where inter-seismic coupling is more likely to occur. Hanifa et al. (2014) conducted a similar resolution test and showed that the resolution for the shallowest part (less than 30 km depth) of the megathrust is very
limited and opted for enlarging the shallow patch to 250 × 100 kmpatches instead. Despite the fact that the existence of an asper-ity of this size is unrealistic, the noise assumed in their inversion was derived from GPS displacement formal uncertainties assum-ing a white noise model only, while neglecting correlated noise due to systematic errors in the position estimates, implying that their uncertainties are likely to be underestimated (Williams et al., 2004). This means that if realistic uncertainties were adopted, their signal-to-noise ratio would be larger and, therefore, their coupling recoverable wavelength would be even bigger than 250 km in the shallowest part of the megathrust.
4.2. Kinematic model
To interpret our GPS velocity field and describe the kinemat-ics and active structures in Java we have applied an elastic block modeling approach using the program DEFNODE (McCaffrey, 2005). In addition to block rotations, DEFNODE solves for strain accumu-lation on block-bounding faults. Our aim is to estimate fault slip rates and Euler vectors simultaneously by minimizing the residu-als between the observed and the calculated velocities. As men-tioned previously, our knowledge of active faults in Java is very limited and, to date, there is no compilation of surface active lineation traces available. In this situation, observations from his-torical earthquakes can provide some insight into the location of ruptured segments in the past and, therefore, of potential active faults. For instance, the modeled ground shaking scenarios of his-torical seismic events (>Mw 7) proposed by Nguyen et al. (2015)
JID:EPSL AID:14144 /SCO [m5G; v1.190; Prn:8/11/2016; 12:04] P.6 (1-11)
6 A. Koulali et al. / Earth and Planetary Science Letters ••• (••••) •••–•••
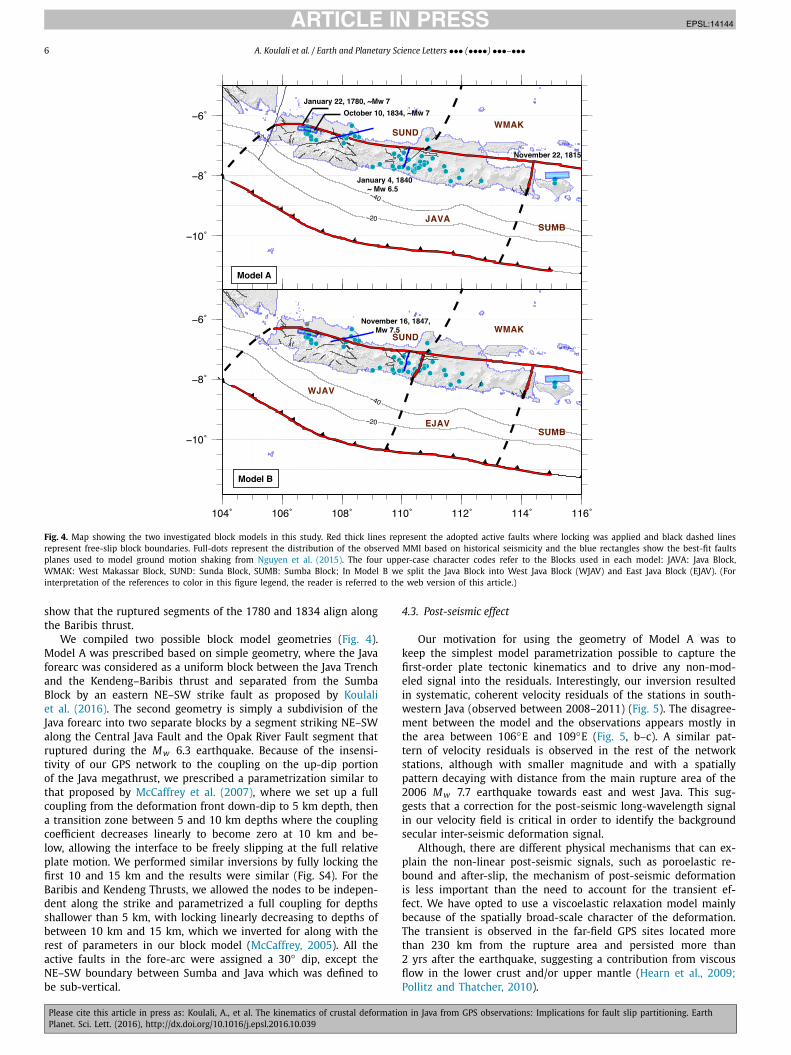
Fig. 4. Map showing the two investigated block models in this study. Red thick lines represent the adopted active faults where locking was applied and black dashed lines represent free-slip block boundaries. Full-dots represent the distribution of the observed MMI based on historical seismicity and the blue rectangles show the best-fit faults planes used to model ground motion shaking from Nguyen et al. (2015). The four upper-case character codes refer to the Blocks used in each model: JAVA: Java Block, WMAK: West Makassar Block, SUND: Sunda Block, SUMB: Sumba Block; In Model B we split the Java Block into West Java Block (WJAV) and East Java Block (EJAV). (For interpretation of the references to color in this figure legend, the reader is referred to the web version of this article.)
show that the ruptured segments of the 1780 and 1834 align along the Baribis thrust.
We compiled two possible block model geometries (Fig. 4). Model A was prescribed based on simple geometry, where the Java forearc was considered as a uniform block between the Java Trench and the Kendeng–Baribis thrust and separated from the Sumba Block by an eastern NE–SW strike fault as proposed by Koulali et al. (2016). The second geometry is simply a subdivision of the Java forearc into two separate blocks by a segment striking NE–SW along the Central Java Fault and the Opak River Fault segment that ruptured during the Mw 6.3 earthquake. Because of the insensi-tivity of our GPS network to the coupling on the up-dip portion of the Java megathrust, we prescribed a parametrization similar to that proposed by McCaffrey et al. (2007), where we set up a full coupling from the deformation front down-dip to 5 km depth, then a transition zone between 5 and 10 km depths where the coupling coefficient decreases linearly to become zero at 10 km and be-low, allowing the interface to be freely slipping at the full relative plate motion. We performed similar inversions by fully locking the first 10 and 15 km and the results were similar (Fig. S4). For the Baribis and Kendeng Thrusts, we allowed the nodes to be indepen-dent along the strike and parametrized a full coupling for depths shallower than 5 km, with locking linearly decreasing to depths of between 10 km and 15 km, which we inverted for along with the rest of parameters in our block model (McCaffrey, 2005). All the active faults in the fore-arc were assigned a 30◦ dip, except the NE–SW boundary between Sumba and Java which was defined to be sub-vertical.
4.3. Post-seismic effect
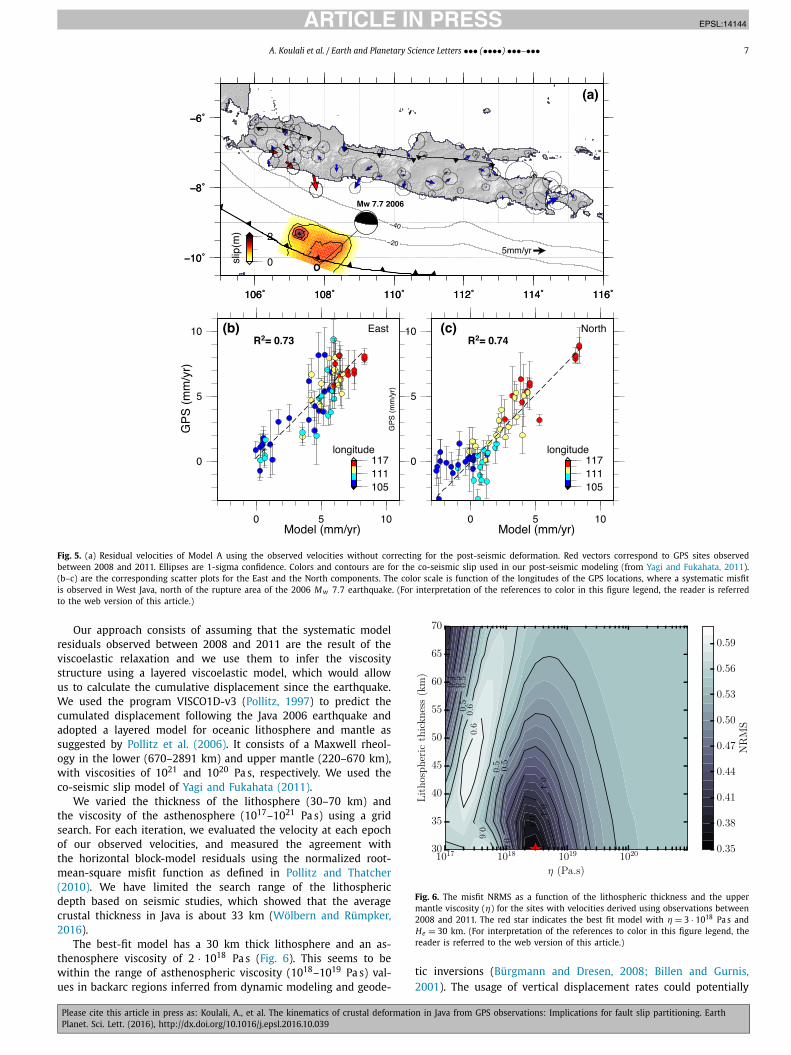
Our motivation for using the geometry of Model A was to keep the simplest model parametrization possible to capture the first-order plate tectonic kinematics and to drive any non-mod-eled signal into the residuals. Interestingly, our inversion resulted in systematic, coherent velocity residuals of the stations in south-western Java (observed between 2008–2011) (Fig. 5). The disagree-ment between the model and the observations appears mostly in the area between 106◦E and 109◦E (Fig. 5, b–c). A similar pat-tern of velocity residuals is observed in the rest of the network stations, although with smaller magnitude and with a spatially pattern decaying with distance from the main rupture area of the 2006 Mw 7.7 earthquake towards east and west Java. This sug-gests that a correction for the post-seismic long-wavelength signal in our velocity field is critical in order to identify the background secular inter-seismic deformation signal.
Although, there are different physical mechanisms that can ex-plain the non-linear post-seismic signals, such as poroelastic re-bound and after-slip, the mechanism of post-seismic deformation is less important than the need to account for the transient ef-fect. We have opted to use a viscoelastic relaxation model mainly because of the spatially broad-scale character of the deformation. The transient is observed in the far-field GPS sites located more than 230 km from the rupture area and persisted more than 2 yrs after the earthquake, suggesting a contribution from viscous flow in the lower crust and/or upper mantle (Hearn et al., 2009;Pollitz and Thatcher, 2010).
JID:EPSL AID:14144 /SCO [m5G; v1.190; Prn:8/11/2016; 12:04] P.7 (1-11)
A. Koulali et al. / Earth and Planetary Science Letters ••• (••••) •••–••• 7
Fig. 5. (a) Residual velocities of Model A using the observed velocities without correcting for the post-seismic deformation. Red vectors correspond to GPS sites observed between 2008 and 2011. Ellipses are 1-sigma confidence. Colors and contours are for the co-seismic slip used in our post-seismic modeling (from Yagi and Fukahata, 2011). (b–c) are the corresponding scatter plots for the East and the North components. The color scale is function of the longitudes of the GPS locations, where a systematic misfit is observed in West Java, north of the rupture area of the 2006 Mw 7.7 earthquake. (For interpretation of the references to color in this figure legend, the reader is referred to the web version of this article.)
Our approach consists of assuming that the systematic model residuals observed between 2008 and 2011 are the result of the viscoelastic relaxation and we use them to infer the viscosity structure using a layered viscoelastic model, which would allow us to calculate the cumulative displacement since the earthquake. We used the program VISCO1D-v3 (Pollitz, 1997) to predict the cumulated displacement following the Java 2006 earthquake and adopted a layered model for oceanic lithosphere and mantle as suggested by Pollitz et al. (2006). It consists of a Maxwell rheol-ogy in the lower (670–2891 km) and upper mantle (220–670 km), with viscosities of 1021 and 1020 Pa s, respectively. We used the co-seismic slip model of Yagi and Fukahata (2011).
We varied the thickness of the lithosphere (30–70 km) and the viscosity of the asthenosphere (1017–1021 Pa s) using a grid search. For each iteration, we evaluated the velocity at each epoch of our observed velocities, and measured the agreement with the horizontal block-model residuals using the normalized root-mean-square misfit function as defined in Pollitz and Thatcher(2010). We have limited the search range of the lithospheric depth based on seismic studies, which showed that the average crustal thickness in Java is about 33 km (Wölbern and Rümpker, 2016).
The best-fit model has a 30 km thick lithosphere and an as-thenosphere viscosity of 2 · 1018 Pa s (Fig. 6). This seems to be within the range of asthenospheric viscosity (1018–1019 Pa s) val-ues in backarc regions inferred from dynamic modeling and geode-
Fig. 6. The misfit NRMS as a function of the lithospheric thickness and the upper mantle viscosity (η) for the sites with velocities derived using observations between 2008 and 2011. The red star indicates the best fit model with η = 3 · 1018 Pa s and He = 30 km. (For interpretation of the references to color in this figure legend, the reader is referred to the web version of this article.)
tic inversions (Bürgmann and Dresen, 2008; Billen and Gurnis, 2001). The usage of vertical displacement rates could potentially
JID:EPSL AID:14144 /SCO [m5G; v1.190; Prn:8/11/2016; 12:04] P.8 (1-11)
8 A. Koulali et al. / Earth and Planetary Science Letters ••• (••••) •••–•••
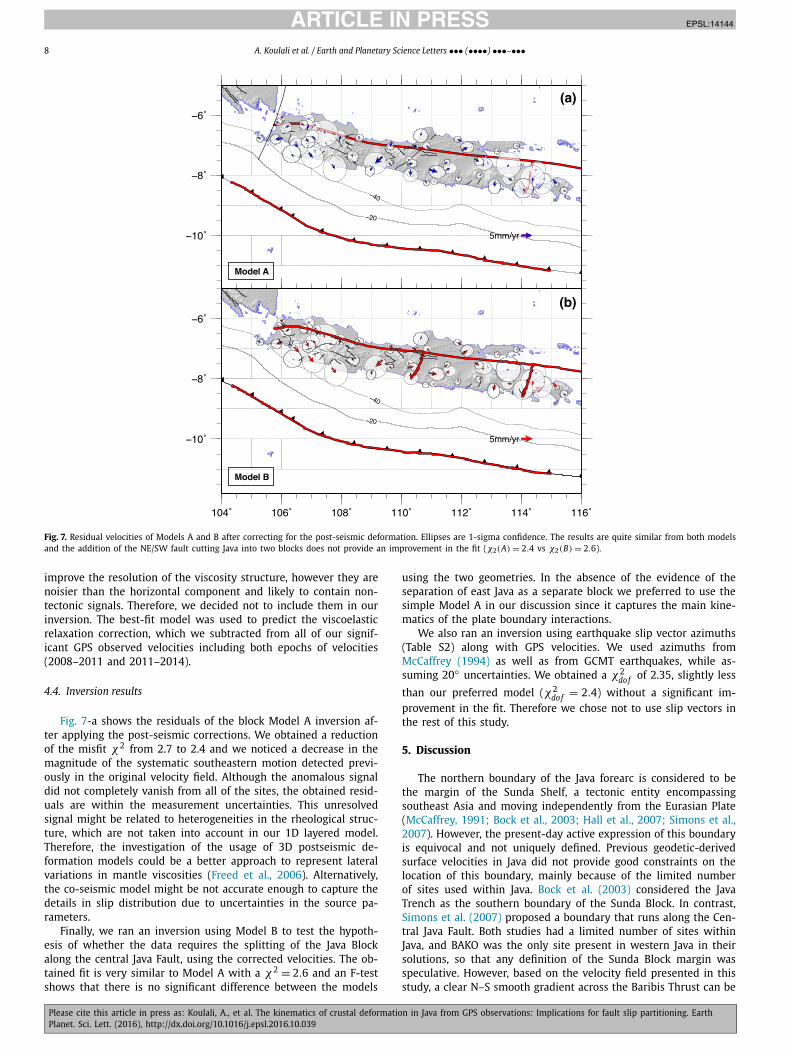
Fig. 7. Residual velocities of Models A and B after correcting for the post-seismic deformation. Ellipses are 1-sigma confidence. The results are quite similar from both models and the addition of the NE/SW fault cutting Java into two blocks does not provide an improvement in the fit (χ2(A) = 2.4 vs χ2(B) = 2.6).
improve the resolution of the viscosity structure, however they are noisier than the horizontal component and likely to contain non-tectonic signals. Therefore, we decided not to include them in our inversion. The best-fit model was used to predict the viscoelastic relaxation correction, which we subtracted from all of our signif-icant GPS observed velocities including both epochs of velocities (2008–2011 and 2011–2014).
4.4. Inversion results
Fig. 7-a shows the residuals of the block Model A inversion af-ter applying the post-seismic corrections. We obtained a reduction of the misfit χ2 from 2.7 to 2.4 and we noticed a decrease in the magnitude of the systematic southeastern motion detected previ-ously in the original velocity field. Although the anomalous signal did not completely vanish from all of the sites, the obtained resid-uals are within the measurement uncertainties. This unresolved signal might be related to heterogeneities in the rheological struc-ture, which are not taken into account in our 1D layered model. Therefore, the investigation of the usage of 3D postseismic de-formation models could be a better approach to represent lateral variations in mantle viscosities (Freed et al., 2006). Alternatively, the co-seismic model might be not accurate enough to capture the details in slip distribution due to uncertainties in the source pa-rameters.
Finally, we ran an inversion using Model B to test the hypoth-esis of whether the data requires the splitting of the Java Block along the central Java Fault, using the corrected velocities. The ob-tained fit is very similar to Model A with a χ2 = 2.6 and an F-test shows that there is no significant difference between the models
using the two geometries. In the absence of the evidence of the separation of east Java as a separate block we preferred to use the simple Model A in our discussion since it captures the main kine-matics of the plate boundary interactions.
We also ran an inversion using earthquake slip vector azimuths (Table S2) along with GPS velocities. We used azimuths from McCaffrey (1994) as well as from GCMT earthquakes, while as-suming 20◦ uncertainties. We obtained a χ2
dof of 2.35, slightly less than our preferred model (χ2
dof = 2.4) without a significant im-provement in the fit. Therefore we chose not to use slip vectors in the rest of this study.
5. Discussion
The northern boundary of the Java forearc is considered to be the margin of the Sunda Shelf, a tectonic entity encompassing southeast Asia and moving independently from the Eurasian Plate (McCaffrey, 1991; Bock et al., 2003; Hall et al., 2007; Simons et al., 2007). However, the present-day active expression of this boundary is equivocal and not uniquely defined. Previous geodetic-derived surface velocities in Java did not provide good constraints on the location of this boundary, mainly because of the limited number of sites used within Java. Bock et al. (2003) considered the Java Trench as the southern boundary of the Sunda Block. In contrast, Simons et al. (2007) proposed a boundary that runs along the Cen-tral Java Fault. Both studies had a limited number of sites within Java, and BAKO was the only site present in western Java in their solutions, so that any definition of the Sunda Block margin was speculative. However, based on the velocity field presented in this study, a clear N–S smooth gradient across the Baribis Thrust can be
JID:EPSL AID:14144 /SCO [m5G; v1.190; Prn:8/11/2016; 12:04] P.9 (1-11)
A. Koulali et al. / Earth and Planetary Science Letters ••• (••••) •••–••• 9
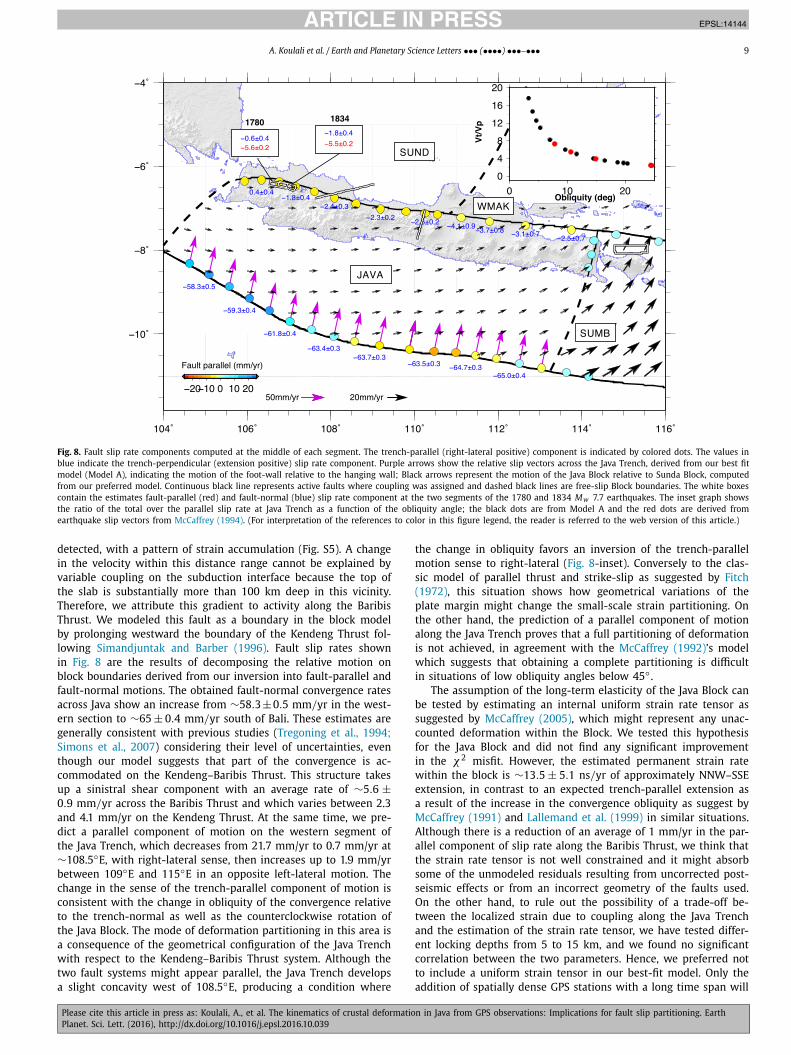
Fig. 8. Fault slip rate components computed at the middle of each segment. The trench-parallel (right-lateral positive) component is indicated by colored dots. The values in blue indicate the trench-perpendicular (extension positive) slip rate component. Purple arrows show the relative slip vectors across the Java Trench, derived from our best fit model (Model A), indicating the motion of the foot-wall relative to the hanging wall; Black arrows represent the motion of the Java Block relative to Sunda Block, computed from our preferred model. Continuous black line represents active faults where coupling was assigned and dashed black lines are free-slip Block boundaries. The white boxes contain the estimates fault-parallel (red) and fault-normal (blue) slip rate component at the two segments of the 1780 and 1834 Mw 7.7 earthquakes. The inset graph shows the ratio of the total over the parallel slip rate at Java Trench as a function of the obliquity angle; the black dots are from Model A and the red dots are derived from earthquake slip vectors from McCaffrey (1994). (For interpretation of the references to color in this figure legend, the reader is referred to the web version of this article.)
detected, with a pattern of strain accumulation (Fig. S5). A change in the velocity within this distance range cannot be explained by variable coupling on the subduction interface because the top of the slab is substantially more than 100 km deep in this vicinity. Therefore, we attribute this gradient to activity along the Baribis Thrust. We modeled this fault as a boundary in the block model by prolonging westward the boundary of the Kendeng Thrust fol-lowing Simandjuntak and Barber (1996). Fault slip rates shown in Fig. 8 are the results of decomposing the relative motion on block boundaries derived from our inversion into fault-parallel and fault-normal motions. The obtained fault-normal convergence rates across Java show an increase from ∼58.3 ±0.5 mm/yr in the west-ern section to ∼65 ± 0.4 mm/yr south of Bali. These estimates are generally consistent with previous studies (Tregoning et al., 1994;Simons et al., 2007) considering their level of uncertainties, even though our model suggests that part of the convergence is ac-commodated on the Kendeng–Baribis Thrust. This structure takes up a sinistral shear component with an average rate of ∼5.6 ±0.9 mm/yr across the Baribis Thrust and which varies between 2.3 and 4.1 mm/yr on the Kendeng Thrust. At the same time, we pre-dict a parallel component of motion on the western segment of the Java Trench, which decreases from 21.7 mm/yr to 0.7 mm/yr at ∼108.5◦E, with right-lateral sense, then increases up to 1.9 mm/yr between 109◦E and 115◦E in an opposite left-lateral motion. The change in the sense of the trench-parallel component of motion is consistent with the change in obliquity of the convergence relative to the trench-normal as well as the counterclockwise rotation of the Java Block. The mode of deformation partitioning in this area is a consequence of the geometrical configuration of the Java Trench with respect to the Kendeng–Baribis Thrust system. Although the two fault systems might appear parallel, the Java Trench develops a slight concavity west of 108.5◦E, producing a condition where
the change in obliquity favors an inversion of the trench-parallel motion sense to right-lateral (Fig. 8-inset). Conversely to the clas-sic model of parallel thrust and strike-slip as suggested by Fitch(1972), this situation shows how geometrical variations of the plate margin might change the small-scale strain partitioning. On the other hand, the prediction of a parallel component of motion along the Java Trench proves that a full partitioning of deformation is not achieved, in agreement with the McCaffrey (1992)’s model which suggests that obtaining a complete partitioning is difficult in situations of low obliquity angles below 45◦ .
The assumption of the long-term elasticity of the Java Block can be tested by estimating an internal uniform strain rate tensor as suggested by McCaffrey (2005), which might represent any unac-counted deformation within the Block. We tested this hypothesis for the Java Block and did not find any significant improvement in the χ2 misfit. However, the estimated permanent strain rate within the block is ∼13.5 ± 5.1 ns/yr of approximately NNW–SSE extension, in contrast to an expected trench-parallel extension as a result of the increase in the convergence obliquity as suggest by McCaffrey (1991) and Lallemand et al. (1999) in similar situations. Although there is a reduction of an average of 1 mm/yr in the par-allel component of slip rate along the Baribis Thrust, we think that the strain rate tensor is not well constrained and it might absorb some of the unmodeled residuals resulting from uncorrected post-seismic effects or from an incorrect geometry of the faults used. On the other hand, to rule out the possibility of a trade-off be-tween the localized strain due to coupling along the Java Trench and the estimation of the strain rate tensor, we have tested differ-ent locking depths from 5 to 15 km, and we found no significant correlation between the two parameters. Hence, we preferred not to include a uniform strain tensor in our best-fit model. Only the addition of spatially dense GPS stations with a long time span will
JID:EPSL AID:14144 /SCO [m5G; v1.190; Prn:8/11/2016; 12:04] P.10 (1-11)
10 A. Koulali et al. / Earth and Planetary Science Letters ••• (••••) •••–•••
allow small-strain distributed deformation to be resolved. For in-stance, the shallow and intermediate earthquakes observed in the Cimandiri Valley (Dardji et al., 1994) could be the expression of a widely distributed low strain zone in the Cimandiri Valley. In any case, the long-term post-seismic relaxation residuals hamper our ability to discern the long-term deformation.
We have identified a zone of active convergence stretching east-to-west across northern Java, which may have significant seismic hazard implications for Java’s very large and vulnerable population. A slip rate of 4–5 mm/yr could result in significant earthquake activity, but the only three crustal earthquakes resulting in 100 or more deaths in Java since instrumental recording began in the early 20th century occurred farther south in central Java (Untang et al., 1985). On the other hand, there are historical accounts of sev-eral large earthquakes having occurred in Java. The 1780 and 1834 crustal earthquakes in west Java are some of the most destruc-tive earthquakes known to have occurred there, with estimated magnitudes of 8.5 and 7.0–7.7, respectively (Albini et al., 2014;Nguyen et al., 2015; Harris and Major, 2016). Other large events not cited in the present study occurred in Java during the colo-nial period, but there is less clear evidence as to whether they were intraslab or mega-thrust related (Harris and Major, 2016;Nguyen et al., 2015). Assuming that the 1780 Mw 7 earthquake completely ruptured a segment of 41 km length (Nguyen et al., 2015), and using a scaling law as proposed by McCaffrey (2008), the average slip during this earthquake is 112.5 cm. Using the ap-proach of Molnar (1979), and considering our average estimated slip rate of 5 mm/yr along the Baribis Thrust, the recurrence inter-val would then be equal to ∼600 yrs, which is in agreement with the lack of recent earthquakes in the area if the earthquake activity is episodic – i.e. if a series of earthquakes during or preceding the colonial period (when the historical record began) relieved stress along the whole length of the convergence zone. An alternative explanation would be that strain release occurs aseismically. Only further, more refined geodetic and/or seismic studies can distin-guish between these two hypotheses.
6. Conclusion
The multi-epoch continuous GPS observations in Java (2008–2011 and 2011–2014) reveal a long-term post-seismic transient deformation following the Java 2006 Mw 7.7 earthquake. After the correction for this transient using a physically-based post-seismic relaxation model, we show that the Java forearc is moving inde-pendently from the Sunda Block in a counterclockwise direction consistent with the NE–SW convergence between the Australian Plate and the Sunda Block. Rates of motion associated with this rotation increase towards East Java. The velocity field presented in this study also showed a N–S gradient across the Kendeng and Baribis Thrusts in Java, indicating that this boundary is ac-cumulating strain at a rate of between 2.3 and 5.6 mm/yr. This low deformation zone correlates well with the historical records of ruptured segments. In order to provide estimates of slip rates along active faults, we have developed a simple block model on the basis of the interpretation of GPS velocities as well as seis-mic and geological observations. Our results suggest a model of slip partitioning between the Java Trench and the Baribis–Kendeng Thrust system, controlled by the convergence obliquity. We predict a convergence across the Java Trench decreasing from 65 mm/yr to 58 mm/yr towards the western section of Java Trench. As the con-vergence obliquity starts to increase westward of ∼108◦E, the rate of slip partitioning becomes significant and we estimate an aver-age of ∼5.6 mm/yr of fault parallel relative motion on the Baribis Thrust. The rest of the parallel motion is accommodated as oblique right-lateral slip on the Java trench in a sense opposite to that of the Baribis Thrust.
Although the Java subduction zone has always been consid-ered a candidate for generating a megathrust earthquake, little attention has been paid to the seismogenic structures within the island. The 1780 and 1834 earthquakes require special attention because of the proximity of the ruptured segments to Jakarta, one of the world’s largest cities. More detailed geomorphological in-vestigations are needed to accurately map the fault traces and to constrain the slip deficit along the Baribis Thrust. On the other hand, our results show that the inland GPS measurements do not provide sufficient information about the strain accumulation on the megathrust and emphasize the need for conducting seafloor geodetic investigations in order to understand the seismogenesis on the shallowest portion of the megathrust.
Acknowledgements
We thank Aron Meltzner and an anonymous referee for their thoughtful reviews and detailed comments which helped largely to improve the manuscript quality. We are grateful to the many indi-viduals who participated in the installation and the maintenance of the continuous GPS network in Java and to the Badan Informasi Geospasial (BIG) for the technical support. The maps in this paper were generated using the public domain Generic Mapping Tools (GMT) software (Wessel and Smith, 1998). The GPS data were com-puted on the Terrawulf II computational facility at the Research School of Earth Sciences (ANU), a facility supported through the AuScope initiative. This research was supported under the Aus-tralian Research Council’s Linkage Projects funding scheme, grant LP110100525 and the Australian Dept. Foreign Affairs Grant 71982. A.K. was partly supported by the ARC Linkage grant LP130100134.
Appendix A. Supplementary material
Supplementary material related to this article can be found on-line at http://dx.doi.org/10.1016/j.epsl.2016.10.039.
References
Abercrombie, R.E., Antolik, M., Felzer, K., Ekström, G., 2001. The 1994 Java tsunami earthquake: slip over a subducting seamount. J. Geophys. Res., Solid Earth 106, 6595–6607.
Abidin, H.Z., Andreas, H., Kato, T., Ito, T., Meilano, I., Kimata, F., Natawidjaya, D.H., Harjono, H., 2009. Crustal deformation studies in Java (Indonesia) using GPS. J. Earthq. Tsunami 03, 77–88.
Albini, P., Musson, R.M.W., Rovida, A., Locati, M., Capera, A.A.G., Viganó, D., 2014. The global earthquake history. Earthq. Spectra 30, 607–624.
Bilek, S.L., Engdahl, E.R., 2007. Rupture characterization and aftershock relocations for the 1994 and 2006 tsunami earthquakes in the Java subduction zone. Geo-phys. Res. Lett. 34, L20311.
Billen, M.I., Gurnis, M., 2001. A low viscosity wedge in subduction zones. Earth Planet. Sci. Lett. 193, 227–236.
Bock, Y., Prawirodirdjo, L., Genrich, J.F., Stevens, C.W., McCaffrey, R., Subarya, C., Puntodewo, S.S.O., Calais, E., 2003. Crustal motion in Indonesia from global po-sitioning system measurements. J. Geophys. Res., Solid Earth 108, 2367.
Bürgmann, R., Dresen, G., 2008. Rheology of the lower crust and upper mantle: ev-idence from rock mechanics, geodesy, and field observations. Annu. Rev. Earth Planet. Sci. 36, 531–567.
Bürgmann, R., Kogan, M.G., Steblov, G.M., Hilley, G., Levin, V.E., Apel, E., 2005. In-terseismic coupling and asperity distribution along the Kamchatka subduction zone. J. Geophys. Res., Solid Earth 110, B07405.
Chaussard, E., Amelung, F., Abidin, H., Hong, S.H., 2013. Sinking cities in Indonesia: {ALOS} {PALSAR} detects rapid subsidence due to groundwater and gas extrac-tion. Remote Sens. Environ. 128, 150–161.
Dardji, N., Villemin, T., Rampnoux, J., 1994. Symposium on the dynamics of sub-duction and its products paleostresses and strike-slip movement: the Cimandiri fault zone, West Java, Indonesia. J. Southeast Asian Earth Sci. 9, 3–11.
DeMets, C., Márquez-Azúa, B., Cabral-Cano, E., 2014. A new GPS velocity field for the Pacific Plate – part 1: constraints on plate motion, intraplate deformation, and the viscosity of Pacific basin asthenosphere. Geophys. J. Int. 199, 1878–1899.
Ekström, G., Nettles, M., Dziewonski, A., 2012. The global CMT project 2004–2010: centroid-moment tensors for 13,017 earthquakes. Phys. Earth Planet. Inter. 200, 1–9.
JID:EPSL AID:14144 /SCO [m5G; v1.190; Prn:8/11/2016; 12:04] P.11 (1-11)
A. Koulali et al. / Earth and Planetary Science Letters ••• (••••) •••–••• 11
Ergintav, S., McClusky, S., Hearn, E., Reilinger, R., Cakmak, R., Herring, T., Ozener, H., Lenk, O., Tari, E., 2009. Seven years of postseismic deformation following the 1999, m = 7.4 and m = 7.2, Izmit-Düzce, Turkey earthquake sequence. J. Geo-phys. Res., Solid Earth 114, B07403.
Fitch, T.J., 1972. Plate convergence, transcurrent faults, and internal deformation ad-jacent to Southeast Asia and the Western Pacific. J. Geophys. Res. 77, 4432–4460.
Freed, A.M., Bürgmann, R., Calais, E., Freymueller, J., Hreinsdóttir, S., 2006. Impli-cations of deformation following the 2002 Denali, Alaska, earthquake for post-seismic relaxation processes and lithospheric rheology. J. Geophys. Res., Solid Earth 111, B01401.
Hall, R., Clements, B., Smyth, H., Cottam, M., 2007. A new interpretation of Java’s structure. In: Proceedings 31st Annual Convention. Indonesian Petroleum Asso-ciation, pp. 63–86.
Hanifa, N.R., Sagiya, T., Kimata, F., Efendi, J., Abidin, H.Z., Meilano, I., 2014. Interplate coupling model off the southwestern coast of Java, Indonesia, based on contin-uous {GPS} data in 2008–2010. Earth Planet. Sci. Lett. 401, 159–171.
Harris, R., Major, J., 2016. Waves of destruction in the East Indies: the Wichmann catalogue of earthquakes and tsunami in the Indonesian region from 1538 to 1877. Geol. Soc. (Lond.) Spec. Publ. 441.
Hayes, G.P., Wald, D.J., Johnson, R.L., 2012. Slab1.0: a three-dimensional model of global subduction zone geometries. J. Geophys. Res., Solid Earth 117, B01302.
Hearn, E.H., McClusky, S., Ergintav, S., Reilinger, R.E., 2009. Izmit earthquake post-seismic deformation and dynamics of the North Anatolian fault zone. J. Geophys. Res., Solid Earth 114, B08405.
Herring, T.A., King, R.W., McClusky, S.C., 2010. Introduction to GAMIT/GLOBK. Re-lease 10.4. Massachusetts Institute of Technology, Cambridge.
Hill, E.M., Yue, H., Barbot, S., Lay, T., Tapponnier, P., Hermawan, I., Hubbard, J., Baner-jee, P., Feng, L., Natawidjaja, D., Sieh, K., 2015. The 2012 Mw 8.6 Wharton basin sequence: a cascade of great earthquakes generated by near-orthogonal, young, oceanic mantle faults. J. Geophys. Res., Solid Earth 120, 3723–3747. 2014JB011703.
Hoffmann-Rothe, A., Ritter, O., Haak, V., 2001. Magnetotelluric and geomagnetic modelling reveals zones of very high electrical conductivity in the upper crust of central Java. Phys. Earth Planet. Inter. 124, 131–151.
Kopp, H., Flueh, E., Petersen, C., Weinrebe, W., Wittwer, A., Scientists, M., 2006. The Java margin revisited: evidence for subduction erosion off Java. Earth Planet. Sci. Lett. 242, 130–142.
Kopp, H., Hindle, D., Klaeschen, D., Oncken, O., Reichert, C., Scholl, D., 2009. Anatomy of the western Java plate interface from depth-migrated seismic images. Earth Planet. Sci. Lett. 288, 399–407.
Koulali, A., Susilo, S., McClusky, S., Meilano, I., Cummins, P., Tregoning, P., Lister, G., Efendi, J., Syafi’i, M.A., 2016. Crustal strain partitioning and the associated earthquake hazard in the eastern Sunda-Banda Arc. Geophys. Res. Lett. 43, 1943–1949. 2016GL067941.
Koulali, A., Tregoning, P., McClusky, S., Stanaway, R., Wallace, L., Lister, G., 2015. New insights into the present-day kinematics of the central and western Papua New Guinea from GPS. Geophys. J. Int. 202, 993–1004.
Lallemand, S., Liu, C.S., Dominguez, S., Schnürle, P., Malavieille, J., 1999. Trench-parallel stretching and folding of forearc basins and lateral migration of the accretionary wedge in the Southern Ryukyus: a case of strain partition caused by oblique convergence. Tectonics 18, 231–247.
Lay, T., 2015. The surge of great earthquakes from 2004 to 2014. Earth Planet. Sci. Lett. 409, 133–146.
Loveless, J.P., Meade, B.J., 2010. Geodetic imaging of plate motions, slip rates, and partitioning of deformation in Japan. J. Geophys. Res., Solid Earth 115, B02410.
Malod, J., Karta, K., Beslier, M., Zen, M., 1995. From normal to oblique subduc-tion: tectonic relationships between Java and Sumatra. J. Southeast Asian Earth Sci. 12, 85–93.
McCaffrey, R., 1991. Slip vectors and stretching of the Sumatran fore arc. Geology 19, 881–884.
McCaffrey, R., 1992. Oblique plate convergence, slip vectors, and forearc deforma-tion. J. Geophys. Res., Solid Earth 97, 8905–8915.
McCaffrey, R., 1994. Global variability in subduction thrust zone-forearc systems. Pure Appl. Geophys. 142, 173–224.
McCaffrey, R., 2005. Block kinematics of the Pacific–North America plate boundary in the Southwestern United States from inversion of GPS, seismological, and ge-ologic data. J. Geophys. Res., Solid Earth 110, B07401.
McCaffrey, R., 2008. Global frequency of magnitude 9 earthquakes. Geology 36, 263–266.
McCaffrey, R., Qamar, A.I., King, R.W., Wells, R., Khazaradze, G., Williams, C.A., Stevens, C.W., Vollick, J.J., Zwick, P.C., 2007. Fault locking, block rotation and crustal deformation in the Pacific Northwest. Geophys. J. Int. 169, 1315–1340.
Meilano, I., Abidin, H.Z., Andreas, H., Gumilar, I., Sarsito, D., Rahma Hanifa, R., Har-jono, H., Kato, T., Kimata, F., Fukuda, Y., 2012. Slip rate estimation of the Lem-bang fault west Java from geodetic observation. J. Disast. Res. 7.
Molnar, P., 1979. Earthquake recurrence intervals and plate tectonics. Bull. Seismol. Soc. Am. 69, 115–133.
Newcomb, K.R., McCann, W.R., 1987. Seismic history and seismotectonics of the Sunda arc. J. Geophys. Res., Solid Earth 92, 421–439.
Nguyen, N., Cipta, A., Cummins, P., Griffin, J., 2015. Indonesia’s Historical Earth-quakes: Modelled Examples for Improving the National Hazard Map. Canberra Geoscience Australia.
Perfettini, H., Avouac, J.P., Tavera, H., Kositsky, A., Nocquet, J.M., Bondoux, F., Chlieh, M., Sladen, A., Audin, L., Farber, D.L., et al., 2010. Seismic and aseismic slip on the central Peru megathrust. Nature 465, 78–81.
Pollitz, F.F., 1997. Gravitational viscoelastic postseismic relaxation on a layered spherical earth. J. Geophys. Res., Solid Earth 102, 17921–17941.
Pollitz, F.F., Bürgmann, R., Banerjee, P., 2006. Post-seismic relaxation following the great 2004 Sumatra–Andaman earthquake on a compressible self-gravitating earth. Geophys. J. Int. 167, 397–420.
Pollitz, F.F., Thatcher, W., 2010. On the resolution of shallow mantle viscosity struc-ture using postearthquake relaxation data: application to the 1999 hector mine, California, earthquake. J. Geophys. Res., Solid Earth 115, B10412.
Reilinger, R., McClusky, S., Vernant, P., Lawrence, S., Ergintav, S., Cakmak, R., Ozener, H., Kadirov, F., Guliev, I., Stepanyan, R., Nadariya, M., Hahubia, G., Mahmoud, S., Sakr, K., ArRajehi, A., Paradissis, D., Al-Aydrus, A., Prilepin, M., Guseva, T., Evren, E., Dmitrotsa, A., Filikov, S.V., Gomez, F., Al-Ghazzi, R., Karam, G., 2006. GPS constraints on continental deformation in the Africa–Arabia–Eurasia con-tinental collision zone and implications for the dynamics of plate interactions. J. Geophys. Res., Solid Earth 111, B05411.
Schlüter, H.U., Gaedicke, C., Roeser, H.A., Schreckenberger, B., Meyer, H., Reichert, C., Djajadihardja, Y., Prexl, A., 2002. Tectonic features of the southern Sumatra–western Java forearc of Indonesia. Tectonics 21, 11-1–11-15, 1047.
Simandjuntak, T.O., Barber, A.J., 1996. Contrasting tectonic styles in the neogene oro-genic belts of Indonesia. Geol. Soc. (Lond.) Spec. Publ. 106, 185–201.
Simons, W.J.F., Socquet, A., Vigny, C., Ambrosius, B.A.C., Haji Abu, S., Promthong, C., Subarya, C., Sarsito, D.A., Matheussen, S., Morgan, P., Spakman, W., 2007. A decade of GPS in Southeast Asia: resolving Sundaland motion and boundaries. J. Geophys. Res., Solid Earth 112, B06420.
Tregoning, P., Brunner, F.K., Bock, Y., Puntodewo, S.S.O., McCaffrey, R., Genrich, J.F., Calais, E., Rais, J., Subarya, C., 1994. First geodetic measurement of convergence across the Java trench. Geophys. Res. Lett. 21, 2135–2138.
Tregoning, P., Burgette, R., McClusky, S.C., Lejeune, S., Watson, C.S., McQueen, H., 2013. A decade of horizontal deformation from great earthquakes. J. Geophys. Res., Solid Earth 118, 2371–2381.
Tregoning, P., Watson, C., 2009. Atmospheric effects and spurious signals in GPS analyses. J. Geophys. Res., Solid Earth 114, B09403.
Tsuji, T., Yamamoto, K., Matsuoka, T., Yamada, Y., Onishi, K., Bahar, A., Meilano, I., Abidin, H.Z., 2009. Earthquake fault of the 26 May 2006 Yogyakarta earthquake observed by SAR interferometry. Earth Planets Space 61, e29–e32.
Untang, M., Arnold, E., Soetadi, R., Ismail, S., Kertapati, E., et al., 1985. Southeast Asia Association of Seismology and Earthquake Engineering (SEASEE) Series on Seismology. Volume 5: Indonesia. Technical Report. Southeast Asia Association of Seismology and Earthquake Engineering (SEASEE).
Wallace, L.M., Beavan, J., 2010. Diverse slow slip behavior at the Hikurangi subduc-tion margin, New Zealand. J. Geophys. Res., Solid Earth 115, B12402.
Wessel, P., Smith, W.H.F., 1998. New, improved version of generic mapping tools released. Eos 79, 579.
Williams, S.D.P., Bock, Y., Fang, P., Jamason, P., Nikolaidis, R.M., Prawirodirdjo, L., Miller, M., Johnson, D.J., 2004. Error analysis of continuous GPS position time series. J. Geophys. Res., Solid Earth 109, B03412.
Wölbern, I., Rümpker, G., 2016. Crustal thickness beneath central and east Java (In-donesia) inferred from p receiver functions. J. Asian Earth Sci. 115, 69–79.
Yagi, Y., Fukahata, Y., 2011. Introduction of uncertainty of Green’s function into waveform inversion for seismic source processes. Geophys. J. Int. 186, 711–720.