earth observing-1 advanced land imager flight performance ... · project report eo -1-7 earth...
TRANSCRIPT

Project Report EO-1-7
Earth Observing-1 Advanced Land Imager Flight Performance Assessment:
Noise and Dark Current Trending for the First 60 Days
J.A. Mendenhall and M.D. Gibbs
Lincoln Laboratory Massachusetts Institute of Technology
Lexington, Massachusetts
1 June 2001
Prepared for the National Aeronautics and Space Administration under Air Force Contract F19628-00-C-0002.

ii
Abstract Noise and dark current trending for the Earth Observing-1 Advanced Land Imager during its initial sixty days in orbit (November 21, 2000 – January 19, 2001) is presented. Data were collected with the focal plane operating nominally at 220 K. The results presented here indicate the magnitude and repeatability of the focal plane noise has been good and closely matches pre-flight calibration measurements. The magnitude of the focal plane dark current for all bands has also been good, closely matches pre-flight calibration measurements, and has excellent stability during individual observations. However, dark current level variability as high as 30 digital numbers for Bands 1p, 4, 4p, 5p, 5, 7, and the Panchromatic band has been observed from one observation to another and is not well understood at this time.

iii
Table of Contents
1 Introduction.............................................................................................................................................................. 1
2 Methodology............................................................................................................................................................ 1
3 Noise Trending........................................................................................................................................................ 3
4 Dark Current Trending......................................................................................................................................... 10
5 Discussion.............................................................................................................................................................. 37
6 References.............................................................................................................................................................. 38
iv
List of Figures
Figure 1: Noise trending for Band 1p. Detector outgassing occurred near DCE 55, 140, 160, 190, and 219..................................................................................................................................................................................... 3
Figure 2: Noise trending for Band 1. Detector outgassing occurred near DCE 55, 140, 160, 190, and 219. . 4
Figure 3: Noise trending for Band 2. Detector outgassing occurred near DCE 55, 140, 160, 190, and 219. . 4
Figure 4: Noise trending for Band 3. Detector outgassing occurred near DCE 55, 140, 160, 190, and 219. . 5
Figure 5: Noise trending for Band 4. Detector outgassing occurred near DCE 55, 140, 160, 190, and 219. . 5
Figure 6: Noise trending for Band 4p. Detector outgassing occurred near DCE 55, 140, 160, 190, and 219..................................................................................................................................................................................... 6
Figure 7: Noise trending for Band 5p. Detector outgassing occurred near DCE 55, 140, 160, 190, and 219..................................................................................................................................................................................... 6
Figure 8: Noise trending for Band 5. Detector outgassing occurred near DCE 55, 140, 160, 190, and 219. . 7
Figure 9: Noise trending for Band 7. Detector outgassing occurred near DCE 55, 140, 160, 190, and 219. . 7
Figure 10: Noise trending for the Panchromatic Band. Detector outgassing occurred near DCE 55, 140, 160, 190, and 219.................................................................................................................................................... 8
Figure 11: Dark current trending for Band 1p odd detectors. Detector outgassing occurred near DCE 55, 140, 160, 190, and 219......................................................................................................................................... 11
Figure 12: Dark current trending for Band 1p even detectors. Detector outgassing occurred near DCE 55, 140, 160, 190, and 219......................................................................................................................................... 12
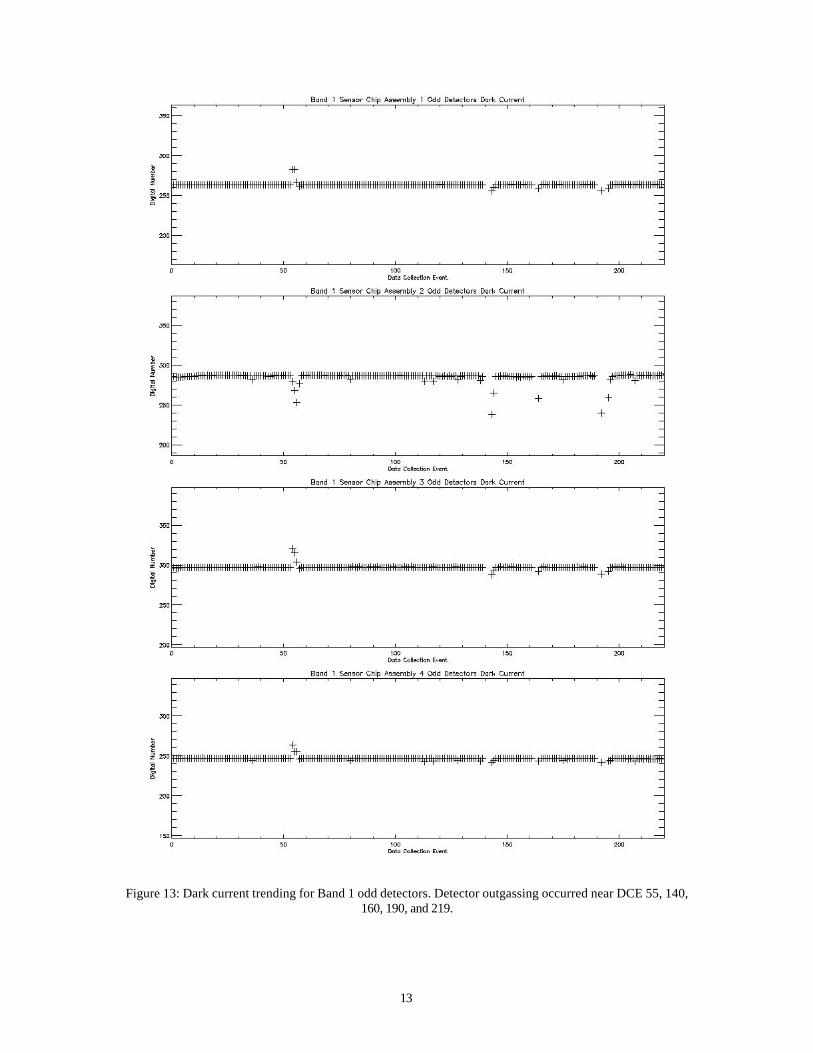
Figure 13: Dark current trending for Band 1 odd detectors. Detector outgassing occurred near DCE 55, 140, 160, 190, and 219.................................................................................................................................................. 13
Figure 14: Dark current trending for Band 1 even detectors. Detector outgassing occurred near DCE 55, 140, 160, 190, and 219......................................................................................................................................... 14
Figure 15: Dark current trending for Band 2 odd detectors. Detector outgassing occurred near DCE 55, 140, 160, 190, and 219.................................................................................................................................................. 15
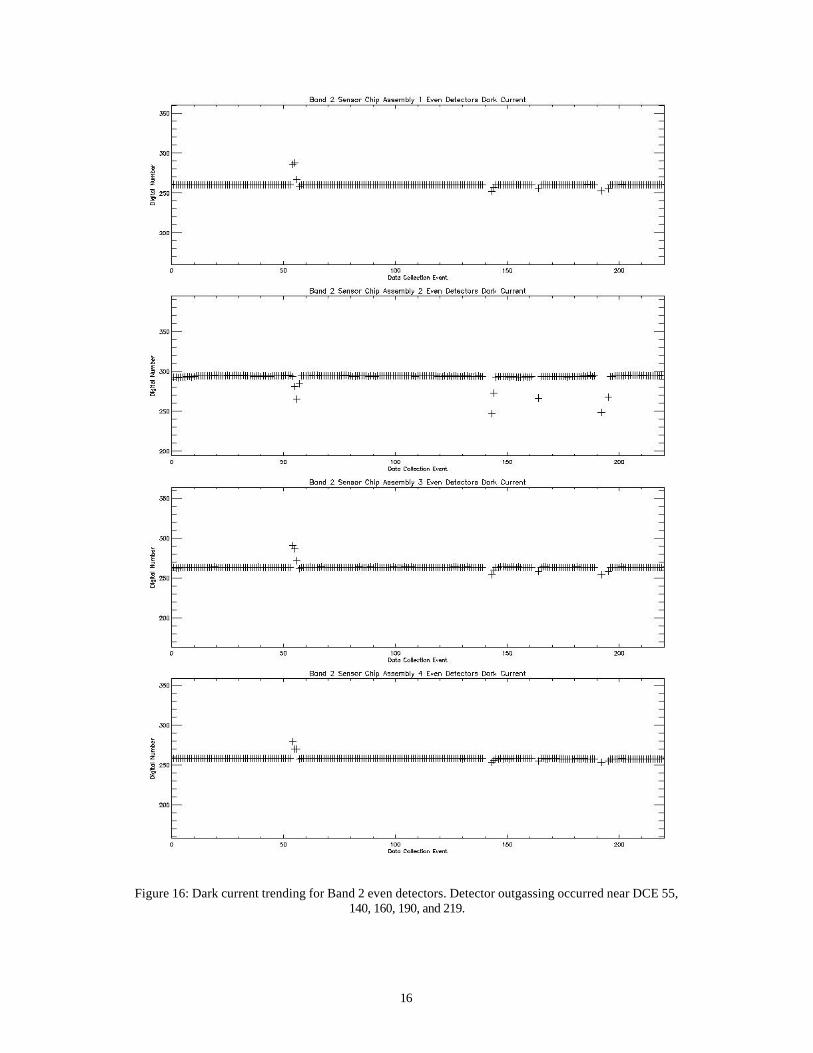
Figure 16: Dark current trending for Band 2 even detectors. Detector outgassing occurred near DCE 55, 140, 160, 190, and 219......................................................................................................................................... 16
Figure 17: Dark current trending for Band 3 odd detectors. Detector outgassing occurred near DCE 55, 140, 160, 190, and 219.................................................................................................................................................. 17
Figure 18: Dark current trending for Band 3 even detectors. Detector outgassing occurred near DCE 55, 140, 160, 190, and 219......................................................................................................................................... 18
Figure 19: Dark current trending for Band 4 odd detectors. Detector outgassing occurred near DCE 55, 140, 160, 190, and 219.................................................................................................................................................. 19

v
Figure 20: Dark current trending for Band 4 even detectors. Detector outgassing occurred near DCE 55, 140, 160, 190, and 219......................................................................................................................................... 20
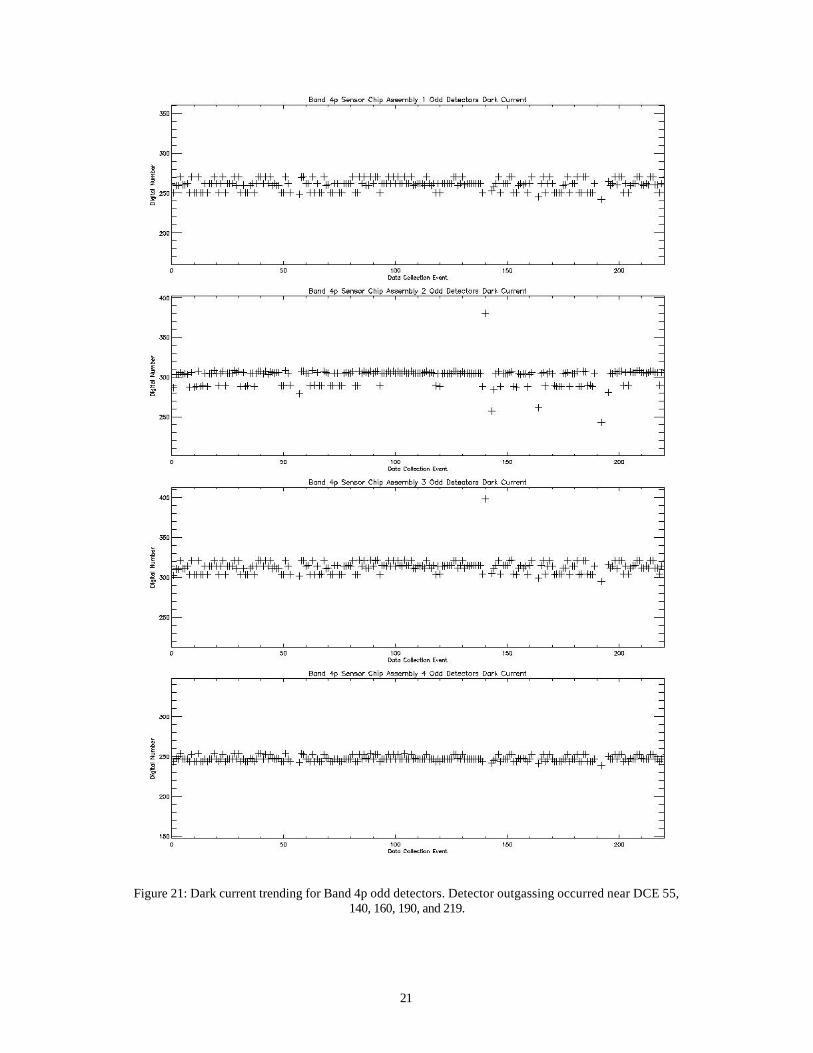
Figure 21: Dark current trending for Band 4p odd detectors. Detector outgassing occurred near DCE 55, 140, 160, 190, and 219......................................................................................................................................... 21
Figure 22: Dark current trending for Band 4p even detectors. Detector outgassing occurred near DCE 55, 140, 160, 190, and 219......................................................................................................................................... 22
Figure 23: Dark current trending for Band 5p odd detectors. Detector outgassing occurred near DCE 55, 140, 160, 190, and 219......................................................................................................................................... 23
Figure 24: Dark current trending for Band 5p even detectors. Detector outgassing occurred near DCE 55, 140, 160, 190, and 219......................................................................................................................................... 24
Figure 25: Dark current trending for Band 5 odd detectors. Detector outgassing occurred near DCE 55, 140, 160, 190, and 219.................................................................................................................................................. 25
Figure 26: Dark current trending for Band 5 even detectors. Detector outgassing occurred near DCE 55, 140, 160, 190, and 219......................................................................................................................................... 26
Figure 27: Dark current trending for Band 7 odd detectors. Detector outgassing occurred near DCE 55, 140, 160, 190, and 219.................................................................................................................................................. 27
Figure 28: Dark current trending for Band 7 even detectors. Detector outgassing occurred near DCE 55, 140, 160, 190, and 219......................................................................................................................................... 28
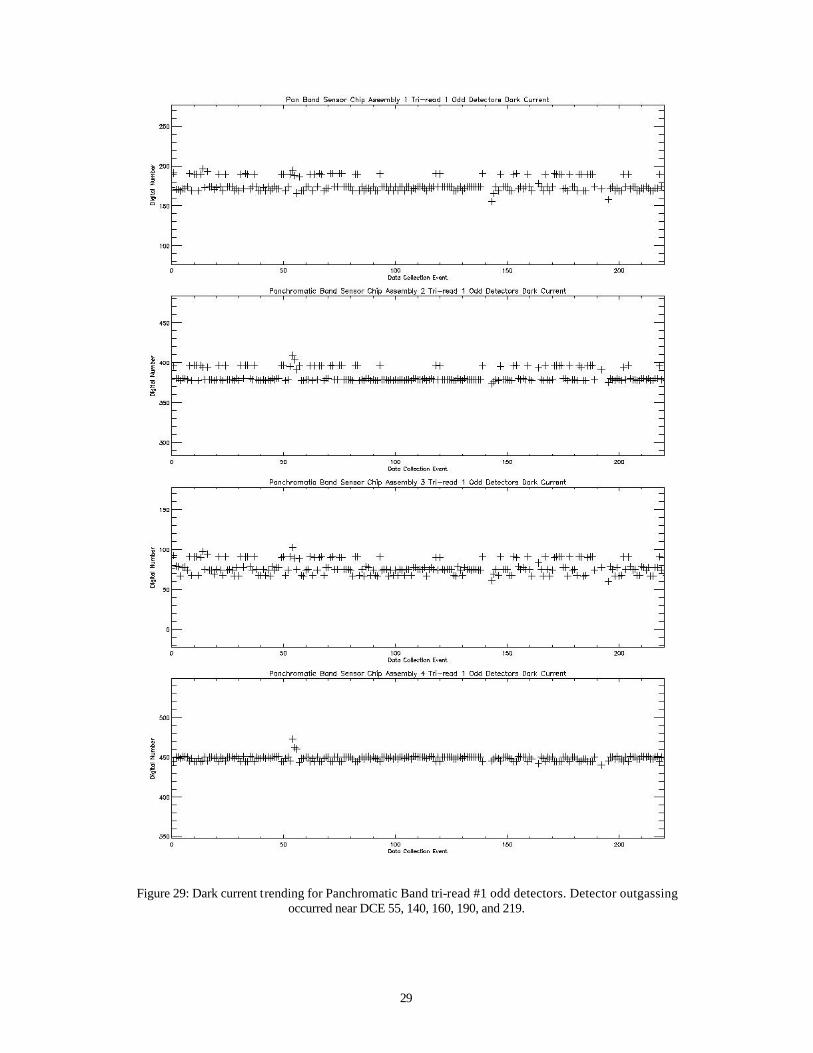
Figure 29: Dark current trending for Panchromatic Band tri-read #1 odd detectors. Detector outgassing occurred near DCE 55, 140, 160, 190, and 219............................................................................................... 29
Figure 30: Dark current trending for Panchromatic Band tri-read #2 odd detectors. Detector outgassing occurred near DCE 55, 140, 160, 190, and 219............................................................................................... 30
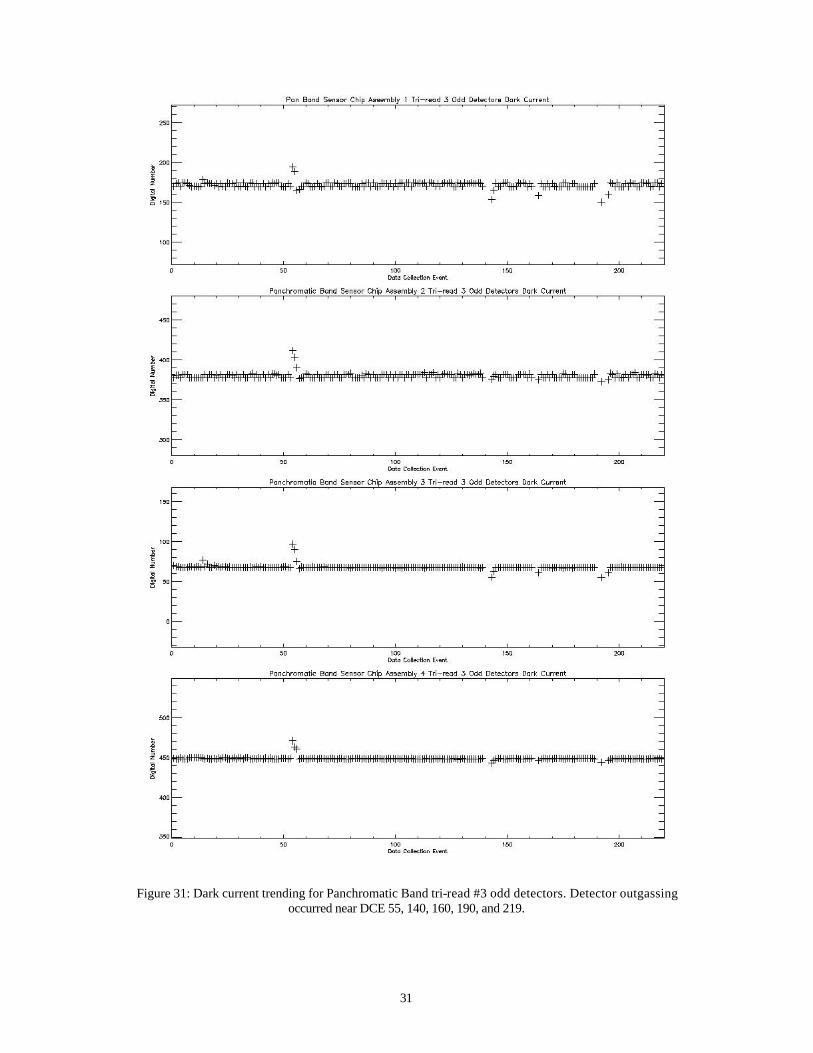
Figure 31: Dark current trending for Panchromatic Band tri-read #3 odd detectors. Detector outgassing occurred near DCE 55, 140, 160, 190, and 219............................................................................................... 31
Figure 32: Dark current trending for Panchromatic Band tri-read #1 even detectors. Detector outgassing occurred near DCE 55, 140, 160, 190, and 219............................................................................................... 32
Figure 33: Dark current trending for Panchromatic Band tri-read #2 even detectors. Detector outgassing occurred near DCE 55, 140, 160, 190, and 219............................................................................................... 33
Figure 34: Dark current trending for Panchromatic Band tri-read #3 even detectors. Detector outgassing occurred near DCE 55, 140, 160, 190, and 219............................................................................................... 34

vi
List of Tables
Table 1: Data Collection Event Dates .......................................................................................................................... 1
Table 2: Noise Trending Statistics................................................................................................................................ 9
Table 3: Dark Current Trending Statistics................................................................................................................. 35

1
1 Introduction The Advanced Land Imager (ALI) was built at MIT Lincoln Laboratory and is meant to serve as a technology demonstration for a possible future Landsat instrument1-5. Two key areas of this demonstration are sustainable low noise performance and stable, repeatable dark current levels. The ALI was successfully launched into orbit aboard the Earth Observing-1 spacecraft by a Boeing Delta II rocket on November 21, 2000. This document provides detector noise and dark current trending results of the Advanced Land Imager during its first sixty days in orbit (November 21, 2000 – January 19, 2001). Data will be trended for each of the ten spectral bands and each of the four sensor chip assemblies. 2 Methodology The noise and dark current of the Advanced Land Imager have been trended using dark current data collected as a part of daily Earth scene observations. During a typical data collection event or DCE, two seconds of dark current are collected before and after the Earth scene is imaged. These dark currents are used to establish baselines for all detectors for the corresponding observation and are also used to monitor the noise of the focal plane over time. For each DCE, the data from the second two-second dark period is used for the trending in this report=. The focal plane has been divided into several sections for this analysis, owing to the different noise and dark current produced by different detectors. For the noise analysis, the focal plane is divided by band and SCA. For the dark current analysis, odd and even detectors are treated separately for all bands. Results for the Panchromatic band have been additionally divided by tri-reads (each Panchromatic detector is read three times for each Multispectral detector read. Each tri-read results in a different dark current value for each detector.). Finally, SCA 4 for the SWIR bands has been divided into four sections to account for the enhanced dark current values observed near detector 1200. For each data collection event, the noise has been calculated as the mean of individual detector noise values and the dark current has been calculated as the mean of individual detector dark current values. Data collection event numbers, calendar dates and days since launch are provided as a reference in Table 1. = All SWIR detectors have a transient effect associated with the initial data collected following the focal plane turn-on. Additionally, ground processing sometimes requires fill data to be added to the end of each data set. As a result, the first and last twenty-five frames from all data sets have been excluded from trending analysis.
Table 1: Data Collection Event Dates

2
Year GMT Day Day* Data Collection Event Count
330 5 1-3 331 6 4 336 11 5-6 337 12 7-8 338 13 9-10 339 14 11-12 340 15 13-14 341 16 15-17 342 17 18-20 343 18 21 344 19 22-23 345 20 24-27 346 21 28-29 347 22 30-32 348 23 33-36 349 24 37-41 350 25 42-44 351 26 45-46 352 27 47-51 353 28 52-54 354 29 55-59 355 30 60-63 356 31 64-66 357 32 67-70 358 33 7174 359 34 75-79 360 35 80-87 361 36 88-92 362 37 93-98 363 38 99-103 364 39 104-110 365 40 111-116
2000
366 41 117-119 001 42 120-123 002 43 124-129 003 44 130-137 004 45 138-143 005 46 144-150 006 47 151-154 007 48 155-159 008 49 160-164 009 50 165-168 010 51 169-172 011 52 173-178 012 53 179-185 013 54 186-192 014 55 193-198 015 56 199-203 016 57 204-207 017 58 208-213 018 59 214-217
2001
019 60 218-224 *Since launch.

3
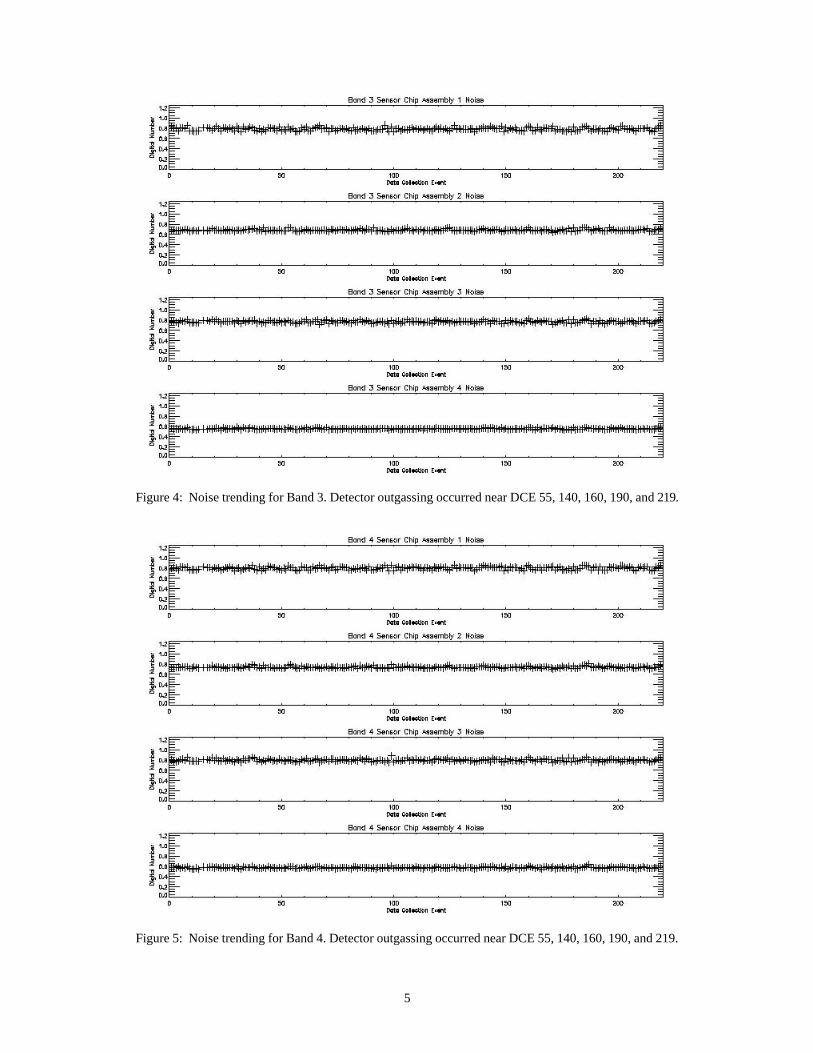
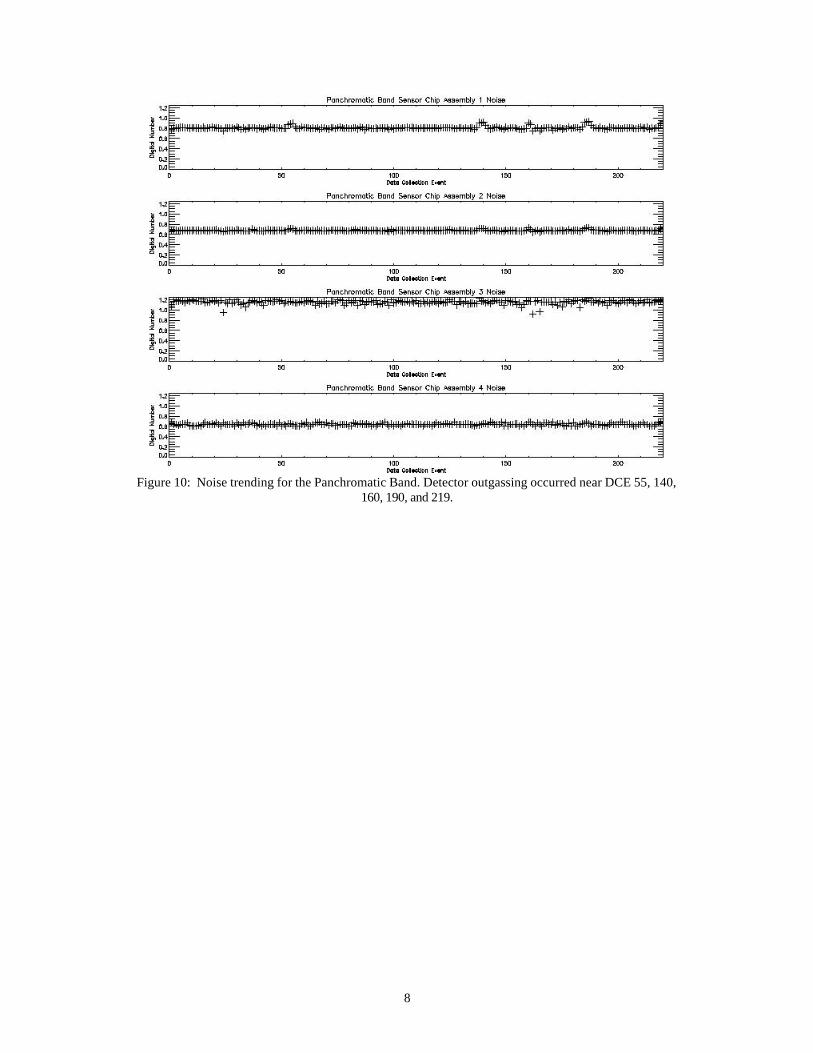
3 Noise Trending The results of the ALI focal plane noise trending are provided in Figures 1-10 and Table 2. Each figure depicts the results of an individual band. Within each figure, the results for each sensor chip assembly are provided. Table 2 lists the mean and standard deviation of noise values, grouped by bands, in a similar fashion. The mean noise value levels for all bands and SCAs is less than 1 digital number, except for the Panchromatic Band on SCA 3 (1.15 digital numbers) and Band 7 SCAs 1, 2, and 4 (1.06, 1.09, and 1.01 digital numbers, respectively). The standard deviation of detector noise is less than 0.05 digital numbers for all VNIR bands and SCAs. The repeatability of some SWIR SCAs is slightly higher with a maximum standard deviation of 0.099 digital numbers for Band 7, SCA 2. The apparent systematic increase in detector noise across several spectral bands for some particular DCEs is the result of focal plane outgassing performed at the times of those observations. All ALI detectors were heated to 270 K five times during the first sixty days in orbit to drive-off contaminant build-up on the focal plane filter surfaces. This heating resulted in increased detector dark current and noise, particularly in the short wave infrared bands (5p, 5, 7). Outgassing periods correspond to DCE numbers 55, 140, 160, 190, and 219.
Figure 1: Noise trending for Band 1p. Detector outgassing occurred near DCE 55, 140, 160, 190, and 219.

4
Figure 2: Noise trending for Band 1. Detector outgassing occurred near DCE 55, 140, 160, 190, and 219.
Figure 3: Noise trending for Band 2. Detector outgassing occurred near DCE 55, 140, 160, 190, and 219.
5
Figure 4: Noise trending for Band 3. Detector outgassing occurred near DCE 55, 140, 160, 190, and 219.
Figure 5: Noise trending for Band 4. Detector outgassing occurred near DCE 55, 140, 160, 190, and 219.

6
Figure 6: Noise trending for Band 4p. Detector outgassing occurred near DCE 55, 140, 160, 190, and 219.
Figure 7: Noise trending for Band 5p. Detector outgassing occurred near DCE 55, 140, 160, 190, and 219.

7
Figure 8: Noise trending for Band 5. Detector outgassing occurred near DCE 55, 140, 160, 190, and 219.
Figure 9: Noise trending for Band 7. Detector outgassing occurred near DCE 55, 140, 160, 190, and 219.
8
Figure 10: Noise trending for the Panchromatic Band. Detector outgassing occurred near DCE 55, 140,
160, 190, and 219.

9
Table 2: Noise Trending Statistics
Band SCA Preflight Mean
(Digital Number) Flight Mean
(Digital Number) Flight Std. Deviation
(Digital Number)
1p 1 0.88 0.81 0.030
1p 2 0.86 0.84 0.022
1p 3 0.91 0.83 0.028 1p 4 0.60 0.61 0.014
1 1 0.83 0.78 0.029
1 2 0.73 0.69 0.017 1 3 0.87 0.78 0.021
1 4 0.54 0.55 0.012
2 1 0.82 0.78 0.028 2 2 0.70 0.68 0.017
2 3 0.84 0.77 0.022
2 4 0.53 0.53 0.012 3 1 0.83 0.78 0.030
3 2 0.72 0.69 0.018
3 3 0.85 0.77 0.022 3 4 0.55 0.55 0.010
4 1 0.86 0.80 0.029
4 2 0.77 0.74 0.019 4 3 0.88 0.80 0.022
4 4 0.57 0.57 0.013
4p 1 0.85 0.80 0.027 4p 2 0.78 0.75 0.018
4p 3 0.87 0.80 0.022
4p 4 0.58 0.58 0.016 5p 1 0.92 0.97 0.042
5p 2 0.83 0.94 0.031
5p 3 0.92 0.88 0.021 5p 4 0.75 0.81 0.025
5 1 0.87 0.83 0.035
5 2 0.75 0.74 0.035 5 3 0.89 0.83 0.037
5 4 0.67 0.70 0.024
7 1 0.99 1.06 0.068 7 2 0.90 1.09 0.099
7 3 0.98 0.97 0.031
7 4 0.90 1.01 0.037 Pan 1 0.80 0.81 0.029
Pan 2 0.67 0.68 0.013
Pan 3 1.05 1.15 0.039 Pan 4 0.64 0.64 0.021
10
4 Dark Current Trending The results of the ALI focal plane dark current trending for Bands 1p, 1, 2, 3, 4, 4p are provided in Figures 11-22. Each figure depicts the results of an individual band. Within each figure, the results of odd and even detectors for each sensor chip assembly are provided. The results of dark current trending for Bands 5p, 5, and 7 are provided in Figures 23-28. Each figure depicts the results of an individual band. Within each figure, the results of odd and even detectors for each sensor chip assembly are provided. SCA 4 is further divided into four quadrants, owing to the rapid change in dark current near the previously identified ‘hot spot’ near detector 12006. Finally, the results of dark current trending for the Panchromatic Band are provided in Figures 29-34. Each figure depicts the results of an individual tri-read. Within each figure, the results of odd and even detectors for each sensor chip assembly are provided. Table 3 lists the mean and standard deviation of dark current values, grouped by bands, in a similar fashion.

11
Figure 11: Dark current trending for Band 1p odd detectors. Detector outgassing occurred near DCE 55, 140, 160, 190, and 219.

12
Figure 12: Dark current trending for Band 1p even detectors. Detector outgassing occurred near DCE 55, 140, 160, 190, and 219.
13
Figure 13: Dark current trending for Band 1 odd detectors. Detector outgassing occurred near DCE 55, 140,
160, 190, and 219.

14
Figure 14: Dark current trending for Band 1 even detectors. Detector outgassing occurred near DCE 55, 140, 160, 190, and 219.

15
Figure 15: Dark current trending for Band 2 odd detectors. Detector outgassing occurred near DCE 55, 140,
160, 190, and 219.
16
Figure 16: Dark current trending for Band 2 even detectors. Detector outgassing occurred near DCE 55, 140, 160, 190, and 219.

17
Figure 17: Dark current trending for Band 3 odd detectors. Detector outgassing occurred near DCE 55, 140,
160, 190, and 219.

18
Figure 18: Dark current trending for Band 3 even detectors. Detector outgassing occurred near DCE 55, 140, 160, 190, and 219.

19
Figure 19: Dark current trending for Band 4 odd detectors. Detector outgassing occurred near DCE 55, 140,
160, 190, and 219.

20
Figure 20: Dark current trending for Band 4 even detectors. Detector outgassing occurred near DCE 55, 140, 160, 190, and 219.
21
Figure 21: Dark current trending for Band 4p odd detectors. Detector outgassing occurred near DCE 55, 140, 160, 190, and 219.

22
Figure 22: Dark current trending for Band 4p even detectors. Detector outgassing occurred near DCE 55, 140, 160, 190, and 219.

23
Figure 23: Dark current trending for Band 5p odd detectors. Detector outgassing occurred near DCE 55, 140, 160, 190, and 219.

24
Figure 24: Dark current trending for Band 5p even detectors. Detector outgassing occurred near DCE 55, 140, 160, 190, and 219.

25
Figure 25: Dark current trending for Band 5 odd detectors. Detector outgassing occurred near DCE 55, 140,
160, 190, and 219.

26
Figure 26: Dark current trending for Band 5 even detectors. Detector outgassing occurred near DCE 55, 140, 160, 190, and 219.

27
Figure 27: Dark current trending for Band 7 odd detectors. Detector outgassing occurred near DCE 55, 140,
160, 190, and 219.

28
Figure 28: Dark current trending for Band 7 even detectors. Detector outgassing occurred near DCE 55, 140, 160, 190, and 219.
29
Figure 29: Dark current trending for Panchromatic Band tri-read #1 odd detectors. Detector outgassing occurred near DCE 55, 140, 160, 190, and 219.

30
Figure 30: Dark current trending for Panchromatic Band tri-read #2 odd detectors. Detector outgassing occurred near DCE 55, 140, 160, 190, and 219.
31
Figure 31: Dark current trending for Panchromatic Band tri-read #3 odd detectors. Detector outgassing occurred near DCE 55, 140, 160, 190, and 219.

32
Figure 32: Dark current trending for Panchromatic Band tri-read #1 even detectors. Detector outgassing occurred near DCE 55, 140, 160, 190, and 219.

33
Figure 33: Dark current trending for Panchromatic Band tri-read #2 even detectors. Detector outgassing occurred near DCE 55, 140, 160, 190, and 219.

34
Figure 34: Dark current trending for Panchromatic Band tri-read #3 even detectors. Detector outgassing occurred near DCE 55, 140, 160, 190, and 219.

35
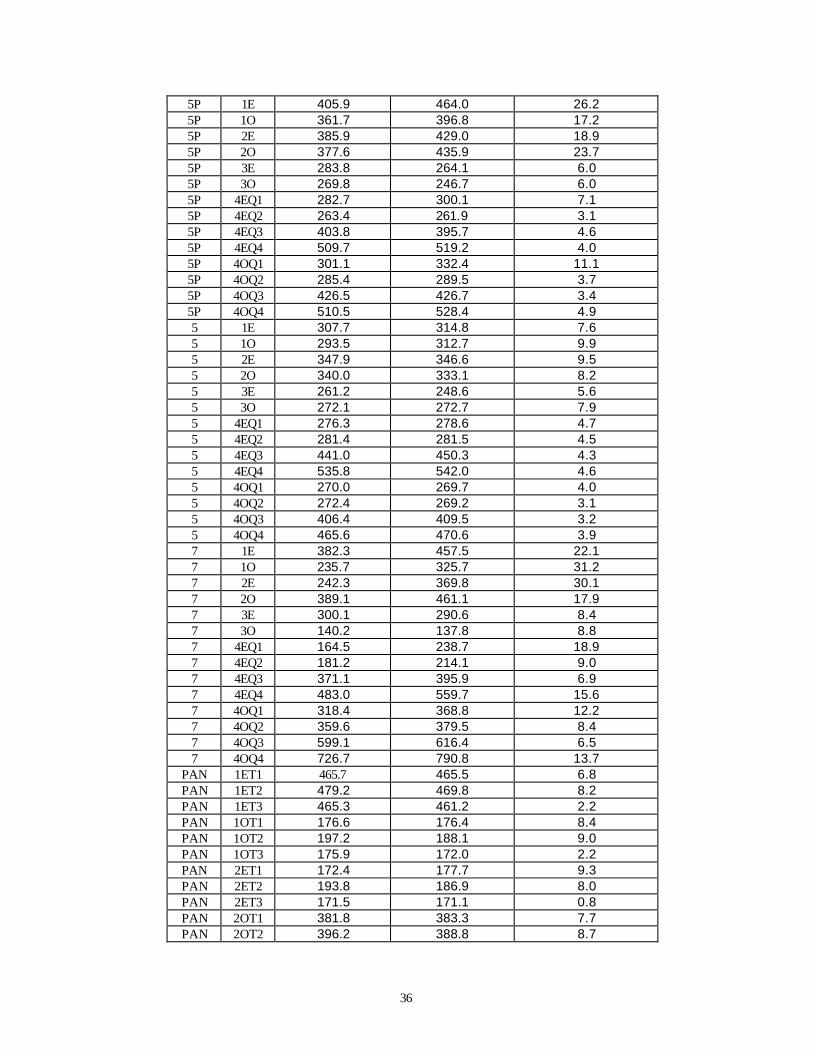
Table 3: Dark Current Trending Statistics
Band
SCA Preflight Mean
(Digital Number) Flight Mean
(Digital Number) Flight Std. Deviation
(Digital Number) 1P 1E 238.0 247.4 9.6 1P 1O 248.0 256.0 6.3 1P 2E 290.1 296.1 6.0 1P 2O 282.6 290.1 9.2 1P 3E 315.7 322.8 8.4 1P 3O 321.9 328.0 5.5 1P 4E 251.6 255.2 3.3 1P 4O 246.1 250.0 4.8 1 1E 248.2 249.3 1.2 1 1O 261.8 263.4 0.2 1 2E 318.2 320.5 0.6 1 2O 285.0 286.3 1.3 1 3E 277.7 277.1 1.1 1 3O 297.3 297.3 0.2 1 4E 257.0 257.6 0.2 1 4O 246.1 246.8 0.6 2 1E 259.5 260.5 0.1 2 1O 262.7 263.5 0.1 2 2E 292.0 294.2 0.6 2 2O 306.0 308.8 0.6 2 3E 263.6 263.3 0.2 2 3O 277.8 277.6 0.2 2 4E 257.4 258.0 0.2 2 4O 686.7 686.7 0.2 3 1E 256.9 257.7 0.1 3 1O 277.3 277.9 0.2 3 2E 283.8 285.6 0.6 3 2O 298.0 300.4 0.6 3 3E 625.2 626.2 0.3 3 3O 293.4 300.4 0.6 3 4E 261.6 262.6 0.2 3 4O 256.3 257.2 0.2 4 1E 258.6 257.1 5.8 4 1O 254.3 252.6 6.7 4 2E 292.5 289.2 7.3 4 2O 289.4 287.5 5.9 4 3E 299.9 297.7 5.1 4 3O 305.0 302.8 6.0 4 4E 255.3 255.9 3.4 4 4O 240.4 240.7 2.9
4P 1E 241.5 240.0 6.7 4P 1O 262.6 260.6 6.8 4P 2E 300.6 296.8 7.4 4P 2O 304.8 301.1 7.4 4P 3E 301.0 298.2 6.1 4P 3O 314.5 301.1 7.4 4P 4E 258.9 259.1 3.4 4P 4O 246.8 247.2 3.3
36
5P 1E 405.9 464.0 26.2 5P 1O 361.7 396.8 17.2 5P 2E 385.9 429.0 18.9 5P 2O 377.6 435.9 23.7 5P 3E 283.8 264.1 6.0 5P 3O 269.8 246.7 6.0 5P 4EQ1 282.7 300.1 7.1 5P 4EQ2 263.4 261.9 3.1 5P 4EQ3 403.8 395.7 4.6 5P 4EQ4 509.7 519.2 4.0 5P 4OQ1 301.1 332.4 11.1 5P 4OQ2 285.4 289.5 3.7 5P 4OQ3 426.5 426.7 3.4 5P 4OQ4 510.5 528.4 4.9 5 1E 307.7 314.8 7.6 5 1O 293.5 312.7 9.9 5 2E 347.9 346.6 9.5 5 2O 340.0 333.1 8.2 5 3E 261.2 248.6 5.6 5 3O 272.1 272.7 7.9 5 4EQ1 276.3 278.6 4.7 5 4EQ2 281.4 281.5 4.5 5 4EQ3 441.0 450.3 4.3 5 4EQ4 535.8 542.0 4.6 5 4OQ1 270.0 269.7 4.0 5 4OQ2 272.4 269.2 3.1 5 4OQ3 406.4 409.5 3.2 5 4OQ4 465.6 470.6 3.9 7 1E 382.3 457.5 22.1 7 1O 235.7 325.7 31.2 7 2E 242.3 369.8 30.1 7 2O 389.1 461.1 17.9 7 3E 300.1 290.6 8.4 7 3O 140.2 137.8 8.8 7 4EQ1 164.5 238.7 18.9 7 4EQ2 181.2 214.1 9.0 7 4EQ3 371.1 395.9 6.9 7 4EQ4 483.0 559.7 15.6 7 4OQ1 318.4 368.8 12.2 7 4OQ2 359.6 379.5 8.4 7 4OQ3 599.1 616.4 6.5 7 4OQ4 726.7 790.8 13.7
PAN 1ET1 465.7 465.5 6.8 PAN 1ET2 479.2 469.8 8.2 PAN 1ET3 465.3 461.2 2.2 PAN 1OT1 176.6 176.4 8.4 PAN 1OT2 197.2 188.1 9.0 PAN 1OT3 175.9 172.0 2.2 PAN 2ET1 172.4 177.7 9.3 PAN 2ET2 193.8 186.9 8.0 PAN 2ET3 171.5 171.1 0.8 PAN 2OT1 381.8 383.3 7.7 PAN 2OT2 396.2 388.8 8.7

37
PAN 2OT3 378.5 379.7 2.1 PAN 3ET1 295.8 298.9 7.3 PAN 3ET2 311.3 301.8 9.8 PAN 3ET3 295.4 293.0 2.3 PAN 3OT1 74.0 77.6 8.6 PAN 3OT2 91.9 84.2 8.4 PAN 3OT3 67.5 67.6 0.9 PAN 4ET1 226.3 225.9 2.8 PAN 4ET2 229.5 228.4 2.7 PAN 4ET3 224.5 226.2 0.9 PAN 4OT1 448.8 448.6 2.4 PAN 4OT2 451.4 446.3 1.4 PAN 4OT3 447.3 448.7 0.5
5 Discussion The magnitude and repeatability of the EO-1 Advanced Land Imager focal plane noise were excellent during the first sixty days in orbit. The magnitudes presented in Table 2 are consistent with those calculated during pre-flight calibration of the instrument6. The trending indicates little change in noise levels throughout this period, except during times when the focal plane was being warmed-up for outgassing. The magnitude of the ALI focal plane dark current was as expected during the first sixty days in orbit. The magnitudes presented in Table 3 are consistent with those calculated during pre-flight calibration of the instrument6. Band 2 SCA4 odd detectors and Band 3 SCA 3 even detectors have increased dark current levels compared to the corresponding even and odd detectors respectively. This is due to the influence of previously identified leaky detectors in these bands. Additionally, all SWIR bands exhibit enhanced dark current levels for a region of SCA 4 that is associated with a previously identified ‘hot spot’ in the focal plane. Analysis of dark current data indicates excellent stability of all dark current levels within a given observation. However, dark current level variability as high as 30 digital numbers for Bands 1p, 4, 4p, 5p, 5, 7, and the Panchromatic band has been observed from one observation to another and is not well understood at this time. A small (20-50 digital numbers) increase in dark current is also observed in Bands 5p and 7 over the coarse of the first 150 DCEs. More frequent outgassing (once per week) since then has reduced this drift to less than 10 digital numbers. Additional changes in noise and dark current levels are observed during times when the focal plane was being heated for outgassing. However, even during these periods, all Visible and Near Infrared bands (1p, 1, 2, 3, 4, 4p) and the Panchromatic Band indicate little change in detector dark current levels. This is undoubtedly the result in differing dark current characteristics between the silicon (VNIR) and HgCdTe (SWIR) detector materials. The results presented here will serve as baselines for noise and dark current trending during the remainder of the EO-1 mission.
38
6 References
1. J. A. Mendenhall et al., “Earth Observing-1 Advanced Land Imager: Instrument and Flight Operations Overview,” MIT/LL Project Report EO-1-1, 23 June 2000.
2. D. E. Lencioni, C. J. Digenis, W. E. Bicknell, D. R. Hearn, J. A. Mendenhall, “Design and Performance of the EO-1 Advanced Land Imager,” SPIE Conference on Sensors, Systems, and Next Generation Satellites III, Florence, Italy, 20 September 1999.
3. W. E. Bicknell, C. J. Digenis, S. E. Forman, D. E. Lencioni, “EO-1 Advanced Land Imager,” SPIE Conference on Earth Observing Systems IV, Denver, Colorado, 18 July 1999.
4. C. J. Digenis, D. E. Lencioni, and W. E. Bicknell, “New Millennium EO-1 Advanced Land Imager,” SPIE Conference on Earth Observing Systems III, San Diego, California, July 1998.
5. D. E. Lencioni and D. R. Hearn, “New Millennium EO-1 Advanced Land Imager,” International Symposium on Spectral Sensing Research, San Diego, 13-19 December 1997.
6. J. A. Mendenhall et al., “Earth Observing-1 Advanced Land Imager: Dark Current and Noise Characterization and Anomalous Detectors,” MIT/LL Project Report EO-1-5, 23 February 2001.
___________________________ This work was sponsored by NASA/Goddard Space Flight Center under U.S. Air Force, Contract F19628-95-C-0002. Opinions, interpretations, conclusions, and recommendations are those of the authors and are not necessarily endorsed by the United States Air Force.