eas 4300 guest lecture georgia tech biological oceanography jpm plankton and productivity...
TRANSCRIPT
EAS 4300 Guest Lecture
Georgia Tech Biological Oceanography
JPM
Plankton and Productivity• Phytoplankton
– Diversity
– Nutrients and light
• Primary production
• New production

EAS 4300 Guest Lecture
Georgia Tech Biological Oceanography
JPMPublished by AAAS
P. G. Falkowski et al., Science 305, 354 -360 (2004)
Fig. 1. Examples of representative marine eukaryotic phytoplankton
EAS 4300 Guest Lecture
Georgia Tech Biological Oceanography
JPM
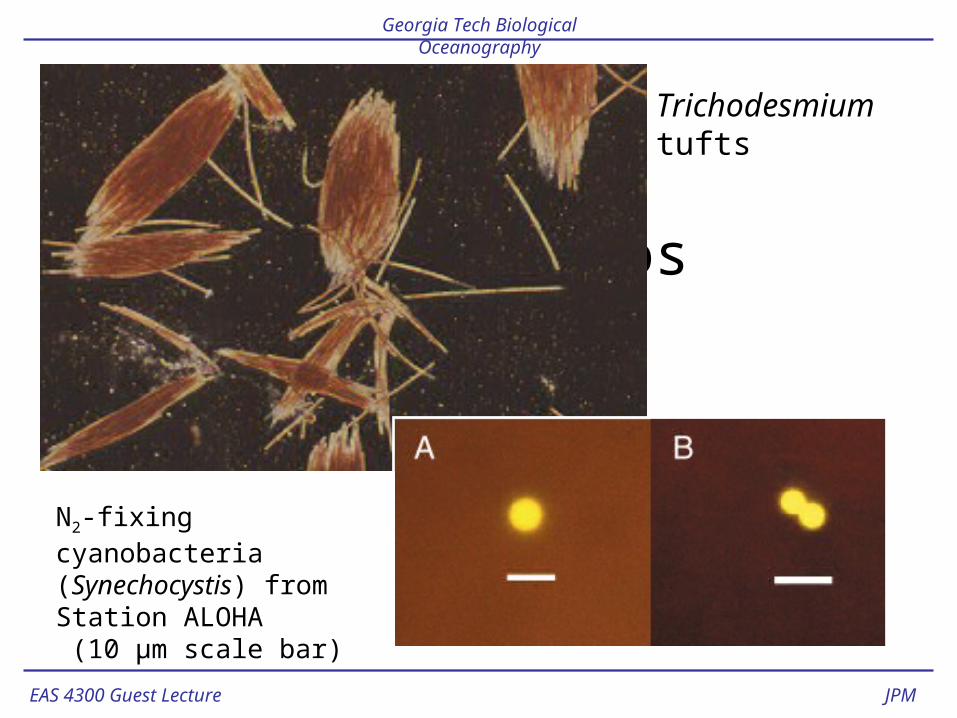
Tricho&Picos
N2-fixing cyanobacteria (Synechocystis) from Station ALOHA (10 µm scale bar)
Trichodesmium tufts
EAS 4300 Guest Lecture
Georgia Tech Biological Oceanography
JPM
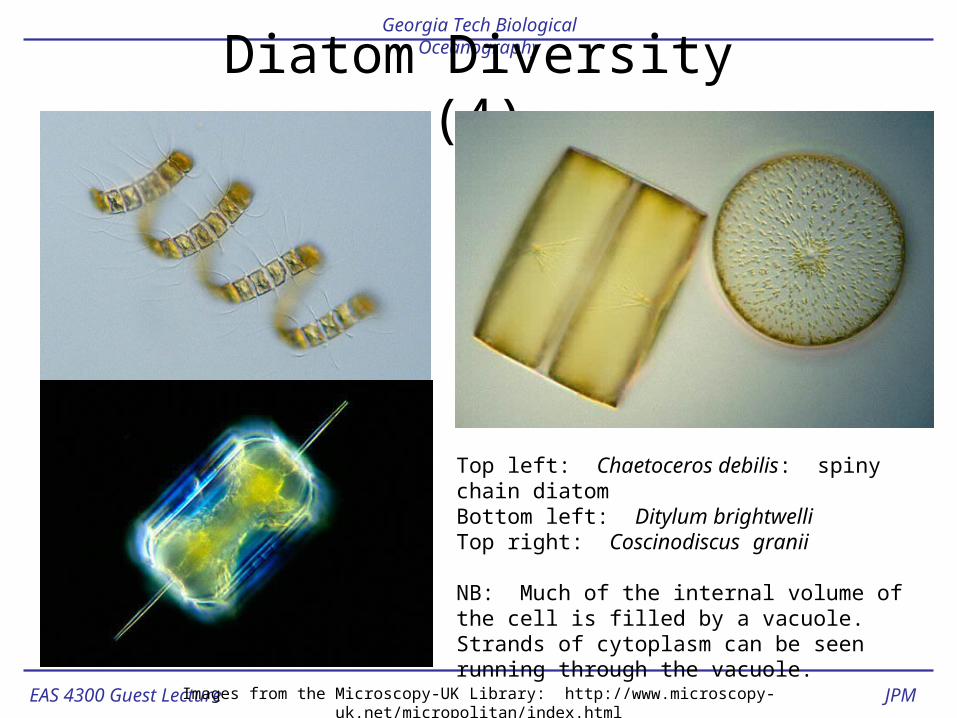
Diatom Diversity (4)
Images from the Microscopy-UK Library: http://www.microscopy-uk.net/micropolitan/index.html
Top left: Chaetoceros debilis: spiny chain diatomBottom left: Ditylum brightwelliTop right: Coscinodiscus granii
NB: Much of the internal volume of the cell is filled by a vacuole. Strands of cytoplasm can be seen running through the vacuole.
EAS 4300 Guest Lecture
Georgia Tech Biological Oceanography
JPM
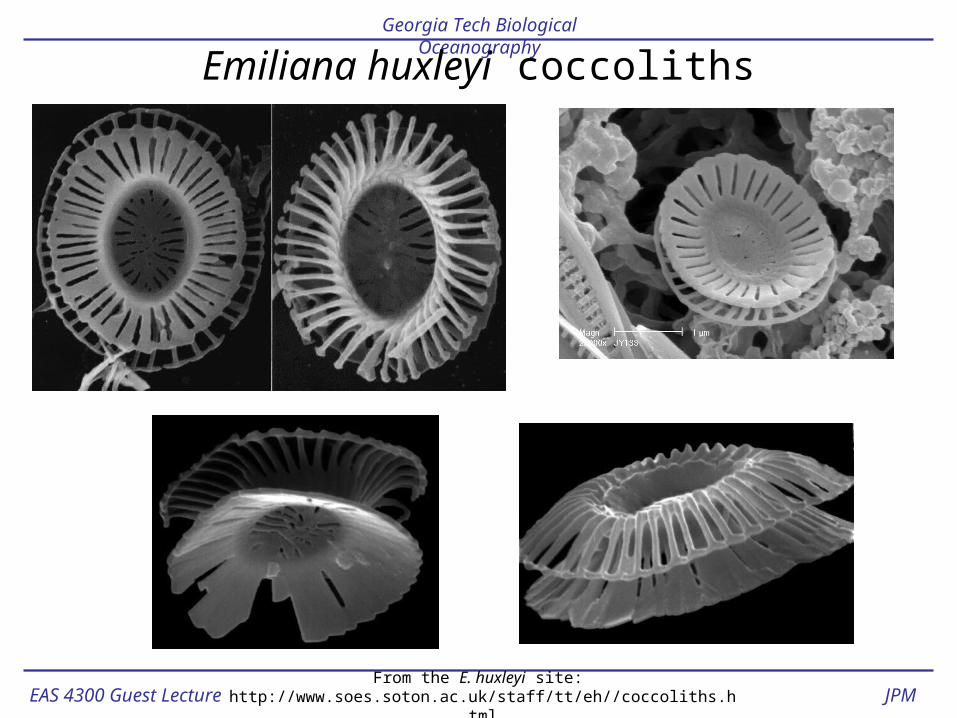
Emiliana huxleyi coccoliths
From the E. huxleyi site: http://www.soes.soton.ac.uk/staff/tt/eh//coccoliths.html
EAS 4300 Guest Lecture
Georgia Tech Biological Oceanography
JPM
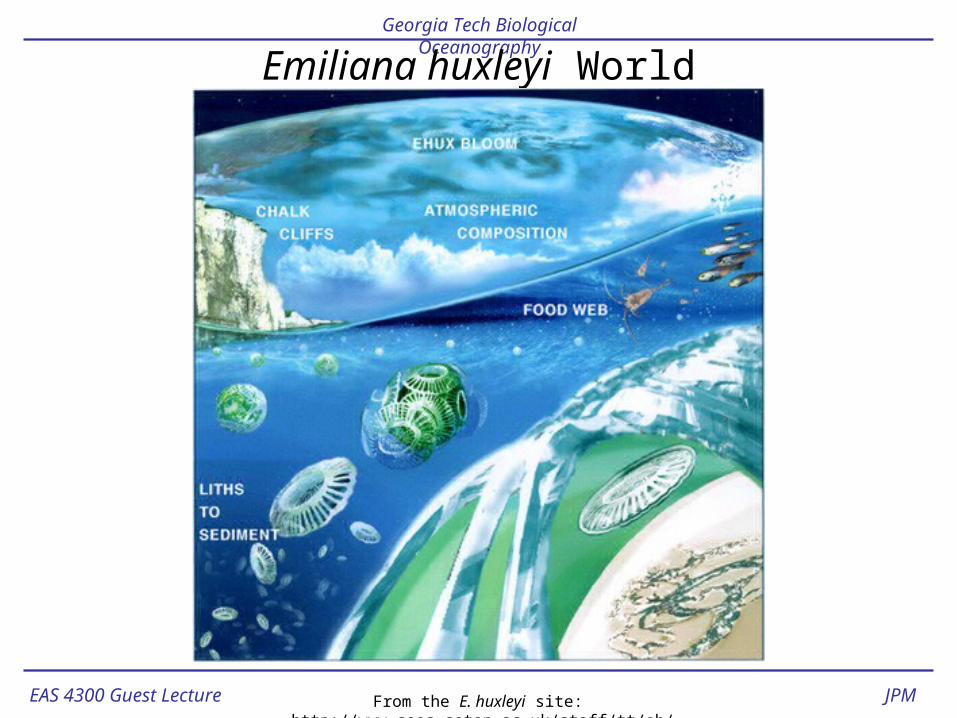
Emiliana huxleyi World
From the E. huxleyi site: http://www.soes.soton.ac.uk/staff/tt/eh/
EAS 4300 Guest Lecture
Georgia Tech Biological Oceanography
JPM
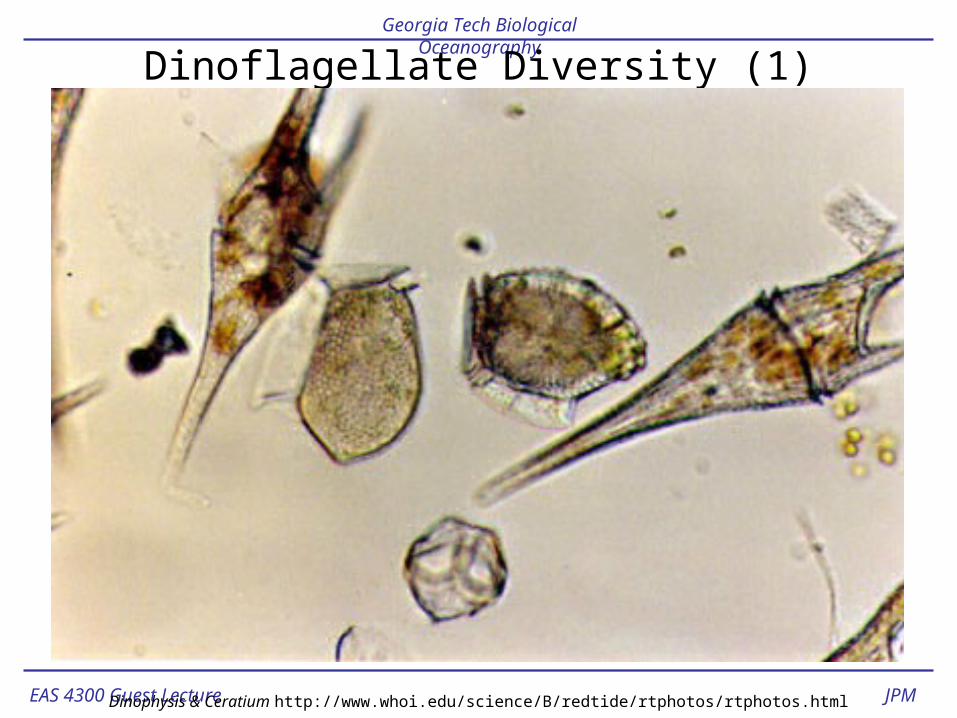
Dinoflagellate Diversity (1)
Dinophysis & Ceratium http://www.whoi.edu/science/B/redtide/rtphotos/rtphotos.html
EAS 4300 Guest Lecture
Georgia Tech Biological Oceanography
JPM
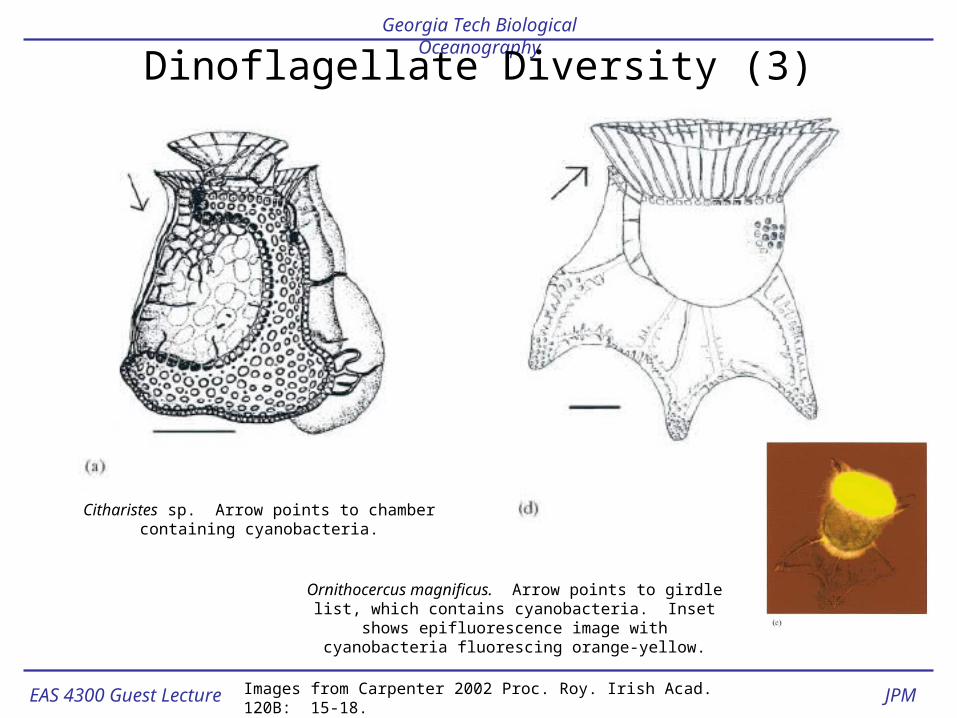
Dinoflagellate Diversity (3)
Citharistes sp. Arrow points to chamber containing cyanobacteria.
Images from Carpenter 2002 Proc. Roy. Irish Acad. 120B: 15-18.
Ornithocercus magnificus. Arrow points to girdle list, which contains cyanobacteria. Inset shows epifluorescence image with
cyanobacteria fluorescing orange-yellow.
EAS 4300 Guest Lecture
Georgia Tech Biological Oceanography
JPM
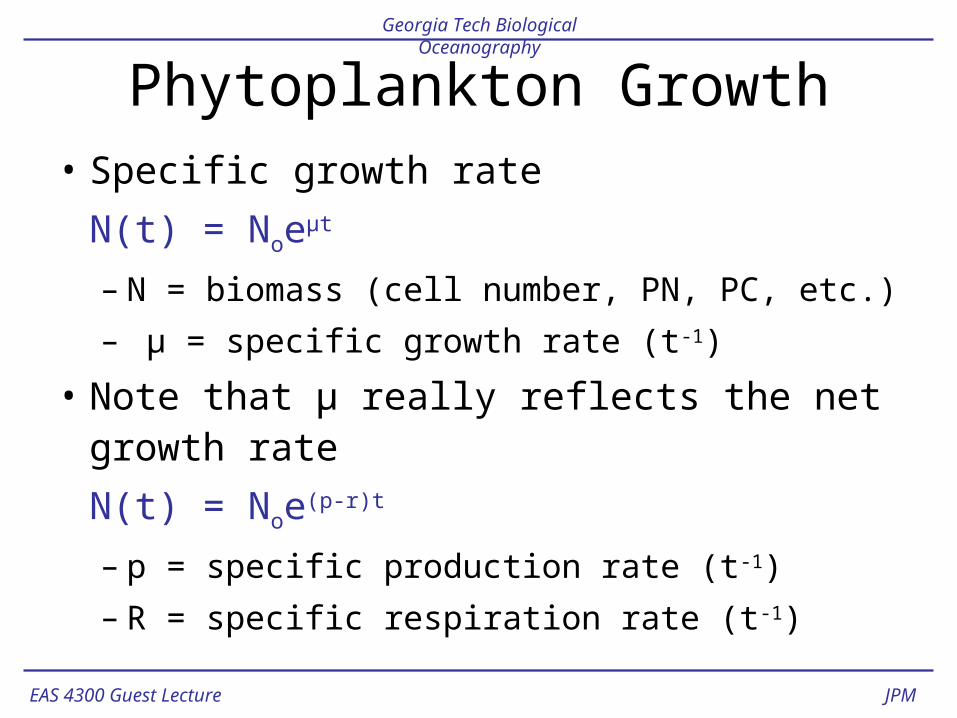
Phytoplankton Growth• Specific growth rate
N(t) = Noeµt
– N = biomass (cell number, PN, PC, etc.)
– µ = specific growth rate (t-1)
• Note that µ really reflects the net growth rate
N(t) = Noe(p-r)t
– p = specific production rate (t-1)
– R = specific respiration rate (t-1)
EAS 4300 Guest Lecture
Georgia Tech Biological Oceanography
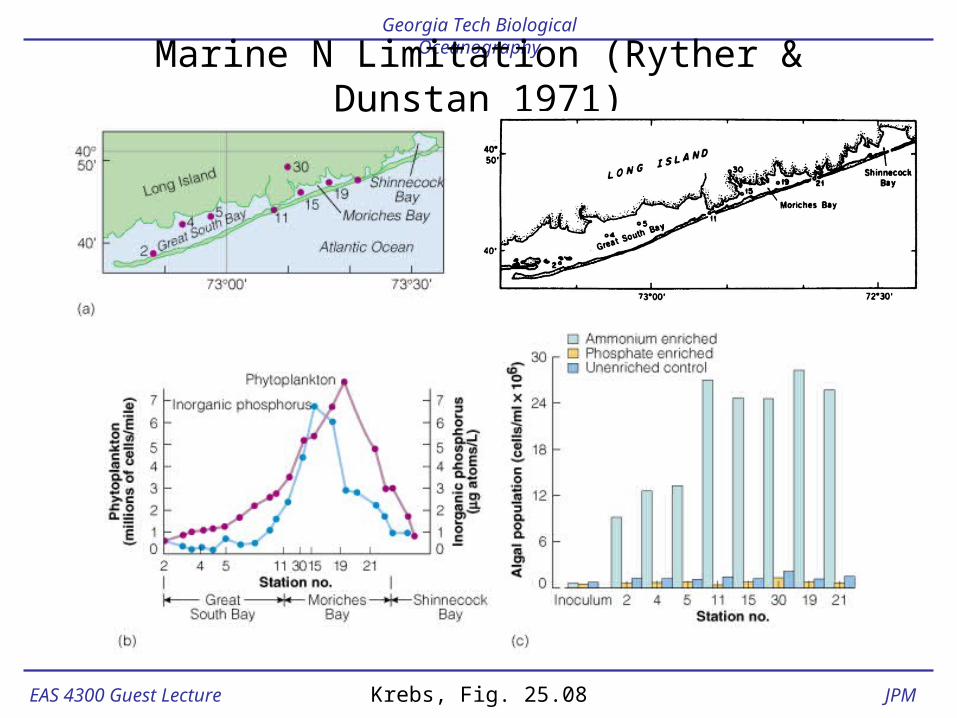
JPMKrebs, Fig. 25.08
Marine N Limitation (Ryther & Dunstan 1971)
EAS 4300 Guest Lecture
Georgia Tech Biological Oceanography
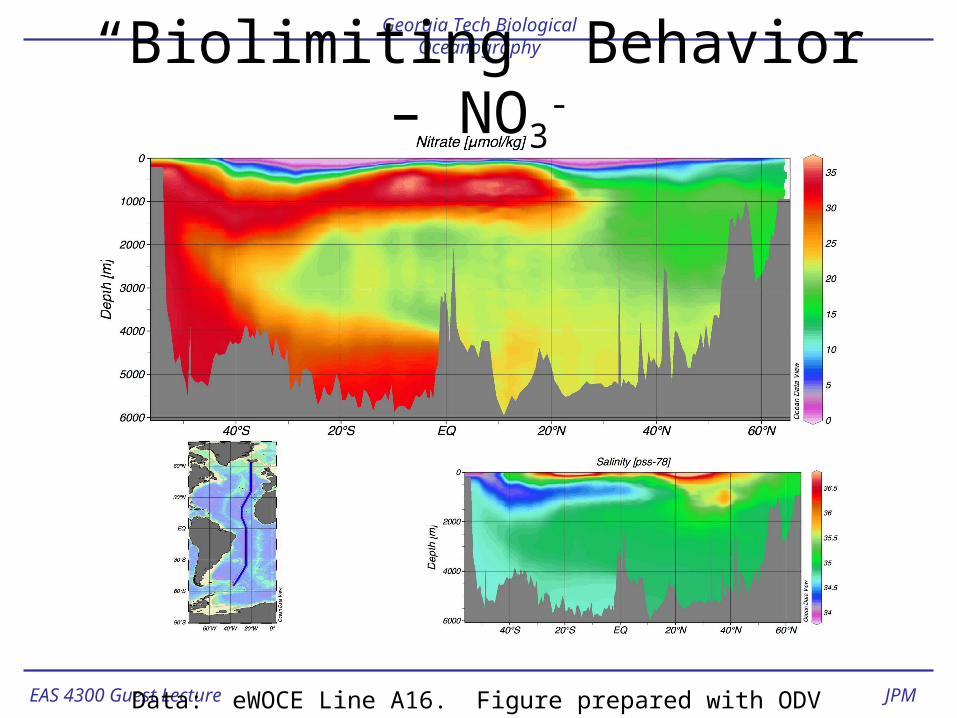
JPMData: eWOCE Line A16. Figure prepared with ODV
“Biolimiting” Behavior – NO3-
EAS 4300 Guest Lecture
Georgia Tech Biological Oceanography
JPM
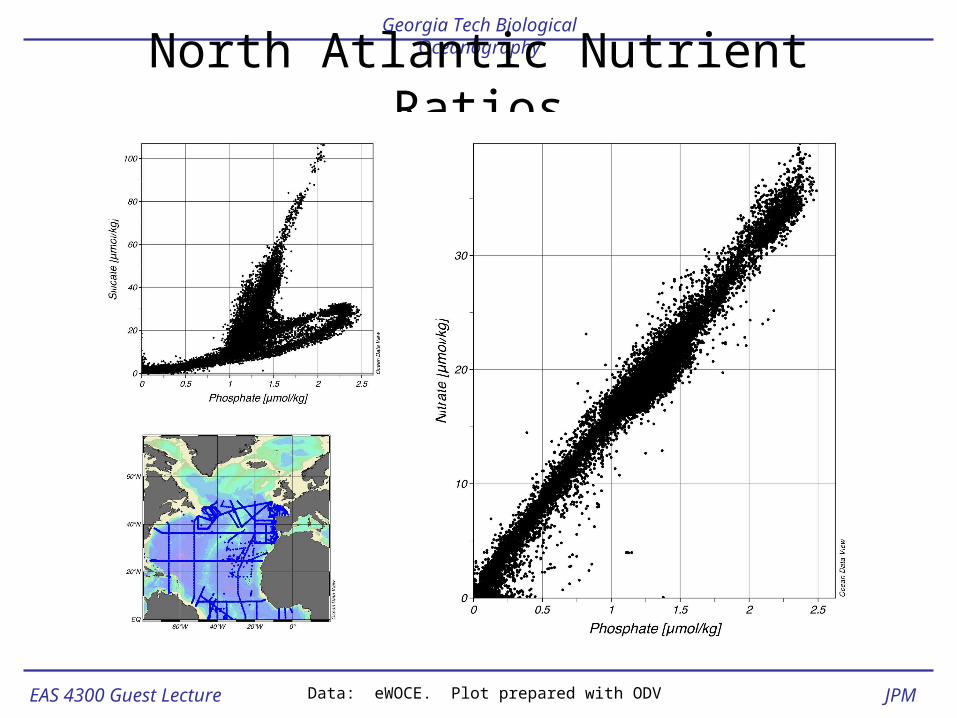
North Atlantic Nutrient Ratios
Data: eWOCE. Plot prepared with ODV
EAS 4300 Guest Lecture
Georgia Tech Biological Oceanography
JPM
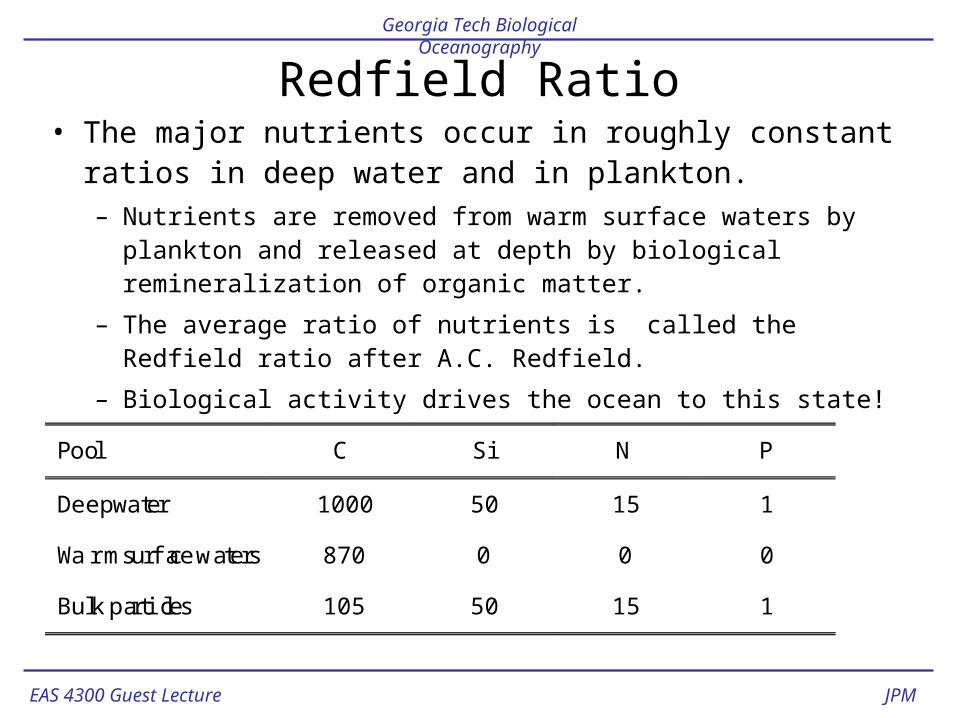
Redfield Ratio• The major nutrients occur in roughly constant ratios in deep
water and in plankton.– Nutrients are removed from warm surface waters by plankton and
released at depth by biological remineralization of organic matter.
– The average ratio of nutrients is called the Redfield ratio after A.C. Redfield.
– Biological activity drives the ocean to this state!
Pool C Si N P
Deep water 1000 50 15 1
Warm surface waters 870 0 0 0
Bulk particles 105 50 15 1
EAS 4300 Guest Lecture
Georgia Tech Biological Oceanography
JPM
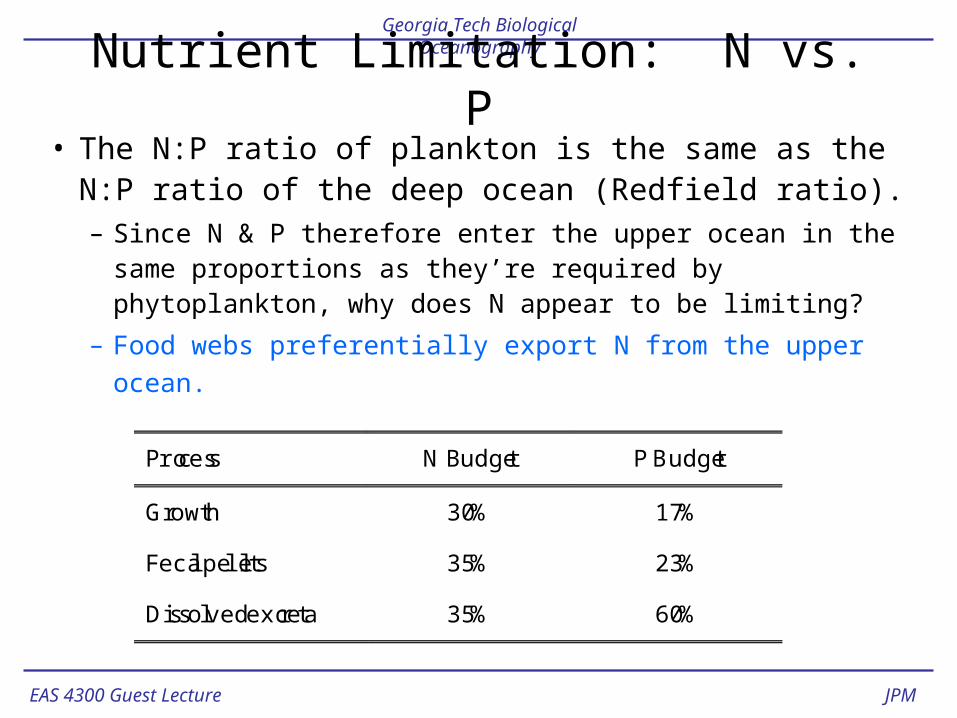
Nutrient Limitation: N vs. P
• The N:P ratio of plankton is the same as the N:P ratio of the deep ocean (Redfield ratio).– Since N & P therefore enter the upper ocean in the same
proportions as they’re required by phytoplankton, why does N appear to be limiting?
– Food webs preferentially export N from the upper ocean.
Process N Budget P Budget
Growth 30% 17%
Fecal pellets 35% 23%
Dissolved excreta 35% 60%
EAS 4300 Guest Lecture
Georgia Tech Biological Oceanography
JPM
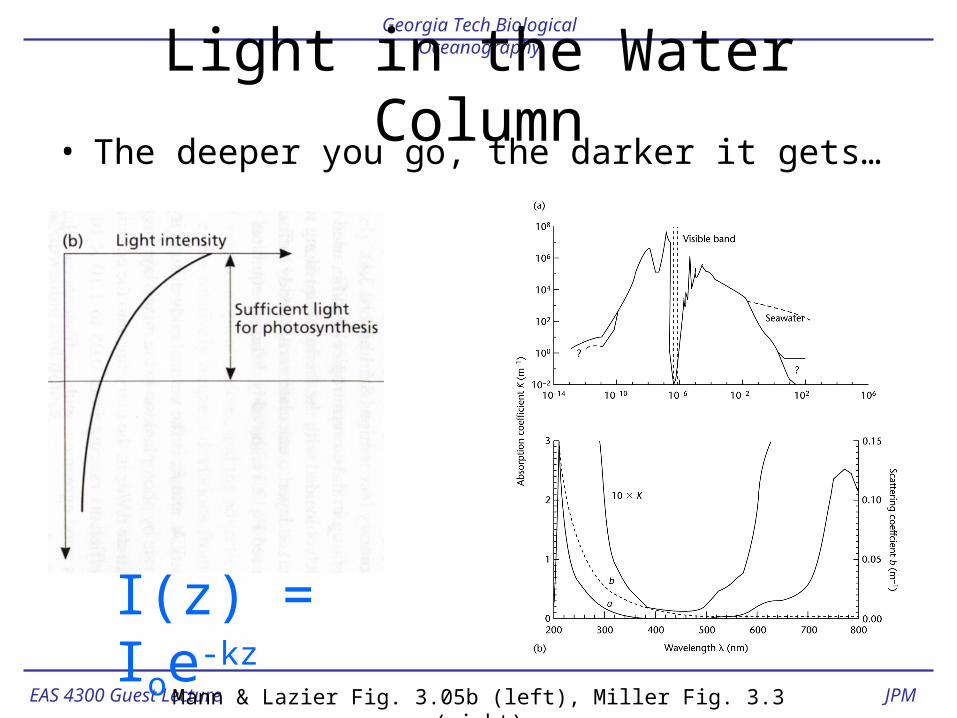
Light in the Water Column• The deeper you go, the darker it gets…
Mann & Lazier Fig. 3.05b (left), Miller Fig. 3.3 (right)
I(z) = Ioe-kz
EAS 4300 Guest Lecture
Georgia Tech Biological Oceanography
JPM
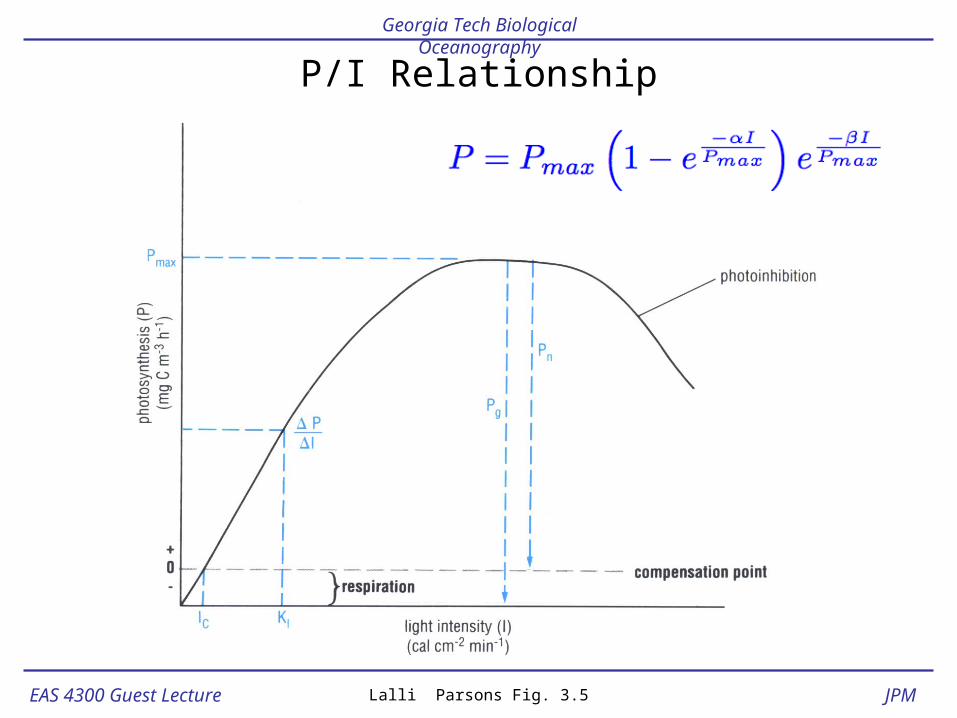
P/I Relationship
Lalli Parsons Fig. 3.5
EAS 4300 Guest Lecture
Georgia Tech Biological Oceanography
JPM
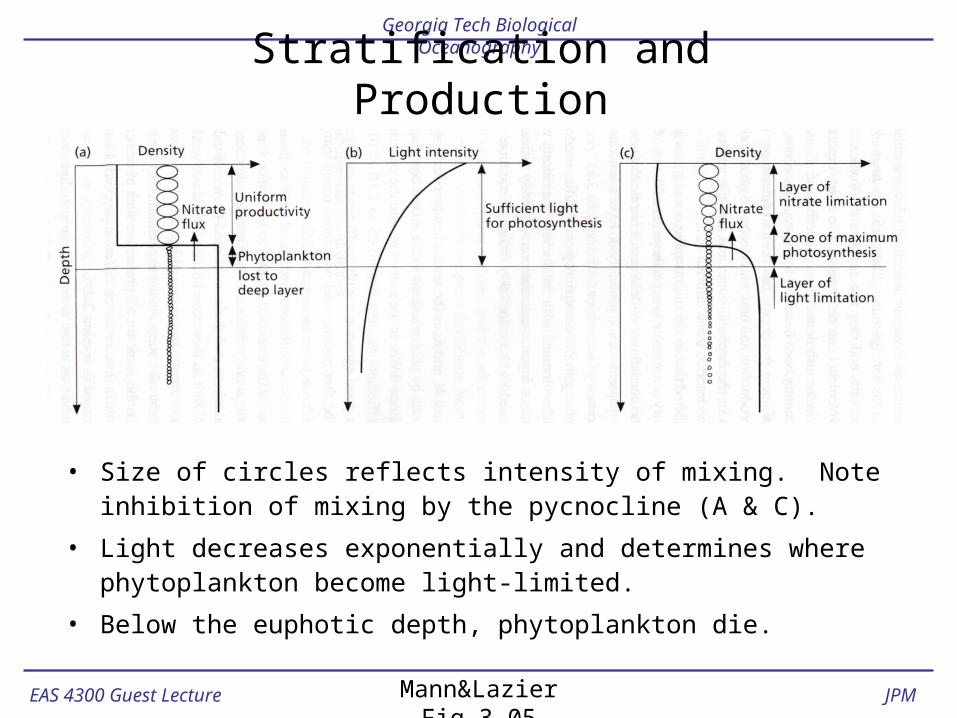
Stratification and Production
Mann&Lazier Fig.3.05
• Size of circles reflects intensity of mixing. Note inhibition of mixing by the pycnocline (A & C).
• Light decreases exponentially and determines where phytoplankton become light-limited.
• Below the euphotic depth, phytoplankton die.
EAS 4300 Guest Lecture
Georgia Tech Biological Oceanography
JPM
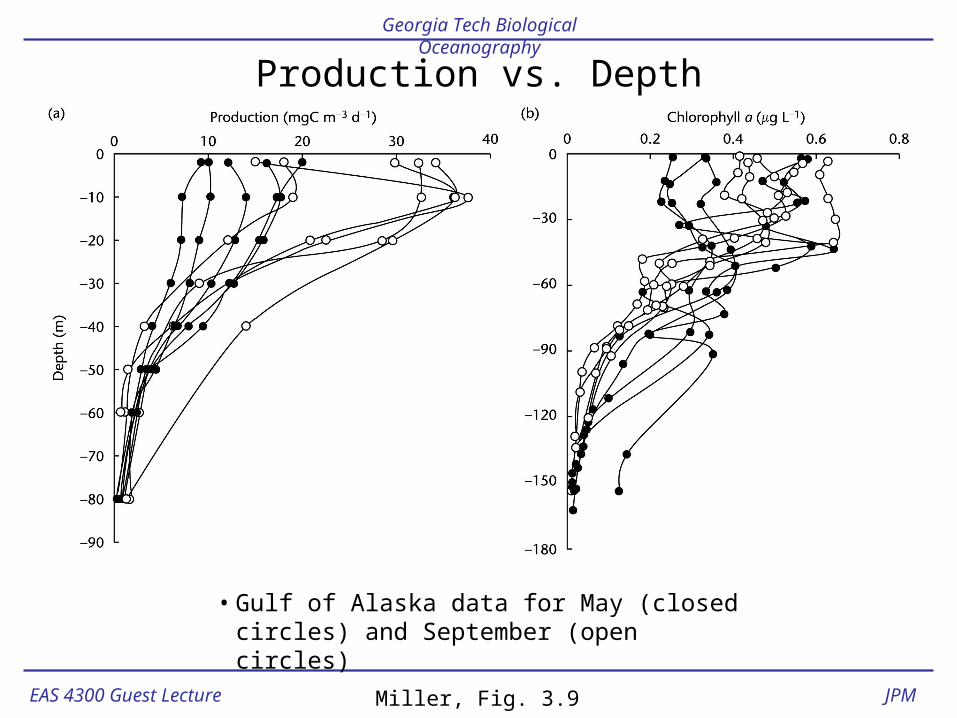
Production vs. Depth
Miller, Fig. 3.9
• Gulf of Alaska data for May (closed circles) and September (open circles)
EAS 4300 Guest Lecture
Georgia Tech Biological Oceanography
JPM
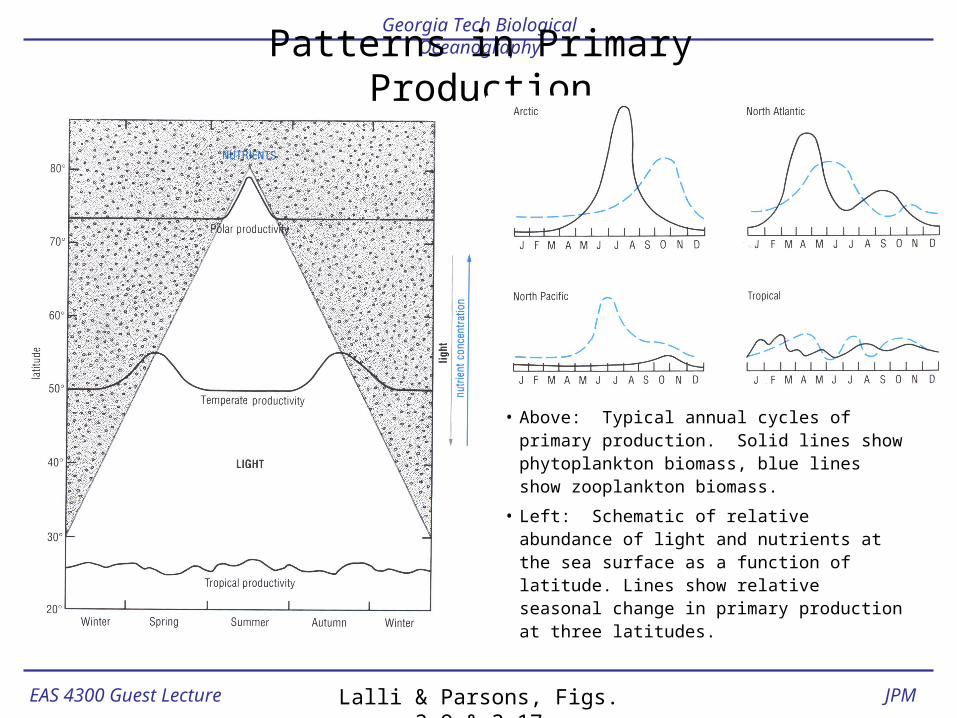
Patterns in Primary Production
Lalli & Parsons, Figs. 3.9 & 3.17
• Above: Typical annual cycles of primary production. Solid lines show phytoplankton biomass, blue lines show zooplankton biomass.
• Left: Schematic of relative abundance of light and nutrients at the sea surface as a function of latitude. Lines show relative seasonal change in primary production at three latitudes.
EAS 4300 Guest Lecture
Georgia Tech Biological Oceanography
JPMMiller, Fig. 1.3
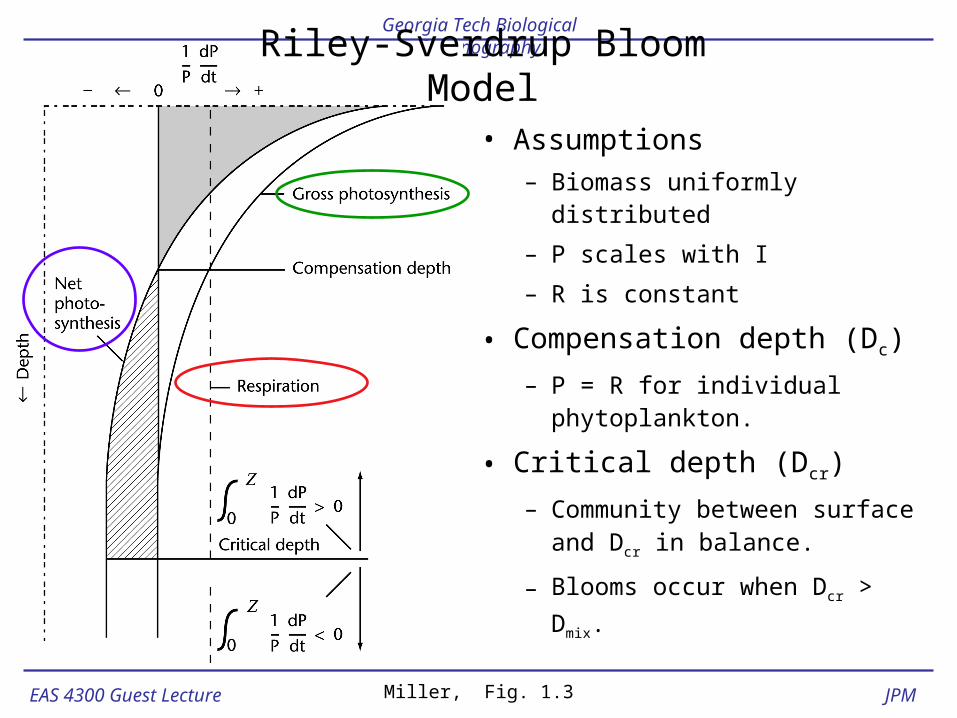
Riley-Sverdrup Bloom Model
• Assumptions– Biomass uniformly distributed
– P scales with I
– R is constant
• Compensation depth (Dc)
– P = R for individual phytoplankton.
• Critical depth (Dcr)
– Community between surface and Dcr in balance.
– Blooms occur when Dcr > Dmix.
EAS 4300 Guest Lecture
Georgia Tech Biological Oceanography
JPM
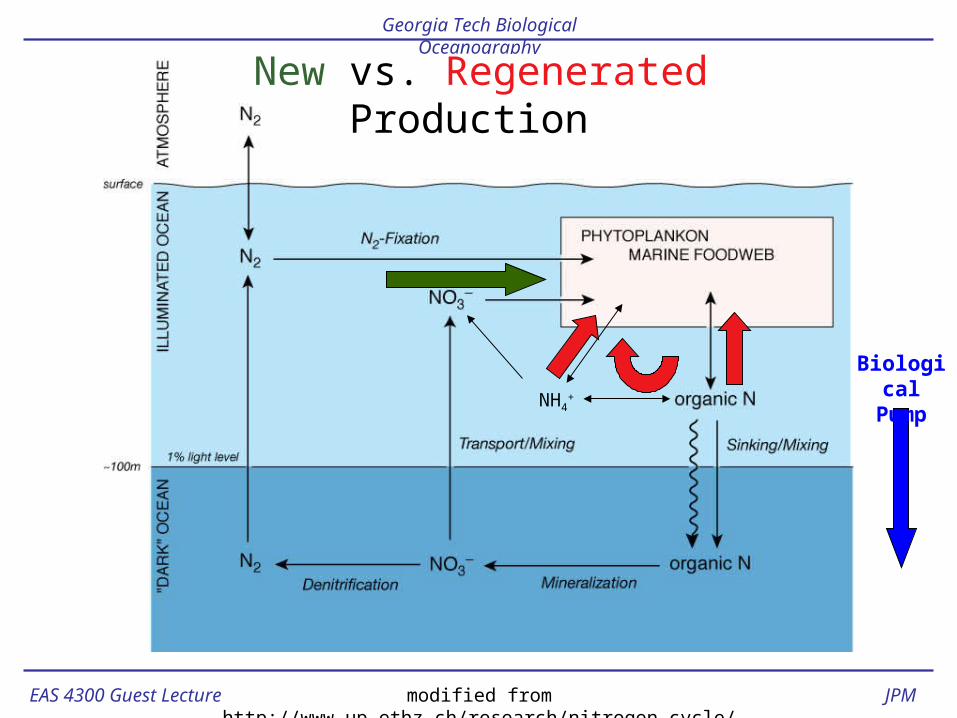
NH4+
New vs. Regenerated Production
modified from http://www.up.ethz.ch/research/nitrogen_cycle/index
BiologicalPump
EAS 4300 Guest Lecture
Georgia Tech Biological Oceanography
JPM
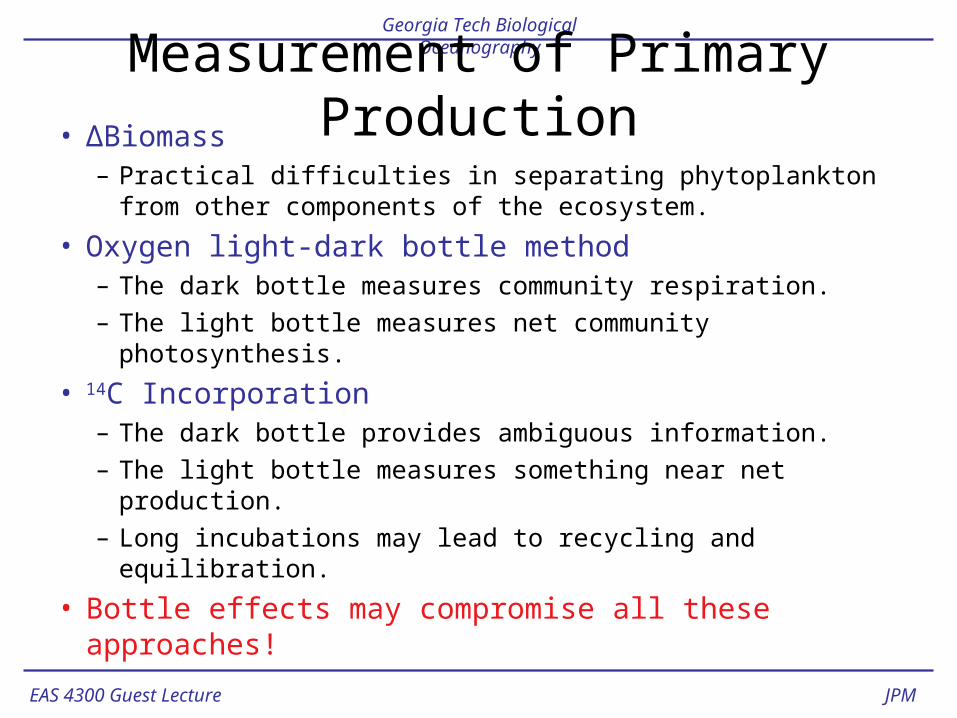
Measurement of Primary Production• ∆Biomass
– Practical difficulties in separating phytoplankton from other components of the ecosystem.
• Oxygen light-dark bottle method– The dark bottle measures community respiration.
– The light bottle measures net community photosynthesis.
• 14C Incorporation– The dark bottle provides ambiguous information.
– The light bottle measures something near net production.
– Long incubations may lead to recycling and equilibration.
• Bottle effects may compromise all these approaches!
EAS 4300 Guest Lecture
Georgia Tech Biological Oceanography
JPM
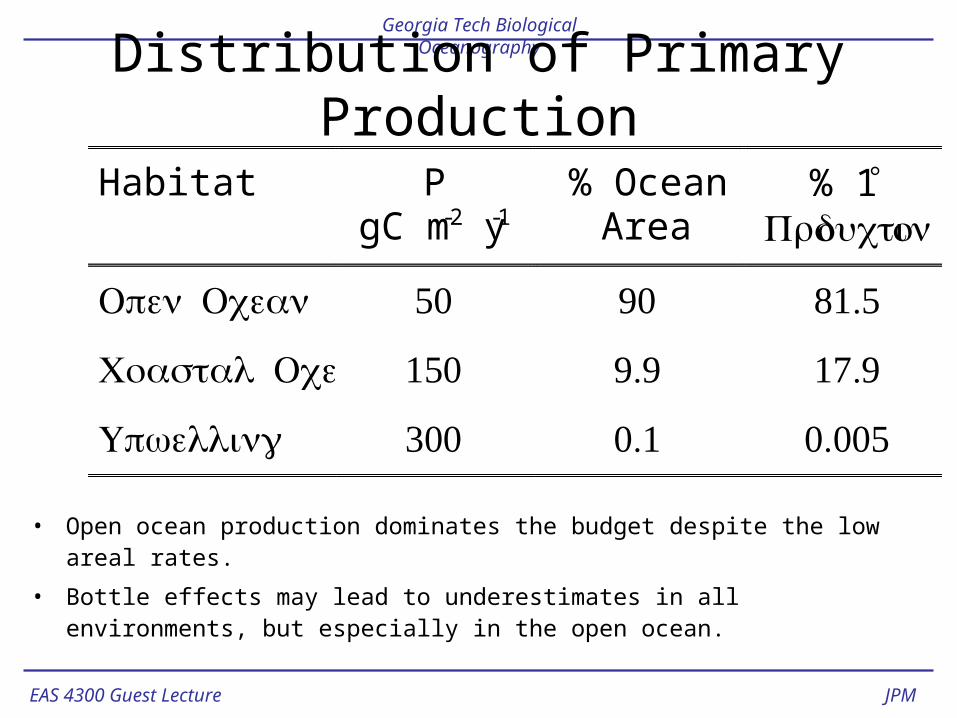
Distribution of Primary Production
Habitat P gC m-2 y-1
% Ocean Area
% 1° Production
Open Ocean 50 90 81.5
Coastal Ocean 150 9.9 17.9
Upwelling 300 0.1 0.005 • Open ocean production dominates the budget despite the low areal rates.
• Bottle effects may lead to underestimates in all environments, but especially in the open ocean.
EAS 4300 Guest Lecture
Georgia Tech Biological Oceanography
JPM
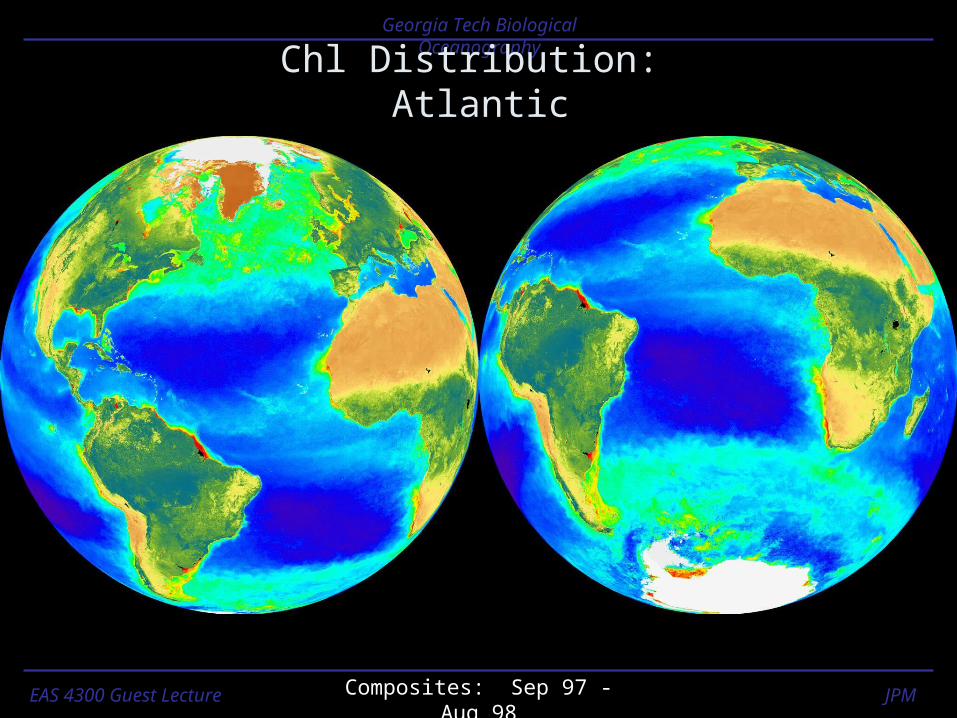
Chl Distribution: Atlantic
Composites: Sep 97 - Aug 98