east africa crossborder trade bulletin - world food...
TRANSCRIPT
FEWS NET/FAO/WFP Joint Cross-Border Market and Trade Monitoring Initiative
The Market Analysis Sub-group of the Food Security and Nutrition Working Group (FSNWG) monitors cross-border trade of 88 food commodities and livestock in 26
cross-border markets in eastern Africa in order to quantify the contribution of formal and informal cross-border trade to food security in the region.
This issue provides an overview of cross-border across 21 of the 26 monitored markets between January and June 2011.
Summary
• The main staple foods traded across the borders in the region in the first six months of 2011 were beans (39,215Mt), maize
(30,525Mt), sorghum (17,131Mt)and sugar (6,935Mt). here was a general decline in volumes traded compared to the last six
months of 2010, with maize having the largest decline of 80%, sorghum (28%) and beans (19%). The decline has been
attributed to limited regional food stocks and export bans by Ethiopia and Tanzania, the two key source markets.
• Despite the decline in regional traded volumes, the volume of maize and sorghum imported into Somalia from Ethiopia has
shown a marked increase. Imports into Somalia are most likely driven by the failed 2010 deyr crop and very low prospects for
the 2011 gu harvest.
• The proportion of informal trade as part of the total cross-border trade has increased ostensibly due to stricter control of cross-
border trade by Tanzania and Ethiopia.
• There was a significant increase in numbers of livestock traded by over 200 percent compared to last six months of 2010, most
likely driven by livestock keepers increased sales to finance cereal purchases and also to cut down on potential losses that could
results from drought related mortalities. This increase occurred despite this being not the peak livestock trading season in the
region.
1. Introduction
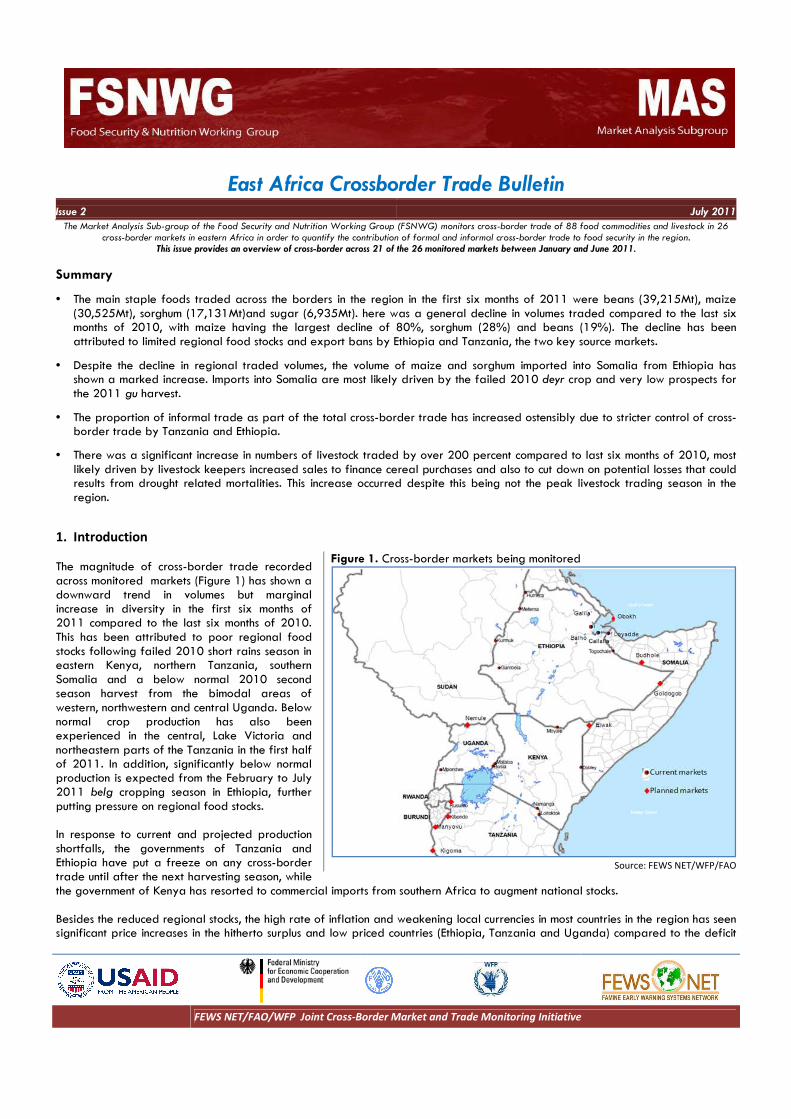
The magnitude of cross-border trade recorded
across monitored markets (Figure 1) has shown a
downward trend in volumes but marginal
increase in diversity in the first six months of
2011 compared to the last six months of 2010.
This has been attributed to poor regional food
stocks following failed 2010 short rains season in
eastern Kenya, northern Tanzania, southern
Somalia and a below normal 2010 second
season harvest from the bimodal areas of
western, northwestern and central Uganda. Below
normal crop production has also been
experienced in the central, Lake Victoria and
northeastern parts of the Tanzania in the first half
of 2011. In addition, significantly below normal
production is expected from the February to July
2011 belg cropping season in Ethiopia, further
putting pressure on regional food stocks.
In response to current and projected production
shortfalls, the governments of Tanzania and
Ethiopia have put a freeze on any cross-border
trade until after the next harvesting season, while
the government of Kenya has resorted to commercial imports from southern Africa to augment national stocks.
Besides the reduced regional stocks, the high rate of inflation and weakening local currencies in most countries in the region has seen
significant price increases in the hitherto surplus and low priced countries (Ethiopia, Tanzania and Uganda) compared to the deficit
East Africa Crossborder Trade Bulletin
Issue 2 July 2011
Figure 1. Cross-border markets being monitored
Source: FEWS NET/WFP/FAO

East Africa Cross-Border Trade Bulletin
FEWS NET/FAO/WFP Joint Cross-Border Market and Trade Monitoring
and high priced countries (Kenya, Sudan and Somalia) thereby diminishing the propensity for crossfurther been aggravated by the increasing marketing costs due to high fuel prices further diminishing the margins of those enin cross-border trade. 2. Main commodities traded in the region
In the first half of 2011, a total of 65 different food commodities and livestock were traded across the 21 border markets monitored in eastern Africa. This shows a marginal increase diversity of trade portfolio that comprised of commodities in the last six months of 2010. In terms of volume, beans was the most traded food commodity (39,215 MT) followed by (30,525 MT) and sorghum (17,131 MT) (Figure 2). It is not surprising that more beans than maize were traded in the first half of 2011, most likely due to the fact that the export ban imposed by Ethiopia and Tanzania was geared towards cereals and not other staples. Sesame, a crop produced in northwestern Ethiopia for the Sudan market, was the most traded item in the region with 69,680 MT exported. Once in Sudan, the sesame is reexported to Asia and Europe, with China being the largest importer. Overall, about 63 percent of food commoditiesin 2010, explained perhaps by restrictions on crossrestrictions is observed in the trade of beans, which remains predominantly formal as Commodities faced by the short term ban (i.e. maize and 25 percent in last half of 2010 to about 37 percent presently. Toils) have largely been traded informallylike in the last half of 2010.Sesame was traded formally. Trade across all markets on the Somalia border and its neighbors (i.e. Doble, Bula HawaTogwajale, Goldogob, Buhodle, Belet Weyneinformal for all commodities. This is attributed to lack of functional customs offices in these markets. Other markets without effective customs services and in which informal trade dominates includeLwakhakha on Kenya-Uganda border, Gambele on Ethiopia-South Sudan border and Mpondwe on Uganda-DRC border (Figure 3). Another observation is the emerging importance of the nontraditional imports of maize and sorghum into Somalia. For example, in 2010, the inflows of maize and sorghum into Somalia through Tog Wajaale increased to 1,250 MT in the first six months of 2011 compared to about 595 Mt for the nine months monitored in 2010This represents an increase in monthly inflows of 215 percent (from 66 MT/month to 208 MT/Month). Inflows of maize and sorghum into Somalia between April and June amount to 4760 MT, driven largely by traders reliance on crosspoor prospects for the 2011 long rains crop. These inflows are quite significant realizing they are happening against export
Border Market and Trade Monitoring Initiative
nd Somalia) thereby diminishing the propensity for crossfurther been aggravated by the increasing marketing costs due to high fuel prices further diminishing the margins of those en
odities traded in the region
different estock were traded
border markets monitored in increase in
diversity of trade portfolio that comprised of 63
was the most traded maize (Figure
It is not surprising that more beans than maize were traded in the first half of 2011, most likely due to the fact that the export ban imposed by Ethiopia and Tanzania was geared towards
a crop produced in northwestern was the most
being Once in Sudan, the sesame is re-
exported to Asia and Europe, with China being
food commodities were traded through formal channels. This is a reduction from 76 percent observed in 2010, explained perhaps by restrictions on cross-border trade by some of the key surplus countries. The impact of trade restrictions is observed in the trade of beans, which remains predominantly formal as it is not covered by the ban from Tanzania. Commodities faced by the short term ban (i.e. maize and sorghum) have seen increase in proportion traded as informal
percent in last half of 2010 to about 37 percent presently. Those commodities that attract taxation oils) have largely been traded informally, just
Sesame was traded
on the Somalia border ble, Bula Hawa,
, Goldogob, Buhodle, Belet Weyne) is informal for all commodities. This is attributed to lack of functional customs offices in these markets.
markets without effective customs services and in which informal trade dominates include
Uganda border, Gambele South Sudan border and Mpondwe
Another observation is the emerging importance of the nontraditional imports of maize and sorghum into Somalia. For example, in 2010, the inflows of maize and sorghum into Somalia
to 1,250 MT in mpared to about
595 Mt for the nine months monitored in 2010. This represents an increase in monthly inflows of 215 percent (from 66 MT/month to 208 MT/Month). Inflows of maize and sorghum into Somalia between April and June amount to 4760
traders reliance on cross-border inflows in furnishing their stocks following a failed 2010 short rains crop and poor prospects for the 2011 long rains crop. These inflows are quite significant realizing they are happening against export
Figure 2. Proportion of formal vs informal trade by January-June 2011
*Other cereals include rice, wheat and wheat products
Figure3. Proportion of formal and informal trade market (MT), January-June 2011
Monitoring of Belet Hawa, Belet Weyne, Budhole and Goldogob started in April, 2011
0
5,000
10,000
15,000
20,000
25,000
30,000
35,000
40,000
Formal Informal
0
5,000
10,000
15,000
20,000
25,000
Formal
Issue 2, July 2011
Page 2
nd Somalia) thereby diminishing the propensity for cross-border trade. The situation has
further been aggravated by the increasing marketing costs due to high fuel prices further diminishing the margins of those engaged
. This is a reduction from 76 percent observed
border trade by some of the key surplus countries. The impact of trade
it is not covered by the ban from Tanzania.
) have seen increase in proportion traded as informal from about
t attract taxation (like sugar and vegetable
border inflows in furnishing their stocks following a failed 2010 short rains crop and
poor prospects for the 2011 long rains crop. These inflows are quite significant realizing they are happening against export trade
Proportion of formal vs informal trade by food commodity (MT)
Source: FEWS NET/WFP/FAO
Other cereals include rice, wheat and wheat products; Other pulses include lentils and green grams
Proportion of formal and informal trade of food commodities by
Source: FEWS NET/WFP/FAO
Monitoring of Belet Hawa, Belet Weyne, Budhole and Goldogob started in April, 2011
Informal
Informal

East Africa Cross-Border Trade Bulletin Issue 2, July 2011
FEWS NET/FAO/WFP Joint Cross-Border Market and Trade Monitoring Initiative Page 3
restrictions (from Kenya and Ethiopia), a very poor market infrastructure between Somalia and its neighbors and high civil insecurity
and restricted trade flows within Somalia.
3. Sources, destination, seasonality and trends in food commodities traded
Table 1 indicates the source and destination of the key staple commodities traded in the region. The seasonality of trade of the
commodities is given in Figure 4. A comparison of the volumes traded in the first half of 2011 as a proportion of the volumes traded
in the last six months of 2010 is given in Figure 5. In Figure 5, the total volumes of traded commodities between January and June
2011 are given on the left hand side. The percent change in these volumes in relation to the total volumes traded from Jul-Dec
2010 is shown on the right hand side.
Table 1. Cross-border trade flow volumes (MT) through FEWS NET/FAO/WFP monitored markets, January to June 2011
Cross-border market
Direction of flow Duration of monitoring in 2011
Cereal traded(MT)
Other commodities traded (MT)*
Pulses traded (MT)
Livestock (Heads)
Loitoktok Tanzania→Kenya Jan to June 2,395.00 623.59 11.40 Ψ
Namanga Tanzania→Kenya Jan to June 6,576.62 2,091.00 3,994.50 Ψ
Lwakhakha Uganda→Kenya Jan to June 493.20 756.12 741.60 Ψ
Malaba Uganda→Kenya Jan to June 6,760.41 238.20 1,360.28 Ψ
Moyale Ethiopia→Kenya Jan to June 7,666.25 1.12 12,082.87 13,416
Togwajale Somalia →Ethiopia Jan to June 851.90 197.84
0
Ethiopia → Somalia Jan to June 951.00
55,553
Dobley Somalia →Kenya Jan to June 3,779.45 4,943.50 0 27,974
Mpondwe Uganda →DRC Jan to June 351.05 5,088.65 955.40 32,417
Metema Ethiopia →N. Sudan Jan to June 9,469.80 4,823.78 14,617.54 66,092
Humera Ethiopia →N. Sudan Jan to June 4,171.80 938.09 8,380.30 26,045
Kurmuk Ethiopia →N. Sudan Jan to June 239.00 261.96 322.67 9,952
Gambella Ethiopia →S. Sudan Jan to June 7,301.80 364.29 193.30 Ψ
Galafi Ethiopia →Djibouti Jan to June 12.95 2.75 74.95 35,088
Galileh Ethiopia →Djibouti Jan to June 174.75 63.37 90.30 0
Obock Ethiopia →Djibouti Jan to June - 1,872.56 - 1,170
Balho Ethiopia →Djibouti Jan to June 69.48 69.03 2.85 35
Loyada Ethiopia →Djibouti Jan to June 867.90
103.50 0
Bula Hawa Ethiopia → Somalia April to June 1,915.00 0 0 0
Somalia →Ethiopia April to June 0 587.50 0 1,989
Belet Weyne Ethiopia → Somalia April to June 908.00 0 42.00 19,026
Somalia → Ethiopia April to June 1,380.00 837.00 0 0
Goldogob Somalia → Ethiopia April to June 1,663.60 449.70 0 0
Ethiopia → Somalia April to June
29,980
Buhodle Somalia → Ethiopia April to June 321.18 137.46 0 0
Ethiopia → Somalia April to June
8,200
Gross Total January – June 2011 58,320.14 24,347.51 42,973.46 318,737 *Other commodities include vegetable oil, sugar, fruits and vegetables, fish, Bananas, honey and root crops
ΨNot monitored.
The following can be observed from Table 1 and Figures 4 and 5:
i. The most important source countries of the regionally traded food commodities, in order of importance were Ethiopia,
Tanzania and Uganda1, while Sudan and Kenya were the key destination markets
1 Data from Busia, Isabenia and Mutukula collected by RATIN was not available at the time of compiling the report.
East Africa Cross-Border Trade Bulletin
FEWS NET/FAO/WFP Joint Cross-Border Market and Trade Monitoring
ii. While the trade in beans has shown a downwards trend in volumes transacted between January and Juneavailability following the November to January regional harvesting windowtraded has exhibited mixed trends, perhaps being a result of the export ban imposed by two of the main source countries, Ethiopia and Tanzania. The ban was targeted more towards cereals than pulses
iii. There has been a general decline in traded vregional stocks, trade restrictions and declining value of most regional currencies. The surplus countries to increase thus reducing the mar
iv. The numbers of livestock moved for commercial purposes across the bordersmonths of 2011 compared to last six months of 2010 (from below 100,000 heads to over likely driven by increased sales by livestock keepers to purchase cereals and also cut down on potential losses due to mortality arising from the effect of onthe peak September to November peak trading window.
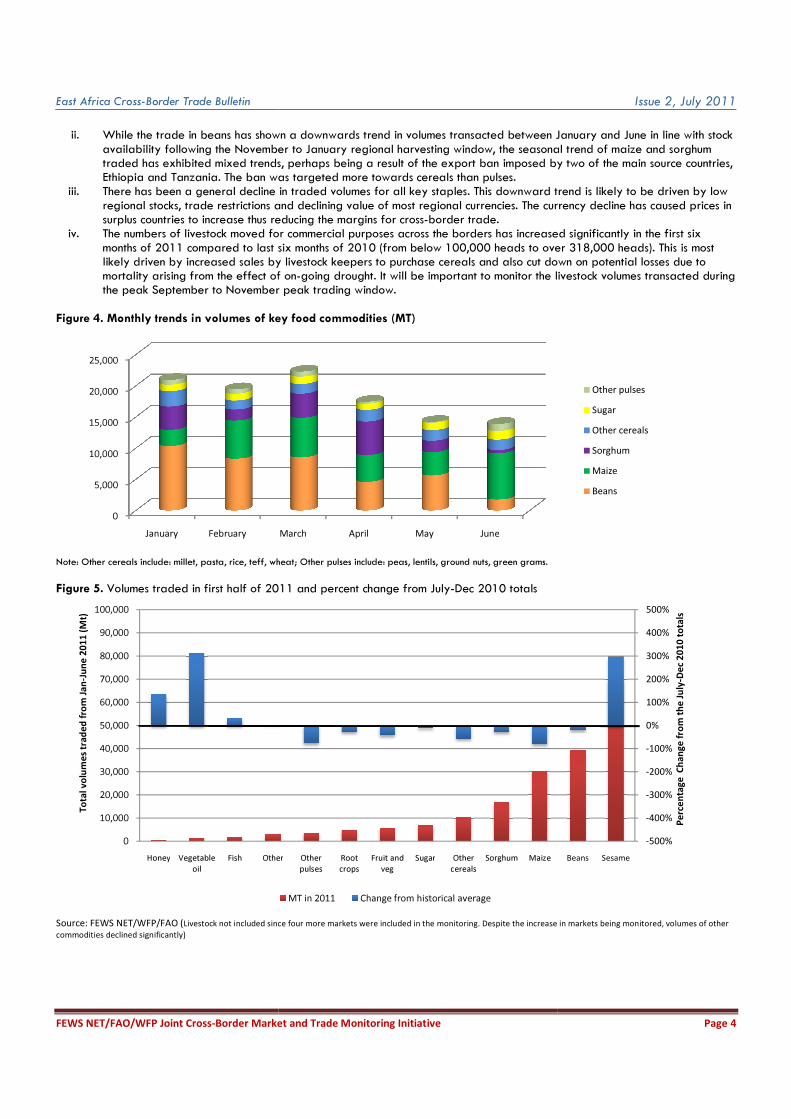
Figure 4. Monthly trends in volumes of key food
Note: Other cereals include: millet, pasta, rice, teff, wheat
Figure 5. Volumes traded in first half of 2011 and percent change from July
Source: FEWS NET/WFP/FAO (Livestock not included since four more markets were included in the monitoring. Despite the increase in markets being monitor
commodities declined significantly)
0
5,000
10,000
15,000
20,000
25,000
January February
0
10,000
20,000
30,000
40,000
50,000
60,000
70,000
80,000
90,000
100,000
Honey Vegetable
oil
Fish Other
To
tal v
olu
me
s tr
ad
ed
fro
m J
an
-Ju
ne
20
11
(M
t)
Border Market and Trade Monitoring Initiative
While the trade in beans has shown a downwards trend in volumes transacted between January and Juneavailability following the November to January regional harvesting window, the seasonal trend of maizetraded has exhibited mixed trends, perhaps being a result of the export ban imposed by two of the main source countries, Ethiopia and Tanzania. The ban was targeted more towards cereals than pulses. There has been a general decline in traded volumes for all key staples. This downward trend is likely to beregional stocks, trade restrictions and declining value of most regional currencies. The currency surplus countries to increase thus reducing the margins for cross-border trade.
moved for commercial purposes across the borders has increased significantly in the first six months of 2011 compared to last six months of 2010 (from below 100,000 heads to over likely driven by increased sales by livestock keepers to purchase cereals and also cut down on potential losses due to
f on-going drought. It will be important to monitor the livestock volumes transacted during peak September to November peak trading window.
key food commodities (MT)
Other cereals include: millet, pasta, rice, teff, wheat; Other pulses include: peas, lentils, ground nuts, green grams.
Volumes traded in first half of 2011 and percent change from July-Dec 2010 totals
Livestock not included since four more markets were included in the monitoring. Despite the increase in markets being monitor
March April May June
Other Other
pulses
Root
crops
Fruit and
veg
Sugar Other
cereals
Sorghum Maize
MT in 2011 Change from historical average
Issue 2, July 2011
Page 4
While the trade in beans has shown a downwards trend in volumes transacted between January and June in line with stock
, the seasonal trend of maize and sorghum
traded has exhibited mixed trends, perhaps being a result of the export ban imposed by two of the main source countries,
. This downward trend is likely to be driven by low
currency decline has caused prices in
has increased significantly in the first six
months of 2011 compared to last six months of 2010 (from below 100,000 heads to over 318,000 heads). This is most
likely driven by increased sales by livestock keepers to purchase cereals and also cut down on potential losses due to
going drought. It will be important to monitor the livestock volumes transacted during
Livestock not included since four more markets were included in the monitoring. Despite the increase in markets being monitored, volumes of other
Other pulses
Sugar
Other cereals
Sorghum
Maize
Beans
-500%
-400%
-300%
-200%
-100%
0%
100%
200%
300%
400%
500%
Beans Sesame
Pe
rce
nta
ge
Ch
an
ge
fro
m t
he
Ju
ly-D
ec
20
10
to
tals