eb75 4socialclimatedgempl final - european commission...
TRANSCRIPT

European Commission
Special Eurobarometer 370
Spe
cia
l Eur
obar
ome
ter
370
/ Wav
e E
B75
.4 –
TN
S o
pin
ion
& s
ocia
l
Social Climate
REPORT
Fieldwork: June 2011
Publication: October 2011
This survey has been requested by the Directorate-General Employment and co-ordinated by Directorate-General for Communication (DG COMM “Research and Speechwriting” Unit). http://ec.europa.eu/public_opinion/index_en.htm This document does not represent the point of view of the European Commission. The interpretations and opinions contained in it are solely those of the authors.

Special Eurobarometer 370
Social Climate
Conducted by TNS Opinion & Social at the request of
the European Commission's Directorate-General for
Employment
Survey co-ordinated by the Directorate-General for
Communication
SP
EC
IAL
EU
RO
SPECIAL EUROBAROMETER 370 “Social Climate”
2
TABLE OF CONTENTS
INTRODUCTION AND METHODOLOGY .............................................................5
1. PERSONAL SITUATION .............................................................................10
1.1 General life situation ....................................................................... 10 1.2 Residential area.............................................................................. 17 1.3 Personal job situation...................................................................... 22 1.4 Household financial situation ............................................................ 29 CONCLUSIONS......................................................................................... 35
2. GENERAL SITUATION IN THE COUNTRY....................................................36
2.1 Economic situation......................................................................... 36 2.2 Employment situation..................................................................... 43 2.3 Cost of living................................................................................. 50 2.4 Affordability of energy .................................................................... 55 2.5 Affordability of housing................................................................... 60 2.6 The way the public administration is run ........................................... 65 CONCLUSIONS......................................................................................... 70
3. SOCIAL PROTECTION AND INCLUSION .....................................................71
3.1 Health care provision ..................................................................... 71 3.2 Provision of pensions...................................................................... 76 3.3 Unemployment benefits .................................................................. 81 3.4 Relations between people from different cultural backgrounds.............. 86 3.5 The way inequalities and poverty are addressed................................. 91 CONCLUSIONS......................................................................................... 96
THREE AGGREGATE MEASURES OF THE SOCIAL CLIMATE..............................97
GENERAL CONCLUSIONS ............................................................................102
ANNEXES
TECHNICAL SPECIFICATIONS
QUESTIONNAIRE
TABLES

SPECIAL EUROBAROMETER 370 “Social Climate”
3
LIST OF FIGURES
Personal Situation……………………………………………………………………………………….12
Figure 1: Your life in general - Score cards (index table, showing the evolutions)...............12
Figure 2: Your life in general - SD tables (index table, showing the evolutions)..................14
Figure 3: Life satisfaction in general - Trend line ............................................................15
Figure 4: Expectations for the next twelve months regarding the life in general - Trend line 16
Figure 5: The area you live in - Score cards (index table, showing the evolutions) .............18
Figure 6: The area you live in - SD tables (index table, showing the evolutions) ................20
Figure 7: Your personal job situations - Score cards (index table, showing the evolutions) 23
Figure 8: Your personal job situations - SD tables (index table, showing the evolutions) ....26
Figure 9: Expectations for the next twelve months regarding the personal job situation -
Trend line...................................................................................................................28
Figure 10: The financial situation of your household - Score cards (index table, showing
evolutions) .................................................................................................................30
Figure 11: The financial situation of your household - SD tables (index table, showing
evolutions) .................................................................................................................32
Figure 12: Expectations for the next twelve months regarding the financial situation of the
household - Trend line .................................................................................................34
General Situation........................................................................................37 Figure 13: The economic situation in (OUR COUNTRY) - Score cards (index table, showing
evolutions) .................................................................................................................37
Figure 14: The economic situation in (OUR COUNTRY) - SD tables (index table, showing
evolutions) .................................................................................................................40
Figure 15: Expectations for the next twelve months regarding the economic situation in (OUR
COUNTRY) - Trend line.................................................................................................42
Figure 16: The employment situation in (OUR COUNTRY) - Score cards (index table, showing
evolutions) .................................................................................................................44
Figure 17: The employment situation in (OUR COUNTRY) - SD tables (index table, showing
evolutions) .................................................................................................................47
Figure 18: Expectations for the next twelve months regarding the employment situation in
(OUR COUNTRY) - Trend line ........................................................................................49
Figure 19: The cost of living in (OUR COUNTRY) - Score cards (index tables, showing
evolutions) .................................................................................................................51
Figure 20: The cost of living in (OUR COUNTRY) - SD tables (index table, showing the
evolutions) .................................................................................................................53
Figure 21: How affordable energy is in (OUR COUNTRY) - Score cards (index table, showing
evolutions) - Score cards (index table, showing evolutions) ..............................................56
Figure 22: How affordable energy is in (OUR COUNTRY) - Score cards (index table, showing
evolutions) - SD tables (index tables, showing evolutions)................................................58
Figure 23: How affordable housing is in (OUR COUNTRY) - Score cards (index tables, showing
evolutions) - Score cards (index tables, showing evolutions).............................................61
Figure 24: How affordable housing is in (OUR COUNTRY) - SD tables (index tables, showing
evolutions) - SD tables (index tables, showing evolutions)................................................63

SPECIAL EUROBAROMETER 370 “Social Climate”
4
Figure 25: The way public administration runs in (OUR COUNTRY) - Score cards (index
tables, showing evolutions) - Score cards (index tables, showing evolutions) ......................66
Figure 26: The way public administration runs in (OUR COUNTRY) - SD tables (index table,
showing the evolutions) - SD tables (index table, showing the evolutions)..........................68
Social Protection and inclusion...................................................................72 Figure 27: Health care provision in (OUR COUNTRY) - Score cards (index tables, showing
evolutions) .................................................................................................................72
Figure 28: Health care provision in (OUR COUNTRY) - SD tables (index tables, showing
evolutions) .................................................................................................................74
Figure 29: The provision of pensions in (OUR COUNTRY) - Score cards (index tables, showing
evolutions) .................................................................................................................77
Figure 30: The provision of pensions in (OUR COUNTRY) - Score cards (index tables, showing
evolutions) - SD tables (index tables, showing evolutions)................................................79
Figure 31: Unemployment benefits in (OUR COUNTRY) - Score cards (index tables, showing
evolutions) .................................................................................................................82
Figure 32: Unemployment benefits in (OUR COUNTRY) - Score cards (index tables, showing
evolutions) - SD tables (index tables, showing evolutions)) ..............................................84
Figure 33: Relations in (OUR COUNTRY) between people from different cultural or religious
backgrounds or nationalities - Score cards (index tables, showing evolutions).....................87
Figure 34: Relations in (OUR COUNTRY) between people from different cultural or religious
backgrounds or nationalities - SD tables (index tables, showing evolutions)........................89
Figure 35: The way inequalities and poverty are addressed in (OUR COUNTRY) - Score cards
(index tables, showing evolutions).................................................................................92
Figure 36: The way inequalities and poverty are addressed in (OUR COUNTRY) - SD tables
(index tables, showing evolutions).................................................................................94
Overall country ranking of the current situation.........................................98 Figure 37: Overall country ranking of the current situation..............................................98
SPECIAL EUROBAROMETER 370 “Social Climate”
5
INTRODUCTION AND METHODOLOGY
Europe is still in a state of flux. The impact of the 2008 financial and economic crisis
is still being felt, with bouts of speculation in relation to various EU Member States –
and predictions of further economic problems making the headlines for every piece of
good news about recovery.
In addition to this, there has been a renewed focus on environmental problems,
resource use and the associated impact upon utility costs and people’s individual
financial situations. Property prices continue to fluctuate, the employment situation
remains unsteady and societal unrest continues.
However, compared to the situation of one year ago, the economic context of the EU
has evolved: although the rate of growth fluctuates, on a regular basis and from
Member State to Member State, EU27 Gross Domestic Product increased by 0.8
percentage points during the first quarter of 2011 and is up by as much as +2.5
points1 on a year-on-year basis. Furthermore, unemployment fell from 9.7% in April
2010 to 9.4% in April 20112. While a return to the situation prior to the crisis of
autumn 2008 has not yet occurred, some improvement has been observed.
However, instability continues to predominate, and the impact of the crisis is still felt
in the European Union. Individual Member States, of course, are experiencing
varying degrees of change themselves – both positive and negative.
This special Eurobarometer survey on the social climate gives answers to the
following questions: how does this state of change affect the European public? How
are European citizens responding to this changing economic situation? What is the
impact on their daily lives?
This survey is the third of its kind to be conducted in the EU, following on from those
conducted in 2009 and 2010. The Eurobarometer survey at hand intends to uncover
these opinions and see whether or not there have been any changes since the last
wave of analysis, in 2010. Around 1,000 people have been interviewed in each
country3. This survey not only measures how Europeans perceive the current
recession and its social impact, but also reveals interesting differences between
countries which seem to reflect the strengths and weaknesses of national policies
and institutions.
The European Commission, through the EU2020 strategy and various other
initiatives, is taking steps towards improving the quality of life for citizens in its
Member States – steps which have an immediate effect, as well as working towards
long-term goals. Has this effort filtered through to the European population?
1 http://epp.eurostat.ec.europa.eu/cache/ITY_PUBLIC/2-13052011-AP/EN/2-13052011-AP-EN.PDF 2 http://epp.eurostat.ec.europa.eu/cache/ITY_PUBLIC/3-31052011-BP/EN/3-31052011-BP-EN.PDF 3 1000 per country except in Germany (1,500); United Kingdom (1,300); Luxembourg (500); Republic of Cyprus (500) and Malta (500).

SPECIAL EUROBAROMETER 370 “Social Climate”
6
Furthermore, this survey focuses on the local as well as the trans-national.
Respondents have been asked to judge their own feelings of quality of life relating to
the area in which they live, as well as commenting on the general situation.
Healthcare, employment, housing, general social concerns and the economic
situation have all been considered.
Levels of optimism and the perception of change are assessed, alongside the
evolution of opinion from the last waves of research. The survey consists of groups
of questions, which break down as follows:
1. The first group concerns the personal situation of the respondents including
their satisfaction with life in general, with the area where they live, with their
personal job situation and with the financial situation of their households.
2. The second set covers the general situation of the country and includes the
cost of living, the affordability of energy and of housing, the quality of public
administration, and the general employment and economic situation.
3. The third set focuses on social protection and social inclusion in the country
and contains questions on health care provision, pensions, unemployment benefits,
the way inequalities and poverty are addressed and relations between people from
different cultural or religious backgrounds.
Some of the 15 items tested in this survey correspond to long-term trend questions
of the Eurobarometer at personal level (life in general, financial situation of the
household and personal job situation) and at country level (economic situation and
employment situation). Only “current satisfaction with life in general” has been
asked since 1973 in the context of Eurobarometer surveys (scale satisfied/not
satisfied). The other items have been asked only since 1995 as expectations trends
using another scale (better/worse).
First and foremost, in this report, we analyse a mean index score, measured from
+10 to -10, compared to the analysis of mean index scores and percentage scores
seen in last year’s report. This index score indicates the balance of opinion in each
country, where +10 corresponds to the highest possible degree of satisfaction and
-10 corresponds to the lowest. Scored in this manner, QB1 and QB2 represent the
respondents’ level of satisfaction with the current situation4.
4 The indexes for the current situation (QB1 and QB2) are calculated at individual level and based on weighted data. In this calculation the answer categories were given a weight between 0 and 3: “very satisfied" / "very good” = 3, “fairly satisfied” / "rather good" = 2, “not very satisfied” / "rather bad" = 1 and “not at all satisfied” / "very bad" = 0. The answer category “don’t know” was not taken into account. The new scale ranging between 0 and 3 was converted into a scale from -10 to +10, following these steps: 1/ The values are divided by 3, and multiplied by 20: we have now a scale that goes from 0 to +20. 2/ Then 10 is subtracted from each of them: the resulting four values are: -10; -3.33; +3.33; +10.

SPECIAL EUROBAROMETER 370 “Social Climate”
7
For questions QB3 and QB5, the survey measured expectations for the coming twelve
months and how things have changed over the last five years. Here, a better-worse
index is used, and we analyse the proportion of responses answering better
(QB3)/improved (QB4), minus the proportion answering worse (QAB)/got worse
(QB4): this index can potentially range from -100 to +100. A positive index means
that the proportion of people who believe that things have got better/will get better
outweighs the proportion of those who think things have got or will get worse. We
also present the percentage of respondents who answered that things will stay the
same (QB3)/ stayed about the same (QB4): this gives us an idea of the degree of
belief that the situation has not changed over the last 5 years, or will stay the same
during the next twelve months.
This approach allows us to establish a single figure to describe the situation for each
dimension tackled in the survey. Although a single figure gives us a good insight into
the overall situation, it also simplifies a possibly very complex picture into a single
score. For example, while a score approaching 0 could describe a situation in which
about half of respondents were strongly dissatisfied and half strongly satisfied, it
could equally indicate a large and balanced number of moderate responses. In this
report, we therefore focus on these indexes and on evolutions for each index since
the first wave of this report. For each dimension, we present one scorecard with the
different results measured in this survey for the EU as a whole, and for each of the
countries surveyed:
- Evaluation of the current situation (QB1 and QB2): the index measured in this
wave / the evolution of the index since the previous wave (EB75.4-EB73.5).
- Situation compared with 5 years ago (QB4): the index measured in this wave
/ the proportion of respondents answering “the same” in this wave / the
evolution of the index since the previous wave (EB75.4-EB73.5).
- Expectations for the coming 12 months (QB3): the index measured in this
wave / the proportion of respondents answering “the same” in this wave / the
evolution of the index since the previous wave (EB75.4-EB73.5).
* * *
5 The better-worse index was created by calculating the difference in percentage points between the two extreme answer categories of QB3 (“better” - “worse”) and QB4 ("improved" - "got worse"). This brings us to an index on a scale from -100 to +100. Please note that the neutral answer categories and the "don't know" responses were not taken into account when calculating this index. The overall results (in %), on the basis of which both indexes have been created, are annexed to this report.
SPECIAL EUROBAROMETER 370 “Social Climate”
8
The results of this report come from the special Eurobarometer no. 370 conducted by
TNS Opinion & Social network between 4 and 19 June 2011. All interviews were
conducted face-to-face in people’s homes and in the appropriate national languages.
The methodology is consistent with that used in Standard Eurobarometer polls
managed by the European Commission’s Directorate-General for Communication
(‘Public Opinion and Speechwriting’ unit). A technical note on the manner in which
interviews were conducted is appended as an annex to this report. This note
indicates the interview methods and the confidence intervals.
To ensure that the sample is representative, all national results provided in this
study are weighted according to standard socio-demographic characteristics. Scores
for the EU average are weighted according to country size in order to ensure an
accurate representation of public opinion in the EU.
*****
The Eurobarometer web site can be consulted at the following address:
http://ec.europa.eu/public_opinion/index_en.htm
We wish to thank the people throughout the
European Union who have given their time to take part in this survey.
Without their active participation, this survey would not have been possible.

SPECIAL EUROBAROMETER 370 “Social Climate”
9
In this report, the countries are represented by their official abbreviations. The
abbreviations used in this report correspond to:
ABBREVIATIONS
EU27 European Union – 27 Member States
DK Don’t know
BE Belgium
BG Bulgaria
CZ Czech Republic
DK Denmark
DE Germany
EE Estonia
EL Greece
ES Spain
FR France
IE Ireland
IT Italy
CY Republic of Cyprus
LT Lithuania
LV Latvia
LU Luxembourg
HU Hungary
MT Malta
NL The Netherlands
AT Austria
PL Poland
PT Portugal
RO Romania
SI Slovenia
SK Slovakia
FI Finland
SE Sweden
UK United Kingdom

SPECIAL EUROBAROMETER 370 “Social Climate”
10
1. PERSONAL SITUATION
In this section, we examine levels of satisfaction in the various Member States, and
other general indicators of respondents’ personal situations, with questions designed
to assess Europeans’ opinions on these matters. Respondents’ ratings of the current
situation, whether they think it is better or worse than five years ago and
expectations for the coming twelve months are presented item by item, and
compared with last year’s findings.
Sections of this report frequently draw a distinction between countries: this has been
done on a purely geographical basis and no political conclusions are intended to be
drawn from this analysis.
1.1 General life situation (QB1; QB4_1; QB3_16)
The overall picture regarding Europeans’ evaluation of their life in general is positive,
although not overwhelmingly so, with a slight increase from the last wave of
analysis. As in last year’s survey, the situation now compared to five years ago
appears to have worsened, although there is a modest degree of optimism relating to
respondents’ impression of the situation as it develops over the next twelve months.
Compared to the 2010 survey, these two last indicators have progressed slightly.
Regarding the evaluation of the current life situation, an EU27 average of 3.5 on the
scale indicates some positive feeling – particularly as there has been a slight rise of
0.4 points on the last wave of analysis.
A score of -2 on the better/worse index indicates that EU citizens feel as if their life
situation is slightly worse compared to five years ago – although there is some
indication that things are improving, as this represents an increase of three points on
the previous survey (which itself registered a decline of -2 from the one previous to
that, in May 2009).
Expectations for the next twelve months are higher – +12 points on the better/worse
index, which itself represents a positive evolution of +3 from the last survey. EU
citizens are optimistic – and the levels of optimism are growing, reflecting perhaps
the fluctuations of the economic situation in the EU.
6 QB1 - On the whole, are you satisfied, fairly satisfied, not very satisfied or not at all satisfied with the life you lead? QB3.1 - What are your expectations for the next twelve months; will the next twelve months be better, worse or the same, when it comes to…? Your life in general, QB4.1 - Compared with five years ago, would you say things have improved, gotten worse or stayed about the same when it comes to…? Your life in general.

SPECIAL EUROBAROMETER 370 “Social Climate”
11
There is a proportion of answers which state that things will stay the same – more so
in relation to the next twelve months than to the last five years (57% compared to
41%). This has an impact on the better/worse index – indicating that positivity for
the next twelve months is not unanimous, with “the same” answers forming the
majority of opinion.

SPECIAL EUROBAROMETER 370 “Social Climate”
12
Figure 1: QB1, QB4.1 and QB3.1 – Score cards (index table, showing the evolutions)
The current situation index is measured on a scale from -10 to +10.
The better-worse indexes are measured on a scale from -100 to +100.
SPECIAL EUROBAROMETER 370 “Social Climate”
13
Country-by-country analysis indicates that there are some real differences in opinion
between Member States, with a similar geographic grouping at the top and bottom
ends of the table. The evaluation of the current life situation was ranked highly by
the Nordic and Benelux Member States, the UK and Ireland, which take up the first
eight places on the list. Denmark scored 7.5; Sweden 6.8; Finland 5.8; the
Netherlands 6.5; Luxembourg 6.2; and Belgium 5.1; Ireland 5.7 and the UK 5.2.
Cyprus and Malta also rank highly (5.1 and 4.6 respectively).
The bottom end of the table is mainly occupied by Baltic, Eastern and Central
European Member States – with Hungary recording a score of -0.3, and Bulgaria and
Romania -0.9 each –, alongside Portugal (0.3) and Greece (-0.1).
Evolution of the current situation results is mainly slight, although it is interesting to
note that the top-scoring nation – Denmark – saw a decrease in score of -0.2, while
the lowest-scoring Member States saw increases (+1.3 in Bulgaria and +1.5 in
Romania). Italy also saw a positive increase of +1.3, taking the overall score to 2.7 –
just below the EU27 average. Portugal showed an increase of +0.8, giving it an
overall positive score of +0.3. Some decreases were noted, the most important
being seen in Slovenia and Slovakia, with evolutions of -0.5 and -0.4 respectively.
The most positive opinion in terms of life satisfaction as it compares to five years
ago is felt in Sweden, with a score of +52 on the better/worse index. This is followed
by Finland with +36 and Luxembourg with +33. Almost all of the top eight Member
States for the evaluation of the current situation index report a situation better than
the EU27 average – with the exception of Ireland, where a better-worse score of -7,
five points lower than the average, was recorded. There were large negative better-
worse scores from several Member States who rank at the bottom of the current
situation index: -64 from Greece, -48 from Bulgaria, and -43 from both Portugal and
Romania.
Strong evolutions were noticed in several Member States for the five-year
comparison results, both positive and negative. Belgium recorded a positive
evolution of +16, Austria +15 and Germany +13. Greece’s score changed by -20,
and Ireland’s by -19.
Optimism is high for the next twelve months in particular Member States – such as
Sweden (+43), Estonia (+28), Denmark (+27), Luxembourg (+25), Finland (+24)
and France (+23). Here, there are positive and negative scores scattered up and
down the list ranked by current situation levels – with some nations reporting a
negative current system, such as Bulgaria which records a better-worse score of +7.
The lowest scores were recorded in Greece (-42), Portugal (-22) and Hungary (-13).

SPECIAL EUROBAROMETER 370 “Social Climate”
14
The evolution of results regarding the life situation over the next twelve months is
also quite small, with only a few Member States recording a change – +24 in
Lithuania, +22 in Romania (both near the bottom of the “current situation” ranking),
+10 in France, +9 in Estonia. Hungary’s score decreased sharply by -26, giving an
overall score of -13.
Figure 2: QB1, QB4.1 and QB3.1 – SD tables (index table, showing the evolutions)
The current situation index is measured on a scale from -10 to +10.
The better-worse indexes are measured on a scale from -100 to +100.
Strong changes in opinion are noticed along socio-demographic lines. Although
male and female respondents gave similar answers, there was an important degree
of difference in every other socio-demographic split. The current life situation is
viewed less positively by respondents aged 25 or above (with an index of 3.3 for age

SPECIAL EUROBAROMETER 370 “Social Climate”
15
categories 25-39 and 55+ and with 3.2 for 40-54) than those aged 15-24, which
gave an answer of 4.5. A similar pattern is noticed depending on the age of
respondents when they finished studying, with a very sharp climb of 2.4 from those
who finished at the age of 15 or before to 5.3 from those still studying (those who
finished aged 20+ recorded a positive score of 4.5). Occupation of respondents had a
clear impact on response – with -0.1 from the unemployed being the lowest.
Managers gave an average response of 5.2 by comparison – the next lowest after
the unemployed was house persons, who gave a score of 2.5. Financial situation also
has a clear effect, with those who report having financial difficulties giving a score of
-0.7 compared to 4.7 from those who almost never have difficulties paying their bills.
Perceived improvement in the last five years is highest among the young, those
with high levels of education and students, white-collar workers and managers (in
fact, in general, the employed) and the financially well-off. The unemployed, older
respondents and those who finished education earlier see a decline in their life
situation in general. Optimism levels also follow this trend to a certain extent.
The unemployed and those who have financial difficulties are also confident that
things will improve over the next twelve months, with scores of +23 and +9 on
the better/worse index respectively.
Evolution of the results shows that things have improved somewhat since the last
round of analysis for some people. The current life situation is seen as +0.8 better
by respondents with financial difficulties, +0.7 by retired and other white collars and
+0.6 better by the 55+ age group. The unemployed report a decline of -0.9 in
regard to the current situation. They do, however, also report a positive evolution
of +14 with regard to the situation over the next twelve months.
Figure 3: QB1 – Trend line

SPECIAL EUROBAROMETER 370 “Social Climate”
16
The slight drop in the perception of the quality of the general situation – from 3.2 in
Spring 2009 to 3.1, in Spring 2010 – has been redressed, with the EU27 average for
this survey being the joint highest recorded since 2001 (3.5). A gradual decline for
the period from 2007-2009 is noticeable but this appears, for now, to have changed.
This survey’s score of 3.5 is a whole point higher than the lowest recorded on this
line – 2.5 in Jan-Feb 2009, in the depths of the economic crisis.
Figure 4: QB3.1 – Trend line
Levels of optimism for the next twelve months are also slowly rising (+12, +3 points
since Spring 2009), although the picture here is different. While we can see an
increase in score gradually over the last three waves of analysis when compared to
the lowest point on the line (+1, in January-February 2009), there is a long way to
go before reaching scores as high as those recorded between Autumn 1995 and
Spring 2008. Take, for example, the response in Spring 2007 – +26, compared to
this survey’s score of +12. There is some optimism in the EU Member States – just
not as much as has previously been felt.

SPECIAL EUROBAROMETER 370 “Social Climate”
17
1.2 Residential area (QB2_1; QB3_2; QB4_27)
We now turn our attention to respondents’ feelings about the areas in which they
live, and whether or not they feel that the quality of their immediate surroundings
has improved or got worse (or is likely to improve or get worse).
As observed in the last report, EU citizens tend to feel better about their residential
areas than they do with their quality of life in general. An EU27 average score of 4.4
for the current evaluation of the residential area is recorded, with a +0.2 increase on
last year’s result. The better/worse index notes a very slight positive feeling about
the situation now compared to five years ago, with an average score of +2. This
represents a negative evolution of -2 points from the last wave of analysis. With
regards to the situation as it is set to change over the next twelve months, a positive
score of +6 is recorded on average – this is an improvement of +2 from the last
report.
60% of respondents believe that the situation of their residential area now is the
same as it was five years ago. A very high proportion – 74% – believes that the
situation will remain the same over the next twelve months. When considering any
positive or negative scores in the better/worse indexes, it is important to bear these
figures in mind.
7 QB2.1 - How would you judge the current situation of…? The area you live in, QB3.2 - What are your expectations for the next twelve months; will the next twelve months be better, worse or the same, when it comes to…? The area you live in, QB4.2 - Compared with five years ago, would you say things have improved, gotten worse or stayed about the same when it comes to…? The area you live in.

SPECIAL EUROBAROMETER 370 “Social Climate”
18
Figure 5: QB2.1, QB3.2 and QB4.2 – Score cards (index table, showing the evolutions)
The current situation index is measured on a scale from -10 to +10.
The better-worse indexes are measured on a scale from -100 to +100

SPECIAL EUROBAROMETER 370 “Social Climate”
19
For the current situation, the Nordic Member States, Benelux, the UK and Ireland
once again make up the eight highest-scoring nations in the list. Each records a
score comfortably ahead of the EU27 average – with Sweden (7.3) topping the list,
followed in order by Luxembourg (6.8), the Netherlands (6.7), Ireland (6.3), Finland
(6.1), Belgium (5.9), Denmark (5.5) and the UK (5.3). The lower end of the list is
again comprised mainly of Eastern and Central European and 2 Baltic Member States
(Lithuania and Latvia) alongside Greece (1.5) and Portugal (2.7). The lowest-scoring
Member State is Bulgaria, with a score of 0.7. It is important to note that all Member
States report a positive score on the -10/+10 scale, no matter how slight.
There are some evolutions in the data in relation to the current situation of the
residential area. Malta returns an increase of +0.9 points. Estonia shows an increase
of +0.8, and Denmark +0.6. Slovenia’s score fell by the largest amount – a
downward evolution of -0.9 – followed by Slovakia with an evolution of -0.7 and
Bulgaria with -0.5. Greece, which is placed near the bottom of the current situation
list and which showed high levels of pessimism, shows a slight increase of +0.1
points regarding the current situation.
There are mixed feelings regarding the situation compared to five years ago –
some Member States responded with positive scores, others with distinctly negative
ones. The Finns see a considerable high score – recording +26 on the better/worse
index – as do citizens in Luxembourg, with +23, Estonia, with +22 and Malta, with
+21. The Greeks returned a very negative score of -54 on the index, followed by the
Portuguese with -22 and Bulgarians with -20. These low scores highlight the financial
and social difficulties that have taken place in these Member States since the
beginning of the financial and economic crisis, in autumn 2008.
Comparing to the situation as it was five years ago, we see that the evolution is
relatively slight and even across the Member States, with a few exceptions. The
Greeks report an evolution of -27 compared to the last report; in Hungary, the
evolution is -11. Lithuania showed an increase of +14 points on the index, and Malta
of +11. Of the top ten-scoring Member States ranked by the current situation score,
two showed decreases – Ireland with -9, and Luxembourg with -6.
When asked to consider how the situation of the residential area will change over the
next twelve months, there was again some optimism noted from Member States
which placed at each end of the “current situation” scoring. Strong positive scores of
+24 in Estonia, +16 in France, +15 in Latvia and Lithuania, and +12 in Sweden,
Finland and Malta all contributed to the cautiously positive average. At the other end
of the scale, a better-worse score of -37 was noticed in Greece, with -15 in Portugal
being the next most negative.

SPECIAL EUROBAROMETER 370 “Social Climate”
20
Levels of optimism for the next twelve months have increased since last year by +12
in Romania, +9 in Bulgaria, and +8 in Estonia and Lithuania. The score decreased in
Hungary (-17) and Greece (-15).
Figure 6: QB2.1, QB3.2 and QB4.2 – SD tables (index table, showing the evolutions)
The current situation index is measured on a scale from -10 to +10.
The better-worse indexes are measured on a scale from -100 to +100.
Looking at the data split by socio-demographic grouping, we notice that the
patterns are less linear than for the first question (life in general). There is also a
general degree of positivity noted with regard to the current situation of the
residential area.

SPECIAL EUROBAROMETER 370 “Social Climate”
21
Age plays a role in determining how respondents feel, with the 25-39 band giving the
lowest feeling of satisfaction of the current situation (3.9). This is followed by the
15-24 band (4.3) and the 40-54 group (4.4). The oldest age group, 55+, gave a
satisfied score of 4.7. Recent uncertainty regarding house prices might indicate that
those who have been in a position to buy accommodation longer ago, rather than
those who bought before or during the downturn, may be more comfortable with the
fluctuations in prices.
As level of education increases, so does satisfaction, although it is also useful to note
that students are less happy with the situation of their current residential area (4.7)
than those who finished their education at age 20+ (5.1).
The unemployed reported the lowest levels of satisfaction with the current situation,
with a score of 2.7. Managers again reported the highest levels of satisfaction – 5.4 –
followed by the retired (4.8) and students (4.7). There is also a sharp difference in
the results given by those who struggle to pay their bills – 2.4 – and those who
almost never have this problem, who gave an answer of 5.2. It is very likely that
these different elements reveal that the level of standard of living is key here: the
wealthier respondents are, the more satisfied they are with the area they live in,
probably because their residential budget is more important.
Perception of improvement of the residential area in the last five years is high
among the younger respondents (+12 among the 15-24 group, +9 among the 25-
39s) although this switches to a negative attitude among the 55+ respondents (-4).
Education has an impact on this as well – with those who finished their education at
age 15 or before giving a score of -10 compared to positive scores from all other
education groupings, and a high score of +14 from those still studying. Regarding
occupation, students (+14) and managers (+13) are more positive than, for
example, house persons (-7) and the unemployed (-5). Negative scores on this index
come from citizens who frequently or sometimes have problems paying their bills –
respectively scoring -16 and -7. Those who almost never have such problems gave a
score of +8.
Some similar patterns can be noticed regarding how things will change in the next
twelve months, with students and the 15-24 age-group giving a positive score of
+18. Manual workers and the unemployed both also recorded optimistic scores of
+10. We notice a pattern linking the level of respondents’ education to the scores –
as the level increases, optimism does as well. Those who finished their education at
the age of 15 or younger give a score of -2, those who finished aged 16-19 a score
of +7, those who finished at 20 or older +10, and those who are still studying a
score of +18.

SPECIAL EUROBAROMETER 370 “Social Climate”
22
Financial situation has an impact as well – those who report frequent problems
paying their bills give a score of -2, compared to +6 from those who have occasional
problems doing so, and +7 from those who almost never do.
There are few evolutions which differ greatly from the EU27 average evolutions in
this set of data, indicating that opinion is staying mainly the same relating to the
accommodation situation. This is reflected again in the high number of “the same”
answers given. One development which is worthy of note is the improvement by
+0.4 of the current situation of the residential area as perceived by those who have
financial difficulties, which is the same as the evolution in responses from managers
and other white collar workers.
1.3 Personal job situation (QB2_12; QAB_13; QB4_138) A contrast to the previously-discussed question can be found in the analysis of
respondents’ personal job situations. The answers to this question paint a far less
positive picture than those relating to housing, although in this survey – like the
previous one, in May 2010 – there is a slight evolution towards the positive
compared to previous results.
The EU27 average score is 1.7, representing a small increase of +0.2 from the last
wave of analysis. When asked to compare the current situation with that of five
years ago, respondents noted a better-worse score of -4. When asked to consider
how their job situation might change in the next twelve months, they responded with
better-worse score of +9.
The previous survey in May 2010 also noted a slight rise in respondents’
consideration of their current job situation – by +0.1. Therefore, the current
situation has been seen to improve very slightly over the last two waves of research.
Similarly, the score for the situation now as compared to that of five years ago has
also improved slightly on an EU27 average level – by +2. Expectations for the next
twelve months have improved by +4 points towards the better.
8QB2.12 - How would you judge the current situation of….Your personal job situation, QB3.13 - What are your expectations for the next twelve months; will the next twelve months be better, worse or the same, when it comes to…? Your personal job situation, QB4.13 - Compared with five years ago, would you say things have improved, gotten worse or stayed about the same when it comes to…? Your personal job situation.

SPECIAL EUROBAROMETER 370 “Social Climate”
23
Figure 7: QB2.12, QB3.13 and QB4.13 – Score cards (index table, showing the evolutions)
The current situation index is measured on a scale from -10 to +10.
The better-worse indexes are measured on a scale from -100 to +100.

SPECIAL EUROBAROMETER 370 “Social Climate”
24
The three Nordic Member States score highest in the current personal job
situation ranking in the following order – Sweden (5.7), Finland (5.6), and Denmark
(5.1). Luxembourg (4.6), Belgium (4), and the Netherlands (3.8) all score highly
once again, and are joined in the top ten Member States by Austria (4.2), Germany
(3.2), Estonia (2.7) and France (2.6). Hungary scores lowest in relation to the
current employment situation with a score of -3; other low-scoring Member States
include Romania with -2.7, Greece with -2.4 and Lithuania with -1.5.
Analysing these results compared to those returned in the previous survey in May
2010, we can see only a few changes. This year, none of the results for the current
personal job situation evolved in either direction by one whole point. Belgium
returned the most positive evolution of +0.8, followed by Finland of +0.7 and several
Member States showed an evolution of +0.6 – Sweden, Austria, Germany and Italy.
In the last year survey there was an evolution towards worse of -2.4 score points in
Romania and of -1 point in Greece.
Strong negative evolutions since last year were noticed in Luxembourg, which gave a
high result in terms of the current situation – its score of 4.6 being subject to a
negative evolution of -0.6 since the last report. In the last report, Luxembourg
ranked second in the overall list relating to the current situation, and showed an
evolution of +0.7 from the report before that. This can be taken as an indication of
how quickly opinion on something as fundamental as employment – relating, as it
does, to many other important aspects of life in Europe – can fluctuate. Strong
negative evolutions were also noted this year in Cyprus, Ireland (both -0.6), Poland
(-0.5) and Greece (-0.4).
For both other questions related to personal job situation (compared with five years
ago, and with the next twelve months), levels of “the same” answers on the
better/worse indexes are lower than in the previous questions, indicates more
strength of opinion in most Member States.
Sweden gave a better-worse score of +35 in relation to the personal job situation as
it stood five years ago, followed by Luxembourg (+24), Austria and Denmark (both
+14). Variations of ten points between each of these answers indicate the sharp fall
towards average noted as we move down the list of Member States when ranked by
this category.
Eight Member States reported scores lower than -20, with Greece (-43), Romania
(-41), Lithuania (-39) and Hungary (-38) giving the lowest answers.

SPECIAL EUROBAROMETER 370 “Social Climate”
25
The evolutions of responses in relation to the personal job situation compared with
five years ago are generally not really marked, with a few outstanding exceptions.
Lithuania (+15), Estonia (+11) and Austria (+10) all saw distinct changes toward the
positive on the better/worse index. Greece (-13), Romania (-9) and Portugal (-7)
saw the strongest downward evolutions.
Expectations for the coming twelve months are highest in Sweden (+30), Estonia
(+26) and Luxembourg (+20). Optimism was also observed in France (+19),
Denmark (+18) and Belgium (+17). Several nations ranked low in the list for the
current job situation scored relatively highly in terms of expectations for the near
future, as well – including Latvia (+16), Spain (+11) and Bulgaria (+7). Optimism is
lowest in Greece (-30), Portugal (-21), Hungary (-12) and Romania (-11).
Expectations for the next twelve months regarding the personal job situation have
grown considerably in Lithuania (+20), Romania (+15), and to a lesser extent in
Spain, France and Luxembourg (+8) – Member States which rank near the bottom
(Lithuania, Romania and Spain) and top (France and Luxembourg) of the list when
ranked by the current situation. The strongest negative evolution was in Hungary (-
15), also at the bottom of the current situation ranking. There were some reductions
in levels of optimism near the top of the current situation ranking, but they are
mostly too slight to be of any real significance (such as Denmark, -1).

SPECIAL EUROBAROMETER 370 “Social Climate”
26
Figure 8: QB2.12, QB3.13 and QB4.13 – SD tables (index table, showing the evolutions)
The current situation index is measured on a scale from -10 to +10.
The better-worse indexes are measured on a scale from -100 to +100.
Looking at the socio-demographic results, we notice a difference between the
answers given by men and women – with male respondents giving an answer of 1.9
compared to a female respondent average of 1.4. The current personal job
situation is perceived as better according to the age of the respondent as well, with
the youngest age band giving a low score of 1.2 which rises through the subsequent
two (1.5, 1.6) to 2.1 for the 55+. As noticed elsewhere, the situation also improves
with the level of education of the respondent – a very low 0.5 for those who finished
education aged 15 or under, 1.4 for those who finished at age 16-19 and 3.1 for
people who finished studying at age 20 or over. However, students themselves
recorded a just-above-average score of 1.9.

SPECIAL EUROBAROMETER 370 “Social Climate”
27
Managers (4.6) and other white collar workers (3.1) give the most positive response
relating to the current situation, although others – the self-employed and manual
workers – also give positive scores. A very negative score of -5.6 is reported by the
unemployed, as we might expect. Financial situation has a very distinct effect as
well, with those in financial difficulty recording a score of -2.9 compared to a score of
3.3 for those who do not struggle to pay their bills.
The personal job situation compared to five years ago is seen as considerably
better by the young, with +11 on the better/worse scale recorded by the 15-24 age
group. This falls steadily as respondents get older, reaching a negative score of -14
for the 55+.
There is a move in the opposite direction observed relating to the age at which
respondents stopped studying. Those who finished their education at 15 or below
gave a score of -19, compared to +6 from those who finished at age 20 or over, and
+13 from those still studying.
Correlated with the age of end of education, occupation plays a part too – the
unemployed gave a score of -59 compared to +22 from managers, +10 from white-
collar workers and +4 from manual workers. The self-employed and retired people
noted a decline in the situation – with -7 and -14 respectively. Financial situation
also plays a part, with respondents who have difficulties paying the bills giving a
score of -39 and those who don’t giving a score of +7 – tentatively positive, but
positive nonetheless.
Expectations for the coming twelve months are somewhat higher. Again there is a
difference between male and female respondents – who gave scores of +11 and +7
respectively. And groups which returned negative scores for the current personal job
situation and the way things are compared to five years ago also have high hopes –
the unemployed giving a score of +25, and the youngest two age groups, 15-24 and
25-39, giving +31 and +18 respectively.
Many groups show a positive evolution when considering the current personal job
situation. Despite the negative results recorded, those who have difficulties paying
the bills noted a positive evolution of +0.6. The current situation has worsened in the
eyes of students and house persons (-0.4) among others. Regarding the five-year
comparison, some strong positive evolutions were noticed. This is the case for white-
collar workers and those who finished their education at the age of 16-19 (both +4),
manual workers (+3) and those who report frequent financial difficulties (+6).
Evaluations of the next twelve months have grown more positive almost
unanimously – although it remains the same in a few instances. This is most
obviously the case for the unemployed (+14) and the 15-24 age-group (+8), both of
which groups take a fairly negative view of their current job situation.
SPECIAL EUROBAROMETER 370 “Social Climate”
28
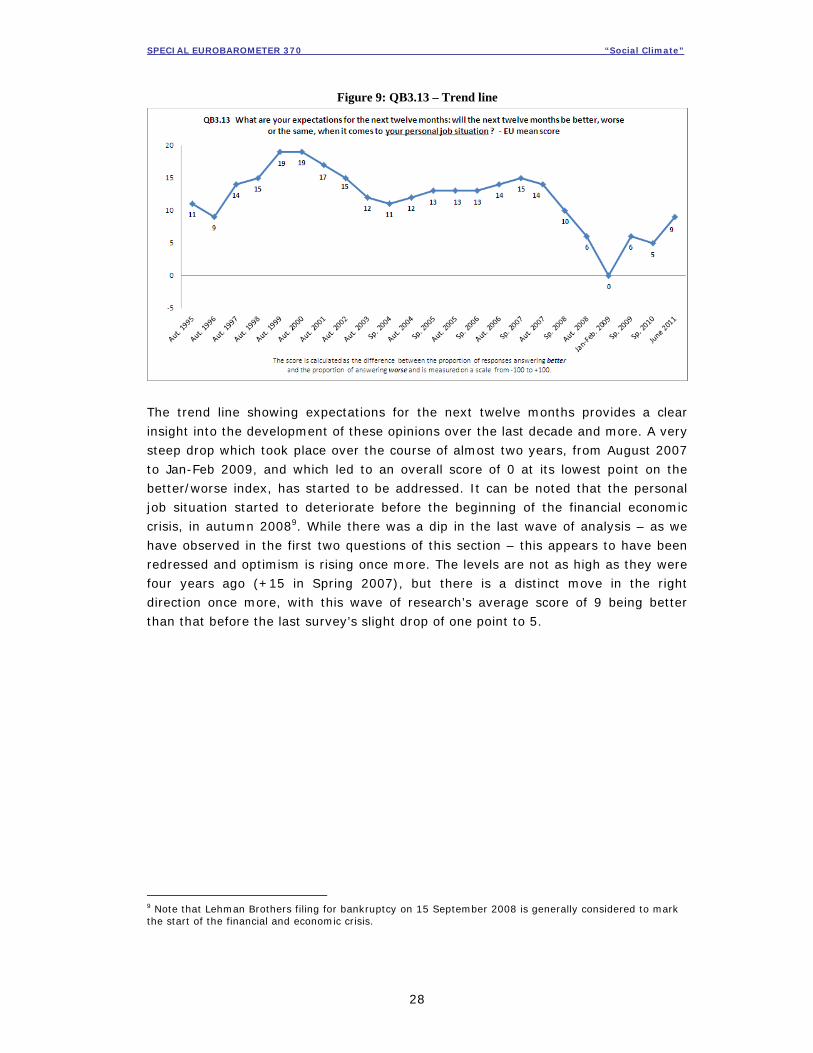
Figure 9: QB3.13 – Trend line
The trend line showing expectations for the next twelve months provides a clear
insight into the development of these opinions over the last decade and more. A very
steep drop which took place over the course of almost two years, from August 2007
to Jan-Feb 2009, and which led to an overall score of 0 at its lowest point on the
better/worse index, has started to be addressed. It can be noted that the personal
job situation started to deteriorate before the beginning of the financial economic
crisis, in autumn 20089. While there was a dip in the last wave of analysis – as we
have observed in the first two questions of this section – this appears to have been
redressed and optimism is rising once more. The levels are not as high as they were
four years ago (+15 in Spring 2007), but there is a distinct move in the right
direction once more, with this wave of research’s average score of 9 being better
than that before the last survey’s slight drop of one point to 5.
9 Note that Lehman Brothers filing for bankruptcy on 15 September 2008 is generally considered to mark the start of the financial and economic crisis.
SPECIAL EUROBAROMETER 370 “Social Climate”
29
1.4 Household financial situation (QB2_13; QB3_14;
QB4_1410)
The final question in this section concerns the household financial situation of
respondents – tied closely, as it is, to each of the areas analysed above.
The current EU27 average for the household financial situation of respondents,
marked on a scale of +10 to -10, is currently 1.5. This compares to last year’s score
of 1.1 – showing a positive evolution of +0.4.
A score of -17 on the better/worse index relating the situation now as it compares to
that from five years ago also shows a slight evolution of +1 point. Expectations for
the next twelve months are very slightly optimistic, with an EU27 level score of +1,
this representing a positive upward evolution of +4 from the last wave of analysis.
10 QB2.13 - How would you judge the current situation of… The financial situation of your household, QB3.14 - What are your expectations for the next twelve months; will the next twelve months be better, worse or the same, when it comes to…? The financial situation of your household, QB4.14 - Compared with five years ago, would you say things have improved, gotten worse or stayed about the same when it comes to…? The financial situation of your household.

SPECIAL EUROBAROMETER 370 “Social Climate”
30
Figure 10: QB2.13, QB3.14 and QB4.14 – Score cards (index table, showing evolutions)
The current situation index is measured on a scale from -10 to +10.
The better-worse indexes are measured on a scale from -100 to +100.

SPECIAL EUROBAROMETER 370 “Social Climate”
31
Opinion differs quite sharply either side of the average in various individual Member
States, with seven countries giving negative scores relating to the current financial
situation of the household. The familiar geographical grouping of the Nordic and
Benelux Member States, along with Austria and the UK, once again dominate the
upper end of the ranking. All three Nordic Member States fall in the top five of the
group, with Sweden coming first (scoring 5) followed by Denmark with a score of
4.7, Luxembourg with 4.6, the Netherlands with 4.2 and Finland with 4. Each of
these scores is comfortably in advance of the EU27 average.
Hungary returned the lowest score for this question, as it relates to the current
financial situation of the household, with -2.5. It was followed by Bulgaria with -2.3,
Romania and Greece – both with -2.1. There is then a slight progression upwards, as
the next lowest-scoring Member State was Lithuania with a score of -1. Portugal with
-0.9 and Latvia with -0.4 also gave negative scores here.
Evolution of results for the current situation is generally quite slight, with a couple of
outstanding example. For example, the situation in Italy is seen to have improved
drastically compared to the last wave of analysis – growing by +1.1 points to reach
1.5. An upward trend was also noticed in Romania (+0.7) as well as in Belgium and
Germany (both +0.6). Cyprus’s results evolved in the opposite direction, changing
by -0.9, as did those from Slovakia, by -0.7.
Analysis of the individual Member States’ scores evaluating the situation now
compared to that of five years ago shows that only respondents in seven
countries think that the financial situation of their household has improved. Sweden
(+34), Luxembourg (+19) and Finland (+15) gave the highest scores. Lowest scores
were recorded in Greece (-73), Hungary, Romania (both -55) and Portugal (-52).
Perception of the situation now compared to five years ago dropped sharply in a
number of Member States as well. Malta and Slovakia both recorded negative
evolutions of -12, Greece’s score changed by -11 and Poland’s by -10. This was
tempered by strong positive evolutions in Austria (+14), Estonia (+10), Germany
(+9) and Sweden (+8). Hungary (+5) and Lithuania (+7) both also saw positive
evolutions in their scores, and both were ranked low in relation to the current
situation.
Evaluation of the next twelve months is slightly more positive, with several
Member States which ranked near the bottom of the list relating to the current
situation recording tentatively positive scores. Estonia gave the highest score here
(+23) followed by Sweden (+21), Denmark (+18) and Luxembourg (+16). This
reinforces a trend towards optimism felt by respondents in Estonia in other
categories so far analysed. Greece recorded the lowest score (-58), followed by
Portugal (-36) and Hungary (-24), the lowest-scoring Member State in terms of the
current situation. Lithuania and Bulgaria, both near the bottom of the ranking

SPECIAL EUROBAROMETER 370 “Social Climate”
32
according to the current situation, gave slightly optimistic scores (+1 and +3
respectively).
The scores relating to optimism for the forthcoming twelve months were also subject
to some interesting evolutions. Levels of optimism have risen sharply in Romania
(+24), Lithuania (+21) and Bulgaria (+13) – all of which fall near the bottom of the
list when ranked by the current situation score. Sharp drops were observed in
Hungary (-25), Portugal (-15) and Slovakia (-13). Sweden, the top-scoring Member
State regarding the current situation, saw a negative evolution of
-3.
Figure 11: QB2.13, QB3.14 and QB4.14 – SD tables (index table, showing evolutions)
The current situation index is measured on a scale from -10 to +10.
The better-worse indexes are measured on a scale from -100 to +100.
SPECIAL EUROBAROMETER 370 “Social Climate”
33
When broken by socio-demographic categories, results show that men are more
likely to give a positive result regarding the current financial situation of their
household than women, returning a score of 1.7 compared to 1.3. Differences
relating to the age of the respondent are slight, although respondents aged 25-54
are slightly less happy with the situation than those older and younger than them –
giving a score of 1.3, below the EU27 average. The score increases according to the
level of education achieved by the respondent – we can compare 0.4 from those who
finished at age 15 or below with 2.8 from those who continued education until 20 or
older – and current students give an above-average score of 2.
Distinct differences are observed relating to the employment situation of the
respondent. Those in managerial roles give a high score of 3.8; in sharp contrast,
the unemployed give a score of -2.6. This is unsurprising; we can assume that a
similar trend would be noticed regardless of the main European economic situation.
It is interesting to note that the unemployed give the only negative score when the
results are broken down like this; house persons, who have previously followed with
quite negative scores, give a low, but positive score of 0.4. It is also understandable
that any respondents who report any kind of financial difficulty return a negative
score – with those who frequently do so giving a score of -3.9, and those who do
occasionally -0.4. This can be compared with a score of 3.1 from financially more
secure individuals.
Very few positive scores were given relating to the financial situation of the
household now as it compares to that from five years ago. Managers (+20) and
those who stayed in education the longest (+2) give the only positive answers.
Sharp declines in the quality of the situation are observed by respondents with
financial difficulties most of the time (-64), the unemployed (-52), those who
finished their education at the age of 15 or below (-37), those who have financial
problems from time to time (-36), the retired (-35) and those aged 55+ (-32).
Age and education play a part in determining optimism for the next twelve
months, with the 15-24 age group giving a positive score of +22, and current
students an answer of +19. The unemployed, too, see the situation as set to improve
somewhat, returning a score of +12.
The retired gave a negative score of -16, as did people who find themselves
frequently in financial difficulties. Optimism decreases as the respondent’s age
increases, with the 55+ age group giving a negative score of -14.
An evolution relating to the current financial situation of the household came from
those who face financial difficulties most of the time, as their score evolved by +0.7.
With regard to the occupation of the respondent, all of those who are in any kind of
work, house persons and the retired returned positive changes on the last wave of
analysis. Current students gave a score which evolved negatively by -0.1.

SPECIAL EUROBAROMETER 370 “Social Climate”
34
Evolution of the scores relating to the situation compared to five years ago were
slight, with the highest level of optimism observed among people from the 40-54
age-group, the unemployed and those who finished their education before the age of
20 (+5 for each of them). Expectations for the coming twelve months grew,
however, among the unemployed (an evolution of +13) and the self-employed (+8).
Figure 12: QB3.14 – Trend line
The trend line shows numerous cycles of pessimism against optimism, with the
deepest fell between September 2008, this date marking the beginning of the
economic crisis, and January-February 2009, when the lowest score in the last
sixteen years was recorded (-10). However, this set of results marks a definite step
towards progress, following a decline in quality between Spring 2007 and January-
February 2009, there is now a positive overall score of 1 marked in terms of
expectations for the next twelve months. However slight it is, this still represents a
rise from -3, in Spring 2010. Again, the slight dip in expectations noted in the last
survey has been redressed.

SPECIAL EUROBAROMETER 370 “Social Climate”
35
CONCLUSIONS
We can see that the results of the analysis of Europeans’ views regarding the current
situation appear to depend on which Member State they inhabit. Geographical
patterns indicating feelings of prosperity and security are noticed, clustering around
Northern and Western Member States, as we have seen previously. Additionally,
those Member States which gave low responses last year continue to do so this year.
Most of the Member States recorded positive scores for the current situation. The
highest level of satisfaction can be observed for the residential area, where all the
countries gave positive scores. It is encouraging to note that despite feelings of
negativity in certain parts of Europe, overall, optimism about personal situation is on
the increase since the previous survey.
Regarding the current situation, strong scores were noticed particularly in the
Nordic Member States, Benelux, and often in the UK, Ireland, Austria and Germany.
Some strong positive evolutions can be noted in Italy, placing it near the middle of
the table in most instances.
At the bottom of the list regarding the satisfaction with the current situation are
Greece, Eastern and Baltic countries, Hungary and Portugal. Italy was also among
the countries where respondents were less satisfied with their residential area.
The evolutions relating to the current situation as compared to five years ago
are, in many cases, edging upwards when compared to the last wave of analysis,
with Malta, Estonia and Germany often recording strong evolutions. The same can be
said about the expectations for the next twelve months. with Romania,
Lithuania, and Bulgaria, often reporting high level of optimism regarding the near
future, although their scores for the current situation place them low on the table.
With regard to socio-demographic data, clear patterns are beginning to emerge
relating to the financial situation and level of education of the respondents. The
longer people remain in education, the more positive (or less negative) they tend to
be. Additionally, the fewer problems that people tend to have in relation to their
personal finances, the more positive they are in general about their personal
situation.
The previous wave of analysis showed a halting of progress and a reversal
towards the negative. This year, the move has been redressed and ground gained in
a general move towards positivity and optimism – as indicated in the trend lines.
From this, we can surmise that EU citizens either feel as if the major problems are
being addressed, or that they themselves are dealing with the economic situation
better. There are, of course, individual Member States where the mood remains
gloomy, but the overall picture is starting to improve once more.

SPECIAL EUROBAROMETER 370 “Social Climate”
36
2. GENERAL SITUATION IN THE COUNTRY
We now turn away from respondents’ personal situation to analyse the general
situation. For this analysis, six banks of questions were asked – relating to the
current situation, the situation as compared to that of five years ago and the
projected situation over the next twelve months. The questions cover the following
topics: economic situation, employment situation, the cost of living, affordability of
energy, affordability of housing and the way in which public administration is run.
2.1 Economic situation (QB2_11; QB3_12; QB4_1211)
The first question relates to respondents’ perception of the general economic
situation in their country. For the current situation, the response is negative –
with a score of -2.9 recorded for the EU27 average. A score of -56 is recorded on the
better/worse scale for the situation now compared to that of five years ago, and a
score of -16 is returned relating to expectations for the coming 12 months. The
number of “the same” answers is comparatively low for the index relating to the
situation now compared to that of five years ago (17%), although it is higher for the
situation as to how it will shape up over the next twelve months (40%). This could
indicate a certain degree of uncertainty among the European population regarding
the direction that the economic situation is going to take.
Despite the negative scores, a positive evolution has been noted relating to
each of the situations outlined. The score for the current situation has increased
by +0.7 compared to the previous wave of analysis, in May 2010. Results relating to
the situation now compared to that of five years ago have improved by +13, and the
score regarding expectations for the next year has increased by +3.
11 QB2.11 How would you judge the current situation of... The economic situation in (our country), QB3.12 What are your expectations for the next twelve months; will the next twelve months be better, worse or the same, when it comes to…? The economic situation in (our country), QB4.12 Compared with five years ago, would you say things have improved, gotten worse or stayed about the same when it comes to…? The economic situation in (our country).
SPECIAL EUROBAROMETER 370 “Social Climate”
37
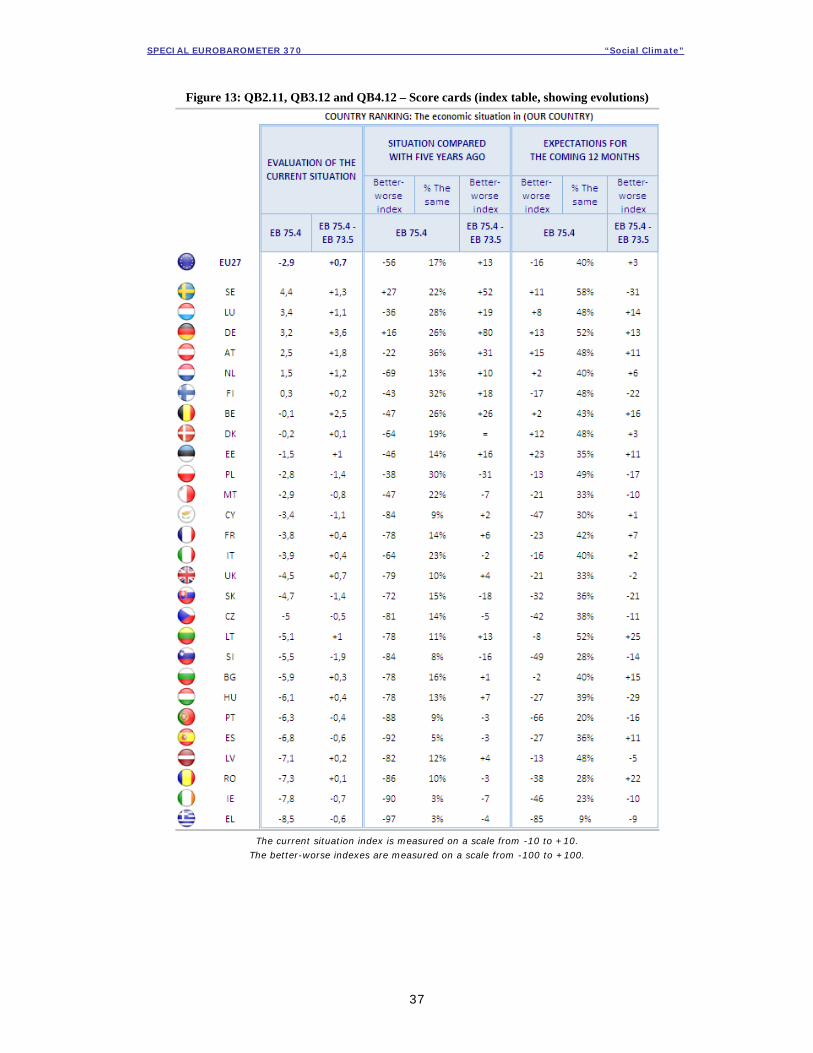
Figure 13: QB2.11, QB3.12 and QB4.12 – Score cards (index table, showing evolutions)
The current situation index is measured on a scale from -10 to +10.
The better-worse indexes are measured on a scale from -100 to +100.

SPECIAL EUROBAROMETER 370 “Social Climate”
38
We see a vast difference in scores from individual Member States. For the current
economic situation in the country, respondents in Sweden gave the highest score
(4.4), followed by Luxembourg (3.4), Germany (3.2), Austria (2.5), the Netherlands
(1.5), and Finland (0.3). These Member States are the only ones which returned
positive scores on this index. The lowest score was given by Greece, with -8.5. This
was followed by Ireland (-7.8), Romania (-7.3), Latvia (-7.1), Spain (-6.8), Portugal
(-6.3) and Hungary (-6.1). Four of these – Portugal, Ireland, Greece and Spain –
were hit particularly strongly by the financial crisis.
Positive and negative evolutions are observed near the top and the bottom of this
ranking respectively. The top five-scoring Member States from the current situation
reported an increase of more than +1 point each, the highest positive evolution
being in Germany, where the score increased by +3.6. An increase of +2.5 was
noted in Belgium and +1.8 in Austria. Sweden’s score evolved by +1.3, that of the
Netherlands’ by +1.2, and that of Luxembourg by +1.1. Strongest positive
evolutions are seen in countries which are amongst the wealthier EU Member States.
The largest downward evolution came from Slovenia (-1.9) followed by Poland and
Slovakia (both -1.4) and Cyprus (-1.1). Greece and Ireland both recorded negative
evolutions (-0.6 and -0.7 respectively) but Romania and Latvia, also near the bottom
of the ranking, both showed improvement on last year’s results – with evolutions of
+0.1 and +0.2 respectively. Lithuania, which returned a score of -5.1, saw a high
positive evolution of +1.
Two Member States gave positive scores on the better/worse index for the
economic situation in the country now as compared to that of five years
ago: Sweden, which returned a score of +27, and Germany of +16. The second-
highest scoring Member State in terms of the current situation, Luxembourg, returns
a negative score of -36, as do the fourth and fifth-scoring nations: Austria with -22
and the Netherlands with -69. Overall, the results here are very negative. The lowest-scoring Member State is Greece with -97 – meaning that almost all
respondents give negative answers –, followed by Spain with -92, Ireland with -90,
Portugal with -88 and Romania with -86.
Despite this, there are some very strong positive evolutions since the last wave of
analysis. Germany’s positive score of +16 represents a very strong evolution of +80
since the last survey, in May 2010. Sweden’s score increased by +52, Austria’s by
+31 and Belgium’s by +26. Lithuania, which recorded a very low score of -78 on the
better/worse index, also reported a positive evolution of +13. Strong negative
evolutions were noticed in Poland (-31), Slovakia (-18) and Slovenia (-16).

SPECIAL EUROBAROMETER 370 “Social Climate”
39
Regarding the economic situation of the country as it is expected to develop
over the next twelve months, Estonia is the most optimistic Member State, with a
score of +23. This is followed by +15 in Austria, +13 in Germany, +12 in Denmark,
and +11 in Sweden. Very negative scores were recorded in Greece (-85), in Portugal
(-66) and in Slovenia (-49). Overall, again, the majority of Member States returned
a negative response on the better/worse index.
However, there are also some positive evolutions on this index, with the highest
being seen in Lithuania (+25) and Romania (+22), both of which gave low scores of
-8 and -38 on the better-worse index. Some high-scoring Member States also
reported a degree of improvement: Germany, for example, gave a positive score of
+13 which also marked an evolution of +13 points from last year’s result. The
largest downward evolution was Sweden – with -31 compared to last year’s survey –
followed by Hungary with -29 and Finland with -22. It is interesting to note here that
countries like Sweden and Finland, which are usually placed at the top of the list
when describing the current situation, are now among the countries that are
generally pessimistic regarding the perspectives of the near future, like Hungary,
which recorded among the lowest scores for all the topics analysed so far in this
report.

SPECIAL EUROBAROMETER 370 “Social Climate”
40
Figure 14: QB2.11, QB3.12 and QB4.12 – SD tables (index table, showing evolutions)
The current situation index is measured on a scale from -10 to +10.
The better-worse indexes are measured on a scale from -100 to +100.
Regarding the socio-demographic statistics, women are more pessimistic than men
about the current economic situation in their country – with a score of -3.1
compared to -2.6. There is no definite pattern relating to the age of respondents,
with the 25-39 age group most negative (-3.3) and the oldest respondents least
negative (-2.6). However, the results relating to level of education improve
depending on the age at which the respondent stopped studying. Those who finished
their education at the age of 15 or below give a score of -3.7. The score is -3.2 for
those who finished between the ages of 16 and 19, and -1.8 for those who finished
at age 20 or over. Those still studying gave a score of -2.2.

SPECIAL EUROBAROMETER 370 “Social Climate”
41
Regarding occupation, managers and students are the least negative, with scores of
-1.1 and -2.2 respectively. The unemployed (-4.9) and house persons (-4.2) are the
most negative, followed by the self-employed (-3.5). The level of satisfaction also
changes considerably relating to individual financial situation, with those who report
having frequent financial difficulties giving a score of -5.5 compared to -1.9 from
those who are secure financially. Despite these variations, all categories record a
negative score on the current situation.
Despite these low scores, every single category reports a positive evolution from the
last wave of analysis. Some of the strongest of these come from older respondents
with an increase of +1 point. Managers and white-collar workers increased their
score by +1.4 and +1.2 respectively. Those who report having very few problems
paying the bills recorded a positive evolution of +0.9, although it is also interesting
to note that respondents who have financial difficulties also increased their score by
+0.5.
Those who are most pessimistic about the economic situation in their country now
compared to that of five years ago are respondents who have problems paying
their bills most of the time – giving a score of -76. Unemployed people give a score
of -70, and the respondents who reported having occasional financial difficulties gave
a score of -69. The self-employed also gave a considerably negative score of -65.
Managers, students and the financially more secure are the least negative – with
scores of -44, -45 and -48 respectively. Level of education had a direct effect on the
scores here, with those who finished studying earlier returning higher minus scores.
Again, these scores have all evolved positively since the last survey in May
2010. The strongest evolutions came from managers (+25) and those who say that
they rarely have problems paying their bills (+18). The smallest positive evolutions
came from the self-employed (+3) and respondents who experience financial
difficulties (+6 for “sometimes” and +7 for “often”).
Relating to the expectations for the next 12 months regarding the national
economic situation, the only positive score on the table comes from students, with
a result of +1. Apart from this, there are only negative scores across the board. The
situation is seen as less negative by younger respondents – the 15-24 age group
give a score of -4, followed by the 25-39 group (-13), the 40-54 group (-19) and the
55+ (-21).
The scores also become less negative as respondents’ level of education increases,
with those who finished at 15 or younger giving a score of -26, those who finished
between the ages of 16-19 giving -18, those who finished at 20 or older giving -10,
and the aforementioned result of +1 for current students. Respondents’ difficulties
paying bills also have an impact – those who experience this frequently gave a score

SPECIAL EUROBAROMETER 370 “Social Climate”
42
of -38, those who do sometimes gave a score of -25, and those who never do gave a
score of -9.
Negative evolutions relating to expectations for the next 12 months were seen from
students (-2), house persons and the 15-24 age group (-1). Unemployed
respondents and managers gave the highest evolution in terms of response, with +8
and +5 respectively.
Once more, although the picture is negative (but improving), it is interesting to
compare these results with the results for respondents’ personal financial situations,
which are – on average – less pessimistic. It seems as if there is a clear distinction
made between respondents’ individual situations and the general (national) situation.
Figure 15: QB3.12 – Trend line
Overall low expectations for the next twelve months are nonetheless improving in
this wave of analysis, with a move from -19 to -16. Even if these scores are
negative, an improvement is observed in perceptions about the next twelve months
since January-February 2009, when the lowest score was recorded (-38) – although
here we do not see such a strong improvement as to take it close to levels
experienced prior to the onset of the financial crisis. We see the reduction in levels of
pessimism beginning to slow somewhat, with less of a gap between this positive
evolution and that noticed in the last report (+3 compared to +7). Still, it is a move
in the right direction.

SPECIAL EUROBAROMETER 370 “Social Climate”
43
2.2 Employment situation (QB2_14; QB3_15; QB4_1512)
Since the previous survey, conducted in May 2010, unemployment in the EU fell from 9.7% in April 2010 to 9.4% in April 201113. Despite this improvement, the current
employment situation is viewed very negatively by European citizens. The EU27
average for the current situation is -3.5. Comparing the situation now to that of five
years ago gives a score of -52 on the better/worse index, and expectations are low
for the next twelve months as well – with a score of -12.
Although these results are uniformly negative, they also show improvement from the
previous survey, in May 2010. The score relating to the current situation has
improved by +0.5 compared to last year’s result, with an evolution of +16 for the
result for the situation now as compared to that of five years ago, and +9 for the
score for expectations for the next twelve months.
12 QB2.14 How would you judge the current situation of... The employment situation in (our country), QB3.15 What are your expectations for the next twelve months; will the next twelve months be better, worse or the same, when it comes to…? The employment situation in (our country), QB4.15 Compared with five years ago, would you say things have improved, gotten worse or stayed about the same when it comes to…? The employment situation in (our country) 13 http://epp.eurostat.ec.europa.eu/cache/ITY_PUBLIC/3-31052011-BP/EN/3-31052011-BP-EN.PDF
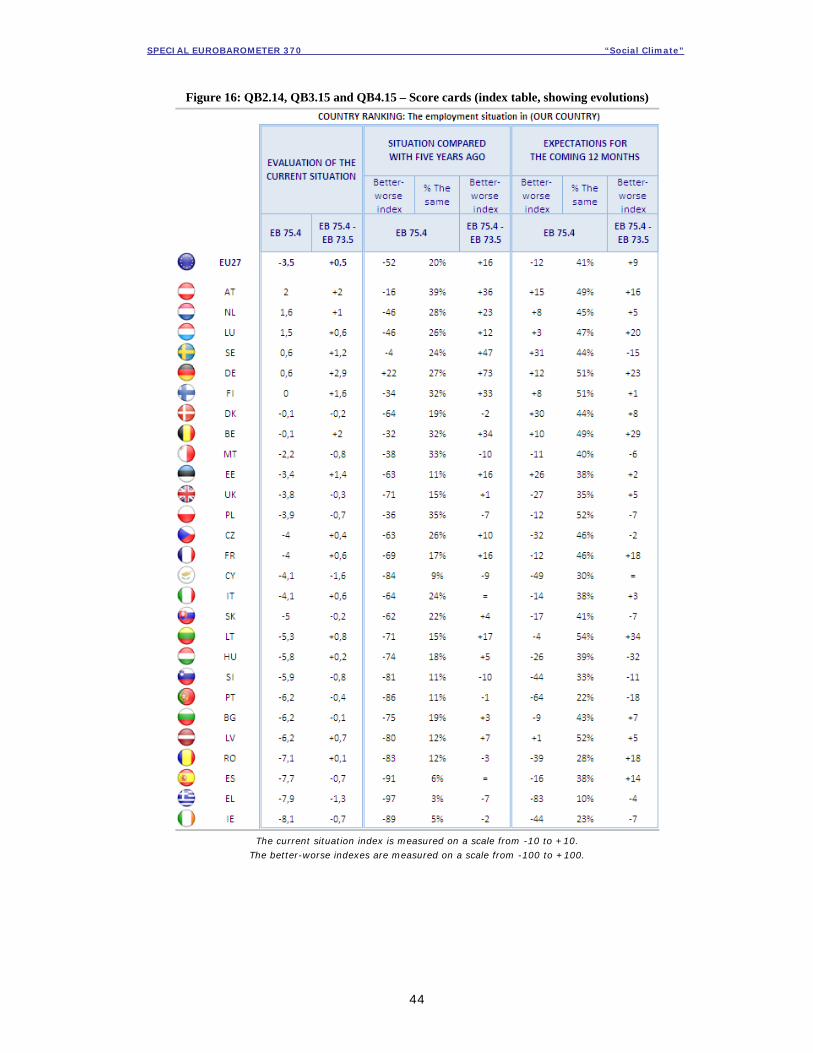
SPECIAL EUROBAROMETER 370 “Social Climate”
44
Figure 16: QB2.14, QB3.15 and QB4.15 – Score cards (index table, showing evolutions)
The current situation index is measured on a scale from -10 to +10.
The better-worse indexes are measured on a scale from -100 to +100.

SPECIAL EUROBAROMETER 370 “Social Climate”
45
On an individual Member State basis, there is again a very sharp variation in the
results returned. Relating to the current employment situation in the country,
Austria’s score of 2 is the highest in the ranking – followed by the Netherlands on
1.6, Luxembourg on 1.5, then Sweden and Germany on 0.6. These Member States
are the only ones to have returned a positive score in this instance. Finland, with a
score of 0, and Denmark and Belgium with -0.1 are also near the top end of the
ranking, reinforcing the geographical pattern noticed in most other questions
analysed in the survey so far.
The lowest-scoring Member State is Ireland, with a score of -8.1. It is followed by
Greece with -7.9, Spain with -7.7, Romania with -7.1, and Latvia, Bulgaria and
Portugal with -6.2 each. Again, these Member States report general feelings of
dissatisfaction with the social and economic situation as in other questions asked –
and again, the distinctly negative results relating to this general question reinforce
the view that respondents tend to judge more harshly the national situation than
their own personal situations.
Some Member States show a very strong positive evolution when these results are
compared with those from the last wave of analysis. Germany’s score has increased
by +2.9 from last year’s survey. Other positive evolutions were found in Austria,
Belgium (both +2), Finland (+1.6), Estonia (+1.4) and Sweden (+1.2). The
strongest negative evolutions were found in Cyprus (-1.6) and Greece (-1.3).
Romania and Latvia, which both returned low scores overall, saw positive evolutions
of +0.1 and +0.7 respectively.
One Member State – Germany – returned a positive score on the better/worse index
for the national employment situation now as compared to that of five years
ago, with a result of +22. Everywhere else in the EU, the scores for this dimension
were negative. Sweden’s score of -4 was the least pessimistic of these, followed by
Austria’s of -16, but there were only a few Member States which returned answers
higher than -50. Greece (-97), Spain (-91), Ireland (-89) and Portugal (-86) are the
lowest-scoring Member States on this list.
Despite this, 16 Member States saw a positive evolution from the previous wave of
analysis, when comparing the situation now with that of five years ago. There were
some very positive evolutions – for example, Germany’s score was reached by an
evolution of +73 from the last survey’s result. Sweden’s score grew by +47,
Austria’s by +36, Belgium’s by +34 and Finland’s by +33. There were a few steep
negative evolutions, with Slovenia and Malta (both -10), Cyprus (-9), Poland and
Greece (-7) being the most noteworthy of these.

SPECIAL EUROBAROMETER 370 “Social Climate”
46
Levels of optimism for the next twelve months regarding the national employment
situation also vary sharply between Member States. Positive scores are recorded in
Sweden (+31), Denmark (+30) and Estonia (+26) among others, but the majority of
Member States give negative scores for this dimension. The lowest scores are
recorded in Greece (-83), Portugal (-64) and Cyprus (-49). Here, the positive scores
tend to cluster around the top end of the table as ranked by the current situation,
although a slight glimmer of optimism is noticed in Latvia (+1) which falls closer to
the lower end for the current situation.
Strong positive evolutions regarding the expectations for the short-term future were
noticed in Lithuania (+34), Belgium (+29), Germany (+23) and Luxembourg (+20).
Spain and Romania, which are third and fourth from the bottom end of the table as
ranked by the current situation, and both of which return quite negative scores in
relation to their twelve-month expectations, both saw positive evolutions (+14 and
+18 respectively). The largest negative evolutions were found in Hungary (-32),
Portugal (-18) and Sweden (-15).

SPECIAL EUROBAROMETER 370 “Social Climate”
47
Figure 17: QB2.14, QB3.15 and QB4.15 – SD tables (index table, showing evolutions)
The current situation index is measured on a scale from -10 to +10.
The better-worse indexes are measured on a scale from -100 to +100.
Since the topic of employment is very closely linked to personal financial situation, it
is not surprising that we see a continuation of patterns previously observed by
means of the socio-demographic analysis of groupings of respondents. Women
are, again, more pessimistic about the current employment situation in their
country than men are – with -3.7 compared to -3.2. The education level of
respondents also plays a part in affecting responses – with more negative results
from those who finished their schooling earlier. Those who finished at age 15 or
younger gave a score of -4.3, compared to -3.6 from those who finished between the
ages of 16 and 19, and -2.6 from those who continued to 20 and older.

SPECIAL EUROBAROMETER 370 “Social Climate”
48
The main differences come from analysis of the employment situation of
respondents. The unemployed returned the very lowest score relating to the current
situation – with -6 – followed by house persons on -4.8, the self-employed with -3.7
and the retired with -3.5. Managers, white collar workers and students are less
negative, with scores of -2, -2.7 and -2.9 respectively. There is variation relating to
the respondent’s financial situation as well – with those reporting difficulties giving a
score of -5.9, and those who report few problems a result of -2.6.
These figures have evolved positively from the last wave of analysis in almost all
instances, with the exception of the score from the self-employed, which remains the
same. The largest increase comes from white-collar workers (+0.9) followed by the
retired (+0.8). Respondents in financial difficulties saw their score increase by +0.5.
The national employment situation now compared to that of five years ago
seems to be viewed more negatively by respondents as they get older – with a score
of -43 for the youngest group and a score below -50 for the other 3 age groups.
Education has an impact on the responses, with the scores improving according to
how long the respondent studied for. Those who finished their education at age 15 or
under gave a score of -58, compared to -50 from those who finished at age 20 or
over and -40 from those still studying. And the sharpest differences were observed in
the occupation category – with managers giving a score of -37 and the unemployed
a score of -69 – and the financial situation of respondents, with those who have
difficulty paying their bills returning a score of -74 compared with -42 among those
who rarely do.
Negative as these scores may be, they have all improved considerably since the
last wave of analysis, with the biggest increases coming from managers (+28),
those who report almost never having problems paying their bills (+22), and the
over 55s (+19).
Students and the youngest respondents are the only groups to report a positive
score on the better/worse situation for the forthcoming year (both +3), with the
biggest negative responses coming from those who report financial difficulties (-30
for “most of the time”, -22 for “from time to time), those who finished their
education at age 15 or under (-23) and house persons (-20). However, all of these
scores have improved from the previous wave of analysis – particularly from the
unemployed and retired, with +16 and +12 respectively. The evolution was nearly
the same for those who report infrequent financial difficulties (+9) and those who
frequently find themselves unable to pay their bills (+8).
It is interesting to note that the socio-demographic categories all show positive
evolutions, compared to the Member State analysis which shows decreases in several
individual countries. This seems to confirm that – despite the difficult situations
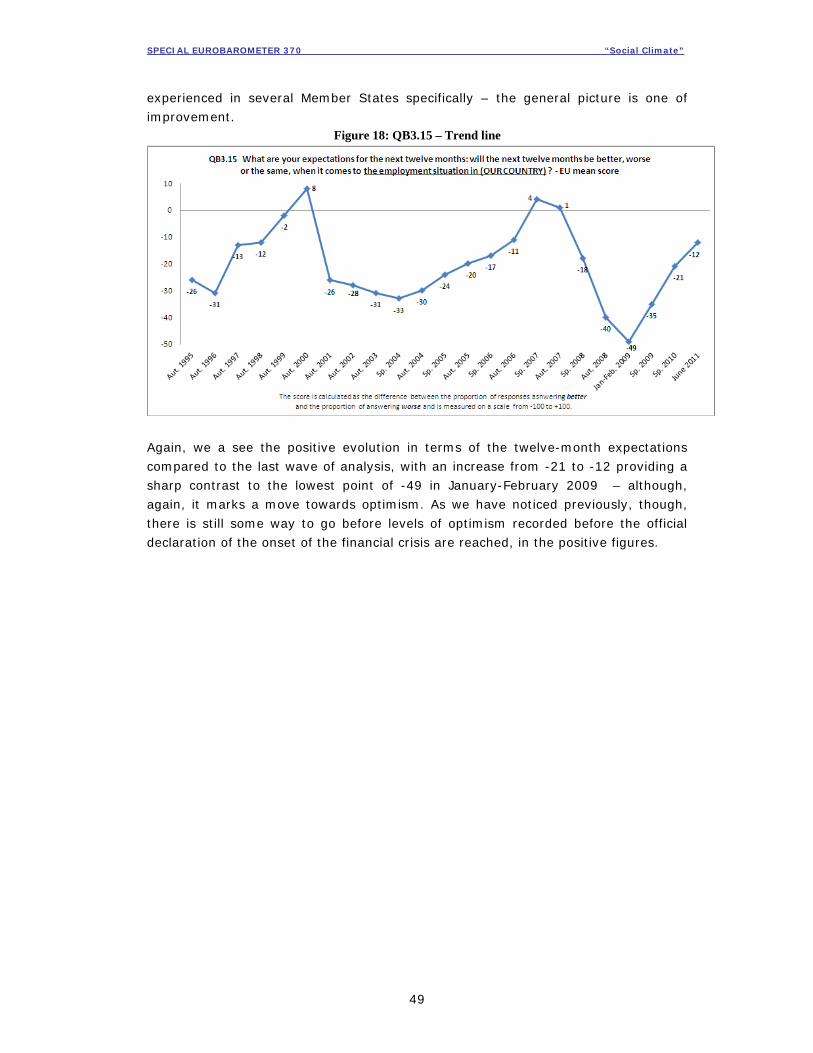
SPECIAL EUROBAROMETER 370 “Social Climate”
49
experienced in several Member States specifically – the general picture is one of
improvement. Figure 18: QB3.15 – Trend line
Again, we a see the positive evolution in terms of the twelve-month expectations
compared to the last wave of analysis, with an increase from -21 to -12 providing a
sharp contrast to the lowest point of -49 in January-February 2009 – although,
again, it marks a move towards optimism. As we have noticed previously, though,
there is still some way to go before levels of optimism recorded before the official
declaration of the onset of the financial crisis are reached, in the positive figures.

SPECIAL EUROBAROMETER 370 “Social Climate”
50
2.3 Cost of living (QB2_5; QB3_6; QB4_614)
We now analyse the cost of living across the EU. Here the scores are once again
distinctly negative. However, in contrast with previous questions, the evolution of the
scores compared to the last wave of analysis are also negative, indicating a
considerable worsening of the situation.
The overall score for the current situation at EU level is -3.4, with an average of -77
on the better/worse index for the situation now as compared to that of five years
ago, and -50 for the expectations for the coming twelve months.
However, while in the last survey increases in two of the three categories (current
situation and situation compared to that of five years ago) were noticed, here we see
negative evolutions across all three. The current situation score has changed by -0.7,
the five-year comparison by -8, and the twelve-month expectations by -3. Although
these changes are slight they provide opposition to the mainly positive evolutions
observed elsewhere. It is important to note that while other topic described before in
this report indicate that recovery is starting in the EU, individuals’ concerns about
the cost of living has not yet abated – and the situation is seen as worsening.
14 QB2.5 How would you judge the current situation of... The cost of living in (our country), QB3.6 What are your expectations for the next twelve months; will the next twelve months be better, worse or the same, when it comes to…? The cost of living in (our country), QB4.6 Compared with five years ago, would you say things have improved, gotten worse or stayed about the same when it comes to…? The cost of living in (our country)

SPECIAL EUROBAROMETER 370 “Social Climate”
51
Figure 19: QB2.5, QB3.6 and QB4.6 – Score cards (index tables, showing evolutions)
The current situation index is measured on a scale from -10 to +10.
The better-worse indexes are measured on a scale from -100 to +100.

SPECIAL EUROBAROMETER 370 “Social Climate”
52
The four Member States which record positive scores relating to the cost of living
current situation do so in a quite conservative manner – with the highest result
coming from Sweden with 1.6, followed by the Netherlands with 1.2, Austria with 1,
and Denmark with 0.4. From here, all of the scores from the other Member States
are into the negative side of the scale. A similar geographical grouping is noticed
once more near the top end of the ranking – with Benelux, the UK and the Nordic
Member States all appearing there, although not all returning positive scores. The
ratings fall sharply as we move down the rankings – with the lowest-scoring Member
States being Latvia (-7.3), Romania (-7), and Greece (-6.7). Twelve Member States
return scores of -5 or less.
Only two Member States did not return negative evolutions here. Italy recorded a
positive evolution of +0.6, and the Netherlands remained the same. Some evolutions
were only slightly negative – Hungary’s change of -0.2, for example – while others
were more severe. The largest negative evolutions were noted in Estonia, Latvia
(both -2.2), Spain and Slovakia (both -1.8). The top-scoring Member States for the
current situation all recorded negative evolutions, with the exception of the
aforementioned example of the Netherlands.
Every Member State recorded a negative score in relation to the cost of living
situation now compared to that of five years ago. These scores cover a broad
range. The least negative Member States were Sweden (-37), Austria and Denmark
both showing quite a large downward movement to -55. From this point down the
ranking, all Member States move deeper into the negative numbers. The lowest-
scoring Member States in this situation are Greece with -96, Latvia and Portugal with
-89, and Malta, France and Slovenia with -88.
Lithuania and Italy both recorded positive evolutions here – of +15 and +1
respectively – but the remaining Member States showed downward evolutions of
varying severity. The largest of these were in Slovakia (-25), Latvia and Denmark
(-15). The smallest negative evolutions were found in Belgium and Hungary, both
with -1.
Optimism for the next twelve months is also low, with no Member States recording
a positive score in this category. Greece gave the lowest score – with -83 – followed
by the Czech Republic (-75) and Portugal (-72). Lithuania (-13) and Italy (-25) are
the least negative of all of the Member States.
Here, some individual positive evolutions can be noted. The highest of these was
noticed in Lithuania, with +35, followed by Romania with +19. However, both of
these Member States still report low overall scores in this wave of analysis. The
largest negative evolutions were noticed in Hungary (-36), Finland (-26), Slovakia
(-25) and Sweden (-21). These strong evolutions are notable for the fact that they
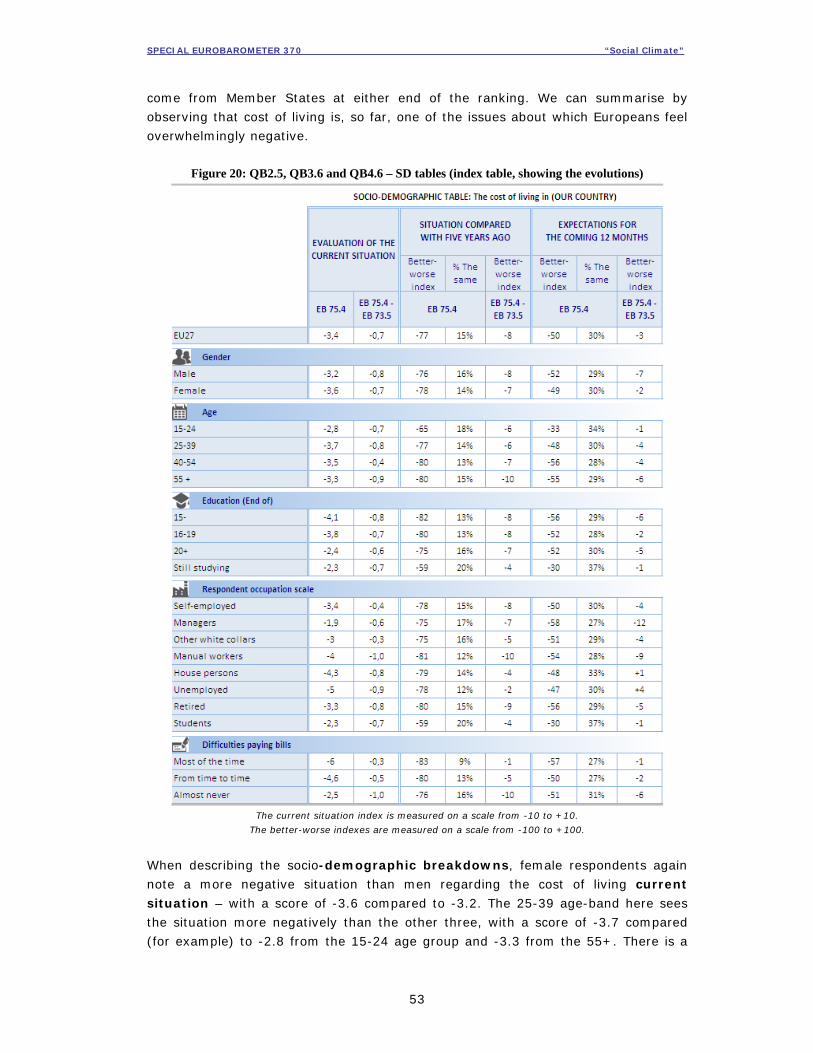
SPECIAL EUROBAROMETER 370 “Social Climate”
53
come from Member States at either end of the ranking. We can summarise by
observing that cost of living is, so far, one of the issues about which Europeans feel
overwhelmingly negative.
Figure 20: QB2.5, QB3.6 and QB4.6 – SD tables (index table, showing the evolutions)
The current situation index is measured on a scale from -10 to +10.
The better-worse indexes are measured on a scale from -100 to +100.
When describing the socio-demographic breakdowns, female respondents again
note a more negative situation than men regarding the cost of living current
situation – with a score of -3.6 compared to -3.2. The 25-39 age-band here sees
the situation more negatively than the other three, with a score of -3.7 compared
(for example) to -2.8 from the 15-24 age group and -3.3 from the 55+. There is a
SPECIAL EUROBAROMETER 370 “Social Climate”
54
pattern noticed relating to respondents’ level of education. Those who finished their
schooling earliest, at age 15 or younger, gave a score of -4.1, while those who
finished between ages 16-19 returned a score of -3.8; those who finished at age 20
or older gave a score of -2.4, and current students gave a score of -2.3.
The unemployed, house persons and manual workers all gave low scores – with -5,
-4.3 and -4 respectively. This can be compared to the results from managers and
other white collar workers, with -1.9 and -3. And, perhaps, as we might expect,
respondents’ financial situation has a direct impact – with those who have trouble
paying their bills giving a very low score of -6, compared to -2.5 from those who do
not.
These scores have evolved negatively compared to the previous wave of analysis.
The strongest negative evolutions can be found coming from manual workers and
those who almost never have financial difficulties (both -1), followed by the
unemployed and respondents aged 55+ (both -0.9). Retired, house persons, those
who finished studying at the age of 15 or under, respondents aged 25-39 and male
recorded all a decrease of -0.8 point.
Regarding the cost of living situation compared to that of five years ago, the
responses are almost uniformly negative – with students giving the least negative
score of -59. Pessimism regarding the current situation compared to that of five
years ago seems to increase with respondents’ age, with the 15-24 age group giving
a response of -65 compared to -77 from the 25-39 age group and -80 from
respondents aged 40 and over.
In terms of evolution, the biggest decreases can be found in responses from the
over-55s, manual workers and respondents who almost never experience financial
problems – with their scores all changing by -10.
Levels of optimism for the next twelve months are also low, with students once
again recording the least negative score of -30. Interestingly, there is little difference
in the scores of managers vs. the retired, or relating to the financial situation of
respondents. While house persons and the unemployed recorded positive evolutions
(of +1 and +4 respectively), the strongest negative evolution came from managers
(-12). Those who report frequent financial difficulties show a slightly less negative
evolution (-1) than those who almost never have problems paying the bills (-6). This
would indicate that wealthier citizens are more negative in terms of short-term
optimism overall.

SPECIAL EUROBAROMETER 370 “Social Climate”
55
2.4 Affordability of energy (QB2_8; QB3_9; QB4_915)
When asked to consider one specific aspect of the cost of living, the affordability of
energy in their countries, respondents are slightly less negative than they are
about the general cost of living.
Regarding the current situation, the EU27 average for this question is -2.6.
Relating to the situation now compared to that of five years ago, the score is -65 on
the better/worse index. Expectations for the next twelve months show a score of -44
on the better/worse index.
Each of these scores shows a negative evolution from the last wave of analysis. The
score for the current situation changed by -0.6 – in contrast to the last survey of
May 2010, which showed an increase of +0.2 on the figure before (from the first
wave of analysis conducted in May 2009). The figure for the situation compared to
that of five years ago shows a -9 change, and the figure for expectations for the next
twelve months shows a -7 evolution.
15 QB2.8 How would you judge the current situation of... How affordable energy is in (our country), QB3.9 What are your expectations for the next twelve months; will the next twelve months be better, worse or the same, when it comes to…? How affordable energy is in (our country), QB4.9 Compared with five years ago, would you say things have improved, gotten worse or stayed about the same when it comes to…? How affordable energy is in (our country)
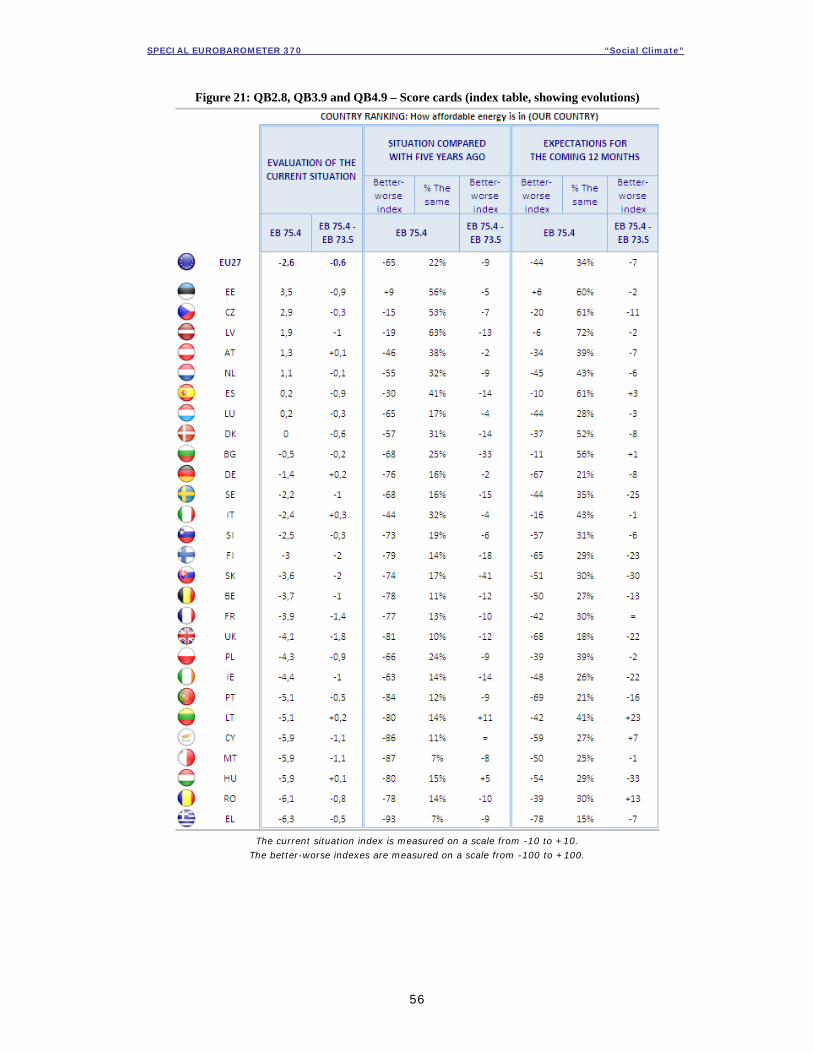
SPECIAL EUROBAROMETER 370 “Social Climate”
56
Figure 21: QB2.8, QB3.9 and QB4.9 – Score cards (index table, showing evolutions)
The current situation index is measured on a scale from -10 to +10.
The better-worse indexes are measured on a scale from -100 to +100.

SPECIAL EUROBAROMETER 370 “Social Climate”
57
When describing country by country results for the current affordability of energy
situation, we see more Member States returning positive scores than for other
aspects of the general social climate such as finance and employment – seven giving
scores of more than 0. As in the last report, Estonia is at the head of the ranking,
with a score of 3.5; it is followed by the Czech Republic with 2.9, Latvia with 1.9,
Austria with 1.3, the Netherlands with 1.1, Spain and Luxembourg with 0.2 each.
Denmark returns a score of 0, and the remaining Member States give a negative
response – most prominently Greece (-6.3), Romania (-6.1), Hungary, Malta and
Cyprus (-5.9 each). The geographical patterns that we have observed in previous
answers to other questions – where the highest scores are given by Nordic and
Benelux Member States – does not exist here, although these results reflect those
from the last wave of analysis.
Although the rankings remain similar, the scores themselves have fallen – with many
Member States returning negative evolutions. There are some slight positive
evolutions – Italy with +0.3, Lithuania and Germany with +0.2, Austria and Hungary
with +0.1. The figures have fallen most in Finland and Slovakia, with a -2 evolution
observed in each. These are followed by the UK with an evolution of -1.8. Ten
Member States report a negative evolution of one full point or more.
Relating to the affordability of energy situation now as compared to that of five
years ago, only one Member State reports a positive score – Estonia, at the top of
the “current situation” ranking, with a score of +9. The least negative figures come
from the Czech Republic (-15, second in the “current situation” ranking) and Latvia
(-19, third in the “current situation” ranking). Negative results for this category are
uniformly high elsewhere, with the most negative responses coming from Greece (-
93), Malta (-87) and Cyprus (-86).
Since the previous wave, these figures have fallen in all but three Member States.
Lithuania’s score improved by +11, and Hungary’s by +5, while Cyprus’s remained
the same. The strongest negative evolution by far was noted in Slovakia (-41)
followed by Bulgaria (-33). Elsewhere, while some negative evolutions are relatively
slight, others are generally very negative – showing a slight worsening of the
perceived situation.
Estonia was also the only Member State to return an optimistic response for the
situation as it is set to develop over the next twelve months, with +6 on the
better/worse index. The least negative results were obtained in Latvia (-6) and Spain
(-10). The most pessimistic outlook can be found in Greece (-78), followed by
Portugal (-69), the UK (-68) and Germany (-67).
Positive evolutions can be observed in Lithuania (+23), followed by Romania (+13)
and Cyprus (+7). The majority of the other results evolved negatively, most notably
in Hungary (-33), Slovakia (-30) and Sweden (-25).

SPECIAL EUROBAROMETER 370 “Social Climate”
58
Figure 22: QB2.8, QB3.9 and QB4.9 – SD tables (index tables, showing evolutions)
The current situation index is measured on a scale from -10 to +10.
The better-worse indexes are measured on a scale from -100 to +100.
Socio-demographically, for the affordability of energy current situation, gender
plays a part in shaping these results, with female respondents more negative than
male, -2.8 compared to -2.4. The situation is perceived less negatively according to
the level of education, with those who finished at 15 or before gave a score of -3.2,
compared to -2.9 from those who finished at age 16-19, -2.1 from those who
finished at age 20 or older, and -1.3 from those still studying.

SPECIAL EUROBAROMETER 370 “Social Climate”
59
Another pattern is observed regarding the financial situation of the respondent – with
those who report frequent financial difficulty giving a score of -4.4, the lowest of all
of the demographic categories, those who have occasional problems giving a score of
-3.3, and those who almost never have problems paying their bills giving a score of
-2.1.
The most severe negative evolution relating to the affordability of energy current
situation comes from unemployed respondents, whose score of -3.3 marks a
negative evolution of one point from the last survey. The situation is seen as
worsening more by those who have infrequent difficulties paying their bills compared
to those who frequently experience this – with evolutions of -0.8 and -0.4
respectively.
With regards to the situation now as it compares to that of five years ago,
variations can be observed relating to age, level of education, and financial situation
of the respondents. Younger people are less pessimistic –a score of -49 from the 15-
24 age group increases to -69 from the 55+ group. The respondents who finished
their education at 15 or younger give a score of -69, compared to -67 from those
who finished between 16-19, -65 from those who finished at age 20 or over, and -44
from current students. And those who report frequent financial difficulties give a
score of -74, compared to -68 from those who have occasional difficulties and -64
from those who almost never do. The most negative response within the occupation
group comes from the retired, with -72. Despite these variations, the situation is
seen to have worsened compared to that of five years ago in all categories, which all
have negative indexes.
There are no severe negative evolutions in these figures, although it is interesting to
note that two of the steepest drops came from the younger age group and students,
both of which returned only moderately negative scores (by comparison). The score
for the 15-24 age group saw a -11 evolution, and that for students a -10 change.
Most reactions to the expectations for the coming twelve months were around the
-40 to -50 scores. Students and the younger respondents gave the least negative
answer relating to this – with -26 and -27 respectively.
House persons and the unemployed were the only groups not to record a negative
evolution relating to expectations for the next twelve months. The score for the
former changed by +1, while the score for the latter remained the same. The
strongest downward evolutions were in relation to the scores from managers (-11)
and from respondents who report almost never having financial difficulties and
manual workers (both -9).

SPECIAL EUROBAROMETER 370 “Social Climate”
60
2.5 Affordability of housing (QB2_9; QB3_10; QB4_1016)
The scores relating to affordability of housing in the EU are also negative, with
similar levels of dissatisfaction and lowered expectations as we have seen in other
instances relating to the general situation. Furthermore, the positive evolution
noticed in last year’s report has been undone by overall negative evolutions in this
wave of analysis.
The EU27 average for the current situation for this question is -3.3. The situation as
it compares to that of five years ago receives a score of -60 on the better/worse
index and the expectations for the next twelve months are set at -33.
The current situation score has decreased by -0.6, following on from last year’s
positive evolution of +0.4. The score for the five-year comparison has changed by
-8, and the score for the twelve-month expectations by -6.
16 QB2.9 How would you judge the current situation of... How affordable housing is in (our country), QB3.10 What are your expectations for the next twelve months; will the next twelve months be better, worse or the same, when it comes to…? How affordable housing is in (our country), QB4.10 Compared with five years ago, would you say things have improved, gotten worse or stayed about the same when it comes to…? How affordable housing is in (our country).

SPECIAL EUROBAROMETER 370 “Social Climate”
61
Figure 23: QB2.9, QAB.10 and QB4.10 – Score cards (index tables, showing evolutions)
The current situation index is measured on a scale from -10 to +10.
The better-worse indexes are measured on a scale from -100 to +100.

SPECIAL EUROBAROMETER 370 “Social Climate”
62
Regarding the affordability of housing current situation, only six Member States
gave positive answers, all countries scoring below 1. Denmark gave the highest
score, with 0.9 – it was followed by Austria with 0.8, Estonia and Germany with 0.6,
and Sweden with 0.1. Latvia records a score of 0. The most negative responses came
from Cyprus (-7.3), Romania (-6.1), Lithuania (-6), Spain (-5.8) and Malta (-5.6).
Eleven Member States returned scores of -5 or lower.
Despite these low scores, there were some positive evolutions. The most obvious of
these can be found in Ireland’s result, where a low score of -2.2 marks an increase
of +0.9 on last year’s figure. Positive evolutions were also noticed in Austria,
Germany, the Czech Republic, Italy and Hungary. Several negative evolutions were
noticed – in Spain (-1.7), France (-1.5), Slovakia, the UK (both -1.3), Finland (-1.1),
Estonia, Malta and Luxembourg (all -1).
No positive comparisons with the affordability of housing situation of five
years ago were made, with Ireland’s score of -3 in this situation being the least
negative. It was followed by Latvia with -15 and Estonia with -16. The most negative
responses here came from Cyprus (-90), Spain (-81) and Luxembourg (-80).
Some positive evolutions were observed here, although they were for the most part
negative. Lithuania and Ireland recorded increases of +11 from last year’s data and
Hungary’s score increased by +6. Cyprus’s score remained the same. Major negative
evolutions were observed in Slovakia (-29), Sweden (-24) and Bulgaria (-20).
Estonia is the only Member State to record a positive score on the better/worse
index relating to expectations for the next twelve months, with +4. The least
negative responses are found in Ireland and Latvia, with a marginally negative score
of -1. The lowest scores were seen in Portugal (-65), Greece (-59) and Finland (-57).
Cyprus, the Member State which scored lowest on the current situation ranking, gave
a score of -53.
Again, there are some individual positive evolutions related to the expectations for
the near future, although they are found on Member States which have negative
scores for the affordability of housing current situation (except Estonia which has a
positive score for the current situation). The strongest were noted from results from
Romania (+12) and Lithuania (+11). Cyprus followed with an evolution of +4, and
Estonia with +2. The situation remained the same in Bulgaria and Italy, both of
which have relatively low negative scores on the index. The most striking negative
evolutions were noticed in Hungary (-32), Slovakia and Finland (both -20).

SPECIAL EUROBAROMETER 370 “Social Climate”
63
Figure 24: QB2.9, QB3.10 and QB4.10 – SD tables (index tables, showing evolutions)
The current situation index is measured on a scale from -10 to +10.
The better-worse indexes are measured on a scale from -100 to +100.
Regarding the socio-demographic breakdowns, women respond with more negative
answers than men – with scores of -3.6 and -3.1 respectively for the affordability
of housing current situation. Education also has an impact on scores – with a
similar pattern to that which has been observed in several other questions in this
section. Those who finished their education before the age of 16 returned a score of
-3.7, followed by -3.5 from those who finished between 16 and 19, -3 from those
who finished at age 20 or over, and -2.7 from those who are still studying.

SPECIAL EUROBAROMETER 370 “Social Climate”
64
Regarding the results relating to occupation, those who are employed in roles which
typically carry a higher degree of remuneration are less negative about the situation
than, for example, those without jobs (-2.5 for managers compared to -4.6 for the
unemployed). Respondents’ difficulty in paying bills has an understandable impact as
well, with a score of -5.3 from those who frequently experience financial difficulties
compared to -2.7 from those who almost never do.
These figures have almost all fallen compared to last year’s survey, with only the
answer from other white collars remaining the same. The most severe negative
evolution can be seen in answers from house persons – with a change of -1.1. The
unemployed reported a downward evolution of -0.9. Those who reported almost no
difficulty in paying their bills saw their score decrease by a greater degree than those
who report frequent financial difficulties (-0.7 compared to -0.4).
When considering the affordability of housing situation now compared to that of five
years ago, younger respondents are more likely to give a less negative response –
with the youngest age group scoring -50 compared to -62 from the other three
groups. We see the levels of negativity falling as respondents’ level of education
increases, and as their financial difficulties drop. Students remain least negative
about the situation, with a score of -43. People with frequent financial difficulties are
the most negative about the comparison, with a score of -74. The highest negative
evolutions here came from house persons and the retired, whose scores both fell by
-10.
Students are also least pessimistic about the twelve-month expectations, with a
score of -19 relating to this section of the question. The 15-24 age group follows,
with a score of -22. Almost every single group reported some decline in score
compared to the last wave of analysis, with the exception of house persons, whose
score of -34 was the same as in the last report.

SPECIAL EUROBAROMETER 370 “Social Climate”
65
2.6 The way the public administration is run (QB2_10;
QB3_11; QB4_1117)
Respondents were next asked about the way public administration is run in
their country. It was observed in the last report that, out of all the questions in this
“general situation” category, this received the least negative responses, with a
relatively high number of “the same” responses. Last year’s figure remained similar
to that reported in the previous wave of analysis, with a small decrease of -0.1
points relating to the current situation. We see the same pattern emerging again in
this survey.
For the current situation, the score at EU level for the way that public administration
is run is -1.4, with a score of -31 on the better/worse index for the five-year
comparison and -15 for twelve month expectations. “The same” answers again make
up a large proportion of the results.
These figures have evolved downwards slightly in the case of the current situation
responses and the five-year comparison. The current situation score has changed by
-0.1, and the five-year comparison by -3. Expectations for the next twelve months
remain the same as recorded in the last wave of analysis.
17 QB2.10 How would you judge the current situation of... The way public administration runs in (our country), QB3.11. What are your expectations for the next twelve months; will the next twelve months be better, worse or the same, when it comes to…? The way public administration runs in (our country). QB4.11. Compared with five years ago, would you say things have improved, gotten worse or stayed about the same when it comes to…? The way public administration runs in (our country).

SPECIAL EUROBAROMETER 370 “Social Climate”
66
Figure 25: QB2.10, QB3.11 and QB4.11 – Score cards (index tables, showing evolutions)
The current situation index is measured on a scale from -10 to +10.
The better-worse indexes are measured on a scale from -100 to +100.

SPECIAL EUROBAROMETER 370 “Social Climate”
67
Although there is, again, a considerable variation in the results recorded by
individual Member States, the picture is slightly better than those seen in relation to
answers to the previous questions – relating, as they do, to more immediate
personal concerns. Concerning the current situation of the way public
administration is run, Luxembourg records the highest score, with 2.4, followed by
Austria with 1.8, Sweden with 1.7, Estonia with 1.6 and Germany with 1.4. Eight
Member States record positive scores. The lowest-scoring nations were Greece (-
5.9), Romania (-5.8), Latvia (-4.9), Ireland (-3.8) and Portugal (-3.4). However the
scores are higher than those which relate to economic, housing and employment
situations, with Member States which scored both high and low in questions relating
to economic and general situations repeating this trend in relation to this question.
Several Member States reported increases in terms of evolution from the last wave
of analysis, although few were major – the main two being an increase of +0.8 from
Luxembourg and +0.7 from both Bulgaria and Latvia. This is accompanied by many
above-average negative evolutions, most notably from Spain (-1.5) and Slovenia
(-1.2).
The five-year comparison was generally low from individual Member States, with
two positive answers recorded: +8 from Estonia and +6 from Luxembourg. The least
negative answers were -5 from Austria and -8 from Belgium. The most negative
answers came from Greece with -68, Romania with -62 and Portugal with -56.
Positive and negative evolutions took place from Member States which ranked both
high and low in this instance. Strong positive evolutions were noticed in Ireland and
Lithuania (+9), Belgium and Germany (+7). Decreases were noticed in Spain (-15),
Portugal (-14), Poland (-11) and the Czech Republic (-10).
Expectations for the next twelve months were again positive in Estonia and
Luxembourg, which recorded scores of +11 and +7 respectively. Bulgaria also
reported a positive score of +11 on the better/worse index. Very negative scores
were recorded in Greece (-55), Portugal (-45) and Romania (-29), Member States
which have recorded consistently low expectations throughout the analysis so far.
The unmoving evolution at EU level for this category hides several individual
evolutions, both positive and negative: at one end of the scale, we see an evolution
of +17 in Denmark and +15 in Romania and, at the other, -23 from Hungary and -13
from Portugal and the Czech Republic.

SPECIAL EUROBAROMETER 370 “Social Climate”
68
Figure 26: QB2.10, QB3.11 and QB4.11 – SD tables (index table, showing the evolutions)
The current situation index is measured on a scale from -10 to +10.
The better-worse indexes are measured on a scale from -100 to +100.
When it comes to the socio-demographic breakdowns, for the current situation of
the way public administration is run, lower levels of negativity are observed
from respondents who have remained in education longer – those who finished at 15
or younger gave a score of -1.7, with those who finished aged 16-19 giving a score
of -1.5 and those who finished at age 20 or older and also current students giving a
score of -1. The most obvious differences are related to occupation, with both the
self-employed and the unemployed giving scores of -2.4, compared to -0.5 from
managers and -1 from both the retired and current students. Financial situation is

SPECIAL EUROBAROMETER 370 “Social Climate”
69
also seen to have an effect, with the score rising from -3.6 for those who have
difficulties paying their bills frequently to -0.7 for those who do not.
The self-employed and respondents who are still studying record the most noticeable
negative evolutions here, with their answers changing by -0.6 from last year. There
are just two slight positive evolutions here, from managers (+0.2) and manual
workers (+0.1). People with financial difficulties most of the time gave the same
answer as in the last report, as did the respondents who finished school between 16
and 19, white-collar workers and respondents aged 40-54.
Older respondents recorded increasingly negative answers relating to the five-year
comparison, as did people who left education earlier. As we have observed before,
increased difficulty in paying bills leads to a more negative impression – with -45
recorded by those who frequently have paying their bills compared to -25 from
people who almost never do.
Again, there were no positive evolutions here – only negative evolutions or no
change. The self-employed see the situation of the way public administration is run
as worsening the most, with an evolution of -12.
In terms of expectations for the next twelve months, a number of socio-
demographic groups reported results which are markedly less negative than others.
The youngest age group returned an average answer of -3 and current students one
of -2. Self-employed respondents returned a negative score of -20 and those in
financial difficulties a score of -25.
Positive evolutions were noticed in the answers given by unemployed people (+6)
and house persons (+4), whereas the self-employed – who may be informed by their
contact with national administrative systems such as tax offices – noting a decrease
of -4.

SPECIAL EUROBAROMETER 370 “Social Climate”
70
CONCLUSIONS
Results regarding the general situation are, on the whole, a lot lower than those
observed in relation to the personal situation. It is likely that respondents find it
easier to be critical of the overall situation than they are about their own. Given that
there is a distinction between the types of questions asked in this section, it is also
unsurprising to see a slight variation in geographical patterns which are beginning to
be established – between the larger concepts of employment, finance and
governance, and the more specific questions of one particular commodity (energy).
It is important to note that the overall EU27 average results for the
individual questions – which are, by and large, low or negative – conceal
some individual positive scores.
This seems to be the case for all of the questions asked in this section. The mood
relating to the economic situation is negative – whether to the current situation or to
the five-year comparison – in the majority of Member States. The same can be said
of employment, the cost of living, the affordability of energy, the affordability of
housing, and the way in which public administration is run. In each of these
instances a familiar group of Member States appears near the top and bottom of
each list – with some variance in the ranking relating to consideration of energy.
We can note positive evolutions in the consideration of the economic and
employment situations, although the same cannot be said for the cost of living, the
affordability of energy, the affordability of housing, and the way in which public
administration is run. However, despite any positive evolutions, the situation is still
seen as negative overall.
The variations in these scores from the previous survey in May 2010 highlight the
on-going effect of the economic crisis. Although the economic and the employment
situation at a national level is seen as beginning to improve, the mood of negativity
relating to aspects which have a daily impact on the lives of citizens is worsening in
several instances. The crisis still has a considerable impact on the lives of
citizens, although some positive tendencies can be detected.
Again, we can see the closeness to the top of the ranking in most instances of the
Nordic and Benelux Member States, joined in several instances by Germany and
Austria. Greece, Romania, Hungary, Bulgaria and Portugal generally report lower
levels of satisfaction. The rankings are very different in the consideration of energy
prices, although this is presumably due to individual circumstances controlled by
local and national governments and industry.

SPECIAL EUROBAROMETER 370 “Social Climate”
71
3. SOCIAL PROTECTION AND INCLUSION
In this third section of the report, aspects of social protection and inclusion are
considered. Opinion of these aspects of EU life was measured in the same way as for
all the previous questions; the topics covered are provision of health care, provision
of pensions, unemployment benefits, relations between people from different cultural
backgrounds and the way inequalities and poverty are addressed in each Member
State.
3.1 Health care provision (QB2_2; QB3_3; QB4_318)
Opinion relating to the provision of healthcare in EU Member States is
tentatively positive. In last year’s report (May 2010), a positive answer was also
noted – which itself had not changed from the report carried out before that (May
2009). The overall average score for EU27 is 1.2, relating to the current situation. However,
the situation compared to that of five years ago is -33 on the better/worse index,
with expectations for the next twelve months receiving a score of -18. In terms of evolution, a minor negative change of -0.1 is observed for the result
relating to the current situation. The five-year comparison result has decreased by -4
compared to the last wave of analysis and the expectations for the coming twelve
months have increased by +1 point on the scale.
18 QB2.2 How would you judge the current situation in each of the following? Health care provision in (OUR COUNTRY), QB3.3 What are your expectations for the next twelve months: will the next twelve months be better, worse or the same, when it comes to...? The healthcare system in (OUR COUNTRY), QB4.3 Compared with five years ago, would you say things have improved, gotten worse or stayed about the same when it comes to…? The healthcare system in (OUR COUNTRY)

SPECIAL EUROBAROMETER 370 “Social Climate”
72
Figure 27: QB2.2, QB3.3 and QB4.3 – Score cards (index tables, showing evolutions)
The current situation index is measured on a scale from -10 to +10.
The better-worse indexes are measured on a scale from -100 to +100.

SPECIAL EUROBAROMETER 370 “Social Climate”
73
The majority of Member States report positive scores for the national health care
system current situation, although there is a difference between the top-scoring
and bottom-scoring countries on the ranking. Belgium returns the highest score, with
6.3, followed by Luxembourg and the Netherlands with 5.3, Austria with 5.2, the UK
with 4 and Malta with 3.6. The lowest-scoring Member States are Romania (-5.1),
Greece (-3.7), Bulgaria (-2.8), Latvia (-2.6) and Poland (-2.4). We can notice
general geographical patterns emerging in this ranking as have been observed
elsewhere – particularly positive views noted in the Nordic and Benelux Member
States and negative ones noted in several Southern, Central and Eastern European
countries.
Thirteen Member States report positive evolutions, although these are, for the most
part, slight. The remainder, apart from Denmark, where no change is observed,
record negative evolutions. The largest positive evolution is in top-scoring Belgium,
with an increase of +1; this is followed by the Netherlands, with +0.7. The UK, which
is placed fifth in the ranking, shows a change of -0.4 compared to the last wave of
analysis. The most obvious downward evolutions can be observed in Slovakia (-2.1)
and the Czech Republic (-1.2). Romania shows a downward evolution of -0.9. These
evolutions demonstrate that the gap between countries has widened since
the previous survey, where scores ranged from 5.3 in Belgium to -4.2 in
Romania. The situation in the wealthier countries has improved, whereas
that in the countries at the bottom of the scale has worsened.
Despite the negative EU27 average, there are some instances where the score for
the national health care system situation compared to that of five years ago
is quite positive. We can observe this in Malta (+29), Belgium (+13) and Cyprus
(+12). However, the negative scores from other Member States outweigh this. In
particular, Romania (-79), Greece (-73) and Slovakia (-57) record very negative
scores.
Strong positive evolutions were noticed in Lithuania (+13), Belgium (+10), Bulgaria
(+5), Denmark and Germany (+4). Major negative evolutions were noticed in
Slovakia (-32), the Czech Republic (-22), Spain (-17), Greece (-16), Romania (-14)
and the UK (-13).
Expectations for the next twelve months are positive in Malta (+18), Estonia
(+9) and Cyprus (+3). The remaining Member States return negative scores,
demonstrating a low level of optimism across most of Europe. The highest levels of
pessimism were found in Greece (-59), the Netherlands (-43), the Czech Republic
(-38) and Germany and Slovakia (both -37).
In terms of evolution, Lithuania (+18), Denmark (+15), Latvia, Germany (both
+13), Bulgaria, Romania and Cyprus (each +9) recorded strong positive evolutions
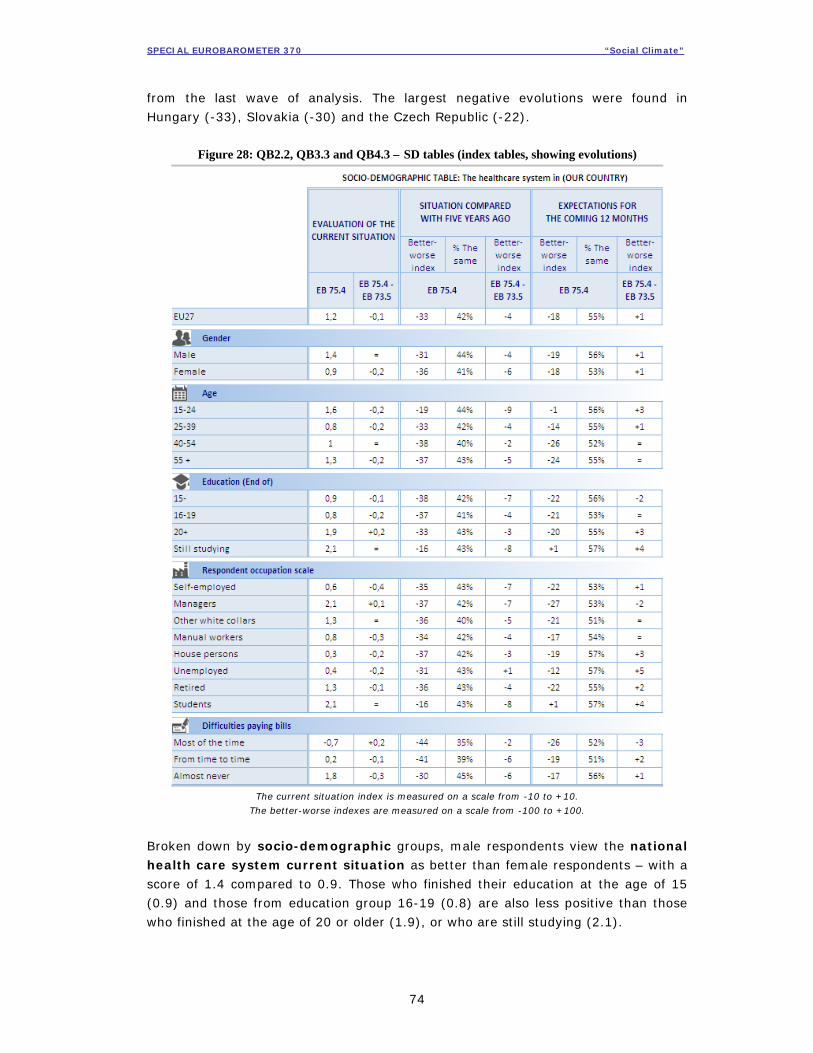
SPECIAL EUROBAROMETER 370 “Social Climate”
74
from the last wave of analysis. The largest negative evolutions were found in
Hungary (-33), Slovakia (-30) and the Czech Republic (-22).
Figure 28: QB2.2, QB3.3 and QB4.3 – SD tables (index tables, showing evolutions)
The current situation index is measured on a scale from -10 to +10.
The better-worse indexes are measured on a scale from -100 to +100.
Broken down by socio-demographic groups, male respondents view the national
health care system current situation as better than female respondents – with a
score of 1.4 compared to 0.9. Those who finished their education at the age of 15
(0.9) and those from education group 16-19 (0.8) are also less positive than those
who finished at the age of 20 or older (1.9), or who are still studying (2.1).

SPECIAL EUROBAROMETER 370 “Social Climate”
75
Managers (2.1), other white-collar workers (1.3) and the retired (1.3) are more
likely to be positive about the situation than manual workers (0.8), the self-
employed (0.6), unemployed people (0.4) and house persons (0.3). A negative result
relating to the current situation (-0.7) is recorded by people who experience frequent
difficulties paying their bills, which can be compared to a result of 1.8 from people
who almost never do.
Positive evolutions are slight here, although the comparatively strong scores
recorded by male respondents, the 40-54 age group, current students and other
white-collar workers have remained the same as they were last year. A positive
evolution of +0.2 was noticed in the score from respondents who report frequent
financial difficulties and those who studied longest. The strongest negative evolution
was recorded by the self-employed, with a change of -0.4.
The five-year comparison is viewed more harshly by older respondents than
younger – we can compare the score of -19 from the 15-24 age group with scores
below -30 from the 25-39, 40-54 and 55+ age groups. Scores are also impacted by
respondents’ financial situation: -44 from those who experience frequent problems,
-41 from those with occasional problems and -30 from those who almost never have
difficulties.
Evolutions for this category were generally negative, with large decreases compared
to the last wave of analysis returned by the 15-24 age group (-9) and current
students (-8), both of which groups also returned relatively non-pessimistic scores.
The score recorded for unemployed people evolved by +1 point to -31.
The only positive score relating to twelve-month expectations regarding the
national health care system was returned by current students, with +1. In all other
categories, a negative score was recorded. Significant differences were recorded
within the age-groups: respondents aged 15-24 gave a score of -1, the 25-39 group
a score of -14, the 40-54 group -26 and the 55+ group -24. Students’ positive score
of +1 can be compared to negative scores from the other three education categories,
all of which are around the same level, with -22 from those who finished education
at age 15 and under, -21 from those who finished at age 16-19, and -20 from those
who finished at age 20 or older. Also those who have almost never difficulties in
paying bills (-17) are less pessimistic than those who have from time to time (-19)
and most of the time (-26).
In contrast to the five year comparison, almost all of these scores in regard to
expectations for the near future either remained the same or evolved positively. The
only negative evolutions were noticed from people who report frequent financial
difficulties (-3), managers (-2) and those who finished their education at 15 or
younger (also -2).

SPECIAL EUROBAROMETER 370 “Social Climate”
76
3.2 Provision of pensions (QB2_3; QB3_4; QB4_419) Demographic previsions20 say that the EU will reach its peak in terms of population in
2040, and its population will then start to decline. In 50 years, the proportion of EU
citizens aged 65 and older will exceed 30% when it’s currently 17%. This will have
an increasing impact on the issue of provisions of pensions, and European citizens
show their concern about that: as was observed in last year’s survey, opinion
regarding the provision of pensions is still negative – and continues to become more
so. The EU27 average is -1.5 for the current situation. A score of -47 is recorded on
the better/worse index for the situation now as it compares to that from five years
ago and a score of -30 is returned for expectations for the next twelve months.
As noted in the last wave of analysis, a negative evolution is observed here – this
time, with a change of -0.3. The five-year comparison sees a negative evolution of
-5. Expectations for the next twelve months have improved, however, by +4.
19 QB2.3 How would you judge the current situation in each of the following? The provision of pensions in (OUR COUNTRY), QB3.4 What are your expectations for the next twelve months: will the next twelve months be better, worse or the same, when it comes to...? The provision of pensions in (OUR COUNTRY), QB4.4 Compared with five years ago, would you say things have improved, gotten worse or stayed about the same when it comes to…? The provision of pensions in (OUR COUNTRY) 20 http://epp.eurostat.ec.europa.eu/cache/ITY_PUBLIC/3-08062011-BP/EN/3-08062011-BP-EN.PDF

SPECIAL EUROBAROMETER 370 “Social Climate”
77
Figure 29: QB2.3, QB3.4 and QB3.4 – Score cards (index tables, showing evolutions)
The current situation index is measured on a scale from -10 to +10.
The better-worse indexes are measured on a scale from -100 to +100.

SPECIAL EUROBAROMETER 370 “Social Climate”
78
The overall negative score for the provision of pensions current situation
represents a variation in answers on an individual Member State level. Luxembourg
returns the highest score, with 4.9, followed by the Netherlands (3.4), Austria (3.1),
Denmark (3), and Belgium (1.3). Eight Member States returned positive scores in
total (the aforementioned, along with Finland, Sweden, and Germany with positive
scores). The lowest scores were noticed in Greece (-6.3), Romania (-6.2), Latvia (-
5.1), Bulgaria (-4.9) and Lithuania (-4.5). Once again, we see a familiar group of
Member States near the top and the bottom of the ranking, indicating general
negative levels of feeling when financial and economic matters are considered by
citizens of these aforementioned Member States.
Despite the overall negative evolution, some positive changes were noticed in
individual Member States when these scores are compared to last year’s survey.
Italy saw a positive evolution of +0.7, Austria of +0.6 and Luxembourg of +0.4.
Strong negative evolutions were noticed in Malta (-2.3), Slovakia and Estonia (both
-1.9) and the Czech Republic (-1.4).
Cyprus, with +3, was the only Member State to report a positive score for the
situation now compared with that of five years ago. The least negative scores
were recorded in Estonia (-1) and Luxembourg (-10). More negative responses were
recorded in a large number of other Member States, particularly in Greece (-93),
Romania (-79) and Portugal (-68).
The evolution of these scores was also largely negative. Five Member States returned
positive evolutions: Lithuania recorded the highest evolution (+11), followed by
Germany and Belgium (+5 both), Italy (+3) and Austria (+1). The strongest
negative evolutions were noticed in Slovakia (-31), Malta (-25), the Czech Republic
(-17) and Spain (-16).
Estonia was the only Member State to return a positive score relating to expectations
for the next twelve months, with +7. This can be compared to some very negative
responses from other Member States – particularly Greece (-78), the Czech Republic,
Portugal (both -55) and the Netherlands, which gave a negative score of -53 despite
its position near the top of the ranking by current situation.
Strong evolutions can be seen on this index. Important positive evolutions are noted,
particularly in Lithuania, where the score increased by +37 and Romania, with an
evolution of +23. The strongest negative evolution was observed in Hungary with
-36. High percentages of “the same” answers were returned by a number of
individual Member States for this question.

SPECIAL EUROBAROMETER 370 “Social Climate”
79
Figure 30: QB2.3, QB3.4 and QB3.4 – SD tables (index tables, showing evolutions)
The current situation index is measured on a scale from -10 to +10.
The better-worse indexes are measured on a scale from -100 to +100.
Socio-demographically, as observed throughout this analysis, male respondents
are more likely to respond in a more optimistic way than female ones – with a score
of -1.3 for the provision of pensions current situation, compared to -1.6. The 55+
age group are also less negative than the other age groups (15-24, 25-39, 40-54)
about this topic, with an above-average score of -0.9 compared to the scores
between -1.7 and -1.9 for the rest of the age groups. We can also note that
managers and retired are less negative about the provision of pensions – with scores
of -0.4 and -0.8 respectively. These can be compared to a score of -3 from the
unemployed, -2.2 from house persons and -2.4 from the self-employed. Financial
situation has a strong impact upon answers – those who encounter frequent difficulty

SPECIAL EUROBAROMETER 370 “Social Climate”
80
give a score of -4 compared to -0.6 from those who almost never do. Retired people,
personally impacted by this issue, give a score of -0.8; negative, but below the
average.
The strongest negative evolutions came from the 15-24 age group (-0.9), students,
and the self-employed (both -0.7). Respondents who report frequent financial
difficulties recorded a positive evolution of +0.1, although the score for this wave
remains very low.
Scores for the five-year comparison were uniformly around the average level,
although improvements can be noted according to the following criteria: age of the
respondent (with the score worsening as the age increases), level of education
(score improves as this increases) and financial situation (score increases as this
improves). The 55+ age-group returns a slightly less negative score of -47 compared
with the 40-54 group (with -54).
Strong negative evolutions for the five-year comparison scores were noted from
managers (-12) and students (-11). A positive evolution of +4 was noticed on the
score given by the unemployed.
Regarding expectations for the next twelve months, students are the least
pessimistic of all of the groups of respondents – with a score of -15. Managers are
the most negative about this, with a score of -41. Even though the scores for most
groups are uniformly negative, they have improved on the results of the last wave of
analysis in all instances, except for managers who recorded a negative evolution of
-1 point. The strongest positive evolution comes from the unemployed with +13 and
house persons with +9.

SPECIAL EUROBAROMETER 370 “Social Climate”
81
3.3 Unemployment benefits (QB2_4; QB3_5; QB4_521)
The perception regarding unemployment benefits is, on the whole, pessimistic,
although the view of the current situation has improved on last year’s results – which
had fallen from the previous wave of analysis (with -0.2 score points since 2009).
The EU27 average is -1.2 for the current situation. The situation now as compared to
five years ago scores -37 on the better/worse index, with expectations for the next
twelve months recording a score of -24. The twelve-month expectations question
was also answered with a comparatively high number of “the same” answers – 49%
on average.
Despite the overall negative picture, the evolution from the last year survey, for two
dimensions, is positive: the current situation score has improved by +0.2 and the
score for the next twelve months has increased by +8. The score for the five-year
comparison remains the same.
21 QB2.4 How would you judge the current situation in each of the following? Unemployment benefits in (OUR COUNTRY), QB3.5 What are your expectations for the next twelve months: will the next twelve months be better, worse or the same, when it comes to...? Unemployment benefits in (OUR COUNTRY), QB4.5 Compared with five years ago, would you say things have improved, gotten worse or stayed about the same when it comes to…? Unemployment benefits in (OUR COUNTRY)

SPECIAL EUROBAROMETER 370 “Social Climate”
82
Figure 31: QB2.4, QB3.5 and QB3.5 – Score cards (index tables, showing evolutions)
The current situation index is measured on a scale from -10 to +10.
The better-worse indexes are measured on a scale from -100 to +100.

SPECIAL EUROBAROMETER 370 “Social Climate”
83
When describing the unemployment benefits current situation, eleven Member
States record positive scores for this question. The highest scores come from
Luxembourg (4.7), Austria (3.7), the Netherlands (3.1), Belgium (2.8) and Denmark
(2.2). Romania, with -6.3, marks the lowest score on the ranking, followed by
Greece (-6), Hungary (-5), Bulgaria (-4.9) and Latvia (-4.4).
There are some strong positive evolutions in these results, particularly in the upper
half of the ranking. Germany’s score evolved by +1.4, Slovenia’s by +1.2 and
Luxembourg’s by +0.9; and Austria’s and Belgium’s scores both by +0.8. The largest
negative evolutions were noted in the Czech Republic (-1.5) and Latvia (-1.1).
Although the score for the five-year comparison is low at EU level, Luxembourg
returned a positive result of +7. The least negative scores came from Austria and
Belgium, with -5 both, followed by Estonia (-9). The most negative scores were
recorded in Greece (-83), Romania (-75) and Portugal (-69). These results support
patterns observed in other sections of the analysis, with a great degree of general
dissatisfaction observed in specific Member States – including Greece, Romania and
Portugal – and a degree of positivity or, at least, reduced negativity in others – such
as those in the Nordic region and Benelux region.
The five-year comparison results saw strong positive and negative evolutions.
Increases were noted in Germany (+19), Lithuania (+17) and Belgium (+9) among
others. Particularly negative evolutions were noted in the Czech Republic (-20)
Slovakia (-18) and Latvia (-17), again, mirroring a pattern outlined in previous
analysis.
Sweden and Estonia both report slight levels of optimism for the unemployment
benefits situation over the next twelve months, with scores of +4. The situation is
regarded with a greater degree of pessimism elsewhere in Europe – particularly in
Greece (-75), Portugal (-58) and the Czech Republic (-54). The majority of Member
States expect the situation to worsen.
However, there were some very strong evolutions from the last wave of analysis,
particularly in Lithuania, Germany (both +31) and Romania (+21). A strong negative
evolution was noticed in Hungary, of -39.

SPECIAL EUROBAROMETER 370 “Social Climate”
84
Figure 32: QB2.4, QB3.5 and QB3.5 – SD tables (index tables, showing evolutions)
The current situation index is measured on a scale from -10 to +10.
The better-worse indexes are measured on a scale from -100 to +100.
Regarding the socio-demographic groups, we can observe that the level of
education has an impact on the scores relating to the national unemployment
benefits current situation – with those who finished their education at 15 or younger
returning a score of -2 compared to -1.4 from those who finished aged 16-19 and
-0.1 from those who finished at age 20 or older. Occupation also plays a part with
managers giving a positive score of 0.5, compared with negative responses from all
other groups. Unemployed respondents, whose answers should be observed with
particular attention in this instance, are particularly negative, with a score of -2.9.
Financial situation is also an important factor, with those in frequent financial

SPECIAL EUROBAROMETER 370 “Social Climate”
85
difficulty giving a score of -3.6 compared to -0.2 from those who almost never have
problems paying their bills.
Several of these scores have evolved in a positive direction, most notably those from
those who experience frequent financial difficulties and the retired (+0.5 both). The
highest negative evolutions were recorded by the self-employed (-0.3) and students
(-0.2).
Level of education affects also the five-year comparison – with those who finished
studying at age 15 or younger giving a score of -43 compared to -39 from those who
finished aged 16-19, -35 from those who finished at age 20 or older and -25 from
current students. The scores also become less negative as the respondent’s financial
situation improves, with those reporting frequent difficulties giving a score of -54,
those who report occasional difficulties giving a score of -48 and those who report
almost no difficulty a score of -30. There were very few strong evolutions for this
dimension, with the exception of the self-employed, whose score changed by -7 to a
relatively low -43 and managers, who recorded a decrease of -6 points on last year’s
survey. The unemployed reported a positive evolution of +4.
Regarding expectations for the next twelve months, age and financial situation had
the most pronounced impact on scores. The youngest age band, 15-24, gave a score
of -14, compared to -24 from the 25-39 age group, -30 from the 40-54 age group
and -25 from the 55+ age group. The score for respondents who experienced
financial difficulty is -36, compared to -21 from those who almost never do.
There are a number of strong positive evolutions in this dimension, notably from
house persons (+13), the respondents who finished their education aged 16-19
(+11), the retired, the unemployed and respondents aged 55+ (all +10). There were
no negative evolutions.

SPECIAL EUROBAROMETER 370 “Social Climate”
86
3.4 Relations between people from different cultural
backgrounds (QB2_6; QB3_7; QB4_722)
When questioned about the relations between people from different cultural
and religious backgrounds or nationalities, the EU perception on the current
situation is very slightly positive (0.1). The situation is seen to have worsened over
the last five years (-23) and the outlook for the next twelve months is similarly
gloomy (-11).
The figures relating to the current situation and five-year comparison have fallen
since the last wave of analysis. The current situation has decreased by -0.2, the five-
year figure by -2. The twelve-month expectations score has evolved positively, by
+1. However, these changes are relatively limited, and overall, the situation has
stayed quite stable regarding this dimension since the previous survey in May 2010.
22 QB2.6 How would you judge the current situation in each of the following? Relations in (OUR COUNTRY) between people from different cultural or religious backgrounds or nationalities, QB3.7 What are your expectations for the next twelve months: will the next twelve months be better, worse or the same, when it comes to...? Relations in (OUR COUNTRY) between people from different cultural or religious backgrounds or nationalities, QB4.7 Compared with five years ago, would you say things have improved, gotten worse or stayed about the same when it comes to…? Relations in (OUR COUNTRY) between people from different cultural or religious backgrounds or nationalities

SPECIAL EUROBAROMETER 370 “Social Climate”
87
Figure 33: QB2.6, QB3.7 and QB3.7 – Score cards (index tables, showing evolutions)
The current situation index is measured on a scale from -10 to +10.
The better-worse indexes are measured on a scale from -100 to +100.

SPECIAL EUROBAROMETER 370 “Social Climate”
88
The number of Member States reporting negative scores relating to the current
situation regarding the relations between people from different cultural
backgrounds is smaller than noticed in answers to previous questions. The ratings
given are also far more moderate and closer to 0 (from both the positive and
negative side) than seen elsewhere. This is potentially due to a number of reasons: it
is a sensitive topic of discussion and also is not concerned with respondents’ personal
financial situation as closely as most of the other questions asked. Luxembourg
(2.8), Estonia, Ireland (both 1.8), Slovakia (1.6) and Bulgaria (1.4) report the
highest scores here, with Greece (-2), France (-1.4), the Czech Republic (-1.3),
Hungary (-1.1) and Denmark (-1) giving the lowest scores. It is interesting to note
that it is more difficult to spot geographical patterns in this ranking, when compared
to the responses to other questions.
A number of strong individual negative evolutions are recorded, particularly in the
Czech Republic (-1.2), Cyprus (-1.1), Poland and Spain (both -0.8), Latvia and
Hungary (both -0.7). The strongest positive evolutions were not as major as this –
the situation is deemed to be improved in Italy (+0.6), Ireland and Malta (both
+0.5).
As it is seen as a sensitive topic, the numbers of “the same” responses are higher
than previously seen in other questions in this section in regard to the five-year
comparison and the twelve-month expectations.
Positive scores for the five-year comparison were recorded in Estonia (+6) and
Malta (+1). The most negative results came from Greece (-62), the Netherlands
(-46) and Slovenia (-44). There are some fairly positive evolutions in the data as it
compares to the last wave of analysis: Finland, for example, with +7, Malta with +6
and France with +5. Strong negative evolutions were noted in Greece (-27), Cyprus
(-24) and Portugal (-19).
The situation is generally expected to worsen over the next year, although
optimism was recorded in Estonia (+17), Bulgaria (+12), Lithuania (+4) and Latvia
(+1). Highest levels of pessimism were noted in Greece (-55), Cyprus (-31),
Slovenia and the Czech Republic (-29) and Portugal (-28). There were a few notable
evolutions in both directions here. Positive changes were noted in the Netherlands
(+13), Lithuania (+8), Bulgaria and Romania (+6), amongst others; negative
changes in Hungary (-18), Greece (-17) and Cyprus (-13).

SPECIAL EUROBAROMETER 370 “Social Climate”
89
Figure 34: QB2.6, QB3.7 and QB3.7 – SD tables (index tables, showing evolutions)
The current situation index is measured on a scale from -10 to +10.
The better-worse indexes are measured on a scale from -100 to +100.
When describing the socio-demographic groups, younger respondents are
generally more positive about this matter than older ones regarding the national
current situation of the relations between people from different cultural
backgrounds – with a score of 0.3 from the 15-24 age group, 0.2 from the 25-39 age
group and 0.1 from respondents aged 40 and over. The score also increases
according to respondents’ level of education – from the lowest score of -0.2 from
those who finished aged 15 or younger, compared to 0.4 from those who finished
aged 20 and over and current students. With regard to occupation, the unemployed
subset is the only category within the occupation category to report a negative score

SPECIAL EUROBAROMETER 370 “Social Climate”
90
(-0.1). Financial status has a distinct effect, with those who suffer frequent financial
and intermittent difficulties in paying their bills reporting negative scores (-0.8 and
-0.3) and those who have little difficulty giving a score of 0.5. The evolution of these
scores was largely negative, although managers and white-collar workers both
reported a very slight increase of +0.1 in comparison to last year’s figures.
In regard to the five-year comparison, and in common with many other questions
covered by this survey, age, level of education and financial situation have a clear
effect on the results returned. The 15-24 age-group gives a score of -11, which
drops to -29 from the 55+ group. Those who finished their education at age 15 or
younger give a score of -29, compared to -27 from those who finished aged 16-19,
-21 from those who finished at age 20 or older and -7 from those who are still
studying. People who have frequent problems paying their bills give a score of -33,
compared to -27 from those who infrequently have problems doing so and -22 from
those who almost never do. It is possible that the age of respondents influences
results due to increasingly multi-cultural societies over the past few generations in
many EU Member States.
Most of the evolutions relating to the five-year comparison were negative, with the
exception of the scores given by managers (+2) and those who finished education
aged 20 or older (+1). Manual workers returned the biggest negative evolution of -5.
For white-collar workers and for those aged 25-39, the situation remained the same.
Students and the 15-24 age-group give the only positive results for the situation of
the relations between people from different cultural backgrounds as it is expected to
change over the next twelve months, with scores of +4 and +3 respectively.
Those who finished education aged 15 or younger gave the lowest score of -20,
followed by respondents who frequently have difficulties paying their bills with -19.
The results largely evolved positively, with a few exceptions that include:
respondents who frequently experience financial difficulties (-4), those who finished
their education earliest (-3), manual workers (-2), the 40-54 age group and male
respondents (-1).

SPECIAL EUROBAROMETER 370 “Social Climate”
91
3.5 The way inequalities and poverty are addressed
(QB2_7; QB3_8; QB4_823)
Turning now to the question of how inequalities and poverty are addressed,
we can see a general negative picture – and, as observed in the last survey,
decreases compared to the previous wave of analysis. The EU27 average for the
current situation for this topic is -2.5, with the five-year comparison scoring -36 on
the better/worse index and expectations for the next twelve months scoring -20.
The score for the current situation has changed by -0.3. The five-year comparison
sees a negative evolution of -4, while the score for expectations over the next twelve
months remains the same as in the last wave of analysis.
23 QB2.7 How would you judge the current situation in each of the following? The way inequalities and poverty are addressed in (OUR COUNTRY), QB3.8 What are your expectations for the next twelve months: will the next twelve months be better, worse or the same, when it comes to...? The way inequalities and poverty are addressed in (OUR COUNTRY), QB4.8 Compared with five years ago, would you say things have improved, gotten worse or stayed about the same when it comes to…? The way inequalities and poverty are addressed in (OUR COUNTRY)

SPECIAL EUROBAROMETER 370 “Social Climate”
92
Figure 35: QB2.7, QB3.8 and QB3.8 – Score cards (index tables, showing evolutions)
The current situation index is measured on a scale from -10 to +10.
The better-worse indexes are measured on a scale from -100 to +100.
SPECIAL EUROBAROMETER 370 “Social Climate”
93
Luxembourg was the only Member State to return a positive score to this question,
relating to the national current situation regarding the way inequalities and
poverty are addressed, with 1.1. Austria and Malta both returned neutral scores of
0. Every other Member State reported a negative score here. The Member States
with the lowest scores are Latvia (-6.1), Romania, Greece (both -5.7), Lithuania (-
5.5) and Hungary (-4.9). It should be noted than like certain previous cases cited,
the gap between countries at the top and countries at the bottom of the scale has
also widened since last year, and ranged from 0.4 in Luxembourg to -5.8 in
Romania. The high negative response to this question follows the geographical
patterns noted in the ranking for other questions, with the Benelux and Nordic
Member States appearing near the top of the list with positive or slightly negative
scores.
Positive evolutions were noticed in top-ranking Luxembourg (+0.7) and Italy (+0.5).
Most other Member States recorded negative evolutions, with the strongest occurring
in the Czech Republic (-1.6), Spain (-1.1), Cyprus (-1), Sweden, Poland and Greece
(-0.9).
No positive scores are recorded relating to the situation now compared to that of
five years ago. The least negative come from Malta with -1 and Luxembourg with
-2. The most negative scores are recorded in Greece (-78), Romania (-61) and
Portugal (-54). There are, however, some positive evolutions – particularly notable in
Germany (+12) and Lithuania (+10). Many strong downward evolutions were
noticed, particularly in Spain (-19), Greece (-17), Poland (-16) and the Netherlands
(-14).
Optimistic scores for the twelve-month expectations were recorded in Sweden
(+5), Estonia and Luxembourg (both +3) and Malta (+1). Very negative scores came
from Greece (-64), Portugal (-44), Slovenia and the Netherlands (-40 both). This
overall slight evolution conceals a number of varied positive and negative evolutions
from individual Member States. Positive changes were noticed particularly in
Lithuania (+17), Denmark (+16), Romania (+14) and Germany (+12). The strongest
negative evolutions were noted in Hungary (-33), Portugal (-14) and Slovenia (-13).
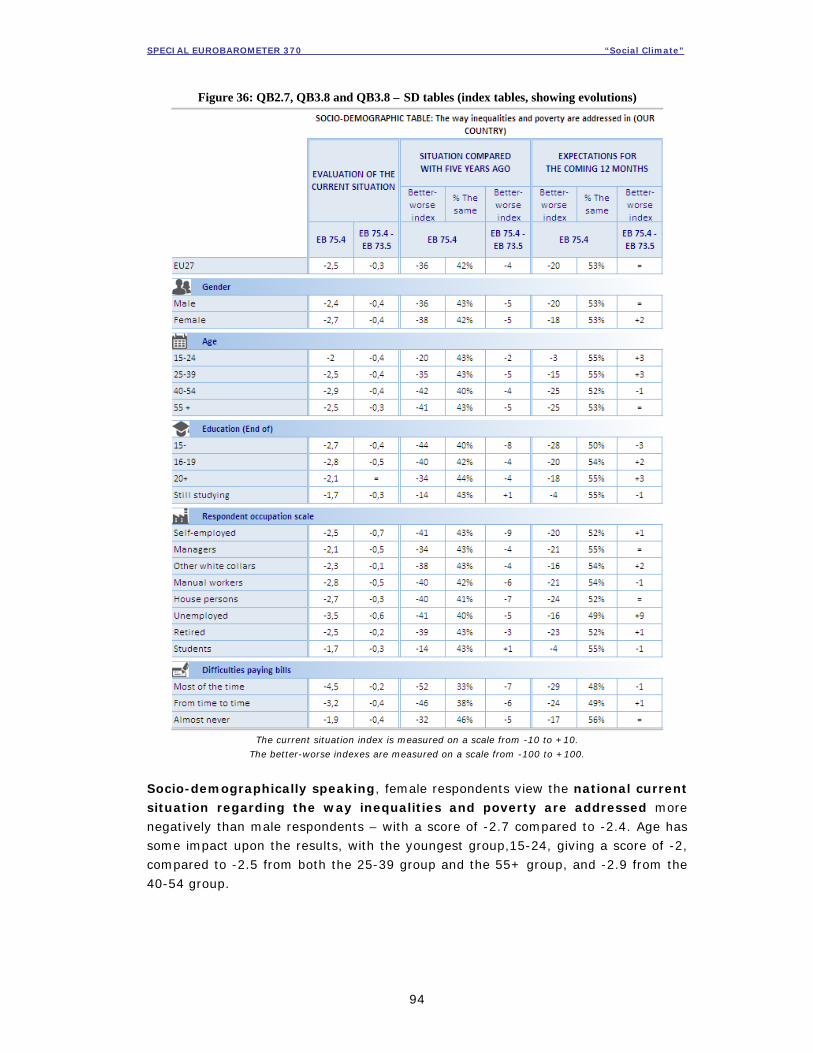
SPECIAL EUROBAROMETER 370 “Social Climate”
94
Figure 36: QB2.7, QB3.8 and QB3.8 – SD tables (index tables, showing evolutions)
The current situation index is measured on a scale from -10 to +10.
The better-worse indexes are measured on a scale from -100 to +100.
Socio-demographically speaking, female respondents view the national current
situation regarding the way inequalities and poverty are addressed more
negatively than male respondents – with a score of -2.7 compared to -2.4. Age has
some impact upon the results, with the youngest group,15-24, giving a score of -2,
compared to -2.5 from both the 25-39 group and the 55+ group, and -2.9 from the
40-54 group.

SPECIAL EUROBAROMETER 370 “Social Climate”
95
Education has also an impact, with those who finished their studies at age 15 or
younger and those who finished between 16-19 giving scores of -2.7 and -2.8
respectively. Those who finished at 20 or over returned a score of -2.1 and the
current students a score of -1.7. A distinct difference is noticed in the answers given
by those who experience frequent financial difficulties, with a score of -4.5 and those
who almost never do, with one of -1.9.
No positive evolutions were observed here. The largest negative evolutions came
from the self-employed (-0.7) and the unemployed (-0.6).
The same patterns indicated above may also be observed in the five-year
comparison table, where major evolutions can be found in scores given by the self-
employed (-9) and students (the only positive evolution of +1).
While levels of optimism are generally low regarding the next twelve months, the
same patterns are again observed – with scores worsening for those in financial
difficulty and getting better as the level of education increases. It is interesting to
note a number of positive evolutions in these results as well, particularly from the
unemployed, whose score rises by +9 to -16.

SPECIAL EUROBAROMETER 370 “Social Climate”
96
CONCLUSIONS
The results for social protection and inclusion are, encouragingly, either
slightly more positive or less negative than those supplied by the general
situation results, although not as positive as those recorded, in general, for
the personal situation.
On average, healthcare sees a negative evolution of -0.1 for the current situation
and -4 for the situation now as compared to five years ago, while the EU average for
the twelve-month expectations has evolved positively by +1. In this instance, we
note patterns which appear frequently throughout the final section of the report:
indexes for the current situation, and the comparison with the situation as it was five
years ago have generally decreased since last year’s survey – except for
unemployment benefits –, whereas EU27 averages regarding the twelve-month
expectations have increased since last year’s report for all the subjects analysed in
this chapter, except for the last one, the way inequalities and poverty are addressed
in their countries (stable).
Pension provision is, overall, seen in a negative light for the current situation, as are
unemployment benefits. However, the latter have seen a positive evolution of +0.2
on last year’s score. Unemployment benefits, in particular, highlight another pattern
which emerges from this chapter: even though unemployed people often return very
negative scores, the evolution of these scores for expectations for the coming twelve
months is frequently positive. This indicates that the situation regarding social
protection and inclusion is seen as better for the near future.
Young people are less likely to be negative regarding the topic of cultural differences,
perhaps due to increasingly multicultural societies in Europe in recent decades. This
question drew the least varied responses out of all of those asked in this chapter.
Reasons can be either because it is a sensitive issue or one which does not impact
upon respondents’ perceived quality of life in the same way that financial,
employment or government-based decisions do. These can be compared to answers
far more positive and negative in other questions. Despite this, though, negative
evolutions were still observed.
For the most analysed subjects of this chapter, the Member States appearing at the
top and bottom of each ranking relating to the current situation were similar to those
seen elsewhere throughout this report: Benelux and Nordic countries at the top of
the ranking and Eastern countries plus Greece at the bottom of the list. However,
there is an exception, for relations between people from different cultural and
religious backgrounds or nationalities: in this case, Slovakia, Bulgaria and Latvia are
amongst the countries at the top of the ranking, while Denmark, Belgium and France
are at the bottom.
SPECIAL EUROBAROMETER 370 “Social Climate”
97
THREE AGGREGATE MEASURES OF THE SOCIAL
CLIMATE
We can now analyse the aggregate scores for each of the three individual sections
analysed in this report: personal situation, general situation, and social protection
and inclusion. And then, to the overall score, that summarises in one score the
results of all dimensions analysed in the survey.
These scores relate to the current situation and their evolution from the last wave
of analysis is also examined.
As the result of the report from last year, across the European Union, there is a
distinct difference between the three sections examined in this report. Respondents’
opinion on their personal situation is relatively good, with a positive score of 2.7 at
EU level. This represents an increase of +0.2 from last year’s result. The picture
related to the general situation, with a negative index (-2.8), indicates that,
overall, the perception of Europeans on the general situation in their country is
pessimistic. This score represents also a drop of -0.1 from last year survey. The
aggregate score for social protection and inclusion is also negative; however, the
overall perception on this matter is less pessimistic than for the general situation,
with a score of -0.8, representing a decrease of -0.1 point since last year.
Finally, the overall score that summarises the results of all dimensions from the
three different sections is negative, -0.6. But it should be noted that this score
represents a slight improvement since 2010 of 0.1 point.

SPECIAL EUROBAROMETER 370 “Social Climate”
98
Figure 37: Overall country ranking of the current situation
The current situation index is measured on a scale from -10 to +10.
The better-worse indexes are measured on a scale from -100 to +100.

SPECIAL EUROBAROMETER 370 “Social Climate”
99
The country by country analysis confirms the large differences of situation between
Member States. In the above table, the results are ranked by the overall score and,
as in the last year’s report; they show a certain similarity between the Member
States at the top and at the bottom of this index (overall score) and that which
relates to the personal situation (Benelux, Nordic countries, Austria, Germany and
the UK at the top of the list and Eastern countries, Lithuania and Latvia, Portugal and
Greece at the bottom of the list). Sweden’s score of 6.3 puts it at the top of the
personal situation ranking, followed by Denmark (5.7), Finland (5.5), Luxembourg
(5.4), the Netherlands (5.3), and Belgium (4.6). Here we see a confirmation of the
repeated pattern, often observed in the survey, with Nordic and Benelux Member
States scoring well in relation to individual citizens’ situations. These positive results
also contrast sharply with the lowest-scoring Member States on the list: Bulgaria
(-1.2), Hungary, Romania (both -1) and Greece (-0.9), which are the only Member
States generating negative scores in this particular index.
Generally speaking, the indexes have increased in an absolute majority of Member
States (15), stayed stable in six countries, and decreased in six others: in most
countries, respondents’ feeling regarding their personal situation is better than it was
last year. Even if these evolutions are moderate, it seems that Europeans are less
affected by the consequences of the crisis on their personal life than in May 2010.
The evolution was strongest in Italy (+0.9) and Malta (+0.6), the latter being a
Member State which has experienced a strong improvement with regard to
employment. Improvements were also recorded in Germany (+0.5), Romania,
Estonia, Finland and Belgium (all +0.4), among others. There were negative
evolutions in Cyprus and Slovakia (both -0.4), Hungary, Slovenia and Ireland (all
-0.3).
The overall general situation index has stayed quite stable since last year: it
gathered more modest positive scores and a large number of considerably more
negative ones than those for the personal situation: as might have been expected,
Europeans are more inclined to be more negative about the general situation in their
country than about their own personal situation. Austria leads the ranking with 1.6,
followed by Sweden with 1, the Netherlands with 0.8, Germany with 0.7, Denmark
with 0.3 and Luxembourg with 0.1. The 21 other Member States had negative scores
on this index, the most negative ones being recorded in Greece (-6.8), Romania
(-6.6), Ireland (-5.4), Portugal (-5.3), Hungary (-5.2) and Lithuania (-5.1). There is
considerable similarity between the positions on the ranking of Member States
between this index and the personal situation index.

SPECIAL EUROBAROMETER 370 “Social Climate”
100
Strong positive evolutions are observed in Germany (+1.2), Austria (+0.6), Belgium
(+0.5), Italy and the Netherlands (both +0.4). Positive evolutions were also noted in
Luxembourg, Lithuania and Hungary. In 18 Member States, the general situation
index has decreased since May 2010: the strongest negative evolutions were found
in Spain, Slovakia (both -1.2), Slovenia, Malta and the UK (all -0.9). Sweden and
Denmark, both relatively high-scoring Member States for the current general
situation, both saw negative evolutions – of -0.1 and -0.5 respectively. Bulgaria is
the only country in which the index stayed stable (-3.6).
The majority of the countries recorded negative scores for the topic related to the
social protection and inclusion, but it should be noted that, generally, these
scores are less negative than those for the general situation. Germany, Sweden and
Estonia are exceptions here: they are the only Member States which have a lower
index of social protection and inclusion situation compared to the general situation
index (respectively 0.7, 1 and -0.8 for the general situation index, compared to 0.4,
0.2 and -2 for the social protection and inclusion index). The highest positive scores
were recorded in relation to social protection and inclusion in Luxembourg (3.8),
Austria (2.7), the Netherlands (2.3), Belgium (1.7) and Denmark (1.2). The lowest
scores came from Greece (-4.9), Romania (-4.7), Latvia (-3.6), Hungary (-3.5) and
Bulgaria (-3.4). Again, we see similarities between the ranking of the Member States
in relation to the scores for the personal situation and the general situation (Benelux
and the Nordic countries at the top of the list and Eastern countries, Latvia,
Lithuania, Portugal and Greece, at the bottom of the list).
Here, positive evolutions were noted in Italy (+0.7), which showed reasonably strong
evolutions in all three categories – personal situation; general situation; social
protection and inclusion –, Luxembourg (+0.6), Germany and Austria (+0.4 both).
However, the majority of the evolutions were negative – in 18 Member States in
total –, most notably in the Czech Republic (-1.3), Slovakia (-1.1), Estonia and Spain
(both -0.9), Latvia and Cyprus (both -0.7).
Finally, in terms of the overall ranking that summarises the index scores of all
dimensions analysed in the report, Luxembourg was the highest-ranking Member
State on the list, with an overall score of 2.8. It was followed by Austria (2.7), the
Netherlands (2.5), Sweden (2.2), Denmark (2.1), Germany (1.4), Belgium (1.2) and
Finland (1.1). This group of Member States, geographically quite closely-clustered,
recorded the only positive scores in the overall score index. The UK gave the least
negative score (-0.1), followed by Malta and Estonia (both with -0.3). The most
negative overall scores came from Greece (-4.6), Romania (-4.4), Hungary (-3.6),
Bulgaria (-3) and Lithuania (-2.9). Portugal and Latvia both followed with -2.7.

SPECIAL EUROBAROMETER 370 “Social Climate”
101
Despite the slight improvement of the overall index at EU level, the detailed country
analysis reveals that 10 countries recorded positive evolutions, vs. 17 where the
evolutions were negative. The top-ranking three Member States all showed positive
evolution from the last wave of analysis. The strongest positive evolutions for the
overall score were noted in Germany and Italy, with +0.7. The strongest negative
evolutions came from Cyprus and Slovakia, both with -0.9, the Czech Republic with
-0.8 and Spain with -0.7. When the overall scores ranged from 2.5 for Luxembourg
to -4.5 in Romania in May 2010, they now range from 2.8 (Luxembourg) to -4.6
(Greece): the gap has widened between the top and the bottom countries.
The analysis of these aggregate indexes tells us that, at a time where the European
economy is getting better after severe months of recession, the impact of this
economic improvement is starting to make itself felt in European respondents’
opinions on their personal situation, but not yet regarding their country’s
situation. The aggregate index of personal situation has improved since May
2010 at the EU level, and more precisely, in 15 Member States. However, Europeans’
evaluation of the general situation and the social protection and inclusion
situation in their countries has continued to deteriorate slightly since last year. The
combination of these movements in both directions makes the overall index of the
current situation quite stable, with a slight improvement of +0.1 point though.
It should be noted that the overall index describes only the indexes of the current
situation, and does not describe the general trend towards improvement when it
comes to predictions for the short term future: this will be described in the general
conclusion.
SPECIAL EUROBAROMETER 370 “Social Climate”
102
GENERAL CONCLUSIONS
This Eurobarometer survey, conducted for DG Employment for the third time, gives
us an overview of the social climate in the European Union. It measures the nature
of the current situation regarding key social concerns of European Union citizens,
their evaluations of how things have changed over the past five years, and their
expectations for the coming twelve months. In addition to analysing the levels of
the various indicators, it is particularly interesting to compare the results of this
year’s survey with those of the previous two years24: analysing these evolutions is an
effective indicator of the changing European public mood at a time of considerable
change. If the findings of this report were to be condensed into one key point, it
would be that opinion across the European Union varies greatly depending on the
topic analysed and that the general feelings of pessimism, optimism, satisfaction or
dissatisfaction at EU level often mask a number of strong differences between the
opinion within an individual country or socio-demographic category.
Three aspects of the social climate are explored in this report: Europeans’
perceptions on different social aspects of their personal lives, their opinions
of the general situation in their country, and, finally, their view of the state of
social protection and inclusion.
Respondents’ levels of satisfaction with their personal situation are relatively high
across the European Union. As we have seen in the previous two waves, citizens in
many Member States seem to be reasonably content with their personal situation,
especially those from the Nordic countries, Benelux, Austria, Germany and the UK, in
some cases.
The Member States which recorded low scores for the current situation this year are
the same as those from the last two years: Eastern countries, (and especially
Romania, Bulgaria and Hungary) two of the three Baltic states (Latvia and
Lithuania), along with Greece and Portugal. Generally speaking, this
geographical pattern appears often throughout the whole survey.
Analysing the evolutions from the previous survey reveals an important finding: 11
of the 12 indexes analysed in this first section have improved since the previous
wave, revealing a real positive change in Europeans’ perceptions of their personal
situation. Europeans seem to perceive the impact of an improvement of the
situation on their lives since May 2010.
Europeans perceptions about the general situation in their countries are, on the
whole, much more pessimistic than about their personal situation. The same
situation was seen in the analysis from the previous two reports.
Looking at the evolutions since May 2010, the six dimensions analysed in this section
can be divided into three categories: in a first group, the economic and employment
situations are seen in a less negative light than in May 2010, with positive evolutions
for all indexes – regarding the current, past five years, and next twelve months
24 The two previous surveys were conducted in May 2009 and May 2010.
SPECIAL EUROBAROMETER 370 “Social Climate”
103
situation –. Cost of living and the affordability of energy and of housing constitute a
second group with important negative evolutions from May 2010. Finally, the way
public administration is run is distinct from the others: this dimension has stayed
quite stable since the previous survey, conducted last year.
Even if they are still negative when evaluating the general situation of their
country, Europeans seem to feel that the economy is recovering, but that
daily life is more expensive than it was last year.
The geographical patterns described for the personal situation are generally kept
here, but with specificities, especially when it comes to the affordability of energy
and housing: Estonia’s scores, for example, are particularly high for these
dimensions; Finland, Belgium and UK are below the EU average for the affordability
of energy. This is also the case for the UK and Luxembourg in relation to the
affordability of housing.
In terms of evolution since last year, the current situation is generally evaluated
more negatively than in May 2010: only one topic, out of five analysed in this
section, had a positive evolution this year (unemployment benefits).
The evaluation that Europeans make of the situation compared to that of five years
ago has also declined – for four dimensions – or stayed stable – for the remaining
one – since May 2010. However, optimism that things will improve in the next twelve
months has progressed since the previous survey, with positive evolutions in the
scores: even if the evolutions since last year’s survey are moderate, the
general trend is clearly towards one of an improvement regarding the
situation of social protection and inclusion in the near future.
When clustering the countries at the top of the ranking for the current situation, in
this chapter, the country groups differ slightly from those from the personal and
general situation: The Nordic countries are surpassed by the Benelux countries and
Austria, and are sometimes at the middle of the country scale, especially in regard to
relations between people from different cultural and religious backgrounds or
nationalities. The situation is more comparable to the other sections at the bottom of
the scale, with Eastern countries (Romania, Bulgaria and Hungary), Latvia, Lithuania,
Portugal and Greece, almost always at the bottom of the scale.
In relation to socio-demographic data, a number of striking patterns are found. Men
are generally more satisfied with the current situation of all the topics analysed than
women. However, variations are more pronounced according to financial situation
and level of education, which almost invariably have an impact on citizens’ outlook
regarding the current situation, the situation compared to that of five years ago and
expectations for the coming twelve months: the fewer difficulties they have paying
their bills and the more educated respondents are, the better are their scores.
Students are frequently reported as the most satisfied and optimistic – or the least
dissatisfied and pessimistic – of all of the groups analysed. It is also encouraging to
see a trend for optimism relating to important matters of social protection, like
unemployment benefits, from those in more difficult financial situations and the
unemployed.

SPECIAL EUROBAROMETER 370 “Social Climate”
104
In summary, citizens sense a general improvement in their own situation,
although they are rarely as confident about the shape of the national
situation. On this latter point, though, it is important to note that all scores related
to the economic and employment situation of their country have progressed since
May 2010, reflecting the feeling that the EU is emerging slowly from the crisis.
However, Europeans perceive their daily life to be more expensive than last year,
with negative indexes related to cost of living and affordability of energy and housing
which have decreased since May 2010.
Perceptions regarding social protection and inclusion are quite contrasted: almost
always negatives, the indexes of the current situation and of the comparison with
five years ago have decreased since the previous survey, whereas optimism that
things will improve in the next twelve months have progressed. Europeans are still
struggling with important difficulties, but their expectations for the near future are
improving.

ANNEXES

TECHNICAL SPECIFICATIONS

SPECIAL EUROBAROMETER 370
“Social Climate” TECHNICAL SPECIFICATIONS
Between the 4th of June and the 19th of June 2011, TNS Opinion & Social, a consortium created between TNS plc and TNS opinion, carried out the wave 75.4 of the EUROBAROMETER, on request of the EUROPEAN COMMISSION, Directorate-General for Communication, “Research and Speechwriting”. The SPECIAL EUROBAROMETER 370 is part of wave 75.4 and covers the population of the respective nationalities of the European Union Member States, resident in each of the Member States and aged 15 years and over. The basic sample design applied in all states is a multi-stage, random (probability) one. In each country, a number of sampling points was drawn with probability proportional to population size (for a total coverage of the country) and to population density.
In order to do so, the sampling points were drawn systematically from each of the "administrative regional units", after stratification by individual unit and type of area. They thus represent the whole territory of the countries surveyed according to the EUROSTAT NUTS II (or equivalent) and according to the distribution of the resident population of the respective nationalities in terms of metropolitan, urban and rural areas. In each of the selected sampling points, a starting address was drawn, at random. Further addresses (every Nth address) were selected by standard "random route" procedures, from the initial address. In each household, the respondent was drawn, at random (following the "closest birthday rule"). All interviews were conducted face-to-face in people's homes and in the appropriate national language. As far as the data capture is concerned, CAPI (Computer Assisted Personal Interview) was used in those countries where this technique was available.
1

For each country a comparison between the sample and the universe was carried out. The Universe description was derived from Eurostat population data or from national statistics offices. For all countries surveyed, a national weighting procedure, using marginal and intercellular weighting, was carried out based on this Universe description. In all countries, gender, age, region and size of locality were introduced in the iteration procedure. For international weighting (i.e. EU averages), TNS Opinion & Social applies the official population figures as provided by EUROSTAT or national statistic offices. The total population figures for input in this post-weighting procedure are listed above. Readers are reminded that survey results are estimations, the accuracy of which, everything being equal, rests upon the sample size and upon the observed percentage. With samples of about 1,000 interviews, the real percentages vary within the following confidence limits:
Observed percentages 10% or 90% 20% or 80% 30% or 70% 40% or 60% 50%
Confidence limits ± 1.9 points ± 2.5 points ± 2.7 points ± 3.0 points ± 3.1 points
ABBR. COUNTRIES INSTITUTES N° INTERVIEWS
FIELDWORK DATES
POPULATION 15+
BE Belgium TNS Dimarso 1.025 04/06/2011 19/06/2011 8.939.546 BG Bulgaria TNS BBSS 1.002 04/06/2011 13/06/2011 6.537.510 CZ Czech Rep. TNS Aisa 1.019 04/06/2011 16/06/2011 9.012.443 DK Denmark TNS Gallup DK 1.012 04/06/2011 19/06/2011 4.561.264 DE Germany TNS Infratest 1.572 04/06/2011 19/06/2011 64.409.146 EE Estonia Emor 1.001 04/06/2011 19/06/2011 945.733 IE Ireland Ipsos MRBI 1.016 04/06/2011 17/06/2011 3.522.000 EL Greece TNS ICAP 1.000 04/06/2011 17/06/2011 8.693.566 ES Spain TNS Demoscopia 1.004 04/06/2011 19/06/2011 39.035.867 FR France TNS Sofres 1.068 07/06/2011 19/06/2011 47.756.439 IT Italy TNS Infratest 1.044 04/06/2011 18/06/2011 51.862.391 CY Rep. of Cyprus Synovate 504 04/06/2011 19/06/2011 660.400 LV Latvia TNS Latvia 1.019 04/06/2011 19/06/2011 1.447.866 LT Lithuania TNS Gallup Lithuania 1.026 04/06/2011 16/06/2011 2.829.740 LU Luxembourg TNS ILReS 507 04/06/2011 17/06/2011 404.907 HU Hungary TNS Hungary 1.004 04/06/2011 19/06/2011 8.320.614 MT Malta MISCO 500 04/06/2011 18/06/2011 335.476 NL Netherlands TNS NIPO 1.001 04/06/2011 19/06/2011 13.371.980
AT Austria Österreichisches Gallup-Institut 1.005 04/06/2011 19/06/2011 7.009.827
PL Poland TNS OBOP 1.000 04/06/2011 19/06/2011 32.413.735 PT Portugal TNS EUROTESTE 1.048 04/06/2011 19/06/2011 8.080.915 RO Romania TNS CSOP 1.075 04/06/2011 15/06/2011 18.246.731 SI Slovenia RM PLUS 1.019 04/06/2011 19/06/2011 1.759.701 SK Slovakia TNS Slovakia 1.000 04/06/2011 17/06/2011 4.549.955 FI Finland TNS Gallup Oy 1.008 04/06/2011 19/06/2011 4.440.004 SE Sweden TNS GALLUP 1.019 04/06/2011 19/06/2011 7.791.240 UK United Kingdom TNS UK 1.342 04/06/2011 19/06/2011 51.848.010
TOTAL EU27
26.840 04/06/2011 19/06/2011 408.787.006
2

QUESTIONNAIRE

QB1
12345
QB2
12
3
4
5
6
7
8
9
10
11
12
13
14
EB74.2 QA4a (ITEMS 11 TO 14) + EB73.5 QA2 (ITEMS 1 TO 10)
The employment situation in (OUR COUNTRY)
1 2 3 4 5
The financial situation of your household
1 2 3 4 5
Your personal job situation 1 2 3 4 5
The situation of the (NATIONALITY) economy
1 2 3 4 5
The way public administration runs in (OUR COUNTRY)
1 2 3 4 5
How affordable housing is in (OUR COUNTRY)
1 2 3 4 5
How affordable energy is in (OUR COUNTRY)
1 2 3 4 5
The way inequalities and poverty are addressed in (OUR COUNTRY)
1 2 3 4 5
Relations in (OUR COUNTRY) between people from different cultural or religious backgrounds or nationalities
1 2 3 4 5
The cost of living in (OUR COUNTRY)
1 2 3 4 5
Unemployment benefits in (OUR COUNTRY)
1 2 3 4 5
The provision of pensions in (OUR COUNTRY)
1 2 3 4 5
Health care provision in (OUR COUNTRY)
1 2 3 4 5The area you live in 1 2 3 4 5
EB74.2 QA1
How would you judge the current situation in each of the following?
(SHOW CARD WITH SCALE - ONE ANSWER PER LINE)
(READ OUT) Very good Rather good
Rather bad
Very bad DK
(READ OUT)
Very satisfiedFairly satisfiedNot very satisfied Not at all satisfied DK
B. SOCIAL CLIMATE
On the whole, are you very satisfied, fairly satisfied, not very satisfied or not at all satisfied with the life you lead?
1

QB3
123
4
5
67
8
9
10
11
12
1314
15 The employment situation in (OUR COUNTRY)
1 2 3 4
EB74.2 QA5a (ITEMS 1 AND 12 TO 15) + EB73.5 QA3 (ITEMS 2 TO 11)
Your personal job situation 1 2 3 4The financial situation of your household 1 2 3 4
The way public administration runs in (OUR COUNTRY)
1 2 3 4
The economic situation in (OUR COUNTRY)
1 2 3 4
How affordable energy is in (OUR COUNTRY)
1 2 3 4
How affordable housing is in (OUR COUNTRY)
1 2 3 4
Relations in (OUR COUNTRY) between people from different cultural or religious backgrounds or nationalities
1 2 3 4
The way inequalities and poverty are addressed in (OUR COUNTRY)
1 2 3 4
Unemployment benefits in (OUR COUNTRY)
1 2 3 4
The cost of living in (OUR COUNTRY) 1 2 3 4
The healthcare system in (OUR COUNTRY)
1 2 3 4
The provision of pensions in (OUR COUNTRY)
1 2 3 4
Your life in general 1 2 3 4The area you live in 1 2 3 4
What are your expectations for the next twelve months: will the next twelve months be better, worse or the same, when it comes to...?
(ONE ANSWER PER LINE)
(READ OUT) Better Worse Same DK
2

QB4
123
4
5
67
8
9
10
11
12
1314
15 The employment situation in (OUR COUNTRY)
1 2 3 4
EB73.5 QA4
Your personal job situation 1 2 3 4The financial situation of your household 1 2 3 4
The way public administration runs in (OUR COUNTRY)
1 2 3 4
The economic situation in (OUR COUNTRY)
1 2 3 4
How affordable energy is in (OUR COUNTRY)
1 2 3 4
How affordable housing is in (OUR COUNTRY)
1 2 3 4
Relations in (OUR COUNTRY) between people from different cultural or religious backgrounds or nationalities
1 2 3 4
The way inequalities and poverty are addressed in (OUR COUNTRY)
1 2 3 4
Unemployment benefits in (OUR COUNTRY)
1 2 3 4
The cost of living in (OUR COUNTRY) 1 2 3 4
The healthcare system in (OUR COUNTRY)
1 2 3 4
The provision of pensions in (OUR COUNTRY)
1 2 3 4
Your life in general 1 2 3 4The area you live in 1 2 3 4
Compared with five years ago, would you say things have improved, gotten worse or stayed about the same when it comes to…?
(ONE ANSWER PER LINE)
(READ OUT) Improved Got worse Stayed about the
same
DK
3

TABLES

%EB
75.4
Diff.EB
73.5
EB75.4
Diff.EB
73.5
EB75.4
Diff.EB
73.5
EB75.4
Diff.EB
73.5
EB75.4
Diff.EB
73.5
EB75.4
Diff.EB
73.5
EB75.4
Diff.EB
73.5EU 27 25 4 56 -2 14 -1 4 -1 1 0 81 2 18 -2
BE 38 6 52 -6 9 2 1 -2 0 0 90 0 10 0
BG 4 1 44 12 36 3 15 -8 1 -8 48 13 51 -5
CZ 13 0 68 2 16 -2 2 -1 1 1 81 2 18 -3
DK 67 -2 29 0 3 1 1 1 0 0 96 -2 4 2
DE 30 6 58 -5 9 -1 2 -1 1 1 88 1 11 -2
EE 13 5 63 -3 20 -2 4 0 0 0 76 2 24 -2
IE 46 2 45 -1 7 1 1 0 1 -2 91 1 8 1
EL 8 2 46 2 33 0 13 -4 0 0 54 4 46 -4
ES 23 4 59 -4 12 -4 6 4 0 0 82 0 18 0
FR 25 5 58 -7 12 2 4 0 1 0 83 -2 16 2
IT 13 6 68 5 17 -6 2 -4 0 -1 81 11 19 -10
CY 39 4 51 -2 8 -2 2 0 0 0 90 2 10 -2
LV 10 0 49 -1 31 -1 10 2 0 0 59 -1 41 1
LT 13 2 45 -1 29 -2 13 1 0 0 58 1 42 -1
LU 48 9 48 -11 3 1 1 1 0 0 96 -2 4 2
HU 6 -1 46 -2 35 1 12 1 1 1 52 -3 47 2
MT 37 8 48 -4 12 -2 3 -1 0 -1 85 4 15 -3
NL 54 8 41 -8 4 0 1 0 0 0 95 0 5 0
AT 21 -3 67 4 11 -1 1 0 0 0 88 1 12 -1
PL 12 -5 68 4 13 -2 4 1 3 2 80 -1 17 -1
PT 3 1 58 7 31 -4 8 -4 0 0 61 8 39 -8
RO 6 2 43 11 31 -6 19 -7 1 0 49 13 50 -13
SI 24 0 59 -6 13 4 4 2 0 0 83 -6 17 6
SK 15 -3 59 2 21 -1 4 1 1 1 74 -1 25 0
FI 41 2 56 -1 3 -1 0 0 0 0 97 1 3 -1
SE 57 4 40 -4 3 0 0 0 0 0 97 0 3 0
UK 40 3 50 -3 7 0 2 0 1 0 90 0 9 0
QB1 D'une façon générale, êtes-vous très satisfait(e), plutôt satisfait(e), plutôt pas satisfait(e) ou pas du tout satisfait(e) de la vie que vous menez ?
QB1 On the whole, are you very satisfied, fairly satisfied, not very satisfied or not at all satisfied with the life you lead?
QB1 Sind Sie insgesamt gesehen mit dem Leben, das Sie führen …?
Très satisfait(e)
Very satisfied
Sehr zufrieden
Plutôt satisfait(e)
Fairly satisfied
Ziemlich zufrieden
Plutôt pas satisfait(e)
Not very satisfied
Nicht sehr zufrieden
Pas du tout satisfait(e)
Not at all satisfied
Überhaupt nicht
zufrieden
Total 'Pas satisfait(e)'
Total 'Not satisfied'
Gesamt 'Nicht zufrieden'
NSP
DK
WN
Total 'Satisfait(e)'
Total 'Satisfied'
Gesamt 'Zufrieden'
1

%EB
75.4
Diff.EB
73.5
EB75.4
Diff.EB
73.5
EB75.4
Diff.EB
73.5
EB75.4
Diff.EB
73.5
EB75.4
Diff.EB
73.5
EB75.4
Diff.EB
73.5
EB75.4
Diff.EB
73.5EU 27 30 2 58 -1 10 -1 2 0 0 0 88 1 12 -1
BE 47 2 45 -2 7 0 1 0 0 0 92 0 8 0
BG 10 -2 51 -1 29 2 9 1 1 0 61 -3 38 3
CZ 22 -2 65 0 12 2 1 0 0 0 87 -2 13 2
DK 42 10 49 -10 8 1 1 0 0 -1 91 0 9 1
DE 37 4 53 -5 8 1 1 0 1 0 90 -1 9 1
EE 28 10 59 -8 11 -1 2 0 0 -1 87 2 13 -1
IE 50 -1 45 3 4 -1 1 -1 0 0 95 2 5 -2
EL 12 4 56 -5 23 -2 8 2 1 1 68 -1 31 0
ES 25 0 63 -1 10 0 2 1 0 0 88 -1 12 1
FR 39 6 53 -6 7 0 1 0 0 0 92 0 8 0
IT 10 0 73 7 14 -5 3 -1 0 -1 83 7 17 -6
CY 36 2 52 -1 9 -2 3 1 0 0 88 1 12 -1
LV 16 1 59 -5 19 2 5 2 1 0 75 -4 24 4
LT 25 5 59 -3 14 -2 2 0 0 0 84 2 16 -2
LU 57 6 38 -8 3 0 1 1 1 1 95 -2 4 1
HU 15 -1 61 -3 20 2 4 2 0 0 76 -4 24 4
MT 35 11 52 -8 10 -1 3 -1 0 -1 87 3 13 -2
NL 55 7 41 -7 3 -1 1 1 0 0 96 0 4 0
AT 35 1 58 0 6 -1 1 0 0 0 93 1 7 -1
PL 24 2 62 -2 11 0 2 0 1 0 86 0 13 0
PT 6 -1 80 4 13 -2 1 -1 0 0 86 3 14 -3
RO 17 4 61 -1 18 -1 4 -1 0 -1 78 3 22 -2
SI 12 -9 69 6 16 2 3 1 0 0 81 -3 19 3
SK 21 -4 60 -1 17 4 2 1 0 0 81 -5 19 5
FI 45 -1 53 2 2 -1 0 0 0 0 98 1 2 -1
SE 63 3 34 -2 3 0 0 -1 0 0 97 1 3 -1
UK 41 0 50 -1 6 0 3 1 0 0 91 -1 9 1
QB2.1 Comment jugez-vous la situation actuelle de chacun des domaines suivants ? L’endroit où vous habitez
QB2.1 How would you judge the current situation in each of the following? The area you live in
QB2.1 Wie beurteilen Sie die gegenwärtige Lage in den Bereichen auf dieser Liste? Die Gegend in der Sie leben
Très bonnePlutôt
mauvaiseNSP
Total 'Mauvaise'
Rather bad
Ziemlich schlecht
Très mauvaise
Very bad
Sehr schlecht
Very good
Sehr gut
Plutôt bonne
Rather good
Ziemlich gut
Total 'Bad'
Gesamt 'Schlecht'
DK
WN
Total 'Bonne'
Total 'Good'
Gesamt 'Gut'
2

%EB
75.4
Diff.EB
73.5
EB75.4
Diff.EB
73.5
EB75.4
Diff.EB
73.5
EB75.4
Diff.EB
73.5
EB75.4
Diff.EB
73.5
EB75.4
Diff.EB
73.5
EB75.4
Diff.EB
73.5EU 27 14 2 48 -4 27 1 10 2 1 -1 62 -2 37 3
BE 50 12 45 -10 5 -1 0 -1 0 0 95 2 5 -2
BG 1 0 27 3 48 -3 22 2 2 -2 28 3 70 -1
CZ 9 -3 55 -8 28 7 7 3 1 1 64 -11 35 10
DK 23 3 52 -2 20 -1 5 2 0 -2 75 1 25 1
DE 11 3 55 -1 28 -1 5 0 1 -1 66 2 33 -1
EE 5 2 54 -5 32 2 7 2 2 -1 59 -3 39 4
IE 8 2 34 -2 31 -3 22 1 5 2 42 0 53 -2
EL 1 0 21 -2 47 -1 30 2 1 1 22 -2 77 1
ES 14 0 58 -7 23 6 4 1 1 0 72 -7 27 7
FR 15 2 58 -8 22 6 4 1 1 -1 73 -6 26 7
IT 6 2 50 1 32 -3 11 0 1 0 56 3 43 -3
CY 11 5 47 -4 30 0 9 1 3 -2 58 1 39 1
LV 1 0 29 1 45 0 21 0 4 -1 30 1 66 0
LT 2 0 37 2 45 -5 13 4 3 -1 39 2 58 -1
LU 39 4 51 -6 6 2 2 1 2 -1 90 -2 8 3
HU 2 0 31 -4 47 2 19 2 1 0 33 -4 66 4
MT 25 5 56 -1 13 -1 4 0 2 -3 81 4 17 -1
NL 42 12 47 -12 9 -1 1 0 1 1 89 0 10 -1
AT 35 7 59 -5 5 -2 1 0 0 0 94 2 6 -2
PL 3 1 29 -1 44 -1 21 2 3 -1 32 0 65 1
PT 1 1 45 7 43 -6 10 -2 1 0 46 8 53 -8
RO 1 0 12 -4 46 -5 39 10 2 -1 13 -4 85 5
SI 9 2 59 0 25 -4 5 1 2 1 68 2 30 -3
SK 2 -5 36 -15 45 12 16 8 1 0 38 -20 61 20
FI 15 0 63 -1 18 0 3 1 1 0 78 -1 21 1
SE 22 -3 56 -4 19 6 3 2 0 -1 78 -7 22 8
UK 30 0 54 -3 10 1 5 3 1 -1 84 -3 15 4
QB2.2 Comment jugez-vous la situation actuelle de chacun des domaines suivants ? Les prestations des services de santé en (NOTRE PAYS)
QB2.2 How would you judge the current situation in each of the following? Health care provision in (OUR COUNTRY)
QB2.2 Wie beurteilen Sie die gegenwärtige Lage in den Bereichen auf dieser Liste? Das Gesundheitswesen in (UNSER LAND)
Très bonnePlutôt
mauvaiseNSP
Total 'Mauvaise'
Rather bad
Ziemlich schlecht
Très mauvaise
Very bad
Sehr schlecht
Very good
Sehr gut
Plutôt bonne
Rather good
Ziemlich gut
Total 'Bad'
Gesamt 'Schlecht'
DK
WN
Total 'Bonne'
Total 'Good'
Gesamt 'Gut'
3

%EB
75.4
Diff.EB
73.5
EB75.4
Diff.EB
73.5
EB75.4
Diff.EB
73.5
EB75.4
Diff.EB
73.5
EB75.4
Diff.EB
73.5
EB75.4
Diff.EB
73.5
EB75.4
Diff.EB
73.5EU 27 5 1 34 -1 36 -1 17 2 8 -1 39 0 53 1
BE 15 4 44 -4 32 2 6 0 3 -2 59 0 38 2
BG 0 0 10 -1 46 0 31 5 13 -4 10 -1 77 5
CZ 1 -2 24 -7 44 0 25 9 6 0 25 -9 69 9
DK 16 0 57 0 18 2 2 0 7 -2 73 0 20 2
DE 5 1 49 4 31 -4 10 1 5 -2 54 5 41 -3
EE 0 -1 22 -10 47 2 24 14 7 -5 22 -11 71 16
IE 6 2 32 -1 26 -3 14 1 22 1 38 1 40 -2
EL 0 0 5 -1 43 -3 49 3 3 1 5 -1 92 0
ES 2 -1 30 -7 45 4 15 3 8 1 32 -8 60 7
FR 4 0 35 -5 39 2 14 2 8 1 39 -5 53 4
IT 4 2 35 4 40 -4 16 -2 5 0 39 6 56 -6
CY 6 2 34 -5 31 -2 16 7 13 -2 40 -3 47 5
LV 0 -1 12 -4 45 -2 37 7 6 0 12 -5 82 5
LT 0 -1 12 -3 51 1 29 4 8 -1 12 -4 80 5
LU 31 11 44 -5 7 1 2 1 16 -8 75 6 9 2
HU 1 0 20 0 44 -5 29 7 6 -2 21 0 73 2
MT 3 -4 32 -6 32 9 15 9 18 -8 35 -10 47 18
NL 23 4 53 -3 14 1 4 3 6 -5 76 1 18 4
AT 19 5 56 -5 18 -1 2 -1 5 2 75 0 20 -2
PL 1 0 19 2 42 -4 30 4 8 -2 20 2 72 0
PT 0 0 10 -1 65 1 23 4 2 -4 10 -1 88 5
RO 1 1 5 -2 41 1 46 -1 7 1 6 -1 87 0
SI 5 2 38 -3 38 -2 15 4 4 -1 43 -1 53 2
SK 1 -2 17 -13 48 3 28 11 6 1 18 -15 76 14
FI 4 0 47 -8 38 7 5 3 6 -2 51 -8 43 10
SE 5 -1 48 -1 30 4 9 3 8 -5 53 -2 39 7
UK 6 -2 39 2 26 1 12 4 17 -5 45 0 38 5
QB2.3 Comment jugez-vous la situation actuelle de chacun des domaines suivants ? Le système des retraites en (NOTRE PAYS)
QB2.3 How would you judge the current situation in each of the following? The provision of pensions in (OUR COUNTRY)
QB2.3 Wie beurteilen Sie die gegenwärtige Lage in den Bereichen auf dieser Liste? Die Rentenversorgung in (UNSER LAND)
Très bonnePlutôt
mauvaiseNSP
Total 'Mauvaise'
Rather bad
Ziemlich schlecht
Très mauvaise
Very bad
Sehr schlecht
Very good
Sehr gut
Plutôt bonne
Rather good
Ziemlich gut
Total 'Bad'
Gesamt 'Schlecht'
DK
WN
Total 'Bonne'
Total 'Good'
Gesamt 'Gut'
4

%EB
75.4
Diff.EB
73.5
EB75.4
Diff.EB
73.5
EB75.4
Diff.EB
73.5
EB75.4
Diff.EB
73.5
EB75.4
Diff.EB
73.5
EB75.4
Diff.EB
73.5
EB75.4
Diff.EB
73.5EU 27 6 1 31 1 32 -2 16 1 15 -1 37 2 48 -1
BE 21 7 51 3 19 -5 5 0 4 -5 72 10 24 -5
BG 0 0 12 3 41 1 33 5 14 -9 12 3 74 6
CZ 2 -2 19 -8 42 1 28 10 9 -1 21 -10 70 11
DK 12 -4 56 1 21 3 4 2 7 -2 68 -3 25 5
DE 10 4 51 7 24 -7 5 -3 10 -1 61 11 29 -10
EE 1 0 15 0 41 -4 27 10 16 -6 16 0 68 6
IE 15 3 39 3 21 -1 13 -3 12 -2 54 6 34 -4
EL 0 0 7 1 43 -2 46 5 4 -4 7 1 89 3
ES 1 -1 20 -6 48 2 24 5 7 0 21 -7 72 7
FR 6 1 38 -2 26 1 8 1 22 -1 44 -1 34 2
IT 4 2 22 2 41 -3 18 -2 15 1 26 4 59 -5
CY 3 0 31 1 28 -3 16 8 22 -6 34 1 44 5
LV 1 0 15 -8 41 4 31 7 12 -3 16 -8 72 11
LT 2 1 14 1 43 0 22 0 19 -2 16 2 65 0
LU 25 10 38 -5 8 0 1 0 28 -5 63 5 9 0
HU 1 0 11 -2 44 -4 36 10 8 -4 12 -2 80 6
MT 4 2 26 0 26 4 10 2 34 -8 30 2 36 6
NL 18 3 52 -2 14 -2 4 2 12 -1 70 1 18 0
AT 21 4 57 -1 13 -4 2 -1 7 2 78 3 15 -5
PL 2 1 18 -2 41 -1 24 4 15 -2 20 -1 65 3
PT 0 -1 13 2 57 -1 19 1 11 -1 13 1 76 0
RO 0 -1 5 -1 40 0 45 4 10 -2 5 -2 85 4
SI 12 6 41 3 30 -6 8 -1 9 -2 53 9 38 -7
SK 1 -1 16 -5 48 -1 24 5 11 2 17 -6 72 4
FI 6 0 41 -5 34 1 7 5 12 -1 47 -5 41 6
SE 4 0 37 -3 34 3 14 3 11 -3 41 -3 48 6
UK 10 2 33 5 19 0 11 0 27 -7 43 7 30 0
QB2.4 Comment jugez-vous la situation actuelle de chacun des domaines suivants ? Les allocations chômage en (NOTRE PAYS)
QB2.4 How would you judge the current situation in each of the following? Unemployment benefits in (OUR COUNTRY)
QB2.4 Wie beurteilen Sie die gegenwärtige Lage in den Bereichen auf dieser Liste? Die Arbeitslosenunterstützung in (UNSER LAND)
Très bonnePlutôt
mauvaiseNSP
Total 'Mauvaise'
Rather bad
Ziemlich schlecht
Très mauvaise
Very bad
Sehr schlecht
Very good
Sehr gut
Plutôt bonne
Rather good
Ziemlich gut
Total 'Bad'
Gesamt 'Schlecht'
DK
WN
Total 'Bonne'
Total 'Good'
Gesamt 'Gut'
5

%EB
75.4
Diff.EB
73.5
EB75.4
Diff.EB
73.5
EB75.4
Diff.EB
73.5
EB75.4
Diff.EB
73.5
EB75.4
Diff.EB
73.5
EB75.4
Diff.EB
73.5
EB75.4
Diff.EB
73.5EU 27 2 0 24 -4 44 -3 29 7 1 0 26 -4 73 4
BE 5 2 33 -4 46 -2 16 5 0 -1 38 -2 62 3
BG 0 0 7 -1 47 -3 45 6 1 -2 7 -1 92 3
CZ 1 0 17 -5 47 -9 34 13 1 1 18 -5 81 4
DK 6 -2 49 -8 37 6 6 3 2 1 55 -10 43 9
DE 3 -1 43 -4 43 3 9 1 2 1 46 -5 52 4
EE 1 0 11 -8 41 -15 46 24 1 -1 12 -8 87 9
IE 0 0 12 -2 42 -4 45 7 1 -1 12 -2 87 3
EL 0 0 4 -3 41 -1 55 4 0 0 4 -3 96 3
ES 1 0 16 -12 49 -1 34 14 0 -1 17 -12 83 13
FR 1 0 12 -6 52 -5 33 10 2 1 13 -6 85 5
IT 3 2 20 5 49 -7 28 0 0 0 23 7 77 -7
CY 1 0 17 -2 40 -14 42 17 0 -1 18 -2 82 3
LV 0 0 3 -10 32 -14 63 24 2 0 3 -10 95 10
LT 0 0 6 -3 49 -3 44 7 1 -1 6 -3 93 4
LU 3 0 31 -9 55 7 10 2 1 0 34 -9 65 9
HU 1 1 5 -1 44 -2 50 2 0 0 6 0 94 0
MT 0 -1 6 -8 45 -1 47 9 2 1 6 -9 92 8
NL 8 3 57 -3 28 -2 6 2 1 0 65 0 34 0
AT 8 0 53 -2 34 1 4 1 1 0 61 -2 38 2
PL 1 0 12 -4 46 -6 39 10 2 0 13 -4 85 4
PT 0 0 5 -3 56 0 39 3 0 0 5 -3 95 3
RO 0 -1 3 -3 38 0 58 4 1 0 3 -4 96 4
SI 0 0 13 -6 57 4 29 1 1 1 13 -6 86 5
SK 1 0 11 -10 47 -8 40 18 1 0 12 -10 87 10
FI 0 -1 30 -8 58 4 11 5 1 0 30 -9 69 9
SE 4 -2 68 -4 22 4 3 1 3 1 72 -6 25 5
UK 1 -2 29 -8 38 -2 29 11 3 1 30 -10 67 9
QB2.5 Comment jugez-vous la situation actuelle de chacun des domaines suivants ? Le coût de la vie en (NOTRE PAYS)
QB2.5 How would you judge the current situation in each of the following? The cost of living in (OUR COUNTRY)
QB2.5 Wie beurteilen Sie die gegenwärtige Lage in den Bereichen auf dieser Liste? Die Lebenshaltungskosten in (UNSER LAND)
Très bonnePlutôt
mauvaiseNSP
Total 'Mauvaise'
Rather bad
Ziemlich schlecht
Très mauvaise
Very bad
Sehr schlecht
Very good
Sehr gut
Plutôt bonne
Rather good
Ziemlich gut
Total 'Bad'
Gesamt 'Schlecht'
DK
WN
Total 'Bonne'
Total 'Good'
Gesamt 'Gut'
6

%EB
75.4
Diff.EB
73.5
EB75.4
Diff.EB
73.5
EB75.4
Diff.EB
73.5
EB75.4
Diff.EB
73.5
EB75.4
Diff.EB
73.5
EB75.4
Diff.EB
73.5
EB75.4
Diff.EB
73.5EU 27 5 0 47 -2 33 0 9 1 6 1 52 -2 42 1
BE 4 0 41 -6 43 5 10 2 2 -1 45 -6 53 7
BG 7 0 59 2 24 2 5 -1 5 -3 66 2 29 1
CZ 3 -2 37 -8 45 4 13 6 2 0 40 -10 58 10
DK 4 0 37 -2 47 -2 10 4 2 0 41 -2 57 2
DE 5 0 50 -2 34 1 5 0 6 1 55 -2 39 1
EE 5 1 67 -4 20 1 3 1 5 1 72 -3 23 2
IE 9 3 56 -1 21 -2 5 -1 9 1 65 2 26 -3
EL 4 1 35 -9 35 -1 24 9 2 0 39 -8 59 8
ES 6 -2 55 -4 27 1 7 4 5 1 61 -6 34 5
FR 1 -1 35 -3 46 1 10 0 8 3 36 -4 56 1
IT 5 3 42 4 39 -4 11 -1 3 -2 47 7 50 -5
CY 6 3 40 -16 35 4 16 8 3 1 46 -13 51 12
LV 5 -2 62 -4 25 4 6 2 2 0 67 -6 31 6
LT 4 -2 53 -5 24 0 6 2 13 5 57 -7 30 2
LU 15 3 63 -6 16 1 3 1 3 1 78 -3 19 2
HU 3 0 40 -5 37 -2 15 6 5 1 43 -5 52 4
MT 6 1 49 6 24 -8 8 2 13 -1 55 7 32 -6
NL 4 1 49 1 39 -4 6 1 2 1 53 2 45 -3
AT 10 1 50 0 32 0 5 -1 3 0 60 1 37 -1
PL 6 -2 49 -6 24 1 9 3 12 4 55 -8 33 4
PT 3 0 50 -3 30 0 5 -1 12 4 53 -3 35 -1
RO 3 -1 45 -1 24 2 14 0 14 0 48 -2 38 2
SI 3 -2 49 -5 38 6 6 -1 4 2 52 -7 44 5
SK 11 0 55 0 28 0 4 0 2 0 66 0 32 0
FI 3 0 53 3 38 -1 3 -1 3 -1 56 3 41 -2
SE 4 2 48 3 39 -6 8 1 1 0 52 5 47 -5
UK 8 -1 56 -2 24 2 6 0 6 1 64 -3 30 2
QB2.6 Comment jugez-vous la situation actuelle de chacun des domaines suivants ? Les rapports entre les personnes d’origines culturelles ou religieuses différentes ou de nationalités différentes en (NOTRE PAYS)
QB2.6 How would you judge the current situation in each of the following? Relations in (OUR COUNTRY) between people from different cultural or religious backgrounds or nationalities
QB2.6 Wie beurteilen Sie die gegenwärtige Lage in den Bereichen auf dieser Liste? Die Beziehungen zwischen Menschen mit unterschiedlichem kulturellen oder religiösen Hintergrund oder verschiedener Nationalitäten in (UNSER LAND)
Très bonnePlutôt
mauvaiseNSP
Total 'Mauvaise'
Rather bad
Ziemlich schlecht
Très mauvaise
Very bad
Sehr schlecht
Very good
Sehr gut
Plutôt bonne
Rather good
Ziemlich gut
Total 'Bad'
Gesamt 'Schlecht'
DK
WN
Total 'Bonne'
Total 'Good'
Gesamt 'Gut'
7

%EB
75.4
Diff.EB
73.5
EB75.4
Diff.EB
73.5
EB75.4
Diff.EB
73.5
EB75.4
Diff.EB
73.5
EB75.4
Diff.EB
73.5
EB75.4
Diff.EB
73.5
EB75.4
Diff.EB
73.5EU 27 2 0 25 -4 48 0 19 3 6 1 27 -4 67 3
BE 4 1 32 -1 47 -1 15 2 2 -1 36 0 62 1
BG 0 -1 11 -3 53 7 27 1 9 -4 11 -4 80 8
CZ 1 -1 24 -9 50 0 23 10 2 0 25 -10 73 10
DK 5 0 37 -2 44 0 12 3 2 -1 42 -2 56 3
DE 2 0 27 -1 51 -2 11 0 9 3 29 -1 62 -2
EE 0 -1 17 -3 52 -1 26 7 5 -2 17 -4 78 6
IE 3 1 28 -1 38 -3 20 3 11 0 31 0 58 0
EL 1 0 8 -3 46 -7 44 10 1 0 9 -3 90 3
ES 3 1 26 -13 51 6 16 6 4 0 29 -12 67 12
FR 1 0 15 -1 52 -1 29 2 3 0 16 -1 81 1
IT 4 2 29 2 49 0 15 -1 3 -3 33 4 64 -1
CY 2 -1 29 -8 46 1 19 7 4 1 31 -9 65 8
LV 1 1 6 -2 42 -3 47 4 4 0 7 -1 89 1
LT 0 0 5 -3 53 0 36 3 6 0 5 -3 89 3
LU 7 4 51 4 26 -10 5 2 11 0 58 8 31 -8
HU 0 0 14 1 46 -6 37 4 3 1 14 1 83 -2
MT 6 1 42 3 31 -2 9 1 12 -3 48 4 40 -1
NL 4 -1 39 -7 41 2 13 5 3 1 43 -8 54 7
AT 8 2 39 -8 40 3 8 2 5 1 47 -6 48 5
PL 1 -1 21 -5 49 -3 20 8 9 1 22 -6 69 5
PT 1 1 15 -3 62 3 15 -4 7 3 16 -2 77 -1
RO 0 0 8 0 44 2 43 -1 5 -1 8 0 87 1
SI 1 0 25 -3 54 1 17 2 3 0 26 -3 71 3
SK 2 0 19 -7 57 3 18 4 4 0 21 -7 75 7
FI 2 0 33 -7 52 3 10 4 3 0 35 -7 62 7
SE 3 -2 39 -6 44 4 10 3 4 1 42 -8 54 7
UK 3 -2 38 -3 37 1 12 2 10 2 41 -5 49 3
QB2.7 Comment jugez-vous la situation actuelle de chacun des domaines suivants ? La manière dont les inégalités et la pauvreté sont traitées en (NOTRE PAYS)
QB2.7 How would you judge the current situation in each of the following? The way inequalities and poverty are addressed in (OUR COUNTRY)
QB2.7 Wie beurteilen Sie die gegenwärtige Lage in den Bereichen auf dieser Liste? Die Art und Weise der Auseinandersetzung mit sozialer Benachteiligung und Armut in (UNSER LAND)
Très bonnePlutôt
mauvaiseNSP
Total 'Mauvaise'
Rather bad
Ziemlich schlecht
Très mauvaise
Very bad
Sehr schlecht
Very good
Sehr gut
Plutôt bonne
Rather good
Ziemlich gut
Total 'Bad'
Gesamt 'Schlecht'
DK
WN
Total 'Bonne'
Total 'Good'
Gesamt 'Gut'
8

%EB
75.4
Diff.EB
73.5
EB75.4
Diff.EB
73.5
EB75.4
Diff.EB
73.5
EB75.4
Diff.EB
73.5
EB75.4
Diff.EB
73.5
EB75.4
Diff.EB
73.5
EB75.4
Diff.EB
73.5EU 27 3 0 27 -4 45 0 22 5 3 -1 30 -4 67 5
BE 3 1 17 -8 52 -2 28 10 0 -1 20 -7 80 8
BG 8 1 40 -2 33 3 15 2 4 -4 48 -1 48 5
CZ 23 0 51 -4 20 2 4 1 2 1 74 -4 24 3
DK 4 -1 47 -6 40 7 6 0 3 0 51 -7 46 7
DE 2 0 36 3 49 -3 11 0 2 0 38 3 60 -3
EE 23 -5 59 0 13 4 3 1 2 0 82 -5 16 5
IE 1 0 19 -2 40 -9 36 12 4 -1 20 -2 76 3
EL 0 0 6 -1 43 -5 50 7 1 -1 6 -1 93 2
ES 6 1 45 -12 35 7 8 3 6 1 51 -11 43 10
FR 1 0 16 -11 52 3 26 9 5 -1 17 -11 78 12
IT 3 2 25 1 50 -1 19 1 3 -3 28 3 69 0
CY 0 -1 9 -5 42 -3 48 11 1 -2 9 -6 90 8
LV 12 -4 61 -1 18 4 7 3 2 -2 73 -5 25 7
LT 0 -1 10 1 52 3 36 -3 2 0 10 0 88 0
LU 4 1 49 -2 35 -2 6 2 6 1 53 -1 41 0
HU 1 1 8 2 43 -4 48 1 0 0 9 3 91 -3
MT 1 0 7 -4 42 -11 48 15 2 0 8 -4 90 4
NL 6 -1 58 2 26 -2 6 2 4 -1 64 1 32 0
AT 9 1 54 -3 29 -1 5 1 3 2 63 -2 34 0
PL 1 -1 16 -3 48 -4 31 8 4 0 17 -4 79 4
PT 0 0 4 -4 64 -1 31 5 1 0 4 -4 95 4
RO 0 -1 7 -3 42 -2 47 7 4 -1 7 -4 89 5
SI 1 0 27 -3 55 5 16 -1 1 -1 28 -3 71 4
SK 1 -1 20 -15 52 4 26 12 1 0 21 -16 78 16
FI 2 0 19 -17 60 7 18 11 1 -1 21 -17 78 18
SE 2 -2 34 -4 38 2 22 6 4 -2 36 -6 60 8
UK 2 0 19 -10 43 -3 34 15 2 -2 21 -10 77 12
QB2.8 Comment jugez-vous la situation actuelle de chacun des domaines suivants ? Le caractère abordable des coûts de l’énergie en (NOTRE PAYS)
QB2.8 How would you judge the current situation in each of the following? How affordable energy is in (OUR COUNTRY)
QB2.8 Wie beurteilen Sie die gegenwärtige Lage in den Bereichen auf dieser Liste? Bezahlbare Energie in (UNSER LAND)
Très bonnePlutôt
mauvaiseNSP
Total 'Mauvaise'
Rather bad
Ziemlich schlecht
Très mauvaise
Very bad
Sehr schlecht
Very good
Sehr gut
Plutôt bonne
Rather good
Ziemlich gut
Total 'Bad'
Gesamt 'Schlecht'
DK
WN
Total 'Bonne'
Total 'Good'
Gesamt 'Gut'
9

%EB
75.4
Diff.EB
73.5
EB75.4
Diff.EB
73.5
EB75.4
Diff.EB
73.5
EB75.4
Diff.EB
73.5
EB75.4
Diff.EB
73.5
EB75.4
Diff.EB
73.5
EB75.4
Diff.EB
73.5EU 27 2 0 23 -3 43 -2 28 6 4 -1 25 -3 71 4
BE 2 0 26 -3 49 -3 22 7 1 -1 28 -3 71 4
BG 3 -3 31 -2 38 5 20 3 8 -3 34 -5 58 8
CZ 6 0 38 1 39 0 16 -1 1 0 44 1 55 -1
DK 4 -2 58 -3 31 4 4 2 3 -1 62 -5 35 6
DE 4 0 52 0 31 0 6 0 7 0 56 0 37 0
EE 9 -2 47 -6 31 5 9 4 4 -1 56 -8 40 9
IE 5 4 30 4 35 -4 23 -3 7 -1 35 8 58 -7
EL 0 0 10 -1 49 0 40 2 1 -1 10 -1 89 2
ES 1 0 8 -11 44 -3 46 15 1 -1 9 -11 90 12
FR 0 -1 10 -8 54 -3 31 12 5 0 10 -9 85 9
IT 3 2 19 2 49 -3 26 2 3 -3 22 4 75 -1
CY 0 -1 4 -2 31 -6 63 9 2 0 4 -3 94 3
LV 7 -1 46 -2 33 2 11 2 3 -1 53 -3 44 4
LT 0 0 7 -1 43 0 46 3 4 -2 7 -1 89 3
LU 1 -1 10 -4 46 -1 39 8 4 -2 11 -5 85 7
HU 1 1 11 1 48 -3 38 1 2 0 12 2 86 -2
MT 0 -1 11 -5 42 0 43 8 4 -2 11 -6 85 8
NL 3 0 43 -3 42 -2 9 4 3 1 46 -3 51 2
AT 7 2 50 -3 34 0 6 1 3 0 57 -1 40 1
PL 1 0 10 0 41 -4 43 3 5 1 11 0 84 -1
PT 0 0 6 -3 61 -3 30 7 3 -1 6 -3 91 4
RO 0 0 8 -1 37 -3 48 6 7 -2 8 -1 85 3
SI 0 -1 11 -3 48 -1 39 6 2 -1 11 -4 87 5
SK 1 0 15 -9 46 1 36 8 2 0 16 -9 82 9
FI 1 0 24 -6 58 -2 17 9 0 -1 25 -6 75 7
SE 3 -1 52 -4 34 4 9 3 2 -2 55 -5 43 7
UK 2 0 17 -6 40 -3 35 11 6 -2 19 -6 75 8
QB2.9 Comment jugez-vous la situation actuelle de chacun des domaines suivants ? Le caractère abordable du coût du logement en (NOTRE PAYS)
QB2.9 How would you judge the current situation in each of the following? How affordable housing is in (OUR COUNTRY)
QB2.9 Wie beurteilen Sie die gegenwärtige Lage in den Bereichen auf dieser Liste? Erschwinglicher Wohnraum in (UNSER LAND)
Très bonnePlutôt
mauvaiseNSP
Total 'Mauvaise'
Rather bad
Ziemlich schlecht
Très mauvaise
Very bad
Sehr schlecht
Very good
Sehr gut
Plutôt bonne
Rather good
Ziemlich gut
Total 'Bad'
Gesamt 'Schlecht'
DK
WN
Total 'Bonne'
Total 'Good'
Gesamt 'Gut'
10

%EB
75.4
Diff.EB
73.5
EB75.4
Diff.EB
73.5
EB75.4
Diff.EB
73.5
EB75.4
Diff.EB
73.5
EB75.4
Diff.EB
73.5
EB75.4
Diff.EB
73.5
EB75.4
Diff.EB
73.5EU 27 4 1 37 -1 36 -2 17 2 6 0 41 0 53 0
BE 8 3 49 -1 32 1 10 -1 1 -2 57 2 42 0
BG 1 -1 33 5 39 0 12 -5 15 1 34 4 51 -5
CZ 2 -2 35 -5 41 3 17 4 5 0 37 -7 58 7
DK 9 1 52 -4 30 2 8 2 1 -1 61 -3 38 4
DE 9 2 57 3 25 -3 6 -1 3 -1 66 5 31 -4
EE 4 1 61 0 20 -2 4 1 11 0 65 1 24 -1
IE 1 0 21 3 33 -4 31 0 14 1 22 3 64 -4
EL 1 1 7 -1 44 1 47 -1 1 0 8 0 91 0
ES 1 -1 28 -10 43 2 23 10 5 -1 29 -11 66 12
FR 1 -1 38 -1 39 1 16 0 6 1 39 -2 55 1
IT 3 2 26 0 48 0 21 0 2 -2 29 2 69 0
CY 4 2 41 2 30 -11 16 5 9 2 45 4 46 -6
LV 0 0 14 4 44 0 36 -7 6 3 14 4 80 -7
LT 0 0 18 -1 43 -6 18 2 21 5 18 -1 61 -4
LU 12 3 65 9 16 -10 5 1 2 -3 77 12 21 -9
HU 3 2 29 -3 41 -3 19 2 8 2 32 -1 60 -1
MT 1 -3 39 -3 32 4 15 1 13 1 40 -6 47 5
NL 3 1 45 1 35 -8 12 4 5 2 48 2 47 -4
AT 10 0 60 1 24 0 4 -1 2 0 70 1 28 -1
PL 2 0 30 -4 39 -2 17 2 12 4 32 -4 56 0
PT 0 0 15 -1 60 1 16 -2 9 2 15 -1 76 -1
RO 0 0 9 2 40 -3 44 0 7 1 9 2 84 -3
SI 1 -1 32 -7 41 1 21 8 5 -1 33 -8 62 9
SK 2 -1 35 -5 44 4 13 2 6 0 37 -6 57 6
FI 2 -2 57 -2 33 2 5 1 3 1 59 -4 38 3
SE 8 -1 59 2 23 2 4 1 6 -4 67 1 27 3
UK 4 1 39 -2 30 -3 15 5 12 -1 43 -1 45 2
QB2.10 Comment jugez-vous la situation actuelle de chacun des domaines suivants ? Le fonctionnement de l’administration publique en (NOTRE PAYS)
QB2.10 How would you judge the current situation in each of the following? The way public administration runs in (OUR COUNTRY)
QB2.10 Wie beurteilen Sie die gegenwärtige Lage in den Bereichen auf dieser Liste? Das Funktionieren der öffentlichen Verwaltung in (UNSER LAND)
Très bonnePlutôt
mauvaiseNSP
Total 'Mauvaise'
Rather bad
Ziemlich schlecht
Très mauvaise
Very bad
Sehr schlecht
Very good
Sehr gut
Plutôt bonne
Rather good
Ziemlich gut
Total 'Bad'
Gesamt 'Schlecht'
DK
WN
Total 'Bonne'
Total 'Good'
Gesamt 'Gut'
11

%EB
75.4
Diff.EB
73.5
EB75.4
Diff.EB
73.5
EB75.4
Diff.EB
73.5
EB75.4
Diff.EB
73.5
EB75.4
Diff.EB
73.5
EB75.4
Diff.EB
73.5
EB75.4
Diff.EB
73.5EU 27 4 2 26 4 39 -5 28 -1 3 0 30 6 67 -6
BE 4 2 49 25 36 -20 10 -6 1 -1 53 27 46 -26
BG 0 0 6 2 47 -1 45 -1 2 0 6 2 92 -2
CZ 0 -1 13 -3 47 -1 39 5 1 0 13 -4 86 4
DK 3 -2 46 4 42 -1 6 -1 3 0 49 2 48 -2
DE 17 14 63 16 16 -20 2 -9 2 -1 80 30 18 -29
EE 2 2 37 11 46 -11 13 -2 2 0 39 13 59 -13
IE 0 0 4 -2 24 -6 71 9 1 -1 4 -2 95 3
EL 0 0 0 -3 21 -5 79 8 0 0 0 -3 100 3
ES 0 0 3 -3 41 -3 56 6 0 0 3 -3 97 3
FR 0 -1 16 4 54 -2 24 -2 6 1 16 3 78 -4
IT 3 2 16 3 50 -7 30 1 1 1 19 5 80 -6
CY 2 1 24 -5 44 -8 29 13 1 -1 26 -4 73 5
LV 0 0 3 0 36 3 60 -3 1 0 3 0 96 0
LT 0 0 6 3 59 7 32 -12 3 2 6 3 91 -5
LU 13 5 72 6 11 -10 1 0 3 -1 85 11 12 -10
HU 1 1 6 2 45 0 47 -4 1 1 7 3 92 -4
MT 1 -2 24 -6 45 5 21 2 9 1 25 -8 66 7
NL 8 3 59 8 28 -10 4 -2 1 1 67 11 32 -12
AT 9 3 69 17 17 -18 3 -2 2 0 78 20 20 -20
PL 1 -1 26 -11 47 5 20 8 6 -1 27 -12 67 13
PT 0 0 3 0 49 -5 47 5 1 0 3 0 96 0
RO 0 0 2 0 34 1 61 -1 3 0 2 0 95 0
SI 0 0 8 -12 50 -4 41 16 1 0 8 -12 91 12
SK 0 -2 14 -7 50 -1 34 10 2 0 14 -9 84 9
FI 2 0 55 3 37 -3 5 0 1 0 57 3 42 -3
SE 26 12 61 -5 9 -5 1 -1 3 -1 87 7 10 -6
UK 1 -1 16 5 44 1 35 -6 4 1 17 4 79 -5
QB2.11 Comment jugez-vous la situation actuelle de chacun des domaines suivants ? La situation de l’économie (NATIONALITE)
QB2.11 How would you judge the current situation in each of the following? The situation of the (NATIONALITY) economy
QB2.11 Wie beurteilen Sie die gegenwärtige Lage in den Bereichen auf dieser Liste? Die Lage der (NATIONALEN) Wirtschaft
Très bonnePlutôt
mauvaiseNSP
Total 'Mauvaise'
Rather bad
Ziemlich schlecht
Très mauvaise
Very bad
Sehr schlecht
Very good
Sehr gut
Plutôt bonne
Rather good
Ziemlich gut
Total 'Bad'
Gesamt 'Schlecht'
DK
WN
Total 'Bonne'
Total 'Good'
Gesamt 'Gut'
12

%EB
75.4
Diff.EB
73.5
EB75.4
Diff.EB
73.5
EB75.4
Diff.EB
73.5
EB75.4
Diff.EB
73.5
EB75.4
Diff.EB
73.5
EB75.4
Diff.EB
73.5
EB75.4
Diff.EB
73.5EU 27 13 0 43 0 15 -2 9 0 20 2 56 0 24 -2
BE 24 6 48 -5 11 -1 3 -1 14 1 72 1 14 -2
BG 3 -2 40 4 25 -4 18 0 14 2 43 2 43 -4
CZ 10 1 45 -2 14 -2 6 1 25 2 55 -1 20 -1
DK 45 -3 33 0 8 0 6 1 8 2 78 -3 14 1
DE 17 0 47 1 9 -4 5 -2 22 5 64 1 14 -6
EE 11 0 39 3 10 0 3 -3 37 0 50 3 13 -3
IE 10 -3 35 -4 14 1 17 1 24 5 45 -7 31 2
EL 1 -1 27 1 24 -4 20 5 28 -1 28 0 44 1
ES 11 3 41 -5 18 -2 13 1 17 3 52 -2 31 -1
FR 11 1 45 -2 11 -1 4 -1 29 3 56 -1 15 -2
IT 5 1 56 7 23 -4 9 -1 7 -3 61 8 32 -5
CY 12 3 31 -9 12 2 9 4 36 0 43 -6 21 6
LV 6 -1 44 1 20 0 13 -2 17 2 50 0 33 -2
LT 4 -1 32 1 22 -2 19 2 23 0 36 0 41 0
LU 23 -9 52 5 4 -2 2 1 19 5 75 -4 6 -1
HU 2 -1 24 -1 29 0 25 0 20 2 26 -2 54 0
MT 10 -4 49 4 14 0 3 -5 24 5 59 0 17 -5
NL 23 -4 41 2 9 -1 4 0 23 3 64 -2 13 -1
AT 25 3 53 -2 9 -3 2 -1 11 3 78 1 11 -4
PL 6 -2 48 1 20 0 8 0 18 1 54 -1 28 0
PT 1 0 42 -1 34 2 8 -2 15 1 43 -1 42 0
RO 2 -1 23 1 21 -2 22 -1 32 3 25 0 43 -3
SI 9 -4 51 7 16 -5 10 1 14 1 60 3 26 -4
SK 10 1 44 -6 17 -1 7 1 22 5 54 -5 24 0
FI 43 2 30 -6 9 -1 3 -1 15 6 73 -4 12 -2
SE 46 1 35 5 8 0 3 -4 8 -2 81 6 11 -4
UK 19 -2 36 0 12 0 9 1 24 1 55 -2 21 1
QB2.12 Comment jugez-vous la situation actuelle de chacun des domaines suivants ? Votre situation professionnelle
QB2.12 How would you judge the current situation in each of the following? Your personal job situation
QB2.12 Wie beurteilen Sie die gegenwärtige Lage in den Bereichen auf dieser Liste? Ihre persönliche berufliche Situation
Très bonnePlutôt
mauvaiseNSP
Total 'Mauvaise'
Rather bad
Ziemlich schlecht
Très mauvaise
Very bad
Sehr schlecht
Very good
Sehr gut
Plutôt bonne
Rather good
Ziemlich gut
Total 'Bad'
Gesamt 'Schlecht'
DK
WN
Total 'Bonne'
Total 'Good'
Gesamt 'Gut'
13

%EB
75.4
Diff.EB
73.5
EB75.4
Diff.EB
73.5
EB75.4
Diff.EB
73.5
EB75.4
Diff.EB
73.5
EB75.4
Diff.EB
73.5
EB75.4
Diff.EB
73.5
EB75.4
Diff.EB
73.5EU 27 9 1 59 2 23 -2 6 -2 3 1 68 3 29 -4
BE 19 4 64 1 14 -4 2 -1 1 0 83 5 16 -5
BG 1 0 34 2 43 0 20 -1 2 -1 35 2 63 -1
CZ 5 1 58 -1 30 2 6 -1 1 -1 63 0 36 1
DK 36 1 50 -3 11 2 2 0 1 0 86 -2 13 2
DE 10 -1 68 7 17 -3 3 -2 2 -1 78 6 20 -5
EE 5 2 67 3 23 -3 4 -2 1 0 72 5 27 -5
IE 6 -2 57 1 25 1 9 0 3 0 63 -1 34 1
EL 2 0 36 0 39 -5 22 4 1 1 38 0 61 -1
ES 6 3 61 2 23 -7 8 1 2 1 67 5 31 -6
FR 6 1 65 -1 20 -2 4 -1 5 3 71 0 24 -3
IT 5 3 66 9 23 -6 4 -5 2 -1 71 12 27 -11
CY 6 1 55 -5 27 -1 12 7 0 -2 61 -4 39 6
LV 2 0 51 2 34 0 12 -2 1 0 53 2 46 -2
LT 1 -2 44 2 41 -2 13 2 1 0 45 0 54 0
LU 24 1 68 -2 4 -1 1 0 3 2 92 -1 5 -1
HU 1 1 29 -2 50 2 18 -2 2 1 30 -1 68 0
MT 3 -4 60 1 26 4 9 -1 2 0 63 -3 35 3
NL 28 2 57 -3 11 1 2 -1 2 1 85 -1 13 0
AT 16 2 65 3 16 -4 2 0 1 -1 81 5 18 -4
PL 3 0 53 0 29 -3 10 2 5 1 56 0 39 -1
PT 0 0 42 -1 47 1 7 -2 4 2 42 -1 54 -1
RO 1 0 39 7 37 -3 22 -4 1 0 40 7 59 -7
SI 3 0 60 0 29 0 5 -1 3 1 63 0 34 -1
SK 4 -1 53 -6 35 5 6 2 2 0 57 -7 41 7
FI 21 2 69 0 9 -1 1 -1 0 0 90 2 10 -2
SE 35 -3 56 8 6 -4 2 -1 1 0 91 5 8 -5
UK 14 2 62 -2 17 0 4 -1 3 1 76 0 21 -1
QB2.13 Comment jugez-vous la situation actuelle de chacun des domaines suivants ? La situation financière de votre ménage
QB2.13 How would you judge the current situation in each of the following? The financial situation of your household
QB2.13 Wie beurteilen Sie die gegenwärtige Lage in den Bereichen auf dieser Liste? Die finanzielle Situation Ihres Haushalts
Très bonnePlutôt
mauvaiseNSP
Total 'Mauvaise'
Rather bad
Ziemlich schlecht
Très mauvaise
Very bad
Sehr schlecht
Very good
Sehr gut
Plutôt bonne
Rather good
Ziemlich gut
Total 'Bad'
Gesamt 'Schlecht'
DK
WN
Total 'Bonne'
Total 'Good'
Gesamt 'Gut'
14

%EB
75.4
Diff.EB
73.5
EB75.4
Diff.EB
73.5
EB75.4
Diff.EB
73.5
EB75.4
Diff.EB
73.5
EB75.4
Diff.EB
73.5
EB75.4
Diff.EB
73.5
EB75.4
Diff.EB
73.5EU 27 2 1 22 5 44 -7 29 0 3 1 24 6 73 -7
BE 5 4 44 16 43 -15 7 -5 1 0 49 20 50 -20
BG 0 0 4 0 47 -1 46 2 3 -1 4 0 93 1
CZ 1 0 16 1 54 2 28 -3 1 0 17 1 82 -1
DK 3 -2 45 -1 46 4 4 -1 2 0 48 -3 50 3
DE 5 4 51 24 34 -22 5 -8 5 2 56 28 39 -30
EE 1 1 18 7 59 5 19 -13 3 0 19 8 78 -8
IE 0 0 3 -1 21 -9 75 10 1 0 3 -1 96 1
EL 0 0 2 -3 28 -12 70 15 0 0 2 -3 98 3
ES 1 1 2 -2 29 -8 68 9 0 0 3 -1 97 1
FR 0 -1 12 4 64 3 21 -7 3 1 12 3 85 -4
IT 3 2 15 4 49 -5 32 -1 1 0 18 6 81 -6
CY 2 1 14 -10 53 -4 28 15 3 -2 16 -9 81 11
LV 0 0 6 1 45 10 48 -11 1 0 6 1 93 -1
LT 0 0 6 2 57 9 34 -11 3 0 6 2 91 -2
LU 4 0 64 10 26 -8 3 0 3 -2 68 10 29 -8
HU 1 1 6 0 47 0 45 -1 1 0 7 1 92 -1
MT 0 -2 32 -7 45 10 16 0 7 -1 32 -9 61 10
NL 7 2 62 9 24 -11 4 -1 3 1 69 11 28 -12
AT 6 0 68 24 23 -20 2 -4 1 0 74 24 25 -24
PL 1 0 16 -4 51 -3 26 6 6 1 17 -4 77 3
PT 0 0 4 0 48 -7 47 6 1 1 4 0 95 -1
RO 0 0 5 2 33 -1 61 1 1 -2 5 2 94 0
SI 0 0 7 -3 46 -5 46 9 1 -1 7 -3 92 4
SK 1 0 12 1 49 -4 37 3 1 0 13 1 86 -1
FI 3 1 47 16 45 -12 4 -5 1 0 50 17 49 -17
SE 5 2 54 11 34 -9 5 -3 2 -1 59 13 39 -12
UK 1 0 17 -1 51 -2 27 3 4 0 18 -1 78 1
QB2.14 Comment jugez-vous la situation actuelle de chacun des domaines suivants ? La situation de l’emploi en (NOTRE PAYS)
QB2.14 How would you judge the current situation in each of the following? The employment situation in (OUR COUNTRY)
QB2.14 Wie beurteilen Sie die gegenwärtige Lage in den Bereichen auf dieser Liste? Die Lage auf dem Arbeitsmarkt in (UNSEREM LAND)
Très bonnePlutôt
mauvaiseNSP
Total 'Mauvaise'
Rather bad
Ziemlich schlecht
Très mauvaise
Very bad
Sehr schlecht
Very good
Sehr gut
Plutôt bonne
Rather good
Ziemlich gut
Total 'Bad'
Gesamt 'Schlecht'
DK
WN
Total 'Bonne'
Total 'Good'
Gesamt 'Gut'
15

%EB
75.4
Diff.EB
73.5
EB75.4
Diff.EB
73.5
EB75.4
Diff.EB
73.5
EB75.4
Diff.EB
73.5EU 27 26 1 14 -2 57 1 3 0
BE 30 6 11 -2 59 -3 0 -1
BG 19 3 12 -4 64 3 5 -2
CZ 14 -1 22 -1 62 1 2 1
DK 31 -3 4 0 64 2 1 1
DE 19 1 11 -4 67 3 3 0
EE 41 4 13 -5 45 2 1 -1
IE 25 -2 9 -1 62 2 4 1
EL 7 -5 49 2 42 2 2 1
ES 30 4 10 -4 57 -1 3 1
FR 32 4 9 -6 55 1 4 1
IT 24 1 13 1 58 1 5 -3
CY 25 4 19 1 51 -5 5 0
LV 32 5 13 -2 52 -5 3 2
LT 29 11 15 -13 51 1 5 1
LU 33 3 8 -5 57 4 2 -2
HU 16 -14 29 12 52 0 3 2
MT 23 -2 13 -2 56 4 8 0
NL 26 -1 10 -1 63 1 1 1
AT 21 -1 9 -1 68 2 2 0
PL 25 -2 15 3 54 -4 6 3
PT 11 -5 33 6 51 0 5 -1
RO 26 10 28 -12 42 1 4 1
SI 16 -4 17 -1 66 6 1 -1
SK 25 -2 20 4 53 -2 2 0
FI 28 3 4 -1 67 -2 1 0
SE 45 0 2 -1 52 2 1 -1
UK 34 0 13 -4 51 4 2 0
QB3.1 Welche Erwartungen haben Sie an die nächsten 12 Monate? Werden die nächsten 12 Monate besser, schlechter oder gleich sein, wenn es um Folgendes geht? Ihr Leben im Allgemeinen
QB3.1 Quelles sont vos attentes pour les douze prochains mois : les douze prochains mois seront-ils meilleurs, moins bons ou sans changement, en ce qui concerne … ? Votre vie en général
QB3.1 What are your expectations for the next twelve months: will the next twelve months be better, worse or the same, when it comes to...? Your life in general
Meilleurs Sans changement
Same
Gleich
NSP
DK
WN
Better
Besser
Moins bons
Worse
Schlechter
16

%EB
75.4
Diff.EB
73.5
EB75.4
Diff.EB
73.5
EB75.4
Diff.EB
73.5
EB75.4
Diff.EB
73.5EU 27 15 1 9 -1 74 0 2 0
BE 18 5 7 0 75 -4 0 -1
BG 17 5 6 -4 74 0 3 -1
CZ 10 -4 10 2 79 1 1 1
DK 13 -1 4 -3 83 5 0 -1
DE 7 -1 5 -3 87 4 1 0
EE 29 5 5 -3 65 -2 1 0
IE 9 -4 5 -2 83 5 3 1
EL 4 -6 41 9 54 -3 1 0
ES 18 3 7 -3 74 0 1 0
FR 19 0 3 0 77 1 1 -1
IT 19 4 13 0 65 -3 3 -1
CY 17 2 9 1 74 -1 0 -2
LV 21 6 6 -1 72 -5 1 0
LT 19 4 4 -4 74 -1 3 1
LU 13 -1 3 -4 83 6 1 -1
HU 14 -10 17 7 68 3 1 0
MT 17 0 5 -7 73 4 5 3
NL 12 0 8 0 79 0 1 0
AT 15 1 7 -2 77 1 1 0
PL 17 -4 7 1 73 2 3 1
PT 7 -3 22 4 68 -1 3 0
RO 22 9 16 -3 60 -6 2 0
SI 10 -2 14 -1 75 4 1 -1
SK 20 2 12 2 66 -5 2 1
FI 15 4 3 0 82 -4 0 0
SE 16 -1 4 0 79 1 1 0
UK 17 3 7 -4 74 1 2 0
QB3.2 Welche Erwartungen haben Sie an die nächsten 12 Monate? Werden die nächsten 12 Monate besser, schlechter oder gleich sein, wenn es um Folgendes geht? Die Gegend in der Sie leben
QB3.2 Quelles sont vos attentes pour les douze prochains mois : les douze prochains mois seront-ils meilleurs, moins bons ou sans changement, en ce qui concerne … ? L’endroit où vous habitez
QB3.2 What are your expectations for the next twelve months: will the next twelve months be better, worse or the same, when it comes to...? The area you live in
Meilleurs Sans changement
Same
Gleich
NSP
DK
WN
Better
Besser
Moins bons
Worse
Schlechter
17

%EB
75.4
Diff.EB
73.5
EB75.4
Diff.EB
73.5
EB75.4
Diff.EB
73.5
EB75.4
Diff.EB
73.5EU 27 12 0 30 -1 55 1 3 0
BE 13 0 13 -1 73 2 1 -1
BG 16 3 17 -6 59 8 8 -5
CZ 7 -5 45 17 47 -12 1 0
DK 13 2 22 -13 65 13 0 -2
DE 5 1 42 -12 50 11 3 0
EE 25 2 16 1 56 -1 3 -2
IE 9 0 37 -2 46 -1 8 3
EL 4 -4 63 9 32 -6 1 1
ES 15 0 20 2 63 -1 2 -1
FR 12 1 29 -2 55 1 4 0
IT 17 1 24 1 56 -1 3 -1
CY 17 5 14 -4 66 0 3 -1
LV 11 2 23 -11 63 9 3 0
LT 12 3 16 -15 67 11 5 1
LU 12 -3 18 0 67 6 3 -3
HU 12 -14 35 19 51 -5 2 0
MT 28 -4 10 -3 56 9 6 -2
NL 6 0 49 2 43 -3 2 1
AT 13 -2 18 -1 67 3 2 0
PL 12 1 22 2 62 -3 4 0
PT 7 -3 39 5 48 -3 6 1
RO 14 5 50 -4 32 -2 4 1
SI 7 -2 35 -2 55 3 3 1
SK 11 -6 48 24 39 -19 2 1
FI 8 1 16 -5 75 4 1 0
SE 13 -3 17 5 69 1 1 -3
UK 15 0 26 2 55 -1 4 -1
QB3.3 Welche Erwartungen haben Sie an die nächsten 12 Monate? Werden die nächsten 12 Monate besser, schlechter oder gleich sein, wenn es um Folgendes geht? Das Gesundheitswesen in (UNSER LAND)
QB3.3 Quelles sont vos attentes pour les douze prochains mois : les douze prochains mois seront-ils meilleurs, moins bons ou sans changement, en ce qui concerne … ? Les prestations des services de santé en (NOTRE PAYS)
QB3.3 What are your expectations for the next twelve months: will the next twelve months be better, worse or the same, when it comes to...? The healthcare system in (OUR COUNTRY)
Meilleurs Sans changement
Same
Gleich
NSP
DK
WN
Better
Besser
Moins bons
Worse
Schlechter
18

%EB
75.4
Diff.EB
73.5
EB75.4
Diff.EB
73.5
EB75.4
Diff.EB
73.5
EB75.4
Diff.EB
73.5EU 27 8 0 38 -4 48 5 6 -1
BE 10 -2 37 2 51 2 2 -2
BG 12 2 18 -6 55 8 15 -4
CZ 3 -2 58 12 36 -10 3 0
DK 7 3 28 0 61 -2 4 -1
DE 3 0 38 -11 55 12 4 -1
EE 23 11 16 -4 56 -2 5 -5
IE 4 -1 39 3 40 -5 17 3
EL 2 -1 80 -2 16 2 2 1
ES 10 2 34 -12 50 10 6 0
FR 9 -2 36 -18 50 20 5 0
IT 15 1 32 -2 48 2 5 -1
CY 12 5 23 -3 54 -2 11 0
LV 7 -1 32 -14 57 14 4 1
LT 13 9 24 -28 56 20 7 -1
LU 7 -3 28 -2 53 10 12 -5
HU 6 -11 49 25 41 -13 4 -1
MT 10 -5 20 2 49 3 21 0
NL 4 2 57 5 35 -2 4 -5
AT 12 1 25 -4 59 3 4 0
PL 9 1 27 5 58 -6 6 0
PT 4 -2 59 8 31 -7 6 1
RO 13 6 49 -17 31 9 7 2
SI 4 -4 49 7 42 -4 5 1
SK 10 -3 42 10 44 -8 4 1
FI 5 1 22 1 70 -2 3 0
SE 9 -2 13 0 74 9 4 -7
UK 8 0 38 1 41 2 13 -3
QB3.4 Welche Erwartungen haben Sie an die nächsten 12 Monate? Werden die nächsten 12 Monate besser, schlechter oder gleich sein, wenn es um Folgendes geht? Die Rentenversorgung in (UNSER LAND)
QB3.4 Quelles sont vos attentes pour les douze prochains mois : les douze prochains mois seront-ils meilleurs, moins bons ou sans changement, en ce qui concerne … ? Le système des retraites en (NOTRE PAYS)
QB3.4 What are your expectations for the next twelve months: will the next twelve months be better, worse or the same, when it comes to...? The provision of pensions in (OUR COUNTRY)
Meilleurs Sans changement
Same
Gleich
NSP
DK
WN
Better
Besser
Moins bons
Worse
Schlechter
19

%EB
75.4
Diff.EB
73.5
EB75.4
Diff.EB
73.5
EB75.4
Diff.EB
73.5
EB75.4
Diff.EB
73.5EU 27 9 1 33 -7 49 7 9 -1
BE 8 -1 25 -4 64 8 3 -3
BG 10 2 18 -5 55 9 17 -6
CZ 2 -2 56 3 37 -1 5 0
DK 7 1 23 -16 66 16 4 -1
DE 5 2 22 -29 66 27 7 0
EE 20 5 16 -4 53 2 11 -3
IE 5 0 49 1 36 -2 10 1
EL 2 -1 77 3 18 0 3 -2
ES 9 1 41 -9 43 7 7 1
FR 7 -1 28 -9 52 12 13 -2
IT 16 4 31 -1 44 -1 9 -2
CY 11 5 26 -1 46 -4 17 0
LV 8 2 37 -3 49 3 6 -2
LT 8 4 24 -27 57 25 11 -2
LU 12 3 15 -6 54 4 19 -1
HU 6 -9 55 30 34 -19 5 -2
MT 10 -2 18 2 42 -1 30 1
NL 3 1 48 -11 41 9 8 1
AT 13 -3 15 -5 65 7 7 1
PL 9 1 19 4 62 -5 10 0
PT 3 -1 61 7 27 -5 9 -1
RO 12 6 49 -15 31 8 8 1
SI 4 -4 45 7 45 -2 6 -1
SK 8 -4 41 5 44 -3 7 2
FI 8 4 18 2 68 -8 6 2
SE 17 -5 13 1 63 6 7 -2
UK 8 0 36 -3 40 7 16 -4
QB3.5 Welche Erwartungen haben Sie an die nächsten 12 Monate? Werden die nächsten 12 Monate besser, schlechter oder gleich sein, wenn es um Folgendes geht? Die Arbeitslosenunterstützung in (UNSER LAND)
QB3.5 Quelles sont vos attentes pour les douze prochains mois : les douze prochains mois seront-ils meilleurs, moins bons ou sans changement, en ce qui concerne … ? Les allocations chômage en (NOTRE PAYS)
QB3.5 What are your expectations for the next twelve months: will the next twelve months be better, worse or the same, when it comes to...? Unemployment benefits in (OUR COUNTRY)
Meilleurs Sans changement
Same
Gleich
NSP
DK
WN
Better
Besser
Moins bons
Worse
Schlechter
20
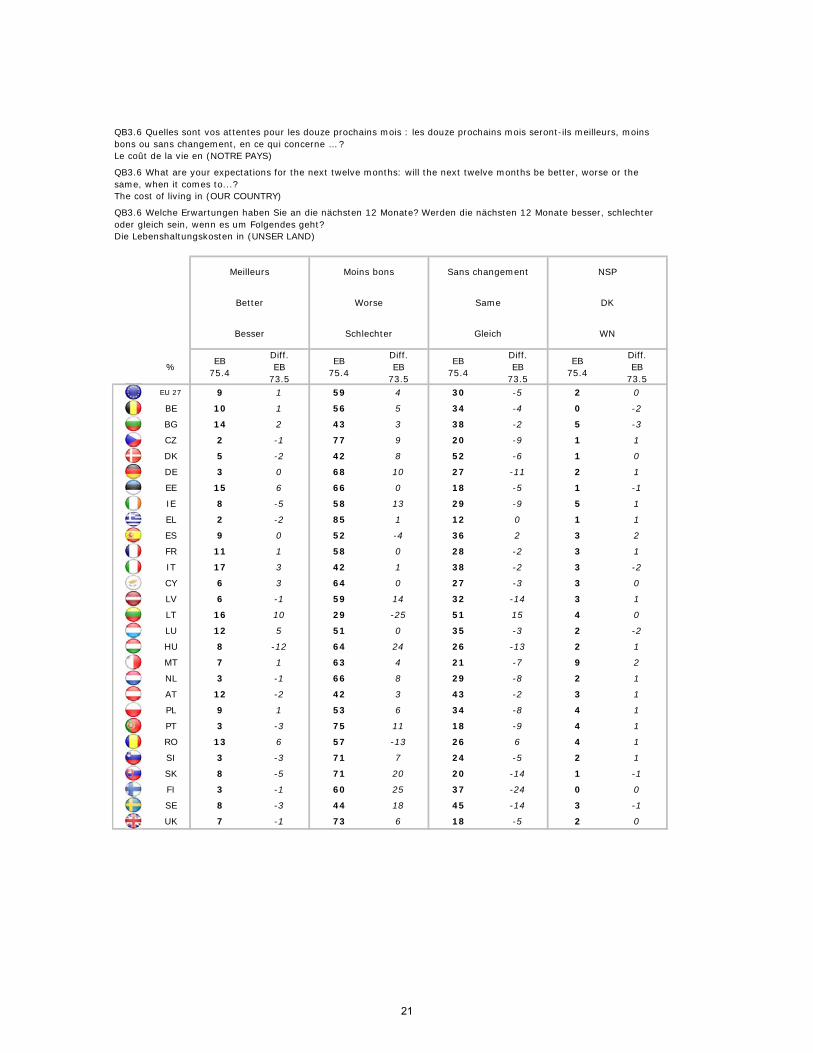
%EB
75.4
Diff.EB
73.5
EB75.4
Diff.EB
73.5
EB75.4
Diff.EB
73.5
EB75.4
Diff.EB
73.5EU 27 9 1 59 4 30 -5 2 0
BE 10 1 56 5 34 -4 0 -2
BG 14 2 43 3 38 -2 5 -3
CZ 2 -1 77 9 20 -9 1 1
DK 5 -2 42 8 52 -6 1 0
DE 3 0 68 10 27 -11 2 1
EE 15 6 66 0 18 -5 1 -1
IE 8 -5 58 13 29 -9 5 1
EL 2 -2 85 1 12 0 1 1
ES 9 0 52 -4 36 2 3 2
FR 11 1 58 0 28 -2 3 1
IT 17 3 42 1 38 -2 3 -2
CY 6 3 64 0 27 -3 3 0
LV 6 -1 59 14 32 -14 3 1
LT 16 10 29 -25 51 15 4 0
LU 12 5 51 0 35 -3 2 -2
HU 8 -12 64 24 26 -13 2 1
MT 7 1 63 4 21 -7 9 2
NL 3 -1 66 8 29 -8 2 1
AT 12 -2 42 3 43 -2 3 1
PL 9 1 53 6 34 -8 4 1
PT 3 -3 75 11 18 -9 4 1
RO 13 6 57 -13 26 6 4 1
SI 3 -3 71 7 24 -5 2 1
SK 8 -5 71 20 20 -14 1 -1
FI 3 -1 60 25 37 -24 0 0
SE 8 -3 44 18 45 -14 3 -1
UK 7 -1 73 6 18 -5 2 0
QB3.6 Welche Erwartungen haben Sie an die nächsten 12 Monate? Werden die nächsten 12 Monate besser, schlechter oder gleich sein, wenn es um Folgendes geht? Die Lebenshaltungskosten in (UNSER LAND)
QB3.6 Quelles sont vos attentes pour les douze prochains mois : les douze prochains mois seront-ils meilleurs, moins bons ou sans changement, en ce qui concerne … ? Le coût de la vie en (NOTRE PAYS)
QB3.6 What are your expectations for the next twelve months: will the next twelve months be better, worse or the same, when it comes to...? The cost of living in (OUR COUNTRY)
Meilleurs Sans changement
Same
Gleich
NSP
DK
WN
Better
Besser
Moins bons
Worse
Schlechter
21

%EB
75.4
Diff.EB
73.5
EB75.4
Diff.EB
73.5
EB75.4
Diff.EB
73.5
EB75.4
Diff.EB
73.5EU 27 13 1 24 0 58 -1 5 0
BE 12 2 36 -1 51 0 1 -1
BG 19 4 7 -2 66 -1 8 -1
CZ 5 -2 34 5 59 -4 2 1
DK 15 2 20 -3 64 2 1 -1
DE 8 1 20 -3 66 1 6 1
EE 24 5 7 2 65 -8 4 1
IE 9 -3 14 -3 68 4 9 2
EL 3 -5 58 12 38 -8 1 1
ES 12 -1 21 -5 62 4 5 2
FR 12 3 29 -1 52 -2 7 0
IT 21 1 27 4 47 -5 5 0
CY 7 3 38 16 52 -18 3 -1
LV 12 -1 11 2 75 -1 2 0
LT 11 2 7 -6 73 3 9 1
LU 13 -1 15 -1 70 3 2 -1
HU 10 -7 30 11 56 -7 4 3
MT 12 -7 14 1 60 4 14 2
NL 9 2 35 -11 54 9 2 0
AT 14 -3 24 -1 58 3 4 1
PL 14 0 14 5 64 -9 8 4
PT 4 -5 32 7 54 -4 10 2
RO 15 5 22 -1 52 -5 11 1
SI 5 -3 34 3 57 -2 4 2
SK 13 -5 18 -1 66 5 3 1
FI 9 1 23 -1 67 1 1 -1
SE 18 -4 19 2 62 3 1 -1
UK 13 2 24 -3 58 1 5 0
QB3.7 Welche Erwartungen haben Sie an die nächsten 12 Monate? Werden die nächsten 12 Monate besser, schlechter oder gleich sein, wenn es um Folgendes geht? Die Beziehungen zwischen Menschen mit unterschiedlichem kulturellen oder religiösen Hintergrund oder verschiedener Nationalitäten in (UNSER LAND)
QB3.7 Quelles sont vos attentes pour les douze prochains mois : les douze prochains mois seront-ils meilleurs, moins bons ou sans changement, en ce qui concerne … ? Les rapports entre les personnes d’origines culturelles ou religieuses différentes ou de nationalités différentes en (NOTRE PAYS)
QB3.7 What are your expectations for the next twelve months: will the next twelve months be better, worse or the same, when it comes to...? Relations in (OUR COUNTRY) between people from different cultural or religious backgrounds or nationalities
Meilleurs Sans changement
Same
Gleich
NSP
DK
WN
Better
Besser
Moins bons
Worse
Schlechter
22

%EB
75.4
Diff.EB
73.5
EB75.4
Diff.EB
73.5
EB75.4
Diff.EB
73.5
EB75.4
Diff.EB
73.5EU 27 11 0 31 0 53 0 5 0
BE 14 2 26 -3 58 2 2 -1
BG 14 0 15 -1 61 5 10 -4
CZ 3 -2 38 7 57 -5 2 0
DK 14 6 20 -10 64 4 2 0
DE 6 1 29 -11 59 9 6 1
EE 21 3 18 3 56 -6 5 0
IE 7 -2 25 2 57 -2 11 2
EL 3 -3 67 7 29 -5 1 1
ES 10 0 30 -4 55 2 5 2
FR 13 3 33 -4 50 0 4 1
IT 19 0 28 4 48 -3 5 -1
CY 10 4 34 2 53 -4 3 -2
LV 11 0 20 -5 65 5 4 0
LT 9 3 22 -14 63 11 6 0
LU 17 1 14 -7 62 7 7 -1
HU 11 -14 42 19 44 -6 3 1
MT 16 -2 15 -2 54 1 15 3
NL 6 -2 46 3 46 0 2 -1
AT 12 -3 24 0 58 1 6 2
PL 11 1 23 7 59 -10 7 2
PT 5 -3 49 11 39 -9 7 1
RO 13 6 39 -8 42 2 6 0
SI 5 -4 45 9 47 -5 3 0
SK 10 -5 32 5 56 1 2 -1
FI 10 0 24 3 65 -3 1 0
SE 19 0 14 3 63 -3 4 0
UK 12 -2 27 -1 56 4 5 -1
QB3.8 Welche Erwartungen haben Sie an die nächsten 12 Monate? Werden die nächsten 12 Monate besser, schlechter oder gleich sein, wenn es um Folgendes geht? Die Art und Weise der Auseinandersetzung mit sozialer Benachteiligung, die zu Armut in (UNSER LAND) führen kann
QB3.8 Quelles sont vos attentes pour les douze prochains mois : les douze prochains mois seront-ils meilleurs, moins bons ou sans changement, en ce qui concerne … ? La manière dont les inégalités et la pauvreté sont traitées en (NOTRE PAYS)
QB3.8 What are your expectations for the next twelve months: will the next twelve months be better, worse or the same, when it comes to...? The way inequalities and poverty are addressed in (OUR COUNTRY)
Meilleurs Sans changement
Same
Gleich
NSP
DK
WN
Better
Besser
Moins bons
Worse
Schlechter
23

%EB
75.4
Diff.EB
73.5
EB75.4
Diff.EB
73.5
EB75.4
Diff.EB
73.5
EB75.4
Diff.EB
73.5EU 27 9 0 53 7 34 -6 4 -1
BE 11 0 61 13 27 -13 1 0
BG 13 3 24 2 56 -1 7 -4
CZ 9 -4 29 7 61 -3 1 0
DK 5 -1 42 7 52 -5 1 -1
DE 5 1 72 9 21 -9 2 -1
EE 22 4 16 6 60 -9 2 -1
IE 10 -2 58 20 26 -16 6 -2
EL 3 0 81 7 15 -6 1 -1
ES 12 0 22 -3 61 2 5 1
FR 12 2 54 2 30 -2 4 -2
IT 18 3 34 4 43 -4 5 -3
CY 5 3 64 -4 27 2 4 -1
LV 10 0 16 2 72 -2 2 0
LT 6 2 48 -21 41 17 5 2
LU 12 3 56 6 28 -9 4 0
HU 8 -13 62 20 29 -7 1 0
MT 8 -1 58 0 25 -1 9 2
NL 4 -2 49 4 43 -3 4 1
AT 12 -1 46 6 39 -6 3 1
PL 8 1 47 3 39 -6 6 2
PT 3 -2 72 14 21 -12 4 0
RO 12 6 51 -7 30 -1 7 2
SI 5 -1 62 5 31 -3 2 -1
SK 9 -4 60 26 30 -20 1 -2
FI 3 -1 68 22 29 -19 0 -2
SE 9 -3 53 22 35 -17 3 -2
UK 6 -3 74 19 18 -13 2 -3
QB3.9 Welche Erwartungen haben Sie an die nächsten 12 Monate? Werden die nächsten 12 Monate besser, schlechter oder gleich sein, wenn es um Folgendes geht? Bezahlbare Energie in (UNSER LAND)
QB3.9 Quelles sont vos attentes pour les douze prochains mois : les douze prochains mois seront-ils meilleurs, moins bons ou sans changement, en ce qui concerne … ? Le caractère abordable des coûts de l’énergie en (NOTRE PAYS)
QB3.9 What are your expectations for the next twelve months: will the next twelve months be better, worse or the same, when it comes to...? How affordable energy is in (OUR COUNTRY)
Meilleurs Sans changement
Same
Gleich
NSP
DK
WN
Better
Besser
Moins bons
Worse
Schlechter
24

%EB
75.4
Diff.EB
73.5
EB75.4
Diff.EB
73.5
EB75.4
Diff.EB
73.5
EB75.4
Diff.EB
73.5EU 27 10 -1 43 5 42 -4 5 0
BE 9 1 52 10 38 -10 1 -1
BG 12 1 20 1 56 -1 12 -1
CZ 8 -2 38 0 53 2 1 0
DK 5 -4 28 6 65 -2 2 0
DE 4 -2 33 3 56 -2 7 1
EE 20 3 16 1 61 -4 3 0
IE 27 0 28 4 37 -4 8 0
EL 5 -3 64 2 30 1 1 0
ES 12 -3 45 2 40 0 3 1
FR 10 0 50 6 35 -5 5 -1
IT 17 3 34 3 44 -4 5 -2
CY 6 3 59 -1 32 -2 3 0
LV 12 -2 13 -1 72 3 3 0
LT 8 0 38 -11 48 11 6 0
LU 11 -1 58 15 29 -12 2 -2
HU 7 -13 57 19 33 -7 3 1
MT 5 -2 49 1 33 -3 13 4
NL 8 0 48 3 41 -4 3 1
AT 12 -2 37 5 47 -4 4 1
PL 10 0 41 4 43 -5 6 1
PT 3 -2 68 15 24 -12 5 -1
RO 13 6 46 -6 32 -1 9 1
SI 7 -7 52 5 37 1 4 1
SK 11 -4 53 16 35 -11 1 -1
FI 3 -1 60 19 37 -17 0 -1
SE 6 0 45 10 46 -9 3 -1
UK 10 -3 51 8 35 -3 4 -2
QB3.10 Welche Erwartungen haben Sie an die nächsten 12 Monate? Werden die nächsten 12 Monate besser, schlechter oder gleich sein, wenn es um Folgendes geht? Bezahlbare Energie in (UNSER LAND)
QB3.10 Quelles sont vos attentes pour les douze prochains mois : les douze prochains mois seront-ils meilleurs, moins bons ou sans changement, en ce qui concerne … ? Le caractère abordable du coût du logement en (NOTRE PAYS)
QB3.10 What are your expectations for the next twelve months: will the next twelve months be better, worse or the same, when it comes to...? How affordable housing is in (OUR COUNTRY)
Meilleurs Sans changement
Same
Gleich
NSP
DK
WN
Better
Besser
Moins bons
Worse
Schlechter
25

%EB
75.4
Diff.EB
73.5
EB75.4
Diff.EB
73.5
EB75.4
Diff.EB
73.5
EB75.4
Diff.EB
73.5EU 27 10 -1 25 -1 60 3 5 -1
BE 17 -2 29 4 53 1 1 -3
BG 19 2 8 -4 61 4 12 -2
CZ 5 -6 30 7 61 -2 4 1
DK 12 4 22 -13 65 10 1 -1
DE 4 0 14 -8 79 9 3 -1
EE 20 3 9 1 65 -1 6 -3
IE 8 0 25 -4 54 1 13 3
EL 5 -4 60 2 34 1 1 1
ES 9 -1 24 -3 64 5 3 -1
FR 11 1 24 -3 61 3 4 -1
IT 19 4 31 3 46 -5 4 -2
CY 10 6 17 0 67 -8 6 2
LV 13 -4 20 0 61 2 6 2
LT 8 2 15 -6 62 1 15 3
LU 15 0 8 -1 75 6 2 -5
HU 13 -15 27 8 54 6 6 1
MT 13 -2 19 0 54 -1 14 3
NL 9 -5 34 4 53 5 4 -4
AT 11 0 14 -1 73 1 2 0
PL 12 -1 19 7 61 -9 8 3
PT 3 -3 48 10 40 -9 9 2
RO 12 5 41 -10 39 2 8 3
SI 4 -6 30 2 61 4 5 0
SK 11 -6 23 0 62 6 4 0
FI 7 1 19 4 72 -5 2 0
SE 9 0 9 3 78 2 4 -5
UK 9 -6 26 -3 56 10 9 -1
QB3.11 Welche Erwartungen haben Sie an die nächsten 12 Monate? Werden die nächsten 12 Monate besser, schlechter oder gleich sein, wenn es um Folgendes geht? Das Funktionieren der öffentlichen Verwaltung in (UNSER LAND)
QB3.11 Quelles sont vos attentes pour les douze prochains mois : les douze prochains mois seront-ils meilleurs, moins bons ou sans changement, en ce qui concerne … ? Le fonctionnement de l’administration publique en (NOTRE PAYS)
QB3.11 What are your expectations for the next twelve months: will the next twelve months be better, worse or the same, when it comes to...? The way public administration runs in (OUR COUNTRY)
Meilleurs Sans changement
Same
Gleich
NSP
DK
WN
Better
Besser
Moins bons
Worse
Schlechter
26

%EB
75.4
Diff.EB
73.5
EB75.4
Diff.EB
73.5
EB75.4
Diff.EB
73.5
EB75.4
Diff.EB
73.5EU 27 20 -1 36 -4 40 5 4 0
BE 29 5 27 -11 43 7 1 -1
BG 25 7 27 -8 40 2 8 -1
CZ 9 -7 51 4 38 3 2 0
DK 31 -3 19 -6 48 8 2 1
DE 28 -2 15 -15 52 16 5 1
EE 43 4 20 -7 35 4 2 -1
IE 13 -2 59 8 23 -6 5 0
EL 3 -2 88 7 9 -4 0 -1
ES 16 2 43 -9 36 5 5 2
FR 15 -1 38 -8 42 9 5 0
IT 21 1 37 -1 40 2 2 -2
CY 11 4 58 3 30 -5 1 -2
LV 18 -6 31 -1 48 5 3 2
LT 18 5 26 -20 52 14 4 1
LU 28 4 20 -10 48 7 4 -1
HU 16 -16 43 13 39 2 2 1
MT 15 -6 36 4 33 -1 16 3
NL 30 0 28 -6 40 5 2 1
AT 31 2 16 -9 48 5 5 2
PL 15 -7 28 10 49 -4 8 1
PT 5 -3 71 13 20 -10 4 0
RO 15 7 53 -15 28 7 4 1
SI 10 -3 59 11 28 -8 3 0
SK 15 -8 47 13 36 -3 2 -2
FI 17 -12 34 10 48 2 1 0
SE 25 -26 14 5 58 22 3 -1
UK 21 -3 42 -1 33 4 4 0
QB3.12 Welche Erwartungen haben Sie an die nächsten 12 Monate? Werden die nächsten 12 Monate besser, schlechter oder gleich sein, wenn es um Folgendes geht? Die wirtschaftliche Lage in (UNSEREM LAND)
QB3.12 Quelles sont vos attentes pour les douze prochains mois : les douze prochains mois seront-ils meilleurs, moins bons ou sans changement, en ce qui concerne … ? La situation économique en (NOTRE PAYS)
QB3.12 What are your expectations for the next twelve months: will the next twelve months be better, worse or the same, when it comes to...? The economic situation in (OUR COUNTRY)
Meilleurs Sans changement
Same
Gleich
NSP
DK
WN
Better
Besser
Moins bons
Worse
Schlechter
27

%EB
75.4
Diff.EB
73.5
EB75.4
Diff.EB
73.5
EB75.4
Diff.EB
73.5
EB75.4
Diff.EB
73.5EU 27 19 2 10 -2 60 0 11 0
BE 22 3 5 -1 65 -1 8 -1
BG 17 4 10 -2 65 2 8 -4
CZ 8 -1 13 2 58 -2 21 1
DK 21 -1 3 0 74 2 2 -1
DE 16 1 5 -4 66 1 13 2
EE 31 2 5 -2 43 1 21 -1
IE 14 0 12 -1 58 -3 16 4
EL 5 -1 35 0 46 -1 14 2
ES 19 3 8 -5 65 -1 8 3
FR 23 3 4 -5 59 4 14 -2
IT 22 4 15 -2 59 0 4 -2
CY 10 3 13 0 56 -2 21 -1
LV 23 2 7 -5 57 2 13 1
LT 16 5 17 -15 51 10 16 0
LU 23 5 3 -3 59 -4 15 2
HU 10 -10 22 5 59 5 9 0
MT 13 -3 9 -2 53 0 25 5
NL 18 -2 9 0 54 -2 19 4
AT 20 4 6 -3 67 -1 7 0
PL 18 1 12 4 64 -5 6 0
PT 7 -4 28 5 58 -2 7 1
RO 13 5 24 -10 38 3 25 2
SI 10 -2 14 -1 69 3 7 0
SK 15 -4 14 3 56 -3 15 4
FI 16 4 7 2 72 -9 5 3
SE 32 0 2 0 62 1 4 -1
UK 22 1 9 1 55 -1 14 -1
QB3.13 Welche Erwartungen haben Sie an die nächsten 12 Monate? Werden die nächsten 12 Monate besser, schlechter oder gleich sein, wenn es um Folgendes geht? Ihre persönliche berufliche Situation
QB3.13 Quelles sont vos attentes pour les douze prochains mois : les douze prochains mois seront-ils meilleurs, moins bons ou sans changement, en ce qui concerne … ? Votre situation professionnelle
QB3.13 What are your expectations for the next twelve months: will the next twelve months be better, worse or the same, when it comes to...? Your personal job situation
Meilleurs Sans changement
Same
Gleich
NSP
DK
WN
Better
Besser
Moins bons
Worse
Schlechter
28

%EB
75.4
Diff.EB
73.5
EB75.4
Diff.EB
73.5
EB75.4
Diff.EB
73.5
EB75.4
Diff.EB
73.5EU 27 19 2 18 -2 60 0 3 0
BE 22 2 11 1 67 -2 0 -1
BG 20 5 17 -8 55 5 8 -2
CZ 10 0 30 3 57 -4 3 1
DK 22 0 4 -3 73 2 1 1
DE 14 1 12 -6 71 5 3 0
EE 36 4 13 -4 50 1 1 -1
IE 12 0 24 2 58 -3 6 1
EL 3 -2 61 0 33 0 3 2
ES 19 3 11 -5 67 2 3 0
FR 24 2 11 -4 61 0 4 2
IT 20 3 15 -2 62 2 3 -3
CY 9 3 29 1 58 -4 4 0
LV 26 2 15 -3 57 1 2 0
LT 18 6 17 -15 61 8 4 1
LU 22 3 6 -4 69 1 3 0
HU 12 -13 36 12 50 0 2 1
MT 10 -3 23 0 61 2 6 1
NL 19 0 14 -2 65 1 2 1
AT 20 3 11 -2 65 -2 4 1
PL 19 0 22 6 54 -7 5 1
PT 6 -4 42 11 48 -7 4 0
RO 19 8 33 -16 43 7 5 1
SI 9 -4 27 6 61 -3 3 1
SK 17 -4 26 9 53 -7 4 2
FI 18 4 10 2 72 -6 0 0
SE 30 -2 9 1 60 0 1 1
UK 22 1 19 1 56 -2 3 0
QB3.14 Welche Erwartungen haben Sie an die nächsten 12 Monate? Werden die nächsten 12 Monate besser, schlechter oder gleich sein, wenn es um Folgendes geht? Die finanzielle Situation Ihres Haushaltes
QB3.14 Quelles sont vos attentes pour les douze prochains mois : les douze prochains mois seront-ils meilleurs, moins bons ou sans changement, en ce qui concerne … ? La situation financière de votre ménage
QB3.14 What are your expectations for the next twelve months: will the next twelve months be better, worse or the same, when it comes to...? The financial situation of your household
Meilleurs Sans changement
Same
Gleich
NSP
DK
WN
Better
Besser
Moins bons
Worse
Schlechter
29

%EB
75.4
Diff.EB
73.5
EB75.4
Diff.EB
73.5
EB75.4
Diff.EB
73.5
EB75.4
Diff.EB
73.5EU 27 21 2 33 -7 41 5 5 0
BE 30 11 20 -18 49 8 1 -1
BG 19 2 28 -5 43 5 10 -2
CZ 9 -5 41 -3 46 6 4 2
DK 42 1 12 -7 44 6 2 0
DE 27 5 15 -18 51 12 7 1
EE 41 -2 15 -4 38 5 6 1
IE 14 -2 58 5 23 -3 5 0
EL 3 -1 86 3 10 -3 1 1
ES 21 3 37 -11 38 7 4 1
FR 19 2 31 -16 46 14 4 0
IT 22 2 36 -1 38 -1 4 0
CY 9 4 58 4 30 -5 3 -3
LV 23 -1 22 -6 52 6 3 1
LT 18 7 22 -27 54 19 6 1
LU 26 5 23 -15 47 11 4 -1
HU 16 -15 42 17 39 -2 3 0
MT 15 -6 26 0 40 1 19 5
NL 30 -2 22 -7 45 9 3 0
AT 31 4 16 -12 49 7 4 1
PL 14 -1 26 6 52 -7 8 2
PT 5 -5 69 13 22 -8 4 0
RO 14 7 53 -11 28 4 5 0
SI 10 -4 54 7 33 -2 3 -1
SK 20 -5 37 2 41 4 2 -1
FI 28 -3 20 -4 51 7 1 0
SE 42 -14 11 1 44 13 3 0
UK 17 1 44 -4 35 4 4 -1
QB3.15 Welche Erwartungen haben Sie an die nächsten 12 Monate? Werden die nächsten 12 Monate besser, schlechter oder gleich sein, wenn es um Folgendes geht? Die Lage auf dem Arbeitsmarkt in (UNSEREM LAND)
QB3.15 Quelles sont vos attentes pour les douze prochains mois : les douze prochains mois seront-ils meilleurs, moins bons ou sans changement, en ce qui concerne … ? La situation de l'emploi en (NOTRE PAYS)
QB3.15 What are your expectations for the next twelve months: will the next twelve months be better, worse or the same, when it comes to...? The employment situation in (OUR COUNTRY)
Meilleurs Sans changement
Same
Gleich
NSP
DK
WN
Better
Besser
Moins bons
Worse
Schlechter
30

%EB
75.4
Diff.EB
73.5
EB75.4
Diff.EB
73.5
EB75.4
Diff.EB
73.5
EB75.4
Diff.EB
73.5EU 27 28 1 30 -2 41 1 1 0
BE 36 9 23 -7 41 -2 0 0
BG 8 -1 56 5 35 -4 1 0
CZ 21 -1 34 0 45 2 0 -1
DK 47 -2 16 -1 36 2 1 1
DE 30 4 20 -9 49 5 1 0
EE 37 1 33 -3 29 1 1 1
IE 26 -12 33 7 41 6 0 -1
EL 6 -8 70 12 24 -4 0 0
ES 25 1 37 -1 37 -1 1 1
FR 30 1 32 -2 37 1 1 0
IT 19 2 24 -5 56 4 1 -1
CY 32 0 34 3 33 -4 1 1
LV 20 -4 55 2 24 1 1 1
LT 17 2 56 -6 26 4 1 0
LU 48 0 15 1 37 -1 0 0
HU 10 -2 51 -2 39 4 0 0
MT 35 -3 31 -3 33 6 1 0
NL 43 2 17 0 40 -2 0 0
AT 28 9 17 -6 55 -2 0 -1
PL 27 -1 31 5 40 -4 2 0
PT 11 -3 54 4 34 -1 1 0
RO 14 -1 57 1 28 0 1 0
SI 18 -3 37 -7 45 10 0 0
SK 24 -4 36 8 39 -5 1 1
FI 47 4 11 -3 41 -2 1 1
SE 63 1 11 -2 26 2 0 -1
UK 37 -4 25 0 37 4 1 0
QB4.1 Haben sich die Dinge im Vergleich zu vor fünf Jahren Ihrer Ansicht nach verbessert oder verschlechtert oder sind sie gleich geblieben, wenn es um Folgendes geht? Ihr Leben im Allgemeinen
QB4.1 Diriez-vous que, par rapport à il y a cinq ans, les choses se sont améliorées, déteriorées ou sont restées les mêmes en ce qui concerne … ? Votre vie en général
QB4.1 Compared with five years ago, would you say things have improved, gotten worse or stayed about the same when it comes to…? Your life in general
Se sont améliorées Sont restées les mêmes
Stayed about the same
Ist etwa gleich geblieben
NSP
DK
WN
Improved
Verbessert
Se sont détériorées
Got worse
Verschlechtert
31

%EB
75.4
Diff.EB
73.5
EB75.4
Diff.EB
73.5
EB75.4
Diff.EB
73.5
EB75.4
Diff.EB
73.5EU 27 20 -1 18 1 60 0 2 0
BE 22 3 13 0 65 -3 0 0
BG 12 0 32 3 55 -3 1 0
CZ 27 0 15 0 58 0 0 0
DK 23 2 12 -1 61 1 4 -2
DE 16 1 9 -5 74 6 1 -2
EE 36 1 14 -3 48 2 2 0
IE 20 -10 14 -1 65 11 1 0
EL 3 -11 57 16 39 -5 1 0
ES 24 1 26 7 48 -9 2 1
FR 27 1 11 -2 61 1 1 0
IT 13 0 27 3 59 -2 1 -1
CY 33 6 20 0 47 -5 0 -1
LV 22 0 23 -1 53 1 2 0
LT 19 5 15 -9 65 4 1 0
LU 29 -8 6 -2 64 9 1 1
HU 14 -9 27 2 58 7 1 0
MT 33 5 12 -6 53 2 2 -1
NL 25 2 10 -2 63 1 2 -1
AT 19 2 11 -2 70 1 0 -1
PL 28 -5 12 2 58 4 2 -1
PT 11 -4 33 5 54 -2 2 1
RO 18 -2 31 4 50 -2 1 0
SI 13 -3 31 1 55 2 1 0
SK 22 -2 21 5 56 -4 1 1
FI 31 3 5 -2 62 -2 2 1
SE 25 1 8 -2 62 2 5 -1
UK 19 -1 14 -1 62 2 5 0
QB4.2 Haben sich die Dinge im Vergleich zu vor fünf Jahren Ihrer Ansicht nach verbessert oder verschlechtert oder sind sie gleich geblieben, wenn es um Folgendes geht? Die Gegend in der Sie leben
QB4.2 Diriez-vous que, par rapport à il y a cinq ans, les choses se sont améliorées, déteriorées ou sont restées les mêmes en ce qui concerne … ? L’endroit où vous habitez
QB4.2 Compared with five years ago, would you say things have improved, gotten worse or stayed about the same when it comes to…? The area you live in
Se sont améliorées Sont restées les mêmes
Stayed about the same
Ist etwa gleich geblieben
NSP
DK
WN
Improved
Verbessert
Se sont détériorées
Got worse
Verschlechtert
32

%EB
75.4
Diff.EB
73.5
EB75.4
Diff.EB
73.5
EB75.4
Diff.EB
73.5
EB75.4
Diff.EB
73.5EU 27 11 -1 44 3 42 -2 3 0
BE 24 7 11 -3 64 -3 1 -1
BG 5 2 57 -3 34 3 4 -2
CZ 9 -9 46 13 44 -4 1 0
DK 16 1 33 -3 47 2 4 0
DE 5 1 59 -3 34 3 2 -1
EE 24 -2 30 3 42 0 4 -1
IE 7 -4 60 0 27 2 6 2
EL 2 -4 75 12 22 -8 1 0
ES 16 -5 34 12 48 -7 2 0
FR 9 0 44 -1 43 1 4 0
IT 10 1 41 6 47 -7 2 0
CY 29 0 17 -1 48 2 6 -1
LV 5 -3 58 -4 33 7 4 0
LT 8 2 41 -11 45 7 6 2
LU 21 -1 17 8 56 -8 6 1
HU 5 -2 60 4 33 -3 2 1
MT 48 -6 19 1 30 8 3 -3
NL 14 2 40 0 44 -2 2 0
AT 13 -2 23 0 62 1 2 1
PL 10 1 38 3 49 -1 3 -3
PT 10 -6 50 5 37 1 3 0
RO 2 -5 81 9 14 -5 3 1
SI 6 -1 50 0 42 1 2 0
SK 6 -7 63 25 29 -19 2 1
FI 17 1 29 0 52 -2 2 1
SE 17 1 33 2 44 -2 6 -1
UK 16 -6 30 7 49 0 5 -1
QB4.3 Haben sich die Dinge im Vergleich zu vor fünf Jahren Ihrer Ansicht nach verbessert oder verschlechtert oder sind sie gleich geblieben, wenn es um Folgendes geht? Das Gesundheitswesen in (UNSER LAND)
QB4.3 Diriez-vous que, par rapport à il y a cinq ans, les choses se sont améliorées, déteriorées ou sont restées les mêmes en ce qui concerne … ? Les prestations des services de santé en (NOTRE PAYS)
QB4.3 Compared with five years ago, would you say things have improved, gotten worse or stayed about the same when it comes to…? The healthcare system in (OUR COUNTRY)
Se sont améliorées Sont restées les mêmes
Stayed about the same
Ist etwa gleich geblieben
NSP
DK
WN
Improved
Verbessert
Se sont détériorées
Got worse
Verschlechtert
33

%EB
75.4
Diff.EB
73.5
EB75.4
Diff.EB
73.5
EB75.4
Diff.EB
73.5
EB75.4
Diff.EB
73.5EU 27 5 -1 52 4 35 -2 8 -1
BE 11 2 26 -3 60 3 3 -2
BG 2 0 51 2 35 2 12 -4
CZ 7 -5 49 12 38 -5 6 -2
DK 6 -2 24 5 64 1 6 -4
DE 2 0 49 -5 42 6 7 -1
EE 28 -4 29 9 35 0 8 -5
IE 5 -5 50 2 29 2 16 1
EL 0 -2 93 8 6 -5 1 -1
ES 5 -6 60 10 29 -5 6 1
FR 4 2 61 2 27 -6 8 2
IT 8 3 50 0 38 -2 4 -1
CY 29 0 26 5 31 -5 14 0
LV 3 -7 60 0 31 7 6 0
LT 3 0 66 -11 22 10 9 1
LU 7 -1 17 6 55 -2 21 -3
HU 4 -3 62 7 30 -2 4 -2
MT 11 -15 31 10 40 11 18 -6
NL 3 -1 61 12 29 -6 7 -5
AT 7 -2 33 -3 55 5 5 0
PL 6 0 40 10 47 -8 7 -2
PT 3 -2 71 11 22 -7 4 -2
RO 1 -5 80 5 14 0 5 0
SI 2 -2 59 1 34 -1 5 2
SK 9 -12 46 19 37 -10 8 3
FI 10 3 31 7 51 -14 8 4
SE 6 1 32 3 51 3 11 -7
UK 6 -2 43 6 33 -3 18 -1
QB4.4 Haben sich die Dinge im Vergleich zu vor fünf Jahren Ihrer Ansicht nach verbessert oder verschlechtert oder sind sie gleich geblieben, wenn es um Folgendes geht? Die Rentenversorgung in (UNSER LAND)
QB4.4 Diriez-vous que, par rapport à il y a cinq ans, les choses se sont améliorées, déteriorées ou sont restées les mêmes en ce qui concerne … ? Le système des retraites en (NOTRE PAYS)
QB4.4 Compared with five years ago, would you say things have improved, gotten worse or stayed about the same when it comes to…? The provision of pensions in (OUR COUNTRY)
Se sont améliorées Sont restées les mêmes
Stayed about the same
Ist etwa gleich geblieben
NSP
DK
WN
Improved
Verbessert
Se sont détériorées
Got worse
Verschlechtert
34

%EB
75.4
Diff.EB
73.5
EB75.4
Diff.EB
73.5
EB75.4
Diff.EB
73.5
EB75.4
Diff.EB
73.5EU 27 7 0 44 0 34 0 15 0
BE 13 3 18 -6 65 7 4 -4
BG 4 1 46 -2 32 3 18 -2
CZ 3 -4 64 16 25 -10 8 -2
DK 7 -1 35 5 50 -3 8 -1
DE 9 3 33 -16 46 12 12 1
EE 20 -4 29 3 30 5 21 -4
IE 14 -4 49 0 27 3 10 1
EL 0 -2 83 11 13 -7 4 -2
ES 5 -5 65 9 22 -7 8 3
FR 6 1 38 -6 32 3 24 2
IT 7 1 46 3 34 -3 13 -1
CY 17 0 27 3 31 -2 25 -1
LV 3 -7 63 10 22 -1 12 -2
LT 5 2 53 -15 21 9 21 4
LU 17 2 10 -1 40 -4 33 3
HU 2 -2 67 14 24 -9 7 -3
MT 9 -11 27 5 34 7 30 -1
NL 4 1 38 -1 37 -4 21 4
AT 15 1 20 -6 54 2 11 3
PL 7 -2 33 10 45 -7 15 -1
PT 2 -2 71 11 19 -5 8 -4
RO 1 -5 76 6 15 1 8 -2
SI 6 -3 45 -2 40 4 9 1
SK 6 -9 47 9 34 -4 13 4
FI 8 2 21 5 57 -12 14 5
SE 10 0 51 -5 25 5 14 0
UK 8 -2 33 3 33 1 26 -2
QB4.5 Haben sich die Dinge im Vergleich zu vor fünf Jahren Ihrer Ansicht nach verbessert oder verschlechtert oder sind sie gleich geblieben, wenn es um Folgendes geht? Die Arbeitslosenunterstützung in (UNSER LAND)
QB4.5 Diriez-vous que, par rapport à il y a cinq ans, les choses se sont améliorées, déteriorées ou sont restées les mêmes en ce qui concerne … ? Les allocations chômage en (NOTRE PAYS)
QB4.5 Compared with five years ago, would you say things have improved, gotten worse or stayed about the same when it comes to…? Unemployment benefits in (OUR COUNTRY)
Se sont améliorées Sont restées les mêmes
Stayed about the same
Ist etwa gleich geblieben
NSP
DK
WN
Improved
Verbessert
Se sont détériorées
Got worse
Verschlechtert
35

%EB
75.4
Diff.EB
73.5
EB75.4
Diff.EB
73.5
EB75.4
Diff.EB
73.5
EB75.4
Diff.EB
73.5EU 27 3 -2 80 6 15 -4 2 0
BE 6 3 81 4 13 -6 0 -1
BG 1 -2 82 6 15 -3 2 -1
CZ 2 -2 83 5 14 -4 1 1
DK 6 -5 61 10 31 -5 2 0
DE 2 -1 77 7 19 -6 2 0
EE 5 -1 87 6 7 -4 1 -1
IE 6 -4 82 10 10 -4 2 -2
EL 0 -1 96 5 4 -4 0 0
ES 2 -3 89 11 8 -9 1 1
FR 1 -1 89 2 8 -1 2 0
IT 6 1 68 0 24 -1 2 0
CY 2 0 89 2 8 -2 1 0
LV 1 -3 90 12 7 -10 2 1
LT 6 2 72 -13 17 9 5 2
LU 5 0 77 6 15 -7 3 1
HU 2 0 85 1 12 -2 1 1
MT 1 -3 89 5 8 -1 2 -1
NL 3 -1 75 4 20 -4 2 1
AT 7 -1 62 4 30 -3 1 0
PL 5 0 73 5 20 -3 2 -2
PT 1 -1 90 6 8 -6 1 1
RO 0 -4 87 5 11 0 2 -1
SI 2 -1 90 6 7 -6 1 1
SK 4 -5 86 20 9 -15 1 0
FI 6 1 73 14 20 -15 1 0
SE 14 -3 51 8 29 -6 6 1
UK 3 -3 87 11 8 -6 2 -2
QB4.6 Haben sich die Dinge im Vergleich zu vor fünf Jahren Ihrer Ansicht nach verbessert oder verschlechtert oder sind sie gleich geblieben, wenn es um Folgendes geht? Die Lebenshaltungskosten in (UNSER LAND)
QB4.6 Diriez-vous que, par rapport à il y a cinq ans, les choses se sont améliorées, déteriorées ou sont restées les mêmes en ce qui concerne … ? Le coût de la vie en (NOTRE PAYS)
QB4.6 Compared with five years ago, would you say things have improved, gotten worse or stayed about the same when it comes to…? The cost of living in (OUR COUNTRY)
Se sont améliorées Sont restées les mêmes
Stayed about the same
Ist etwa gleich geblieben
NSP
DK
WN
Improved
Verbessert
Se sont détériorées
Got worse
Verschlechtert
36

%EB
75.4
Diff.EB
73.5
EB75.4
Diff.EB
73.5
EB75.4
Diff.EB
73.5
EB75.4
Diff.EB
73.5EU 27 12 -1 35 1 47 -1 6 1
BE 10 2 46 1 43 -1 1 -2
BG 7 -2 23 3 65 0 5 -1
CZ 5 -4 42 4 51 -1 2 1
DK 15 -1 44 5 39 -4 2 0
DE 14 1 24 -3 55 1 7 1
EE 21 0 15 2 60 -1 4 -1
IE 16 -7 21 -3 56 12 7 -2
EL 4 -7 66 20 29 -13 1 0
ES 11 -5 36 6 48 -2 5 1
FR 6 0 48 -5 38 1 8 4
IT 13 -3 39 5 44 -1 4 -1
CY 14 -3 51 21 32 -16 3 -2
LV 6 -4 21 5 69 -2 4 1
LT 7 0 21 -2 62 1 10 1
LU 15 -1 18 1 61 -2 6 2
HU 6 0 45 4 45 -6 4 2
MT 23 0 22 -6 41 5 14 1
NL 9 1 55 -2 34 2 2 -1
AT 12 -1 32 -2 54 4 2 -1
PL 15 -3 19 6 55 -7 11 4
PT 5 -10 40 9 46 -1 9 2
RO 4 -4 39 9 46 -6 11 1
SI 4 -2 48 4 45 -4 3 2
SK 10 -3 26 -6 61 8 3 1
FI 18 4 33 -3 47 -1 2 0
SE 23 2 36 2 38 -4 3 0
UK 17 1 33 -1 43 -1 7 1
QB4.7 Haben sich die Dinge im Vergleich zu vor fünf Jahren Ihrer Ansicht nach verbessert oder verschlechtert oder sind sie gleich geblieben, wenn es um Folgendes geht? Die Beziehungen zwischen Menschen mit unterschiedlichem kulturellen oder religiösen Hintergrund oder verschiedener Nationalitäten in (UNSER LAND)
QB4.7 Diriez-vous que, par rapport à il y a cinq ans, les choses se sont améliorées, déteriorées ou sont restées les mêmes en ce qui concerne … ? Les rapports entre les personnes d’origines culturelles ou religieuses différentes ou de nationalités différentes en (NOTRE PAYS)
QB4.7 Compared with five years ago, would you say things have improved, gotten worse or stayed about the same when it comes to…? Relations in (OUR COUNTRY) between people from different cultural or religious backgrounds or nationalities
Se sont améliorées Sont restées les mêmes
Stayed about the same
Ist etwa gleich geblieben
NSP
DK
WN
Improved
Verbessert
Se sont détériorées
Got worse
Verschlechtert
37

%EB
75.4
Diff.EB
73.5
EB75.4
Diff.EB
73.5
EB75.4
Diff.EB
73.5
EB75.4
Diff.EB
73.5EU 27 8 -1 44 3 42 -2 6 0
BE 12 3 35 -2 51 0 2 -1
BG 4 0 39 0 48 4 9 -4
CZ 3 -4 44 7 51 -3 2 0
DK 9 1 37 -1 51 1 3 -1
DE 8 2 36 -10 49 7 7 1
EE 17 2 29 3 47 -5 7 0
IE 7 -6 36 2 46 3 11 1
EL 1 -3 79 14 20 -10 0 -1
ES 6 -5 53 14 37 -9 4 0
FR 6 -1 58 1 30 -3 6 3
IT 10 -2 45 8 42 -3 3 -3
CY 13 1 50 12 33 -12 4 -1
LV 4 -1 46 -1 46 2 4 0
LT 4 1 51 -9 37 8 8 0
LU 15 -1 17 -1 58 3 10 -1
HU 4 -1 57 0 36 0 3 1
MT 20 -5 21 0 46 7 13 -2
NL 8 -4 46 10 41 -7 5 1
AT 9 -4 31 0 56 3 4 1
PL 8 -5 33 11 52 -5 7 -1
PT 6 -3 60 9 29 -7 5 1
RO 1 -4 62 5 30 -2 7 1
SI 4 -5 57 5 36 -1 3 1
SK 6 -3 44 6 47 -3 3 0
FI 13 4 40 6 45 -10 2 0
SE 14 0 38 2 42 -1 6 -1
UK 11 -1 33 3 47 -1 9 -1
QB4.8 Haben sich die Dinge im Vergleich zu vor fünf Jahren Ihrer Ansicht nach verbessert oder verschlechtert oder sind sie gleich geblieben, wenn es um Folgendes geht? Die Art und Weise der Auseinandersetzung mit sozialer Benachteiligung und Armut in (UNSER LAND)
QB4.8 Diriez-vous que, par rapport à il y a cinq ans, les choses se sont améliorées, déteriorées ou sont restées les mêmes en ce qui concerne … ? La manière dont les inégalités et la pauvreté sont traitées en (NOTRE PAYS)
QB4.8 Compared with five years ago, would you say things have improved, gotten worse or stayed about the same when it comes to…? The way inequalities and poverty are addressed in (OUR COUNTRY)
Se sont améliorées Sont restées les mêmes
Stayed about the same
Ist etwa gleich geblieben
NSP
DK
WN
Improved
Verbessert
Se sont détériorées
Got worse
Verschlechtert
38

%EB
75.4
Diff.EB
73.5
EB75.4
Diff.EB
73.5
EB75.4
Diff.EB
73.5
EB75.4
Diff.EB
73.5EU 27 5 -2 70 7 22 -4 3 -1
BE 5 -1 83 11 11 -10 1 0
BG 2 -5 70 28 25 -20 3 -3
CZ 15 -3 30 4 53 -2 2 1
DK 5 0 62 14 31 -11 2 -3
DE 3 0 79 2 16 -2 2 0
EE 25 1 16 6 56 -7 3 0
IE 9 -3 72 11 14 -8 5 0
EL 0 -2 93 7 7 -3 0 -2
ES 12 -4 42 10 41 -6 5 0
FR 3 -2 80 8 13 -5 4 -1
IT 10 1 54 5 32 -4 4 -2
CY 0 -1 86 -1 11 3 3 -1
LV 8 -4 27 9 63 -4 2 -1
LT 1 0 81 -11 14 8 4 3
LU 6 1 71 5 17 -6 6 0
HU 2 0 82 -5 15 5 1 0
MT 2 -2 89 6 7 -2 2 -2
NL 4 -4 59 5 32 0 5 -1
AT 7 0 53 2 38 -2 2 0
PL 4 -1 70 8 24 -3 2 -4
PT 1 -1 85 8 12 -7 2 0
RO 2 -2 80 8 14 -6 4 0
SI 3 -2 76 4 19 -2 2 0
SK 4 -8 78 33 17 -25 1 0
FI 3 0 82 18 14 -17 1 -1
SE 5 -4 73 11 16 -5 6 -2
UK 3 -2 84 10 10 -6 3 -2
QB4.9 Haben sich die Dinge im Vergleich zu vor fünf Jahren Ihrer Ansicht nach verbessert oder verschlechtert oder sind sie gleich geblieben, wenn es um Folgendes geht? Bezahlbare Energie in (UNSER LAND)
QB4.9 Diriez-vous que, par rapport à il y a cinq ans, les choses se sont améliorées, déteriorées ou sont restées les mêmes en ce qui concerne … ? Le caractère abordable des coûts de l’énergie en (NOTRE PAYS)
QB4.9 Compared with five years ago, would you say things have improved, gotten worse or stayed about the same when it comes to…? How affordable energy is in (OUR COUNTRY)
Se sont améliorées Sont restées les mêmes
Stayed about the same
Ist etwa gleich geblieben
NSP
DK
WN
Improved
Verbessert
Se sont détériorées
Got worse
Verschlechtert
39

%EB
75.4
Diff.EB
73.5
EB75.4
Diff.EB
73.5
EB75.4
Diff.EB
73.5
EB75.4
Diff.EB
73.5EU 27 5 -2 65 6 25 -4 5 0
BE 3 -1 80 13 16 -11 1 -1
BG 6 -3 58 17 28 -14 8 0
CZ 11 -4 44 -2 43 5 2 1
DK 10 -6 43 9 44 -2 3 -1
DE 5 -1 39 2 47 -2 9 1
EE 20 -5 36 4 39 0 5 1
IE 36 5 39 -6 18 1 7 0
EL 3 -1 78 3 18 -1 1 -1
ES 3 -5 84 12 12 -6 1 -1
FR 2 -1 81 7 13 -5 4 -1
IT 7 1 57 3 32 -3 4 -1
CY 1 0 91 0 5 -1 3 1
LV 15 -7 30 2 51 5 4 0
LT 7 0 67 -11 19 9 7 2
LU 2 -1 82 9 11 -7 5 -1
HU 3 1 78 -5 18 4 1 0
MT 4 0 74 3 17 0 5 -3
NL 7 2 65 4 24 -6 4 0
AT 7 1 50 3 40 -4 3 0
PL 4 -2 68 5 23 -1 5 -2
PT 1 -3 80 12 15 -9 4 0
RO 5 -2 73 8 15 -5 7 -1
SI 3 -6 76 6 19 0 2 0
SK 8 -9 70 20 20 -12 2 1
FI 3 0 76 16 20 -16 1 0
SE 6 -8 59 16 31 -5 4 -3
UK 5 -2 75 6 14 -3 6 -1
QB4.10 Haben sich die Dinge im Vergleich zu vor fünf Jahren Ihrer Ansicht nach verbessert oder verschlechtert oder sind sie gleich geblieben, wenn es um Folgendes geht? Erschwinglicher Wohnraum in (UNSER LAND)
QB4.10 Diriez-vous que, par rapport à il y a cinq ans, les choses se sont améliorées, déteriorées ou sont restées les mêmes en ce qui concerne … ? Le caractère abordable du coût du logement en (NOTRE PAYS)
QB4.10 Compared with five years ago, would you say things have improved, gotten worse or stayed about the same when it comes to…? How affordable housing is in (OUR COUNTRY)
Se sont améliorées Sont restées les mêmes
Stayed about the same
Ist etwa gleich geblieben
NSP
DK
WN
Improved
Verbessert
Se sont détériorées
Got worse
Verschlechtert
40

%EB
75.4
Diff.EB
73.5
EB75.4
Diff.EB
73.5
EB75.4
Diff.EB
73.5
EB75.4
Diff.EB
73.5EU 27 7 0 38 3 49 -3 6 0
BE 12 3 20 -4 67 3 1 -2
BG 9 1 27 -2 51 2 13 -1
CZ 8 -3 41 7 48 -4 3 0
DK 8 -2 41 -1 48 2 3 1
DE 5 2 17 -5 73 4 5 -1
EE 21 -1 13 1 56 0 10 0
IE 5 0 43 -9 39 5 13 4
EL 4 -1 72 5 23 -4 1 0
ES 4 -2 48 13 45 -9 3 -2
FR 6 2 41 -1 47 -2 6 1
IT 9 0 49 9 38 -8 4 -1
CY 16 7 26 4 51 -11 7 0
LV 3 -3 47 -4 45 7 5 0
LT 5 2 35 -7 43 1 17 4
LU 15 -1 9 -3 70 4 6 0
HU 9 2 41 -2 43 -2 7 2
MT 12 -4 32 3 45 3 11 -2
NL 9 4 38 -1 47 -3 6 0
AT 12 2 17 -2 69 0 2 0
PL 11 -3 28 8 52 -7 9 2
PT 3 -4 59 10 31 -7 7 1
RO 3 -2 65 2 25 -2 7 2
SI 6 -4 46 4 42 0 6 0
SK 11 -1 36 6 48 -6 5 1
FI 6 -1 24 -3 66 2 4 2
SE 10 0 20 1 62 4 8 -5
UK 7 0 38 1 43 0 12 -1
QB4.11 Haben sich die Dinge im Vergleich zu vor fünf Jahren Ihrer Ansicht nach verbessert oder verschlechtert oder sind sie gleich geblieben, wenn es um Folgendes geht? Das Funktionieren der öffentlichen Verwaltung in (UNSER LAND)
QB4.11 Diriez-vous que, par rapport à il y a cinq ans, les choses se sont améliorées, déteriorées ou sont restées les mêmes en ce qui concerne … ? Le fonctionnement de l’administration publique en (NOTRE PAYS)
QB4.11 Compared with five years ago, would you say things have improved, gotten worse or stayed about the same when it comes to…? The way public administration runs in (OUR COUNTRY)
Se sont améliorées Sont restées les mêmes
Stayed about the same
Ist etwa gleich geblieben
NSP
DK
WN
Improved
Verbessert
Se sont détériorées
Got worse
Verschlechtert
41

%EB
75.4
Diff.EB
73.5
EB75.4
Diff.EB
73.5
EB75.4
Diff.EB
73.5
EB75.4
Diff.EB
73.5EU 27 12 6 68 -7 17 1 3 0
BE 13 9 60 -17 26 8 1 0
BG 2 0 80 -1 16 3 2 -2
CZ 2 -2 83 3 14 -1 1 0
DK 7 -3 71 -3 19 5 3 1
DE 43 37 27 -43 26 6 4 0
EE 19 6 65 -10 14 4 2 0
IE 2 -1 92 6 3 -4 3 -1
EL 0 -1 97 3 3 -2 0 0
ES 1 0 93 3 5 -3 1 0
FR 2 0 80 -6 14 5 4 1
IT 6 1 70 3 23 -3 1 -1
CY 3 0 87 -2 9 2 1 0
LV 2 0 84 -4 12 3 2 1
LT 4 2 82 -11 11 7 3 2
LU 15 5 51 -14 28 7 6 2
HU 4 2 82 -5 13 2 1 1
MT 12 -6 59 1 22 5 7 0
NL 8 3 77 -7 13 3 2 1
AT 20 12 42 -19 36 6 2 1
PL 13 -13 51 18 30 -4 6 -1
PT 1 0 89 3 9 -3 1 0
RO 1 -2 87 1 10 2 2 -1
SI 3 -5 87 11 8 -7 2 1
SK 6 -5 78 13 15 -8 1 0
FI 11 5 54 -13 32 6 3 2
SE 50 26 23 -26 22 1 5 -1
UK 4 1 83 -3 10 2 3 0
QB4.12 Haben sich die Dinge im Vergleich zu vor fünf Jahren Ihrer Ansicht nach verbessert oder verschlechtert oder sind sie gleich geblieben, wenn es um Folgendes geht? Die wirtschaftliche Lage in (UNSER LAND)
QB4.12 Diriez-vous que, par rapport à il y a cinq ans, les choses se sont améliorées, déteriorées ou sont restées les mêmes en ce qui concerne … ? La situation économique en (NOTRE PAYS)
QB4.12 Compared with five years ago, would you say things have improved, gotten worse or stayed about the same when it comes to…? The economic situation in (OUR COUNTRY)
Se sont améliorées Sont restées les mêmes
Stayed about the same
Ist etwa gleich geblieben
NSP
DK
WN
Improved
Verbessert
Se sont détériorées
Got worse
Verschlechtert
42

%EB
75.4
Diff.EB
73.5
EB75.4
Diff.EB
73.5
EB75.4
Diff.EB
73.5
EB75.4
Diff.EB
73.5EU 27 19 1 23 -1 48 0 10 0
BE 25 5 14 0 52 -5 9 0
BG 7 -1 35 0 53 0 5 1
CZ 12 -2 22 -2 45 0 21 4
DK 29 -2 15 2 53 -1 3 1
DE 24 2 12 -6 53 3 11 1
EE 24 5 22 -6 34 1 20 0
IE 11 -3 33 3 43 -1 13 1
EL 5 -5 48 8 35 -3 12 0
ES 13 1 33 -1 50 -1 4 1
FR 26 4 15 -4 42 -3 17 3
IT 14 2 28 1 55 -2 3 -1
CY 17 4 21 0 44 -6 18 2
LV 12 -2 38 -2 36 2 14 2
LT 9 3 48 -12 28 7 15 2
LU 30 -1 6 -3 48 -2 16 6
HU 5 0 43 -4 44 5 8 -1
MT 15 -8 18 -2 46 9 21 1
NL 27 -1 20 3 34 -5 19 3
AT 27 7 13 -3 55 -3 5 -1
PL 18 0 23 5 54 -5 5 0
PT 7 -3 41 4 48 -2 4 1
RO 5 -4 46 5 26 -2 23 1
SI 14 0 28 -2 53 2 5 0
SK 17 -2 26 3 45 -4 12 3
FI 23 4 13 0 58 -8 6 4
SE 45 1 10 -3 41 4 4 -2
UK 20 -3 21 2 47 3 12 -2
QB4.13 Haben sich die Dinge im Vergleich zu vor fünf Jahren Ihrer Ansicht nach verbessert oder verschlechtert oder sind sie gleich geblieben, wenn es um Folgendes geht? Ihre persönliche berufliche Situation
QB4.13 Diriez-vous que, par rapport à il y a cinq ans, les choses se sont améliorées, déteriorées ou sont restées les mêmes en ce qui concerne … ? Votre situation professionnelle
QB4.13 Compared with five years ago, would you say things have improved, gotten worse or stayed about the same when it comes to…? Your personal job situation
Se sont améliorées Sont restées les mêmes
Stayed about the same
Ist etwa gleich geblieben
NSP
DK
WN
Improved
Verbessert
Se sont détériorées
Got worse
Verschlechtert
43

%EB
75.4
Diff.EB
73.5
EB75.4
Diff.EB
73.5
EB75.4
Diff.EB
73.5
EB75.4
Diff.EB
73.5EU 27 18 0 35 -1 45 1 2 0
BE 27 6 21 0 51 -6 1 0
BG 7 -1 57 1 35 1 1 -1
CZ 13 -1 42 -1 44 2 1 0
DK 31 -3 18 -1 50 4 1 0
DE 21 3 24 -6 54 4 1 -1
EE 30 6 35 -4 34 -2 1 0
IE 11 -3 48 6 38 -2 3 -1
EL 3 -5 76 6 21 -1 0 0
ES 12 1 41 -3 47 2 0 0
FR 24 1 29 -3 42 -1 5 3
IT 11 1 30 -2 58 2 1 -1
CY 13 0 47 2 39 -2 1 0
LV 13 -4 56 2 30 2 1 0
LT 12 1 57 -6 29 4 2 1
LU 31 -5 12 0 53 3 4 2
HU 7 0 62 -5 31 6 0 -1
MT 10 -12 37 0 51 12 2 0
NL 30 -1 24 2 44 -2 2 1
AT 27 9 23 -5 49 -4 1 0
PL 21 -2 40 8 38 -3 1 -3
PT 5 -3 57 4 36 -2 2 1
RO 7 -4 62 2 29 2 2 0
SI 9 -3 45 1 43 0 3 2
SK 19 -2 42 10 37 -9 2 1
FI 31 4 16 0 52 -5 1 1
SE 50 2 16 -6 32 3 2 1
UK 22 -4 30 1 44 2 4 1
QB4.14 Haben sich die Dinge im Vergleich zu vor fünf Jahren Ihrer Ansicht nach verbessert oder verschlechtert oder sind sie gleich geblieben, wenn es um Folgendes geht? Die finanzielle Situation Ihres Haushaltes
QB4.14 Diriez-vous que, par rapport à il y a cinq ans, les choses se sont améliorées, déteriorées ou sont restées les mêmes en ce qui concerne … ? La situation financière de votre ménage
QB4.14 Compared with five years ago, would you say things have improved, gotten worse or stayed about the same when it comes to…? The financial situation of your household
Se sont améliorées Sont restées les mêmes
Stayed about the same
Ist etwa gleich geblieben
NSP
DK
WN
Improved
Verbessert
Se sont détériorées
Got worse
Verschlechtert
44

%EB
75.4
Diff.EB
73.5
EB75.4
Diff.EB
73.5
EB75.4
Diff.EB
73.5
EB75.4
Diff.EB
73.5EU 27 12 7 64 -9 20 2 4 0
BE 17 11 49 -23 32 11 2 1
BG 1 -1 76 -4 19 5 4 0
CZ 4 0 67 -10 26 9 3 1
DK 7 -2 71 0 19 2 3 0
DE 45 36 23 -37 27 1 5 0
EE 11 7 74 -9 11 3 4 -1
IE 2 0 91 2 5 -1 2 -1
EL 0 -2 97 5 3 -3 0 0
ES 1 0 92 0 6 -1 1 1
FR 4 3 73 -13 17 7 6 3
IT 5 1 69 1 24 -2 2 0
CY 2 -1 86 8 9 -4 3 -3
LV 3 1 83 -6 12 4 2 1
LT 4 3 75 -14 15 9 6 2
LU 10 3 56 -9 26 3 8 3
HU 3 1 77 -4 18 2 2 1
MT 10 -8 48 2 33 6 9 0
NL 10 5 56 -18 28 11 6 2
AT 21 14 37 -22 39 7 3 1
PL 11 -2 47 5 35 -2 7 -1
PT 1 0 87 1 11 -1 1 0
RO 1 -2 84 1 12 1 3 0
SI 3 -2 84 8 11 -7 2 1
SK 7 0 69 -4 22 3 2 1
FI 15 9 49 -24 32 12 4 3
SE 33 21 37 -26 24 7 6 -2
UK 4 -1 75 -2 15 2 6 1
QB4.15 Haben sich die Dinge im Vergleich zu vor fünf Jahren Ihrer Ansicht nach verbessert oder verschlechtert oder sind sie gleich geblieben, wenn es um Folgendes geht? Die Lage auf dem Arbeitsmarkt in (UNSER LAND)
QB4.15 Diriez-vous que, par rapport à il y a cinq ans, les choses se sont améliorées, déteriorées ou sont restées les mêmes en ce qui concerne … ? La situation de l’emploi en (NOTRE PAYS)
QB4.15 Compared with five years ago, would you say things have improved, gotten worse or stayed about the same when it comes to…? The employment situation in (OUR COUNTRY)
Se sont améliorées Sont restées les mêmes
Stayed about the same
Ist etwa gleich geblieben
NSP
DK
WN
Improved
Verbessert
Se sont détériorées
Got worse
Verschlechtert
45