ebook secrets of 4
TRANSCRIPT

8/7/2019 eBook Secrets of 4
http://slidepdf.com/reader/full/ebook-secrets-of-4 1/51
Secrets ofSecrets ofSecrets ofSecrets of
MetaTrader 4MetaTrader 4MetaTrader 4MetaTrader 4 Trading PlatformTrading PlatformTrading PlatformTrading Platform
So many people uses MetaTrader4 trading platform,So many people uses MetaTrader4 trading platform,So many people uses MetaTrader4 trading platform,So many people uses MetaTrader4 trading platform,
but not so many really knows how to use it.but not so many really knows how to use it.but not so many really knows how to use it.but not so many really knows how to use it.

8/7/2019 eBook Secrets of 4
http://slidepdf.com/reader/full/ebook-secrets-of-4 2/51
1.1.1.1. How to switch to the fullHow to switch to the fullHow to switch to the fullHow to switch to the full----screen modescreen modescreen modescreen mode????
2.2.2.2. How to promptly attach indicators, expert advisors and/orHow to promptly attach indicators, expert advisors and/orHow to promptly attach indicators, expert advisors and/orHow to promptly attach indicators, expert advisors and/or scripts to thescripts to thescripts to thescripts to thecharts?charts?charts?charts?
3.3.3.3. How to getHow to getHow to getHow to get better positioning of the chart on the necessary time?better positioning of the chart on the necessary time?better positioning of the chart on the necessary time?better positioning of the chart on the necessary time?
4.4.4.4. How toHow toHow toHow to minimize "Terminal" window title bar?minimize "Terminal" window title bar?minimize "Terminal" window title bar?minimize "Terminal" window title bar?
5.5.5.5. How to createHow to createHow to createHow to create "Favorites" group with your"Favorites" group with your"Favorites" group with your"Favorites" group with your frequently frequently frequently frequently usedusedusedusedindicators/scripts/experts/accounts?indicators/scripts/experts/accounts?indicators/scripts/experts/accounts?indicators/scripts/experts/accounts?
6.6.6.6. How to saveHow to saveHow to saveHow to save traffic?traffic?traffic?traffic?
7.7.7.7.
How toHow toHow toHow to switch between several sets of symbols?switch between several sets of symbols?switch between several sets of symbols?switch between several sets of symbols?8.8.8.8. How toHow toHow toHow to open the Popup prices window?open the Popup prices window?open the Popup prices window?open the Popup prices window?
9.9.9.9. How to createHow to createHow to createHow to create the same Background and bars colors, indicators and objectsthe same Background and bars colors, indicators and objectsthe same Background and bars colors, indicators and objectsthe same Background and bars colors, indicators and objectsfor all charts?for all charts?for all charts?for all charts?
10.10.10.10. How to createHow to createHow to createHow to create a special profile for each account?a special profile for each account?a special profile for each account?a special profile for each account?
11.11.11.11. How to call the "Crosshair" object?How to call the "Crosshair" object?How to call the "Crosshair" object?How to call the "Crosshair" object?
12.12.12.12. How to check vertical distances and the amount of bars between two points?How to check vertical distances and the amount of bars between two points?How to check vertical distances and the amount of bars between two points?How to check vertical distances and the amount of bars between two points?
13.13.13.13. How toHow toHow toHow to page through the chart bar by bar?page through the chart bar by bar?page through the chart bar by bar?page through the chart bar by bar?
14.14.14.14. How toHow toHow toHow to display closed positions and deleted pending orders in the chart?display closed positions and deleted pending orders in the chart?display closed positions and deleted pending orders in the chart?display closed positions and deleted pending orders in the chart?
15.15.15.15. How toHow toHow toHow to easily place pending orders?easily place pending orders?easily place pending orders?easily place pending orders?
16.16.16.16. How to easily modify StopHow to easily modify StopHow to easily modify StopHow to easily modify Stop Loss and/or Take Profit?Loss and/or Take Profit?Loss and/or Take Profit?Loss and/or Take Profit?
17.17.17.17. How toHow toHow toHow to recover deleted objectrecover deleted objectrecover deleted objectrecover deleted object/chart/chart/chart/chart????
18.18.18.18. How toHow toHow toHow to print a chart?print a chart?print a chart?print a chart?
19.19.19.19. How toHow toHow toHow to set an alerting system?set an alerting system?set an alerting system?set an alerting system?
20.20.20.20. How toHow toHow toHow to set an email messages alerting system?set an email messages alerting system?set an email messages alerting system?set an email messages alerting system?
21.21.21.21. How to publishHow to publishHow to publishHow to publish a reporta reporta reporta report on FTP Server?on FTP Server?on FTP Server?on FTP Server?
22.22.22.22. IndicatorsIndicatorsIndicatorsIndicators
23.23.23.23. How to attach indicators to a charHow to attach indicators to a charHow to attach indicators to a charHow to attach indicators to a chart?t?t?t?24.24.24.24. How to attach to the main window indicators that are opened in aHow to attach to the main window indicators that are opened in aHow to attach to the main window indicators that are opened in aHow to attach to the main window indicators that are opened in a
subwindow by default?subwindow by default?subwindow by default?subwindow by default?
25.25.25.25. How to attachHow to attachHow to attachHow to attach to subwindow indicatorsto subwindow indicatorsto subwindow indicatorsto subwindow indicators that are opened in the main windowthat are opened in the main windowthat are opened in the main windowthat are opened in the main windowby default?by default?by default?by default?
26.26.26.26. Common properties of indicators attachingCommon properties of indicators attachingCommon properties of indicators attachingCommon properties of indicators attaching
27.27.27.27. How to build levels?How to build levels?How to build levels?How to build levels?
28.28.28.28. What is "visu What is "visu What is "visu What is "visualization" tab?alization" tab?alization" tab?alization" tab?
29.29.29.29. File library in MetaEditorFile library in MetaEditorFile library in MetaEditorFile library in MetaEditor

8/7/2019 eBook Secrets of 4
http://slidepdf.com/reader/full/ebook-secrets-of-4 3/51
1.1.1.1. How to switch to the fullHow to switch to the fullHow to switch to the fullHow to switch to the full----screen modescreen modescreen modescreen mode????
In order to switch to the fullIn order to switch to the fullIn order to switch to the fullIn order to switch to the full----screen mode you should pscreen mode you should pscreen mode you should pscreen mode you should press on F11ress on F11ress on F11ress on F11....
In the full-screen mode, the following hotkeys can be used to open command windows:
Ctrl+MCtrl+MCtrl+MCtrl+M - Market Watch Ctrl+NCtrl+NCtrl+NCtrl+N - Navigator Ctrl+TCtrl+TCtrl+TCtrl+T - Terminal Ctrl+DCtrl+DCtrl+DCtrl+D - Data window
To return to the normal mode, just press F11 again.

8/7/2019 eBook Secrets of 4
http://slidepdf.com/reader/full/ebook-secrets-of-4 4/51
2.2.2.2. How to promptly attach indicHow to promptly attach indicHow to promptly attach indicHow to promptly attach indicators, expert advisors and/or scripts to the charts?ators, expert advisors and/or scripts to the charts?ators, expert advisors and/or scripts to the charts?ators, expert advisors and/or scripts to the charts?
Indicators, experts and/or scripts can be promptly attached to the chart if hotkeys are preliminarily set forIndicators, experts and/or scripts can be promptly attached to the chart if hotkeys are preliminarily set forIndicators, experts and/or scripts can be promptly attached to the chart if hotkeys are preliminarily set forIndicators, experts and/or scripts can be promptly attached to the chart if hotkeys are preliminarily set forthem.them.them.them.
This can be very useful in the full-screen mode. To assign hotkeys, select the "Set hotkey" option in the"Navigator" window context menu:
You can select any keys combinations you wish:

8/7/2019 eBook Secrets of 4
http://slidepdf.com/reader/full/ebook-secrets-of-4 5/51
************
3. How to get3. How to get3. How to get3. How to get better positioning of the chart on the necessary time?better positioning of the chart on the necessary time?better positioning of the chart on the necessary time?better positioning of the chart on the necessary time?
For better positioning of the chart on the necessary time, you can use theFor better positioning of the chart on the necessary time, you can use theFor better positioning of the chart on the necessary time, you can use theFor better positioning of the chart on the necessary time, you can use the ffffastastastast nnnnavigation line.avigation line.avigation line.avigation line.
To open the fast navigation line, press the spacebar or Enter or move the cursor to the left bottom part ofthe chart window and, after the sign appears, double-click with the left mouse button:
Do not forget to disable the chart auto scroll.
8/7/2019 eBook Secrets of 4
http://slidepdf.com/reader/full/ebook-secrets-of-4 6/51
Format of commands in the Fast Navigation line for precise positioning of the chart:
[time (hours: minutes)]example : 8:30
[date]example : 2004.10.16
[date] [time]example : 16.10.04 8:30
Using the fast navigation line, one can promptly switch between the chart's symbols and periods. This canbe very useful in the full-screen mode.
Format of commands in the Fast Navigation line for switching between symbols and/or periods of thechart:
[symbol name]example : GBPUSD
[chart period]example : M30
[symbol name],[chart period]example : GBPUSD,M30
To execute a fast navigation command, press Enter. To cancel it, press Esc. Only one of the abovecommands can be executed in the fast navigation line at a time.
4.4.4.4. How toHow toHow toHow to minimize "Terminal" window title bar?minimize "Terminal" window title bar?minimize "Terminal" window title bar?minimize "Terminal" window title bar?
A double c A double c A double c A double click with the left mouse button on the "Terminal" window title bar will minimize it to the bar oflick with the left mouse button on the "Terminal" window title bar will minimize it to the bar oflick with the left mouse button on the "Terminal" window title bar will minimize it to the bar oflick with the left mouse button on the "Terminal" window title bar will minimize it to the bar ofthe current account status.the current account status.the current account status.the current account status.
Thus, some additional space will be free for the chart. You can also minimize the window by double-clicking with the left mouse button on the title of any tab in the window.
To restore, double-click in the minimized window or select the "Restore" command in the context menu.

8/7/2019 eBook Secrets of 4
http://slidepdf.com/reader/full/ebook-secrets-of-4 7/51
5.5.5.5. How tHow tHow tHow to createo createo createo create "Favorites""Favorites""Favorites""Favorites" group with your frequently used igroup with your frequently used igroup with your frequently used igroup with your frequently used indicatorsndicatorsndicatorsndicators,,,, scriptsscriptsscriptsscripts,,,,
expert advisors and/orexpert advisors and/orexpert advisors and/orexpert advisors and/or accounts?accounts?accounts?accounts?
Frequently used indicators/scripts/experts/accounts can be added to the "Favorites" group to have a fasterFrequently used indicators/scripts/experts/accounts can be added to the "Favorites" group to have a fasterFrequently used indicators/scripts/experts/accounts can be added to the "Favorites" group to have a fasterFrequently used indicators/scripts/experts/accounts can be added to the "Favorites" group to have a fasteraccess to them.access to them.access to them.access to them.
To do so, click with the right mouse button on the name of the indicator/script/expert/account and selectthe command "Add to favorites":
The listed items will be available in the "Favorites" tab of the "Navigator" window:

8/7/2019 eBook Secrets of 4
http://slidepdf.com/reader/full/ebook-secrets-of-4 8/51
6.6.6.6. How to saveHow to saveHow to saveHow to save traffic?traffic?traffic?traffic?
The traffic can be saved if the unused symbols are hidden. The symbols can be hidden in a several ways:
1. Select the "Hide All" command in the context menu of the "Market Watch" window:
2. Select the symbol using the left mouse button and press Delete:

8/7/2019 eBook Secrets of 4
http://slidepdf.com/reader/full/ebook-secrets-of-4 9/51
3. Select the "Symbols" command in the context menu of the "Market Watch" window and hide/show
symbols in the window that appears:
The symbol cannot be hidden if:
there are open positions or pending orders for this symbol the chart has been opened within the current session
this symbol is used to recalculate cross rates
TrafficTrafficTrafficTraffic can alsocan alsocan alsocan also be saved if news are disabled.be saved if news are disabled.be saved if news are disabled.be saved if news are disabled. To do so, open the "Tools -> Options" menu and unflag the"Enable news" field in the "Server" tab:

8/7/2019 eBook Secrets of 4
http://slidepdf.com/reader/full/ebook-secrets-of-4 10/51
7.7.7.7. How toHow toHow toHow to switch between several sets of symbols?switch between several sets of symbols?switch between several sets of symbols?switch between several sets of symbols?
You can create several sets of symbols and switch between them, if necessary.You can create several sets of symbols and switch between them, if necessary.You can create several sets of symbols and switch between them, if necessary.You can create several sets of symbols and switch between them, if necessary.
This can be very useful if you work with different groups of symbols (currency pairs, shares, futures, etc.).Hide all "excessive" symbols and save the set obtained.

8/7/2019 eBook Secrets of 4
http://slidepdf.com/reader/full/ebook-secrets-of-4 11/51
8.8.8.8. How toHow toHow toHow to open the popen the popen the popen the popopopop----up prices window?up prices window?up prices window?up prices window?
The PopThe PopThe PopThe Popup prices window can be openedup prices window can be openedup prices window can be openedup prices window can be opened by pressinby pressinby pressinby pressing F10.g F10.g F10.g F10.
If you select "Always on the Top" in the context menu of this window, you will be able to watch quotes whileworking with other applications:
Having selected "Properties..." in the context menu of the Popup prices window, you can adjust its colorsand fonts:
8/7/2019 eBook Secrets of 4
http://slidepdf.com/reader/full/ebook-secrets-of-4 12/51
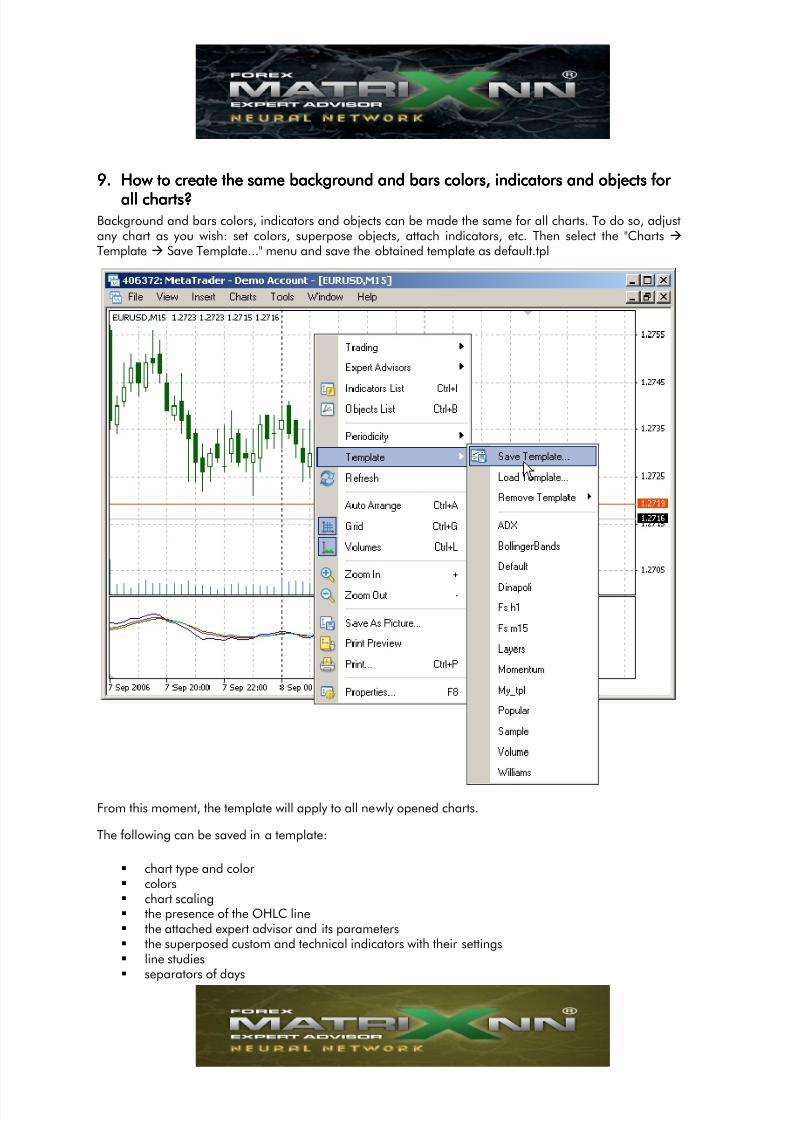
9.9.9.9. How to creHow to creHow to creHow to createateateate the samethe samethe samethe same bbbbackground and bars colors, indicators and objects forackground and bars colors, indicators and objects forackground and bars colors, indicators and objects forackground and bars colors, indicators and objects for
all charts?all charts?all charts?all charts?Background and bars colors, indicators and objects can be made the same for all charts. To do so, adjustany chart as you wish: set colors, superpose objects, attach indicators, etc. Then select the "Charts Template Save Template..." menu and save the obtained template as default.tpl
From this moment, the template will apply to all newly opened charts.
The following can be saved in a template:
chart type and color colors chart scaling the presence of the OHLC line the attached expert advisor and its parameters the superposed custom and technical indicators with their settings line studies separators of days

8/7/2019 eBook Secrets of 4
http://slidepdf.com/reader/full/ebook-secrets-of-4 13/51
Specific templates can be created for charts opened from the Tester and for those opened independently.Specific templates can be created for charts opened from the Tester and for those opened independently.Specific templates can be created for charts opened from the Tester and for those opened independently.Specific templates can be created for charts opened from the Tester and for those opened independently.
To create a default template for charts opened from the Tester, you have to save the template as "tester.tpl"
For independent charts, the default template must be "offline.tpl".
If the "offline.tpl" template is not found when the chart is opened independently, the "default.tpl" template isused. On no "tester.tpl", the embedded settings are used.

8/7/2019 eBook Secrets of 4
http://slidepdf.com/reader/full/ebook-secrets-of-4 14/51
10.10.10.10. How to createHow to createHow to createHow to create a special profile for each accouna special profile for each accouna special profile for each accouna special profile for each account?t?t?t?
If you have several accounts, you can create a special profile for each. At switching between accounts, theprofiles will be opened automatically.
To create such a profile, you have to save it under the name which is exactly the same as the accountnumber:
11. How to11. How to11. How to11. How to call the "Crosshair" object?call the "Crosshair" object?call the "Crosshair" object?call the "Crosshair" object?
To call the "Crosshair" object, click the middle button of the mouse or press Ctrl+F.To call the "Crosshair" object, click the middle button of the mouse or press Ctrl+F.To call the "Crosshair" object, click the middle button of the mouse or press Ctrl+F.To call the "Crosshair" object, click the middle button of the mouse or press Ctrl+F.
This can be very useful when working in the full-screen mode.
8/7/2019 eBook Secrets of 4
http://slidepdf.com/reader/full/ebook-secrets-of-4 15/51
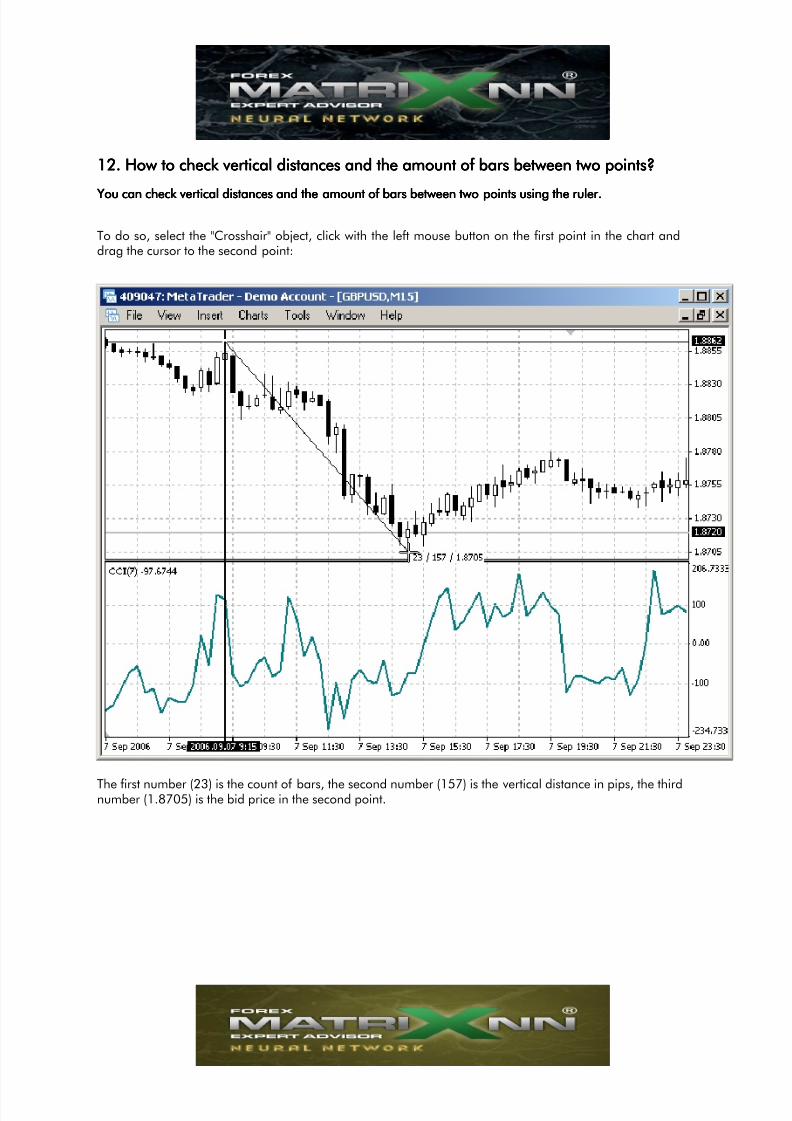
12. How to12. How to12. How to12. How to check vertical distances and the amount of bars between two points?check vertical distances and the amount of bars between two points?check vertical distances and the amount of bars between two points?check vertical distances and the amount of bars between two points?
You can check vertical distances and the amount of bars between two points using the ruler.You can check vertical distances and the amount of bars between two points using the ruler.You can check vertical distances and the amount of bars between two points using the ruler.You can check vertical distances and the amount of bars between two points using the ruler.
To do so, select the "Crosshair" object, click with the left mouse button on the first point in the chart anddrag the cursor to the second point:
The first number (23) is the count of bars, the second number (157) is the vertical distance in pips, the thirdnumber (1.8705) is the bid price in the second point.

8/7/2019 eBook Secrets of 4
http://slidepdf.com/reader/full/ebook-secrets-of-4 16/51
13.13.13.13. How toHow toHow toHow to page through the chart bar by bar?page through the chart bar by bar?page through the chart bar by bar?page through the chart bar by bar?
Use F12F12F12F12 to page through the chart bar by bar. This function can be very useful when you develop and testyour own trading strategy. Just open the chart at the very beginning of the history (press Home) and pagethrough it bar by bar.
Shift+F12 will page through the chart backward.

8/7/2019 eBook Secrets of 4
http://slidepdf.com/reader/full/ebook-secrets-of-4 17/51
14. How to14. How to14. How to14. How to display closed positions and deleted pending orders in the chart?display closed positions and deleted pending orders in the chart?display closed positions and deleted pending orders in the chart?display closed positions and deleted pending orders in the chart?
Closed positions and deleted pending orders can be displayed in the chart.Closed positions and deleted pending orders can be displayed in the chart.Closed positions and deleted pending orders can be displayed in the chart.Closed positions and deleted pending orders can be displayed in the chart.
To do so, go to the "Account History" tab in the "Terminal" window and drag the order to the chart usingthe left mouse button. It is necessary that the symbol history of the selected order is downloaded from theserver. If the order is dragged to another symbol chart, it will be replaced with the selected symbol chart.
The order is displayed in the chart as order opening and closing/deleting arrows joined with a trend linesegment. Stop Loss and Take Profit levels are displayed in the vertical line with the open price.
If Shift is pressed at the moment of dragging, all positions for the symbol of the selected order available inthe "Account History" tab will be displayed.

8/7/2019 eBook Secrets of 4
http://slidepdf.com/reader/full/ebook-secrets-of-4 18/51
15. How to15. How to15. How to15. How to easileasileasileasily place pending orders?y place pending orders?y place pending orders?y place pending orders?
There is no need to remember conditions, on which the type of pending orders to be placed depends. Justclick with the right mouse button on the desired point in the chart where you would like to place the orderand select the "Trading" command in the context menu. You will see the types of pending orders that canbe placed in this selected point:
After one of the types has been selected, the window of order creation/modification with partly filled fieldswill open. It just remains to specify Stop Loss and/or Take Profit values.
Chalk Up
Pending orders can be of four types:
Buy LimitBuy LimitBuy LimitBuy Limit — the current price level is above the value of the order to be placed. Buy StopBuy StopBuy StopBuy Stop — the current price level is below the value of the order to be placed. Sell LimitSell LimitSell LimitSell Limit — the current price level is below the value of the order to be placed. Sell StopSell StopSell StopSell Stop — the current price level is above the value of the order to be placed.

8/7/2019 eBook Secrets of 4
http://slidepdf.com/reader/full/ebook-secrets-of-4 19/51
16. How to16. How to16. How to16. How to easily modify Stop Loss and/or Take Profit?easily modify Stop Loss and/or Take Profit?easily modify Stop Loss and/or Take Profit?easily modify Stop Loss and/or Take Profit?
To modify Stop Loss and/or Take Profit, double-click on one of these fields in the order line.
After that, enter necessary values in the newly opened window.

8/7/2019 eBook Secrets of 4
http://slidepdf.com/reader/full/ebook-secrets-of-4 20/51
17.17.17.17. How toHow toHow toHow to recover deleted objectrecover deleted objectrecover deleted objectrecover deleted object/chart/chart/chart/chart????
If you have deleted an object by accident, press Ctrl+Z to undo:
Charts closed by accident can be reopened with all their settings using the "FileCharts closed by accident can be reopened with all their settings using the "FileCharts closed by accident can be reopened with all their settings using the "FileCharts closed by accident can be reopened with all their settings using the "File Open Deleted"Open Deleted"Open Deleted"Open Deleted"::::

8/7/2019 eBook Secrets of 4
http://slidepdf.com/reader/full/ebook-secrets-of-4 21/51
18.18.18.18. How toHow toHow toHow to print a chart?print a chart?print a chart?print a chart?Press Ctrl+P to print out a chart. The chart is printed black and white by default, but it can also be printedin color. Just check the "Color print" field in the "Charts" tab of the "Tools Options" menu:

8/7/2019 eBook Secrets of 4
http://slidepdf.com/reader/full/ebook-secrets-of-4 22/51
11119. How to9. How to9. How to9. How to set an alerting system?set an alerting system?set an alerting system?set an alerting system?
System EventsSystem EventsSystem EventsSystem Events
Open the "Tools Options" menu and go to the "Events" tab. By default, a WAV file is used to alert aboutone of eleven events:
These files can be found in the \MetaTrader 4\sounds\ directory of the Client Terminal. The alert can bemodified as desired. To do so, open the popup list in the "Action" column by double-clicking with the left
mouse button on the selected line:

8/7/2019 eBook Secrets of 4
http://slidepdf.com/reader/full/ebook-secrets-of-4 23/51
The alert can be both a WAV file and an executable file ("EXE", "VBS", "BAT").
If a file of another type is chosen for alerting, the application related to this file type will be launched. Afterhaving selected an action, press Enter to confirm the choice. The event alert can be disabled by double-clicking with the left mouse button on the line in the "Event" column.
UserUserUserUser----Defined EventsDefined EventsDefined EventsDefined Events
Custom events can be of two types:
the price reaches the pre-defined value for the desired symbol; the pre-defined timeout is reached.

8/7/2019 eBook Secrets of 4
http://slidepdf.com/reader/full/ebook-secrets-of-4 24/51
To set up alert, you have to go to the "Alerts" tab in the "Terminal" window and press Insert:
The alerts can be enabled/disabled by pressing Space, and modified by pressing Enter.
Alerts can be of three types: a sound alert, an executable file, an emailed message. For all alert types, it isnecessary to specify the "Symbol" and conditions (fields "Condition" and "Value"), at meeting of which thealert will trigger. In the fields named "Timeout" and "Maximum iterations", it should be specified how many times and with what regularity the alert will trigger.
Sound AlertsSound AlertsSound AlertsSound Alerts
Both files stored in the \MetaTrader 4\sounds\ directory of the Client Terminal and any other files can beused as sound alerts: "WAV", "MP3", "WMI". If a file in the "MP3" or "WMI" format is chosen, the applicationrelated to these file types will be launched at alert triggering.

8/7/2019 eBook Secrets of 4
http://slidepdf.com/reader/full/ebook-secrets-of-4 25/51
Executable FilesExecutable FilesExecutable FilesExecutable Files
Executable files can be in formats of "EXE", "VBS", "BAT". If a file of any other format has been chosen, theapplication related to these file types will be launched at alert triggering.
20.20.20.20. How toHow toHow toHow to set an email messages alerting system?set an email messages alerting system?set an email messages alerting system?set an email messages alerting system?
To get alert messages via email, it is necessary to make presetting in the "Email" tab of the "Tools Options" menu. Check the "Enable" field and enter your email server settings in the corresponding fields. Ineach field, you can see red prompts about the data format to be entered.
SMTP server – address of your mailing server when accessed via SMTP. Please do not forget tospecify the port number separated by a colon. It is usually port 25. Example: smtp.mail.com:25
SMTP login – it is usually your email address. Example: [email protected] SMTP password – a password used to access to your mailbox. From: – you should enter the login ("Your name") and your email address on the same server, the
SMTP of which you would like to use. As a rule, the login coincides with the first part of the emailaddress, but it can be skipped. Example: your_name, [email protected]
To: – email address you would like to send alerts to. The "Your name" part of the address can beskipped. In general, the "To:" field should be filled out with any real email address. Example:any_name, [email protected]

8/7/2019 eBook Secrets of 4
http://slidepdf.com/reader/full/ebook-secrets-of-4 26/51
Click on the "Test" button and check whether the message has been delivered to the email address youhave specified in the "To:" field. If all settings have been written correctly, the message: "Mail: 'Test
message' has been sent" must appear in the "Journal".
For sms messages to be sent, you have to specify the email address provided by your cellular operator inthe "To:" field. To use the operator's SMTP server as such, you have to verify its settings on the operator'swebsite or at the accounts department. Please keep in mind that not all cellular operators permit to usetheir SMTP servers without calling to POP3 servers.
Then the alert as such can be created. To do so, press Insert in the "Alerts" tab in the "Terminal" window.Fill out all the fields:

8/7/2019 eBook Secrets of 4
http://slidepdf.com/reader/full/ebook-secrets-of-4 27/51
To create the message text, click on the button near the "Source" line. Enter the subject and the body of the message. Both in the subject and in the message body, you can use "Macros". The list of macros isavailable from the context menu:
After this, click on the "Send" button.
Having filled out other fields, click on the "Test" button and check whether the alert has income at yourmailbox. If the message has been sent successfully, the corresponding record will appear in the "Journal":

8/7/2019 eBook Secrets of 4
http://slidepdf.com/reader/full/ebook-secrets-of-4 28/51
21.21.21.21. How to publishHow to publishHow to publishHow to publish a reporta reporta reporta report on FTP Serveron FTP Serveron FTP Serveron FTP Server????
The terminal allows publishing in internet reports about the account status on a periodic predeterminedbase. For this, it is necessary to set up connection to the internet via FTP. Open the "Tools Options" menuand go to the "Publisher" tab.
The red color specifies the format to be used for entering the data.
The data transfer can be performed in either active or passive mode. The main difference between them isthe side that opens connection to transfer data. In the active mode, the FTP server initiates connection, andin the passive one, the customer does.
Periodicity is the minimal time interval with which the report will be published. At that, if a trading positionor order changes in the terminal, the report will be forcedly and immediately published. This mechanismprovides data accuracy (except for the current market price and the profit) in the report.
After all settings have been made, click on the "Test" button. If the report has been successfully sent, thecorresponding line will appear in the "Journal".

8/7/2019 eBook Secrets of 4
http://slidepdf.com/reader/full/ebook-secrets-of-4 29/51
22.22.22.22. IndicatorsIndicatorsIndicatorsIndicators
No one can imagine the analysis of financial markets without technical indicators at the present time. Youcan create your own indicators or use the embedded ones. The embedded indicators work faster than thecustom ones and have a number of features that cannot be implemented in custom indicators. Forexample, there are indicators that can be attached to a chart both in the main window and in a subwindow. Besides, indicator can be calculated not on price and/or volume values, but on the values ofanother indicator.
Clever use of the embedded indicators will help to go far without diving into programming the own ones.
There are thirty embedded indicators in the MetaTrader 4 Client Terminal. Conditionally, all indicators canbe divided into four groups:
oscillators; trend indicators; Bill Williams' indicators; volumes.
Trend indicators help to allocate price movement in one direction and detect, synchronously or delayed,the moments when trends turn. Oscillators allow detecting such turns synchronously or in advance. Bill Williams' indicators have properties of both oscillators and trend indicators. Volumes analyze not the pricemovements as they are, but the amount of ticks that have income during the bar.
Summary Table of Embedded Indicators CharacteristicsSummary Table of Embedded Indicators CharacteristicsSummary Table of Embedded Indicators CharacteristicsSummary Table of Embedded Indicators Characteristics
Using the links in the table, you can view the code source of a custom indicator that corresponds with theembedded one.
IndicatorIndicatorIndicatorIndicator Accepted Accepted Accepted Accepted
Abbreviation Abbreviation Abbreviation AbbreviationTypeTypeTypeType
SeparateSeparateSeparateSeparate////
MainMainMainMain
Association Association Association Associationwithwithwithwiths / ms / ms / ms / m
Additio Additio Additio Additionalnalnalnal
lineslineslineslines
PeriodPeriodPeriodPeriod////
ShiftShiftShiftShift
Apply Apply Apply Apply totototo
MA MA MA MA MethodMethodMethodMethod
LevelLevelLevelLevelssss
Acceleration/Deceleration Oscillator
AC b s +/- - -/- - - +
Accumulation/Distri
bution A/D v s +/- - -/- - - +
Alligator Alligator b m -/+ - +/+ + + -
Average DirectionalMovement Index
ADX t s +/- - +/- + - +
Average TrueRange
ATR o s +/- - +/- - - +
Awesome Oscillator AO b s +/- - -/- - - +
Bears Power Bears o s +/- - +/- + - +
Bollinger Bands BB t m +/+ + +/+ + - +

8/7/2019 eBook Secrets of 4
http://slidepdf.com/reader/full/ebook-secrets-of-4 30/51
Bulls Power Bulls o s +/- - +/- + - +
Commodity Channel Index
CCI t s +/+ + +/- + - +
DeMarker DeM o s +/- - +/- - - +
Envelopes Env o m +/+ + +/+ + + +
Force Index FRC o s +/- - +/- + + +
Fractals Fractals b m -/+ - -/- - - -
Gator Oscillator Gator b s +/- - +/+ + + +
Ichimoku KinkoHyo
Ichimoku o m -/+ - +/- - - -
Market FacilitationIndex
BW MFI b s +/- - -/- - - +
Momentum Momentum o s +/+ + +/- + - +
Money Flow Index MFI v s +/- - +/- - - +
Moving Average MA t m +/+ + +/+ + + +
Moving AverageConvergence/Divergence
MACD o s +/- - +/- + - +
Moving Average of
Oscillator OsMA o s +/- - +/- + - +
On Balance Volume
OBV v s +/- - -/- + - +
Parabolic SAR Parabolic t m -/+ - +/- - - -
Relative StrengthIndex
RSI o s +/+ + +/- + - +
Relative Vigor Index RVI o s +/- - +/- - - +
Standard Deviation StdDev t s +/+ + +/+ + + +
Stochastic
Oscillator Stochastic o s +/- - +/+ + + +
Volumes Volumes v s +/- - -/- - - +
Williams’ PercentRange
%R o s +/- - +/- - - +

8/7/2019 eBook Secrets of 4
http://slidepdf.com/reader/full/ebook-secrets-of-4 31/51
Table field descriptionsTable field descriptionsTable field descriptionsTable field descriptions
Type
o – oscillator; t – trend indicator; b – Bill Williams' indicator; v – volume.
Separate/main
s – indicator is attached in a sub window by default; m – indicator is attached in the main window by default.
Association with s/m: Whether the indicator can or not be associated with the indicator already attached ina sub window (s) or in the main window (m).
Additional lines: Additional lines, Previous Indicator's Data and First Indicator's Data, appear in the "Apply to" field in the indicator's properties window when the indicator is being dragged.
Previous Indicator's Data - data of the latest indicator attached to the main window or to a sub window. Ifthere are no attached indicators, the Previous Indicator's Data are the chart data. And the indicator to beattached will be built based on the Close price of the chart.
First Indicator's Data - data of the indicator that was attached as the first to the main window or to a subwindow. If there are no attached indicators, the First Indicator's Data are the chart data. And the indicatorto be attached will be built based on the Close price of the chart.

8/7/2019 eBook Secrets of 4
http://slidepdf.com/reader/full/ebook-secrets-of-4 32/51
Period/shift: Availability of fields with corresponding names in the "Parameters" tab of the indicator's
properties window.
Apply to: Availability of the "Apply to" field in the "Parameters" tab of the indicator's properties window.
МА Method: Availability of the field of the same name in the "Parameters" tab (choice of moving averagebuilding method).
Levels: Availability of the "Levels" tab.

8/7/2019 eBook Secrets of 4
http://slidepdf.com/reader/full/ebook-secrets-of-4 33/51
23.23.23.23. How toHow toHow toHow to aaaattachttachttachttach iiiindicators to andicators to andicators to andicators to a ccccharthartharthart????
An indicator can be attached to a chart in six ways:
using the main menu command:
using button :

8/7/2019 eBook Secrets of 4
http://slidepdf.com/reader/full/ebook-secrets-of-4 34/51
double-clicking on the indicator name in the "Navigator" window;
selecting the "Navigator" window context menu command:
using the preset hot keys; dragging the indicator with the mouse into the main window or into the other indicator's sub
window (drag-and-drop).
The first five ways do not differ from each other fundamentally. Let us call them default modes of indicatorattaching. At this, the indicator will be drawn either in the chart or in a separate sub window, as by default.The fifth method, the dragging, is more interesting. Some indicators, when dragged into the chart, can becalculated from values of another indicator already attached to the chart. There are seven "special"indicators:
Bollinger Bands; Commodity Channel Index; Envelopes; Momentum;

8/7/2019 eBook Secrets of 4
http://slidepdf.com/reader/full/ebook-secrets-of-4 35/51
Moving Average; Relative Strength Index; Standard Deviation.
Embedded indicators can be combined with other indicators or calculated on values of other indicators. Atcombining, the indicator to be attached is just displayed over the indicator already attached, but has itsown scale and borders. In this case, the values of the indicator to be attached are calculated from thechart price values.
An embedded indicator that is displayed in a sub window by default can be combined with the indicatoralready attached in the sub window. An embedded indicator that is displayed in the main window by default can be combined with the indicator already attached in the main window.
Most embedded indicators can only be attached as in the default mode. Those seven "special" indicatorscan be attached both to the main window and to a sub window.
24. How to a24. How to a24. How to a24. How to attach tottach tottach tottach to the main window indicators that athe main window indicators that athe main window indicators that athe main window indicators that arererere oooopened inpened inpened inpened in aaaa sub windowsub windowsub windowsub windowby by by by ddddefaultefaultefaultefault????
Indicators below are opened in a sub window by default:
Commodity Channel Index Momentum Relative Strength Index Standard Deviation
Let us study properties of these indicators by the example of Commodity Channel Index. As it was already mentioned above, this indicator will be opened in a separate window by default:

8/7/2019 eBook Secrets of 4
http://slidepdf.com/reader/full/ebook-secrets-of-4 36/51
To attach CCI to the main window, one has to drag it to the chart. The indicator's properties will look asgiven below:
Actually, the chart is at the same time the indicator. So, if no other indicators are available, First Indicator'sData and Previous Indicator's Data - are data of the chart itself, and the drawing method on the previousindicator's values does not differ from that on the first indicator's values in any way.
Thus, to attach indicator into the chart window, one has to drag-and-drop it to the chart and select FirstIndicator's Data or Previous Indicator's Data. The obtained result:
Indicators Momentum, Relative Strength Index and Standard Deviation are attached to the chart window inthe same way.

8/7/2019 eBook Secrets of 4
http://slidepdf.com/reader/full/ebook-secrets-of-4 37/51
25. How to attach25. How to attach25. How to attach25. How to attach sub window indicatorssub window indicatorssub window indicatorssub window indicators that are opened in the main window by that are opened in the main window by that are opened in the main window by that are opened in the main window by
default?default?default?default?
Indicators of this group are listed below:
Bollinger Bands; Envelopes; Moving Average.
Let us consider Moving Average as an example. By default, this indicator looks as follows:
Attachment of the MA to a separate sub window, it is necessary to make some more actions than for theprevious example.

8/7/2019 eBook Secrets of 4
http://slidepdf.com/reader/full/ebook-secrets-of-4 38/51
First of all, a separate window must be "created". For this, let us attach to the chart any indicator that can
be opened in a sub window. For example, MACD:
Now, we can drag the Moving Average into the MACD window and select Previous Indicator's Data or FirstIndicator's Data in the properties window (since there is only one indicator in the sub window, the MACD, itwill be both the first and the last indicator).

8/7/2019 eBook Secrets of 4
http://slidepdf.com/reader/full/ebook-secrets-of-4 39/51
When a number of indicators are attached to one sub window, it is always possible to detect, which of
them on which is built. Selection of Previous Indicator's Data is displayed as "
", that of First Indicator'sData - as "=>".

8/7/2019 eBook Secrets of 4
http://slidepdf.com/reader/full/ebook-secrets-of-4 40/51
We have obtained MACD with Moving Average superimposed on it. We can stop at this, but we can alsodo so that only Moving Average will remain in the window. To do so, it is necessary to remove MACD. But,if we just remove it, the Moving Average, as indicator built on the MACD values, will be removed, as well.So, let us detach Moving Average from MACD first. Let us calculate on, for example, Close values.

8/7/2019 eBook Secrets of 4
http://slidepdf.com/reader/full/ebook-secrets-of-4 41/51
Now, the MACD can be removed, the Moving Average will remain in the separate window.
Thus, combining properties of different indicators, one can build a rather complicated system.

8/7/2019 eBook Secrets of 4
http://slidepdf.com/reader/full/ebook-secrets-of-4 42/51
26. Common p26. Common p26. Common p26. Common properties ofroperties ofroperties ofroperties of iiiindicatorsndicatorsndicatorsndicators aaaattachingttachingttachingttaching
If the indicator to be attached is calculated on values of the indicator that has several lines (morethan one), it will be calculated on values of zero line or the main line. In the code, this line isdetected using values of the first parameter of the SetIndexStyle function. So, for example, if theindicator to be attached is calculated on the MACD, the histogram values will be taken as thevalues for calculations since it is determined in the MACD code: SetIndexStyle (0,DRAW_HISTOGRAM).
Many indicators have, by default, fixed maximum and minimum, for example, RSI has. In thiscase, after it has been attached to another indicator, for example, MACD, their borders canmisalign, i.e., RSI just will not match the MACD window.
To correct this, it is necessary to uncheck the fields of maximum and minimum, and the indicators'scales will be independent on each other.

8/7/2019 eBook Secrets of 4
http://slidepdf.com/reader/full/ebook-secrets-of-4 43/51
When a number of indicators are attached to one sub window, it is always possible to detect,
which of them on which is built. Selection of Previous Indicator's Data is displayed as "->", that ofFirst Indicator's Data - as "=>".
In the above example, the indicators are built in the following way:
1. attached MACD;2. calculated MA on the First Indicator's Data, i.e., on values of the MACD;3. calculated RSI on the First Indicator's Data, i.e., again on values of the MACD;4. combined CCI with MACD;5. calculated Momentum on the Previous Indicator's Data, i.e., on values of the CCI.
Embedded indicators can be superposed onto not only other embedded indicators, but also onto
custom indicators. The attaching principles are the same. For example:

8/7/2019 eBook Secrets of 4
http://slidepdf.com/reader/full/ebook-secrets-of-4 44/51
27.27.27.27. How toHow toHow toHow to bbbbuilduilduilduild llllevelsevelsevelsevels????
Some indicators allow building of levels. For MA, one can build a channel using levels. To do so, it isnecessary to go to the "Levels" tab and set some values using the "Add" button.

8/7/2019 eBook Secrets of 4
http://slidepdf.com/reader/full/ebook-secrets-of-4 45/51
Now, if we make the MA line colored the same as the background, we will obtain channel built on the
moving average.

8/7/2019 eBook Secrets of 4
http://slidepdf.com/reader/full/ebook-secrets-of-4 46/51
28. What is28. What is28. What is28. What is """"vvvvisualization"isualization"isualization"isualization" ttttabababab????
In the end, let us consider one more property of indicators in the MetaTrader 4 Client Terminal. Allindicators, both embedded and custom ones, have this property. Moreover, it can apply to objects, as well,i.e., to graphical and technical analytical tools.
There is no secret that data analyzed on different timeframes of the same symbol can differ. Differenttechnical tools can be used, including different indicators with different settings. The following can be donein order not to re-adjust indicators again and again when switching between timeframes: Specify in theindicator properties window that timeframe, to which the selected indicator will be anchored.
And so on for all indicators and on all timeframes. In future, when switching between them, we will beable to see different indicators on different timeframes. It remains just to save the template to be used infuture for other symbols.
Example: On timeframes of H1 and M15, the same indicators, MACD and MA, are attached, but withdifferent periods.
On H1: MACD with values of 12, 26, 9; MA with the period of 7 is calculated on the MACD; MA with the period of 5 is calculated on the MA(7).
On M15: MACD with values of 24, 52, 18; MA with the period of 28 is calculated on the MACD;MA with the period of 20 is calculated on the MA(28).

8/7/2019 eBook Secrets of 4
http://slidepdf.com/reader/full/ebook-secrets-of-4 47/51

8/7/2019 eBook Secrets of 4
http://slidepdf.com/reader/full/ebook-secrets-of-4 48/51
29.29.29.29. FileFileFileFile llllibrary in MetaEditoribrary in MetaEditoribrary in MetaEditoribrary in MetaEditor
FilesFilesFilesFiles
All MQL4 programs are available through the "File Open" menu or through the toolbar. For moreconvenient access to MQL4 programs, there is a "Files" tab in the "Navigator" window.
In this tab, all MQL4 programs are displayed that stored in the "\MetaTrader 4\experts\" folder or in oneof its subfolders.
The following actions are available from context menu of this tab:
New File... — creation of an empty file with
extension MQ4. The file will be created in the folderselected at the moment of the file creation. To create afile in the "\MetaTrader 4\experts\" folder, one has toselect the root word "Files".
New Folder... — creation of a subfolder inany of the selected folders. To create a folder in"\MetaTrader 4\experts\", one has to select the rootword "Files".
Open — open the code of the selectedprogram in a separate window of MetaEditor.
Delete — deletion of the selected file orfolder.
Refresh — refreshing of the program list,synchronization with the "\MetaTrader 4\experts\"folder.
Show All — show/hide files of all types. By default, only files having extensions of MQ4, MQH,MQT are displayed in the "Files".

8/7/2019 eBook Secrets of 4
http://slidepdf.com/reader/full/ebook-secrets-of-4 49/51
Library Library Library Library
If you have not found a program in the file list of the "Navigator" window, you can download it from our
website. You do not need to open your browser to search in the website and download. You can get aquick access to all desired programs using MetaEditor. Just open the "Online Library" in the "Toolbox"window.
If one of the following pages - "Experts | Indicators | Scripts | Libraries | Articles" - is chosen, descriptionsof all new files and articles from the MQL4.com website are swapped automatically. Depending on thecurrent interface language, these files will be in certain language. It is important to remember thatprogram databases are different for different languages of the website. So, for example, you can findsomething in the Russian version that you cannot find in the English version. And vice versa.

8/7/2019 eBook Secrets of 4
http://slidepdf.com/reader/full/ebook-secrets-of-4 50/51
On each page, you can sort the contents by column. There is the search engine to get a quick access to
the desired program. All pages are searched in simultaneously. It should be noted that the search is case-sensitive. This means that "MACD" and "macd" are different words for the search engine.

8/7/2019 eBook Secrets of 4
http://slidepdf.com/reader/full/ebook-secrets-of-4 51/51
Having selected the necessary program, you can open the website page where it is described or download
the code of this program. To view the program description, select the "Open" command in the contextmenu. The program description will open in the "Help" tab of the "Toolbox" window. Double click on theauthor's name will open page containing the author's personal details.
To load the desired indicator into the terminal, one has to download it previously. To do it, you can use the"Download" button or select the corresponding command in the context menu. An MQ4 file will be saved
automatically in the corresponding folder of the Client Terminal ("\MetaTrader 4\experts\" or in one of itssubfolders). The code of the downloaded program will open in a separate window of MetaEditor.
SetupSetupSetupSetup
Windows of "Toolbox" and "Navigator" can be arranged in various order at your will. You have just to pointthe cursor onto the blue title bar of the window, press the left mouse button and drag the window to theplace you want. Windows can be moved not only within the main window of MetaEditor, but also drag"outside" This can be helpful when working with several monitors simultaneously