ecampa-2€¦ · 07/09/2016 · mitigation technologies in the eu economic assessment of ghg...
TRANSCRIPT

Mitigation technologies in the EU economic assessment of GHG mitigation policy options
for EU agriculture
EcAMPA-2 - World Outlook Conference, Amsterdam
10/06/2016
Ignacio Pérez Domínguez European Commission, Joint Research Center

2
Background

to update and give an overview of the evolution of agricultural GHG
emissions in Europe
to understand how model-calculated GHG emissions would evolve in
a reference scenario (i.e. medium-term projections to 2030)
to understand which technological mitigation options could be
applied and at which costs by EU Member States (i.e. analysis of a
mix of policy options regarding emission reduction targets,
mitigation options and technological development)
to understand whether the existing CAP budget and existing policy
instruments would be adequate to guarantee net emission reduction
in EU agriculture over the medium term (i.e. subsidies for adoption)
Motivation

Counterfactual scenarios & drivers
Emission reduction
target
Voluntary Subsidies
for adoption
Mandatory implementation of technologies
(additional)
Tech. progress
HET15 15%
HET20 20%
HET25 25%
SUBV80 20% 80%
SUBO80 20% 80% Yes *
SUBV80-noT 80%
SUBV80-TD 20% 80% ** Rapid
* For Anaerobic digestion, Variable Rate Technology and increased share of legumes on temporary grasslands ** Including Nitrate ad feed additive and vaccionation against methanogenic bacteria in rumen

Specific features:
endogenous tech. mitigation technologies (12-14)
endogenous response of tech. adoption to subsidization (ad-hoc calibration, early vs. late adopters)
dynamic representation "emission leakage" (i.e. efficiency developments)
Methodology: CAPRI

Main impacts: outline
Emissions
Prices
Supply
Technologies
Demand Trade
Leakage
Subsidies
Welfare
Sensitivity Analysis
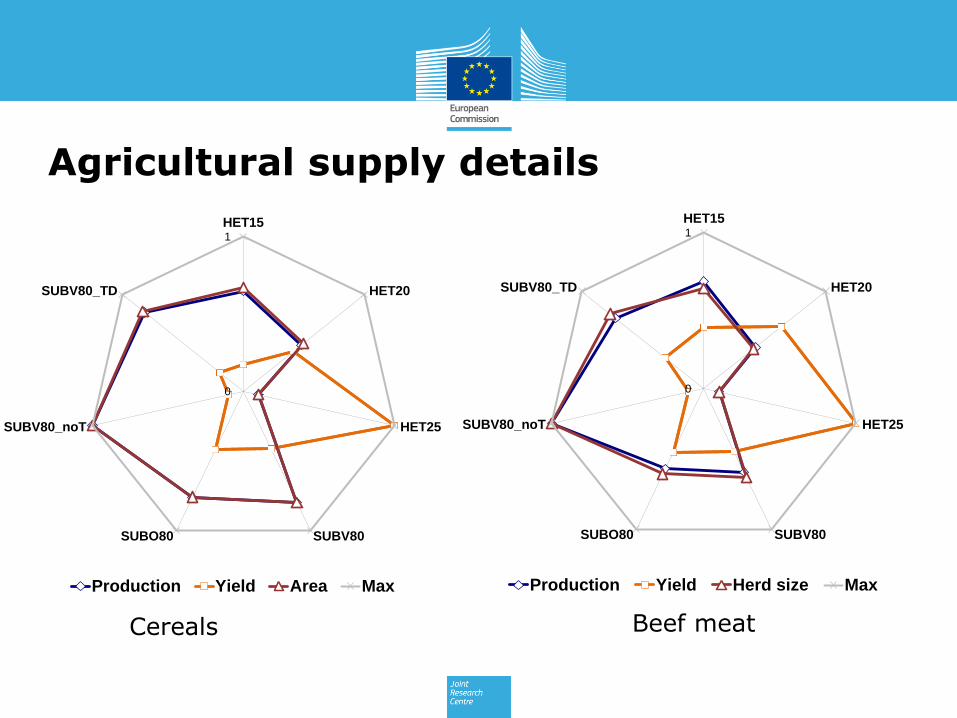
Agricultural supply details
Cereals Beef meat
0
1
HET15
HET20
HET25
SUBV80SUBO80
SUBV80_noT
SUBV80_TD
Production Yield Herd size Max
0
1
HET15
HET20
HET25
SUBV80SUBO80
SUBV80_noT
SUBV80_TD
Production Yield Area Max

Technology adoption: share in total mitigation
* Does not include the mitigation effects from the measures related to genetic improvements (as it is not possible to disentangle the mitigation from the production effects).
HET15 HET20 HET25 SUB80V
_noT SUB80V SUB80O
SUB80V_TD
Share in total GHG reduction
Mitigation technologies* 64% 56% 47% 99% 68% 68% 77%
Change in production levels and production shifts
36% 44% 53% 1% 32% 32% 23%

* The mitigation effects linked to genetic improvement measures cannot be analysed in isolation and are added to mitigation achieved by changes in production.
Technology adoption: share in total mitigation by technology
0
10
20
30
40
50
60
70
80
90
100
Mill
ion
to
nn
es C
O2
eq
mit
igat
ed
Production effects*
Vaccination
Feed additives: nitrate
Feed addtives: linseed
Low nitrogen feed
Fallowing histosols
Rice measures
Higher legume share
Variable Rate Technology
Precision farming
Nitrogen inhibitors
Fertilizer timing
Anaerobic digestion

Agricultural producer prices
HET15 HET20 HET25 SUB80V SUB80O SUB80V_
TD
SUB80V_
noT
%-difference to REF
Cereals 1.0 1.8 3.8 1.8 1.8 0.9 0.6
Oilseeds 1.3 2.2 4.0 0.5 0.5 -1.1 -1.0
Other arable field crops 1.7 3.0 5.3 2.3 2.3 1.2 0.7
Vegetables and
Permanent crops 0.5 1.0 1.7 1.1 1.1 1.0 0.5
Beef 13.3 25.8 43.6 16.6 16.8 9.8 -1.6
Pork meat 4.4 8.7 15.4 2.7 2.8 0.6 -2.7
Sheep and goat meat 5.8 11.5 17.5 8.5 8.7 5.6 -0.6
Poultry meat 2.1 4.0 6.8 1.7 1.7 0.5 -1.0
Cow and buffalo milk 6.6 12.2 19.6 1.9 2.0 -3.1 -6.6
Sheep and goat milk 4.5 9.1 15.0 3.5 3.5 -0.3 -4.1
Eggs 2.1 4.0 6.7 2.6 2.6 1.4 0.0

Emission leakage

Emission leakage by origin

Emission leakage in meat markets
-5
0
5
10
15
20
BEEF PORK SHEEP AND GOAT
Mill
ion
CO
2 t
on
ne
s Eq
Change in ROW emissions by commodity
HET15 HET20 HET25 SUBO80 SUBv80 SUBV80TD SUBV80noT

Limitations
• Comparative static analysis (e.g. no capital investment flows, no
market disruptions, normal weather conditions)
• Cost-effectiveness of agriculture in isolation (e.g. no multiplier
effects from other non-ETS sectors)
• Limited set of technologies and still not thoroughly tested in
isolation, very limited knowledge about adoption
• Baseline: limited information (EU Outlook only to 2025), not always
a perfect fit, no explicit climate payments… but good coverage of
pillar 1 and 2 payments
• Technology transfer for leakage calculations only based on historical
trends

Thank you for your attention
Joint Research Centre
Serving society
Stimulating innovation
Supporting legislation