eci altona test suite 2 technical 2 · port page sizes of up to 381 kilometers by ... used for...
TRANSCRIPT

1
Altona Test Suite 2.0 – Technical 2
© 2011–2012, European Color Initiative, www.eci.org
Altona Test Suite 2.0 – Technical 2
July 2012

2
Altona Test Suite 2.0 – Technical 2
© 2011–2012, European Color Initiative, www.eci.org
Background When version 1.0 of the Altona Test Suite was released, it addressed the all new PDF/X standard – most importantly how to find out whether output from a PDF/X file was cor-rect or not. The Altona Test Suite turned into a powerful tool for many participants of the print production food chain:• to find out whether a given product would
live up to their expectations• for users to ensure their entire workflow
could and did handle PDF/X files correctly• for associations to develop best practice
guidelines
The first international PDF/X standard was released in 2001 (PDF/X-1a, followed by PDF/X-3 in 2002). PDF/X has since turned into the predominant file exchange format in the printing industry. A decade later we find our-selves in a situation, where substantial new features have been introduced into the PDF format. A new part of the PDF/X standard has been released in 2008: PDF/X-4, finally sup-porting transparency, OpenType fonts, option-al content (aka layers), page sizes beyond 5 by 5 meters, JPEG2000 compression and more. Its companion standard, PDF/X-5, was developed in the same time, standardizing incomplete or partial file exchanges, targeting very specific needs in niche markets.
Some of the features defined in newer ver-sions of the PDF syntax and standardized in PDF/X-4 have proven to be more demanding for implementers than others:• Transparency introduced a completely
new dimension of complexity – any com-bination of object type, color space, blend mode, opacity, nesting of transparency groups and so forth can be used, and actu-ally is used by adventurous and demand-ing designers who in turn are driven by their insatiable customers longing for ever more enticing designs. Quite a number of developers found it less than trivial to cope with the challenges of such added com-plexity, both in terms of performance as well as correctness of the produced results.
• Optional content (often referred to as layers) has been around in the PDF format for a number of years but so far is only sup-ported by a small number of PDF vendors. It allows the creation of PDFs for which a user can switch between views, for exam-ple between different language versions of a text document, or between different instances of a PDF for packaging, where each instance reflects a different flavor or color of a product package, while all in-stances share the common graphic ele-ments. In addition, some page content can be turned on or off on an as needed basis – like measurement information, cut lines, identifying information or human readable instructions in a packaging file.
• The OpenType font format – an industry standard that has also been adopted as an ISO standard that uses the term Open Font Format (ISO/IEC 14496-22) – constitutes a consolidated font format building on both the PostScript and TrueType font formats, fully supporting Unicode as well as allow-ing intelligently for even the most complex scripts like Thai or classical Mongolian .
• JPEG2000 (ISO 15444) is an extremely flex-ible compression format for continuous tone images. It is not to be mixed up with JPEG, as it uses a completely different ar-chitecture and algorithms. While JPEG is always lossy, JPEG2000 can be used in a lossless way, on average offering better compression than ZIP. In addition it sup-ports a wide variety of color spaces and bit depths. Finally, it also provides options to decode images progressively – very conve-nient for very large and data intensive im-ages.
• Page size in PDFs can now easily exceed the original implementation limit of rough-ly 5 by 5 meters – using a parameter called UserUnits current implementations sup-port page sizes of up to 381 kilometers by 381 kilometers. While rarely in use so far, this very specific new feature is a nice ap-proach to make handling of large page siz-es that are not uncommon in very large for-mat printing more elegant.

3
Altona Test Suite 2.0 – Technical 2
© 2011–2012, European Color Initiative, www.eci.org
Quite a number of new features or exten-sions of existing features tend to have a less drastic impact but might easily be overlooked, like the support for version 4 ICC profiles or NChannel color.
Not only is the development work to sup-port the features introduced between PDF/X-1a and PDF/X-3 on one side and PDF/X-4 on the other side far from trivial – it is also a chal-lenge to do quality assurance and testing. Ven-dors tend to have their own set of carefully de-velped test files, but even they might not have thoroughly designed test files for each aspect of a PDF/X-4 implementation. Not to speak of their customers – how do they find out wheth-er the PDF/X-4 support claimed by a vendor is actually as extensive and accurate as suggest-ed by the vendor’s product marketing? Last but not least there will be a number of sce-narios where two experts may disagree about what the correct result should look like.
In addition to targeting features intro-duced in PDF/X-4, the Altona Test Suite 2.0 Technical Page also extends a number of tests that would have already applied to PDF/X-1a and PDF/X-3, for example more extensive cov-erage for smooth shades or PostScript and Tru-eType fonts than was available in Altona Test Suite 1.0 through 1.2.
The Technical Page of the Altona Test Suite 2.0 aims to address the needs of all par-ties involved in the production and process-ing of PDF/X-4 files. The test page contains a sequence of patches where each patch al-lows a relatively easy and straightforward as-sessment of the quality of output generat-ed from a PDF/X-4 file. All patches have been developed by members of the European Col-or Initiative – all of them experts familiar with PDF standards development, and with a sol-id background in software development and print production – over a period of about three years. Vendors have had the option for about eighteen months to access a beta ver-sion of the test page before it was released to the public.
Who should use the Altona Test Suite 2.0 Technical Page, and how? Vendors: It is expected that any vendor de-veloping tools or solutions that process or out-put PDF/X-4 files in any way will find the Alto-na Test Suite 2.0 Technical Page useful for:• quality assurance for the rendering results
of a RIPs, printer, proofing system or output on screen
• quality assurance for products that pro-cess PDF/X-4, for example color converters, ink optimizers, or tools that assemble com-plete or partial pages
• quality assurance for PDF consuming tools, like for example PDF import in authoring applications
Output service providers: any organiza-tion offering printing services in the broadest sense, that does accept PDF/X-4 files will find the test page useful to determine to which de-gree their workflow processes those PDF/X-4 files correctly, and to identify processing steps that provide less than perfect handling of PDF/X-4 files. Very often all tools involved in the processing of PDF/X-4 files fully support PDF/X-4, but are either not configured cor-rectly, or are combined into a processing se-quence that is not PDF/X-4 compliant. Thus output service providers can use the Altona Test Suite 2.0 Technical Page to• test the complete workflow processing
chain• test individual components for suitability• check the configuration for a component• track conformance of a setup on an ongo-
ing basis through regularly repeated con-trol output, for example in the form of a weekly process validation
Producers of print ready PDF files: it may sound as if only organizations or persons processing PDF/X-4 file have a need for a de-cent PDF/X-4 test page. Rather to the contrary: a producer of print ready PDF/X-4 files will need a means to judge the appearance to be

4
Altona Test Suite 2.0 – Technical 2
© 2011–2012, European Color Initiative, www.eci.org
expected from a compliant output system. In order to achieve this, already the author-ing application must support PDF/X-4 correct-ly, or at least a verification tool – like a general purpose PDF viewer – that correctly simulates the expected output based on the PDF/X-4 file that is going to be sent to a printer.
Repurposing: While the PDF format is of-ten considered as a final form format, where the only remaining processing steps are dis-play or creation of printed output, reality in the communication industry at large teach-es us that a substantial portion of PDF files originally intended just for a single print run tends to be reused and repurposed in numer-ous ways. Whether a file for gravure printing is to be sent to a digital printing device, or to be used for online advertising or on a tablet PC – no thinkable option exists that is not actually used at some point by quite a number of users.
Where appearance of content or brand col-ors is important to those initiating the com-munication, it usually becomes an absolute requirement to get the rendered output right regardless of what the ultimate communi-cation channel is. Though a smartphone will typically not render a non-trivial PDF/X-4 file correctly, precautions need to be taken that whatever is sent to such a smartphone is re-flecting the originally created appearance as correctly as possible.
Overall structure The Technical page consists of an overall struc-ture as listed below:• 15 patches that reflect real world use of
PDF/X-4 features, each identified by a sin-gle uppercase character (A through R)
• 6 blocks to systematically test the main transparency parameters, identified by a single uppercase character (S through Z):
• blend modes • blend color spaces • source color spaces• page label with color conversion indicators• page frame with different variants produc-
ing a uniform gray visual appearance.In addition to being contained in the test page, the patches A through R, a block consisting of
patches S through Z, as well as the label are also provided individually, with each of these contained on its own in a separate page.
Patch A
Patch design, practical relevancePatch A reflects a very common use of trans-parency: drop shadows. In addition it address-es the potential impact of the layout and de-sign applications’ “Transparency Flattener Presets” (resolution settings in particular) on the output quality. These settings often de-fine the image resolution of the so called soft masks which are created during the PDF cre-ation to achieve the transparent effect (here: drop shadow).
Regardless of the transparency handling by the output device (transparency flattening with higher resolution or transparency render-ing on e.g. the Adobe PDF Print Engine) the soft mask’s resolution may limit the quality un-der certain circumstances. For that reason it is important, that the creator of the PDF chooses the “Flattener Presets” properly.
Technical parametersAll object colors are defined as process colors. Three lines of text are placed on top of an im-age and a gray background. The drop shadow (100% black ink, using blend mode “Multiply”, with an opacity of 75%) is divided into two sec-tions to demonstrate the potential impact of the transparency processing settings. The part
A

5
Altona Test Suite 2.0 – Technical 2
© 2011–2012, European Color Initiative, www.eci.org
on the left hand side has a significantly higher resolution than the the part on the right hand side (200 ppi). The two drop shadow sections touch each other in the middle of the patch (under the letters “p” and “h”).
Example for incorrect output
Patch B
Patch design, practical relevancePatch B addresses possible issues from the in-teraction of color conversions with process-ing transparency or with transparency flatten-ing, in particular the conversion of spot colors (here: orange colored text objects) and RGB images to process colors. Digital printing pro-cesses often require the conversion of spot colors to process colors.
Technical parametersThe text color is a spot color named “Orange”. The drop shadow is defined in the same way as in patch A (100% black ink, using blend mode “Multiply”, with an opacity of 75%). The back-
ground image is divided into two sections: the lower left section is an RGB image (eciRGB v2) while the part in the upper right is a Device-CMYK image. The color properties assigned to the RGB image have been used to create the CMYK image in Photoshop: rendering in-tent “perceptual”, target profile “ISO Coated v2 300% (ECI)”.
Examples for incorrect outputIf the process color conversion of the spot color takes place after transparen-cy flattening, white boxes may occur under-neath the drop shadow (upper example).
A distinct color difference between the up-per right and lower left section of the back-ground image would indicate color manage-ment deficiencies (lower example).
B

6
Altona Test Suite 2.0 – Technical 2
© 2011–2012, European Color Initiative, www.eci.org
Patch C
Patch design, practical relevanceThis patch focuses on a property determin-ing the interaction of objects within a trans-parency group: The group may be “knockout” or “non-knockout”, which determines whether each of the objects within its stack are com-posited with one another and then into the group’s backdrop, or only with the group’s backdrop.
Technical parametersThe upper two lines of text belong to a trans-parency group set to non-knockout. As shown in the reference image (lower half of the patch), the transparency effect (blend mode “Multiply”) results in a darker color in the in-tersecting parts of the two text lines. The low-er two lines are set to knockout and therefore shall be rendered without a color difference in the intersecting parts. Both groups interact with the backdrop (rectangle filled with a light red process color).
Example for incorrect output
Patch D
Patch design, practical relevancePatch D is designed to systematically assess the color management capabilities in con-junction with transparency handling. Prop-er color rendering requires that all properties such as source color profile, rendering intent and target color profile (here the destination profile in the OutputIntent) are honored. The respective test objects are taken from the Visu-al page of the Altona Test Suite v1.1.
C
D

7
Altona Test Suite 2.0 – Technical 2
© 2011–2012, European Color Initiative, www.eci.org
Technical parametersThe patch contains three lines of objects, each line consisting of the five color manage-ment patches from the Visual page of the Al-tona Test Suite v1.1. The upper row’s transpar-ency setting is blend mode “Normal” with an opacity of 70%. The middle row is set to the blend mode “Color Dodge” with an opacity of 100%, while the bottom row’s blend mode is “Luminance” with an opacity of 100%. All ob-jects share the same gray background (Device-CMYK 0.32/0.32/0.32/0.32).
Expected outputNote: For a quick check the following hint may help: the first two color management squares per row (from left to right) shall be colored identically in all four sections. The sections are indicated by small icons. The three squares at the right hand side shall show a distinct color difference along the edges indicated by small lines underneath the squares.
Examples for incorrect output
Patch E
Patch design, practical relevanceThis patch is designed to detect possible is-sues with fine image details in conjunction with transparency processing or flattening.
Technical parametersA curve shaped, white (Device CMYK 0/0/0/0) object is placed on top of an image, using the blend mode “Normal” with an opacity of 42%. In the lower part of the image crisp black lines and red checker boards have been added. Each of the black lines is either one, two, three or four pixels wide. Each small square of the red checker board is sized at exactly one pixel.
Expected output
Enlarged view of fine image details
E

8
Altona Test Suite 2.0 – Technical 2
© 2011–2012, European Color Initiative, www.eci.org
Examples for incorrect output
Inadequate image compression settings ap-plied during transparency flattening may cause disturbing artifacts, e.g. ragged lines along the black strokes.
Patch F
Patch design, practical relevance Proper font handling is a challenge whenever text is affected by transparency flattening or trapping. PDF/X-4 extends the number of valid font types allowed in previous PDF/X version by adding support for Type 1 and TrueType fla-vored OpenType fonts. In addition issues may occur with text converted to outlines.
Technical parametersThe fonts used in this patch comprise all rel-evant font types such as PostScript Type 1, TrueType and OpenType, the latter in both TrueType and PostScript flavored versions. The fonts chosen for the patch cover differ-ent scripts such as Latin, Asian or Hebrew and Arabic typefaces. Besides that, the characters were selected to address issues that may oc-cur with different font encodings and certain characters such as ligatures, as well as diacritic marks like the French accent aigu. The glyphs of the two words at the bottom of the patch have been converted to outlines in Adobe Photoshop (“Muchas”) and Adobe InDesign (“Gracias”).
Patch G
Patch design, practical relevanceThe patch combines smooth shade effects with transparency effects, using combinations of device independent and device dependent color definitions and blending spaces. Design-ers will in some cases play with both kinds of effects until they arrive at an appearance that is to their liking. As can be seen already from comparing the same characters in the left ver-tical character sequence and the right vertical character sequence, small but sometimes sig-nificant differences in appearance occur de-pending on exactly how the effects are used.
F
G

9
Altona Test Suite 2.0 – Technical 2
© 2011–2012, European Color Initiative, www.eci.org
Technical parametersBackground: very wide dashed line alternating between 10%K and 70%K.
Foreground: Characters A, B, C and D, in Myri-ad Bold 48pt, filled with axial smooth shading in the form of Type 1 patterns:
• Each smooth shade is built using Wide Gamut RGB ICC based color space
• each character sits on top two yellow and blue squares, these squares are colored us-ing Lab
• the characters on top of these squares use transparency
• A: Difference 100% • B: Luminosity 60% • C: Colour 100% • D: Exclusion 75%• each character is grouped together with
the yellow and blue square underneath it, where some groups use an isolated group, whereas others don’t, and for some the group is isolated and for others it is non-isolated.
• the vertical A-B-C-D sequence on the left uses Device CMYK as blending space for the transparency group, whereas the verti-cal A-B-C-D sequence on the right uses the Wide Gamut RGB ICC based color space as its blending space.
Expected output

10
Altona Test Suite 2.0 – Technical 2
© 2011–2012, European Color Initiative, www.eci.org
Examples for incorrect output

11
Altona Test Suite 2.0 – Technical 2
© 2011–2012, European Color Initiative, www.eci.org
Patch H
Patch design, practical relevance The patch is intended to test proper render-ing of all types of gradients, including the sev-en smooth shade types defined in the PDF language, conventional “PostScript 1 style” gra-dient built by vector elements as well as pix-el based gradients. Common smooth shade types like axial and radial shades usually are rendered properly, while more complex types such as the so called “Illustrator gradient mesh” are sometimes not processed correctly. Anoth-er issue are gradients containing a spot color where overprinting and transparency proper-ties may not be handled properly.
Technical parametersThe smooth shades are arranged from top to bottom in this sequence: function-based shading (type 1), axial shading (type 2), radial shading (type 3), free-form Gouraud-shaded triangle mesh (type 4), lattice-form Gouraud-shaded triangle mesh (type 5), Coons patch mesh (type 6) and tensor-product patch mesh (type 7), better known as “Illustrator gradient mesh”.
The black lines mark variants of gradients rep-resenting different approaches in the design stage. The cyan to yellow gradient contains (from top to bottom): a smooth shade (axial shading), a conventional vector gradient and a pixel gradient. The four spot color gradients comprise axial shadings using the spot color Orange in different ways (from top to bottom): spot color Orange only, DeviceN (black and Or-ange), and two axial shadings created by two pieces placed on top of each other: Orange on black (transparency, blend mode “Multiply” with an opacity of 1.0) and at the bottom Or-ange on black (set to overprint).
Examples for incorrect output
The four shades in the lower section show sig-nificantly less saturated colors compared to the reference image.
In this case the lowermost spot color gradient is too light as the black gradient underneath the orange gradient is ignored (overprinting not honored).
H

12
Altona Test Suite 2.0 – Technical 2
© 2011–2012, European Color Initiative, www.eci.org
Patch K
Patch design, practical relevanceThe patch shows several variants that go back to colorizing a grayscale image in an author-ing application. Designers often use different ways to achieve the same visual appearance, in this case a violet tint in the upper part and a brownish tint for printing with black and a spot color Orange in the lower part. The PDF properties of the different sections depend on the file formats of the source images and how the grayscale images have been colorized.
Technical parametersIndicated by black lines, the six sections reflect the following ways of colorizing: • the topmost segment is an Lab image cre-
ated in Photoshop • the 2nd segment consists of three gray-
scale images placed on top of each other, each colored differently, and the top ones set to overprint in InDesign.
• the 3rd segment has been created as a duo tone image in Photoshop.
The three brownish image segments have been created in Photoshop based on the same file as for the first three segments to reflect the impact of the source file type on the PDF prop-erty. The Photoshop source image contains two channels colorized with process black ink (top) and Orange ink (bottom):
• the 4th segment was saved as a Photoshop PDF (resulting in two DeviceN images),
• the 5th segment was saved as TIFF (one in-dexed DeviceN image)
• the 6th segment was saved as 16bit Photo-shop (PSD) file (one DeviceN image).
Each of the six segments was created as a sep-arate file and placed on an InDesign page which was then exported as a PDF file.
Examples for incorrect output
K

13
Altona Test Suite 2.0 – Technical 2
© 2011–2012, European Color Initiative, www.eci.org
Patch L
Patch design, practical relevanceThis patch deals with the use of transparen-cy and white page objects to lighten a given background.
Technical parametersThe background color is a 100% tone value of the spot color “Orange”, partially covered by two “white” squares (0% of the respective col-or). The color space of the upper rectangle is a separation color space named “PANTONE Warm Gray 6C” using a tint value of 0.0. The lower rectangle is colorized with Device CMYK 0/0/0/0. Both squares use blend mode “Nor-mal” with an opacity of 50%.
Patch M
Patch design, practical relevanceThis patch consists of four gray images with different color properties, placed on top of a gray background. The practical relevance of the different color properties are idiosyncra-sies of common design and workflow appli-cations used along the workflow from design to output. These applications sometimes tend to alter the color specification of a given gray-scale image.
Technical parametersThe background is a vector object, color-ized with 22% of process black (Device CMYK 0/0/0/22%). The four rectangles in the fore-ground are images containing 100% black pix-els only using the following color spaces (from top to bottom): • IndexedDevice CMYK• IndexedDeviceN• Separation Black, and • DeviceGray. The image’s blend mode is “Normal”, with an opacity of 50%.
L

14
Altona Test Suite 2.0 – Technical 2
© 2011–2012, European Color Initiative, www.eci.org
Examples for incorrect output
Patch N
Patch design, practical relevanceThis patch demonstrates two popular meth-ods used by designers to darken a background with a gradient.
Technical parametersThe background is divided into the two sec-tions “green” (Device CMYK 40/0/100/0) and “or-ange” (spot color “Orange”). The blend mode used for the two gradients is “Darken”. The gra-dient on the left hand side is a grayscale im-age, and the gradient on the right hand side is a smooth shading colorized with process color
black (coded as a single channel DeviceN col-or space).
Expected outputProper rendering puts the gradients into the process color black channel only and does not affect the color values of the green and orange background areas.
Examples for incorrect output
N
15
Altona Test Suite 2.0 – Technical 2
© 2011–2012, European Color Initiative, www.eci.org
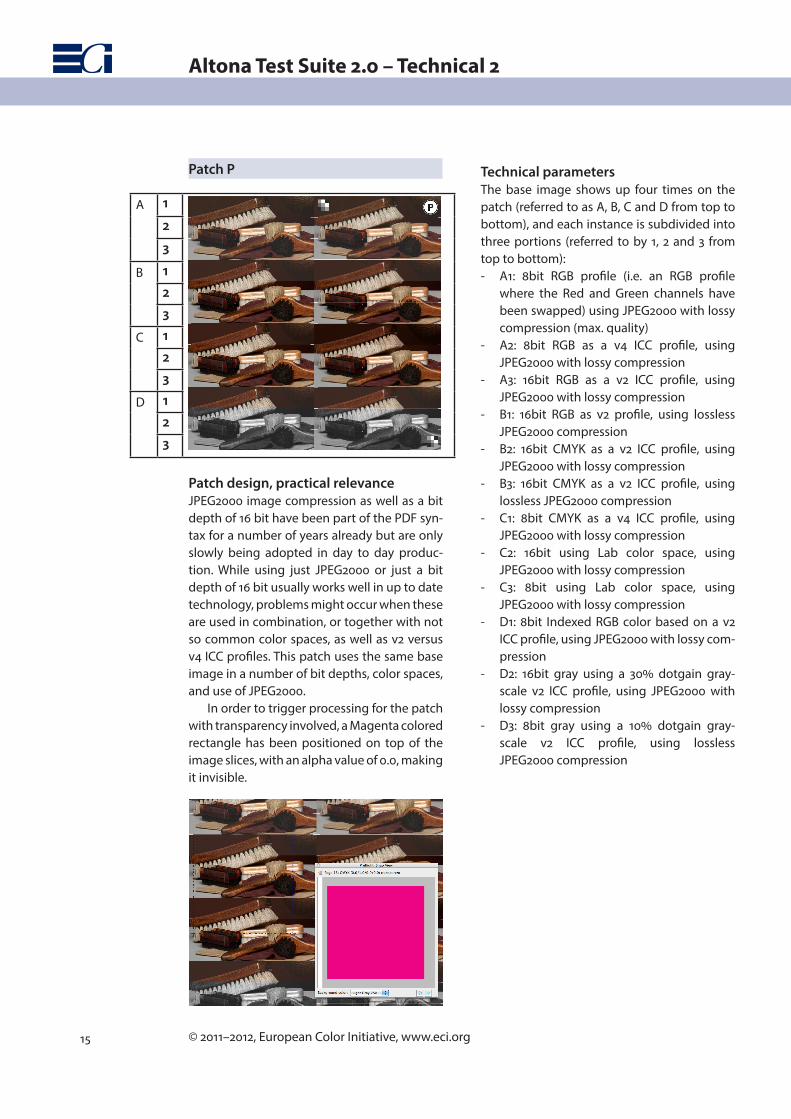
Patch P
Patch design, practical relevanceJPEG2000 image compression as well as a bit depth of 16 bit have been part of the PDF syn-tax for a number of years already but are only slowly being adopted in day to day produc-tion. While using just JPEG2000 or just a bit depth of 16 bit usually works well in up to date technology, problems might occur when these are used in combination, or together with not so common color spaces, as well as v2 versus v4 ICC profiles. This patch uses the same base image in a number of bit depths, color spaces, and use of JPEG2000.
In order to trigger processing for the patch with transparency involved, a Magenta colored rectangle has been positioned on top of the image slices, with an alpha value of 0.0, making it invisible.
Technical parametersThe base image shows up four times on the patch (referred to as A, B, C and D from top to bottom), and each instance is subdivided into three portions (referred to by 1, 2 and 3 from top to bottom):- A1: 8bit RGB profile (i.e. an RGB profile
where the Red and Green channels have been swapped) using JPEG2000 with lossy compression (max. quality)
- A2: 8bit RGB as a v4 ICC profile, using JPEG2000 with lossy compression
- A3: 16bit RGB as a v2 ICC profile, using JPEG2000 with lossy compression
- B1: 16bit RGB as v2 profile, using lossless JPEG2000 compression
- B2: 16bit CMYK as a v2 ICC profile, using JPEG2000 with lossy compression
- B3: 16bit CMYK as a v2 ICC profile, using lossless JPEG2000 compression
- C1: 8bit CMYK as a v4 ICC profile, using JPEG2000 with lossy compression
- C2: 16bit using Lab color space, using JPEG2000 with lossy compression
- C3: 8bit using Lab color space, using JPEG2000 with lossy compression
- D1: 8bit Indexed RGB color based on a v2 ICC profile, using JPEG2000 with lossy com-pression
- D2: 16bit gray using a 30% dotgain gray-scale v2 ICC profile, using JPEG2000 with lossy compression
- D3: 8bit gray using a 10% dotgain gray-scale v2 ICC profile, using lossless JPEG2000 compression
A 1
2
3
B 123
C 123
D 123

16
Altona Test Suite 2.0 – Technical 2
© 2011–2012, European Color Initiative, www.eci.org
Examples for incorrect output
Patch Q
Patch design, practical relevanceThis patch makes use of patterns, smooth shades, drop shadows, transparency effects and nested grouping of objects such that in some instances isolated transparency groups were created and in other instances not. The patch does not follow any specific logic, but rather aims at being an ‘unplanned’ arrange-ment of graphic objects using all kinds of graphic effects available in today’s software products.
Technical parametersArbitrary, partially grouped arrangement of vector objects making use of various effects.

17
Altona Test Suite 2.0 – Technical 2
© 2011–2012, European Color Initiative, www.eci.org
Example for incorrect output
Patch R Patch design, practical relevanceThis patch explores effects that result from combining transparency with overprint. In ad-dition it makes use of optional content.
Technical parametersThe patch is built according to the informa-tion given in ISO 32000-1 – Document man-agement – Portable document format – Part 1: PDF 1.7, page 744, Figure L.20 – Blending and overprinting (11.7.4.3, “Compatibility with Opaque Overprinting”).
In addition, the contents of the patch is re-peated as optional content set to be non-visi-ble, where this optional content uses different coloring, and is offset slightly to the right and to the top.
Example for incorrect output

18
Altona Test Suite 2.0 – Technical 2
© 2011–2012, European Color Initiative, www.eci.org
Block with patches S-Z – Structure
Patch design, practical relevanceThe main goal of patches S through Z is to completely iterate through certain combina-tions of graphic state parameters that affect the appearance of transparent objects directly or indirectly. The graphic state parameters that are being permutated are:• type of object: on the lowest level, the
patch uses miniature elements consisting of a filled object, a stroked object (line) and a text (a minus sign); all three are arranged to form a rectangular shape; as all are col-ored using the same color space, all three should have identical appearance
• color space: each object triple appears us-ing several color spaces:
• variations of black or gray, using Device-Gray (using a value of 0.45, equivalent to 55% black), Device CMYK (CMY channels are zero, K has a value of 25%), Separa-tion Black (with a value of 45%) and a sin-gle channel DeviceN with Black as its only colorant (with a value of 60%).
• ICC based RGB (1.0/0.0/0.0 RGB tagged with ECI-RGB.V1.0 profile)
• Device CMYK (light pale green, 30%/0%/ 70%/10%)
• spot color by means of a Separation color space named “Orange”
• 16 different blend modes for the transpar-ent ‘green’ object (using a Device CMYK fill of 85%/15%/80%/25%) on top of the background with the object triples in the various color spaces described above.
• 3 different blend color spaces – Device-CMYK, ICC based RGB and ICC based Gray
• the 3 different blend color spaces are used by a non-isolated transparency group (on the left) and by an isolated transparency group (on the right).
The inclusion of all the combinations implied by this setup makes it possible to systemati-cally check that should any of these occur in real world workflows they are handled correct-ly. It is obvious that it is more likely for some than for others to happen in real world doc-uments, but on the background that modern
authoring tools enable users to actually cre-ate documents that use arbitrary combina-tions of object types, color spaces and other graphic state parameters it is to be expected that any of the combinations found in patches S through Z will one day be encountered in a real world workflow.
In order to make it easy to identify incor-rect rendering in a complex patch like this one, it was decided to mirror each patch in the form that a correct appearance is shown directly to the right of the actual patch segment. With the areas of the various objects touching each other, it is relatively easy to spot deviations be-tween neighboring objects where they should actually look the same.
Each segment of a column‘s background is a combination of three basic objects:
stroke › fill ›
text ›
Each segment of a column‘s background uses a different color space:
DeviceGray: .45
Device CMYK (%): 0/0/0/25
Separation Black: 45%
DeviceN Black: 60%
ICCbasedRGB, ECI-RGB (0..255): 255/0/0
Device CMYK (%): 30/0/70/10
Spot Color „Orange“: 85%
19
Altona Test Suite 2.0 – Technical 2
© 2011–2012, European Color Initiative, www.eci.org
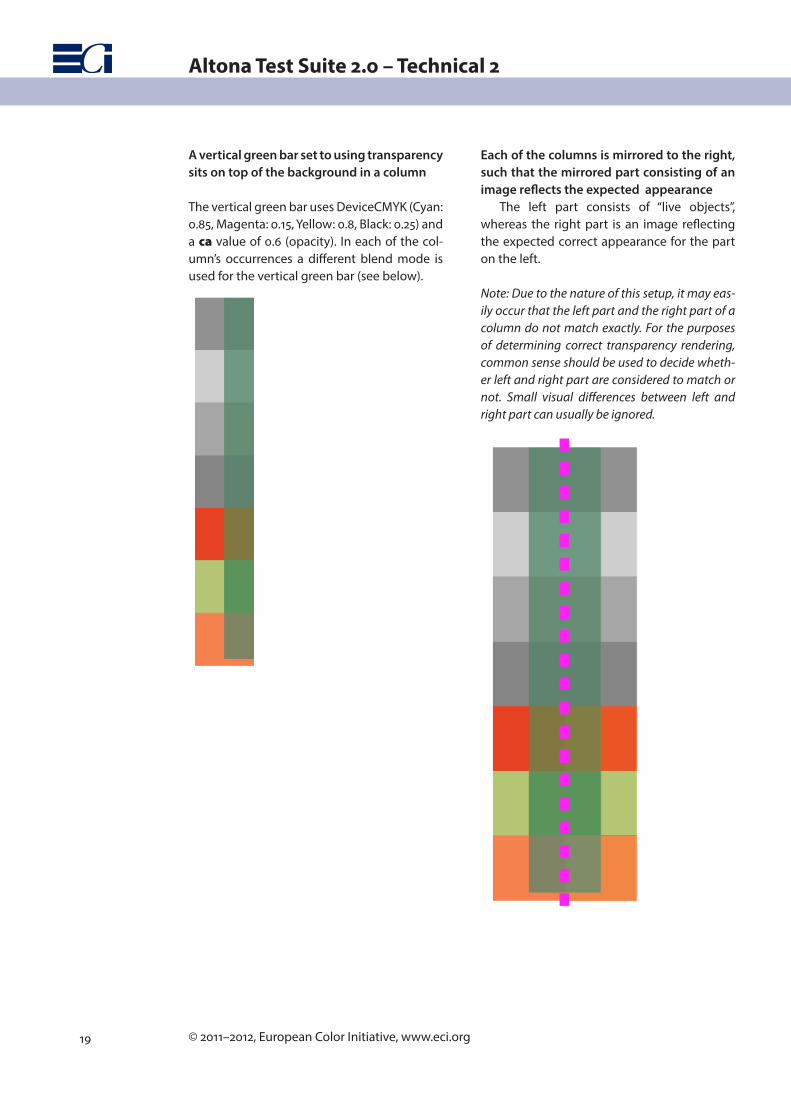
A vertical green bar set to using transparency sits on top of the background in a column
The vertical green bar uses Device CMYK (Cyan: 0.85, Magenta: 0.15, Yellow: 0.8, Black: 0.25) and a ca value of 0.6 (opacity). In each of the col-umn’s occurrences a different blend mode is used for the vertical green bar (see below).
Each of the columns is mirrored to the right, such that the mirrored part consisting of an image reflects the expected appearance
The left part consists of “live objects”, whereas the right part is an image reflecting the expected correct appearance for the part on the left.
Note: Due to the nature of this setup, it may eas-ily occur that the left part and the right part of a column do not match exactly. For the purposes of determining correct transparency rendering, common sense should be used to decide wheth-er left and right part are considered to match or not. Small visual differences between left and right part can usually be ignored.

20
Altona Test Suite 2.0 – Technical 2
© 2011–2012, European Color Initiative, www.eci.org
A 4 by 4 matrix of columns iterates over the 16 blend modes available in PDF
The columns are organized in a 4 by 4 matrix, where each column uses a different blend mode for the vertical green bar. All oth-er objects of a column are identical across all column occurrences.

21
Altona Test Suite 2.0 – Technical 2
© 2011–2012, European Color Initiative, www.eci.org
Six blocks iterate over CMYK, RGB and gray blend color space, for both non-isolated and for isolated transparency groupsEach 4 by 4 matrix as a whole uses different combinations of isolated versus non-isolated transparency group and blending color space, from left to right:• non-isolated, Device CMYK (patch S)• non-isolated, ICC based RGB (patch T)• non-isolated, ICC based gray (patch V)• isolated, Device CMYK (patch W)• isolated, ICC based RGB (patch X)• isolated, ICC based gray (patch Z)
Patches S - Z

22
Altona Test Suite 2.0 – Technical 2
© 2011–2012, European Color Initiative, www.eci.org
Examples for incorrect output

23
Altona Test Suite 2.0 – Technical 2
© 2011–2012, European Color Initiative, www.eci.org
Page label
Patch design, practical relevanceThe page label (on the right hand side of patch “R”) contains two small gray squares in its low-er right corner. The purpose of these objects is to indicate issues that may arise after color conversions or the exchange of the OutputInt-ent profile (OI).
The practical relevance of the upper square (“Color Conversion Indicator”; lighter gray) are e.g. ink saving color conversions prior to trans-parency rendering or transparency flattening. Depending on the blend mode, color conver-sions of objects with live transparency may significantly affect the visual appearance of these objects and their background.
The bottom square (“OI Swap Indicator”, darker gray) addresses the importance of the OutputIntent profile for the visual transparen-cy effect of objects colored with output inde-pendent colors, e.g. RGB images.
Technical parametersThe “Color Conversion Indicator” consists of three page objects. The background is a vec-tor element using Device CMYK with the col-or values 80/57/67/10. The background object is fully covered by an object using Device-CMYK with the color values 0/0/0/66, and the transparency blend mode “Hard Light” with an opacity of 100%. The top most element is “X” shaped using Device CMYK with the color val-
ues 0/0/0/39 – the expected appearance for the area outside the “X” shape.
The design of the “OI Swap Indicator” is almost identical, except for two differences: The background object is an image object us-ing the Lab color space with the color values 60/0/0 and an assigned perceptual rendering intent. The transparency blend mode is “Color Burn”.
Expected outputProper rendering results in two uniformly gray colored squares. The upper square, col-orized with 39% of process black ink and the lower one colorized with the CMYK values 38/30/30/53.
Examples for incorrect output
24
Altona Test Suite 2.0 – Technical 2
© 2011–2012, European Color Initiative, www.eci.org
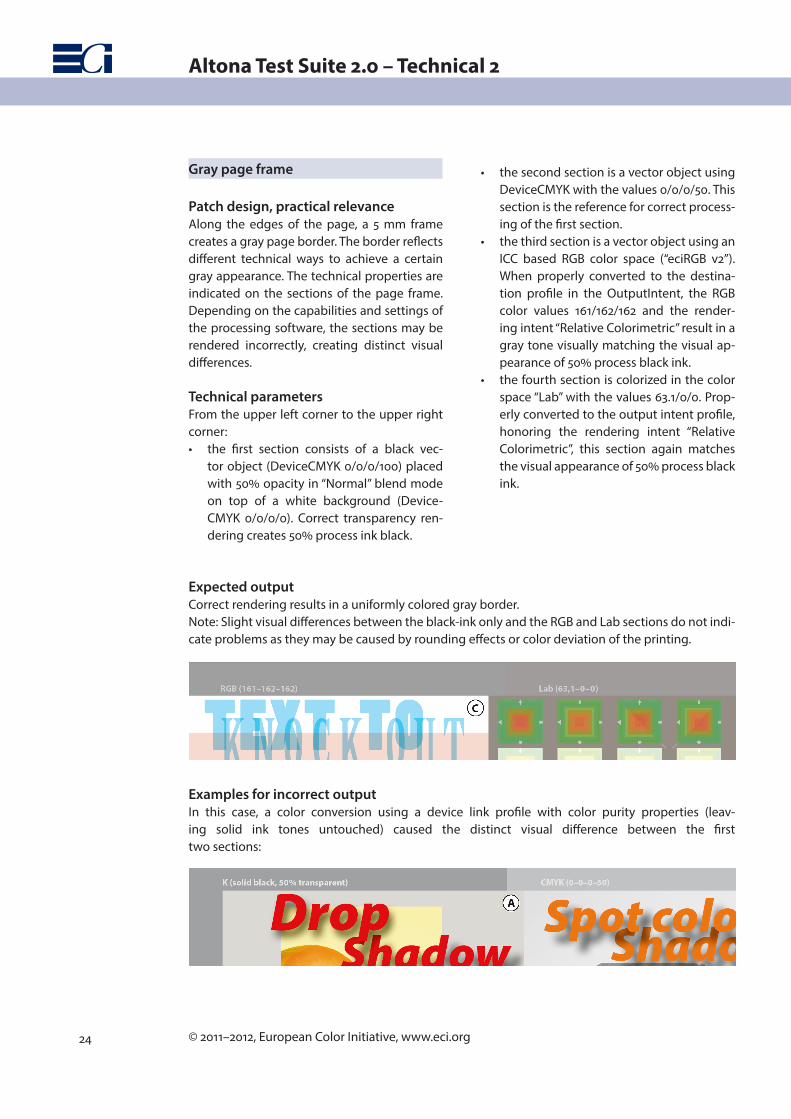
• the second section is a vector object using Device CMYK with the values 0/0/0/50. This section is the reference for correct process-ing of the first section.
• the third section is a vector object using an ICC based RGB color space (“eciRGB v2”). When properly converted to the destina-tion profile in the OutputIntent, the RGB color values 161/162/162 and the render-ing intent “Relative Colorimetric” result in a gray tone visually matching the visual ap-pearance of 50% process black ink.
• the fourth section is colorized in the color space “Lab” with the values 63.1/0/0. Prop-erly converted to the output intent profile, honoring the rendering intent “Relative Colorimetric”, this section again matches the visual appearance of 50% process black ink.
Gray page frame
Patch design, practical relevanceAlong the edges of the page, a 5 mm frame creates a gray page border. The border reflects different technical ways to achieve a certain gray appearance. The technical properties are indicated on the sections of the page frame. Depending on the capabilities and settings of the processing software, the sections may be rendered incorrectly, creating distinct visual differences.
Technical parametersFrom the upper left corner to the upper right corner:• the first section consists of a black vec-
tor object (Device CMYK 0/0/0/100) placed with 50% opacity in “Normal” blend mode on top of a white background (Device-CMYK 0/0/0/0). Correct transparency ren-dering creates 50% process ink black.
Expected outputCorrect rendering results in a uniformly colored gray border. Note: Slight visual differences between the black-ink only and the RGB and Lab sections do not indi-cate problems as they may be caused by rounding effects or color deviation of the printing.
Examples for incorrect outputIn this case, a color conversion using a device link profile with color purity properties (leav-ing solid ink tones untouched) caused the distinct visual difference between the first two sections:

25
Altona Test Suite 2.0 – Technical 2
© 2011–2012, European Color Initiative, www.eci.org
Evaluating the test page
The Technical Page has been designed for a vi-sual evaluation. Each patch is split in two sec-tions. One section contains “live content” while the other section provides a reference image with the expected “correct result” result. The reference image is marked by two icons in the upper left and lower right corner.
Some patches are split horizontally with the reference image in the lower part:
Reference image marked by -icons in upper left and lower right corner.
Other patches are split vertically with the ref-erence image in the right hand sided section.
A
F
The reference images of the patches S through Z are mirrored to the right making it easier to evaluate the result of the live part. Due to space restrictions, the reference images are marked by single icons, which are located at the bottom of the respective patch.
As it is not trivial to provide a “correct re-sult” of this test page that will look correct un-der all circumstances, and can be achieved in exactly the same way by an output device, evaluating output of the test page most often will not be a yes or no test. Rather, under many circumstances very small variations will have to be considered acceptable and equivalent to an officially correct result.
In order to make evaluations as compa-rable as feasible, the evaluation table on the next page is recommended. For carrying out an evaluation of the output of the test page, the schematic structure of the test page on the page after the evaluation table may be used.
The following classification should be used for tracking evaluation results in the table
• no issues• Very small deviations, but still acceptable• Deviations that may or may not be accept- able• Clearly unacceptable deviations• Some or all of the patch not rendered at all
When carrying out an evaluation using the schematic structure, issues should be indicat-ed by using “O” or an appropriate number of “X”:
• O - no issues• X - Very small deviations, but still accepta- ble• XX - Deviations that may or may not be ac- ceptable• XXX - Clearly unacceptable deviations• XXXX - Some or all of the patch not rendered at all
Note: When doing a visual assessment, sig-nificant color differences between spot color objects in the live part of a patch versus their appearance in the reference image do not in-dicate an error!

26
Altona Test Suite 2.0 – Technical 2
© 2011–2012, European Color Initiative, www.eci.org
Altona Test Suite 2.0 · Technical Page · Evaluation templateAltona Test Suite 2.0 · Technical Page · Evaluation templateAltona Test Suite 2.0 · Technical Page · Evaluation templateAltona Test Suite 2.0 · Technical Page · Evaluation templateAltona Test Suite 2.0 · Technical Page · Evaluation templateAltona Test Suite 2.0 · Technical Page · Evaluation templateAltona Test Suite 2.0 · Technical Page · Evaluation template
Patch No issues Very small deviations,
but still acceptable
Deviations that may or may not be acceptable
Clearly unacceptable deviations
Some or all of the patch not rendered
at all
Remarks
A
B
C
D
E
F
G
H
K
L
M
N
P
Q
R
S
T
V
W
X
Z
Label
Page frame
Σ:
27
Altona Test Suite 2.0 – Technical 2
© 2011–2012, European Color Initiative, www.eci.org
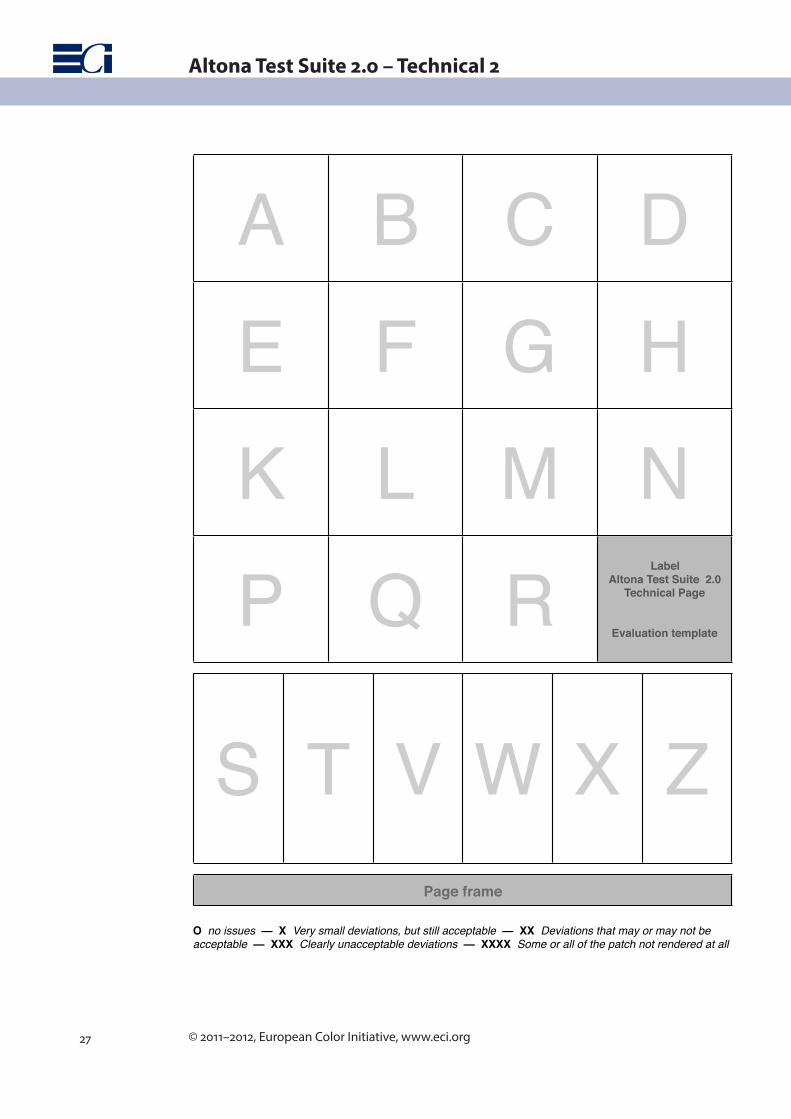
A B C DE F G HK L M NP Q R
LabelAltona Test Suite 2.0
Technical Page
Evaluation template
S T V W X ZPage frame
O no issues — X Very small deviations, but still acceptable — XX Deviations that may or may not be acceptable — XXX Clearly unacceptable deviations — XXXX Some or all of the patch not rendered at all
Background 2
Who should use the Altona Test Suite 2.0 Technical Page, and how? 3
Overall structure 4
Patch A 4
Patch B 5
Patch C 6
Patch D 6
Patch E 7
Patch F 8
Patch G 8
Patch H 11
Patch K 12
Patch L 13
Patch M 13
Patch N 14
Patch P 15
Patch Q 16
Patch R 17
Block with patches S-Z – Structure 18
Patches S - Z 21
Page label 23
Gray page frame 24
Evaluating the test page 25
Visual reference: Separations 28

28
Altona Test Suite 2.0 – Technical 2
© 2011–2012, European Color Initiative, www.eci.org
Visual reference: Separations
Process colors “cmyk” and spot color “Orange”
Process colors “cmy”
Spot color “Orange”
Process color “k”