eclac’s value chain dashboard
TRANSCRIPT

Eclac’s Value Chain Dashboard
Sebastián CastresanaDivision of International Trade and Integration, ECLAC,
United Nations
Bangkok, 10th July 2019

2010-2013 2014 2015 2016 2017 2018 2019
Works withNational IOT;International Trade Data
Assessment:Eora MRIO -
GTAP - WIOD
Commissioning Project ECLAC IPEA
(2013)
Methodologicalworkshopsin Brasilia
First Results for 5 countries;
Analysis teams of consultants
Validation workshopSantiago
Preliminary South American IOT;
8 countries18/11/2015
Improvement of South-American
IOT;Opening Services;
Inclusion of Ecuador and
Paraguay;10 countries
Relaunch of South American IOT;
8 countries6-07-2016
Project in continuous development: we have been working to get to
more recent years (2014-2015) and include
the Regional IOT in a global project (2019)
Launch ofAndean
Community IOT(2005 and 2011)
Start of integration of the Regional
IOT into aGlobal IOT
Launch the first Version of FEALAC
IOT
Lauch of theMERCOSUR IOT
(2005-2011)(25-06-2018)
South-American IOT 2011
(1-08-2018)
Launch of the Central American
IOT and First Version of the Regional IOT(July 2019)
SIECA
2020
KEY MILESTONES IN LAC IOT
Launch the first version of ECLAC
VC Dashboard

National and Sub-regional IOTs in Latin America (18 countries)
Andean Community IOT*
MERCOSUR IOT*
18 National Matrices40 sectors
Years: 2005* and 2011
Central America IOT
Mexico IOT
Chile IOT*

Forty sectors selected to join a South American input-output matrix
Sector Description ISIC Code (Rev. 3)
s1 Agriculture and forestry 0111 0112 0113 0121 0122 0130 0140 0200
s2 Hunting and fishing 0150 0500
s3 Mining (energy) 1010 1020 1030 1110 1120 1200
s4 Mining (non-energy) 1310 1410 1421 1422 1429
s5 Meat and meat; dairy milk 1511 1512 1514 1520
s6 Grinding, baking and pasta 1531 1532 1541 1544
s7 Sugar and confectionery products 1542 1543
s8 Other food products 1513 1549
s9 Drinks 1551 1552 1553 1554
s10 Snuff products 1600
s11 Textiles 1711 1712 1729 1730
s12 Garments 1721 1722 1723 1810 1820 1911 1912
s13 Footwear 1920
s14 Wood and products of wood and cork 2010 2021 2022 2023 2029
s15 Pulp, paper, paper, printing and publishing 2101 2102 2109 2211 2212 2213 2219 2221 2222 2230
s16 Coke, refined petroleum and nuclear fuel 2310 2320 2330
s17 Basic chemicals 2411 2412 2413
s18 Other chemicals (excluding pharmaceuticals) 2421 2422 2424 2429 2430
s19 Pharmaceutical 2423
s20 Rubber and plastic 2511 2519 2520 Rubber and plastic (1)
s21 Nonmetallic minerals 2610 2691 2692 2693 2694 2695 2696 2699 Nonmetallic minerals (1)s22 Iron and Steel 2710 2731
s23 Non-ferrous metals 2720 2732
s24 Metal fabricated metal products (excluding machinery and equipment)2811 2812 2813 2891 2892 2893 2899
s25 Machinery and equipment (excluding (excluding electrical machinery) 2911 2912 2913 2914 2915 2919 2921 2922 2923 2924 2925 2926 2927 2929 2930
s26 Office equipment (including computer equipment) 3000
s27 Machinery and electrical appliances 3110 3120 3130 3140 3150 3190 3210
s28 Radio, television and telecommunications equipment team 3220 3230
s29 Optical medical equipment and precision instruments 3311 3312 3313 3320 3330
s30 Motor vehicles, trailers and semi-trailers 3410 3420 3430
s31 Aircraft 3530
s32 Other transport equipment transport 3511 3512 3520 3591 3592 3599
s33 Other articles: recycling, furniture and other 3610 3691 3692 3693 3694 3699 3710 3720 Other manufacturing (1)s34 Electricity, gas and water water 4010 4020 4030
s35 Construction 4510 4520 4530 4540 4550
s36 Transport 6010 6021 6022 6023 6030 6110 6120 6210 6220 6301 6302 6303 6304 6309
s37 Post and telecommunications 6411 6412 6420
s38 Finance and insurance 6511 6519 6591 6592 6599 6601 6602 6603 6711 6712 6719 6720
s39 Services to businesses of all kinds 7010 7020 7111 7112 7113 7121 7122 7123 7129 7130 7210 7220 7230 7240 7250 7290 7310 7320 7412 7413 7414 7421 7422 7430 7491 7492 7493 7495 7499
s40 Other services 4100 5010 5020 5030 5040 5050 5110 5121 5122 5131 5139 5141 5142 5143 5149 5150 5190 5211 5219 5220 5231 5232 5233 5234 5239 5240 5251 5252 5259
5260 5510 5520 7411 7494 7511 7512 7513 7514 7521 7522 7523 7530 8010 8021 8022 8030 8090 8511 8512 8519 8520 8531 8532 9000 9111 9112 9120 9191
9192 9199 9211 9212 9213 9214 9219 9220 9231 9232 9233 9241 9249 9301 9302 9303 9309 9500 9900
Source: ECLAC on the basis of IOM and / or national SUT, considering on the work of the respective national teams.
Metals and metal products (3)
Machinery and equipment (5)
Vehicles and their parts and components (3)
Agriculture, forestry, hunting and fishing (2)
Oil and mining (2)
Food, beverages and snuff (6)
Textiles, apparel and footwear (3)
Wood, pulp and paper (2)
Chemicals and Pharmaceuticals (4)
Sectors selected for the harmonization of Latin American IOT: 40 sectors
Man
ufa
ctu
rin
g (2
9)
Services (7)
Primary(2)
Each of the National IOTs was reclassified to 40 Sectors

The First Latin American (18) Input-Output Table
Andean Community IOTMERCOSUR IOT
Central American IOT+
Mexico+
Chile+
Dominican Republic
SubregionalIOTs
National IOTs
18 National Matrices40 X 40
Years: 2011 and 2014 (ongoing)

Eclac’s Value Chain Dashboard
1. Selection of Parameters
• Year : 2005, 2011 and 2014
• 40 Sectors
• Reporters : 10 Countries (2005) , 18 countries (2011 & 2014)
• Partners : 10 extra regional partners (2005), 37 extra regionalpartners (2011 & 2014)
2. Selection of Set of Indicators
• Employment indicators
• Two set of value chain indicators
✓ National linkages indicators
✓ Regional linkages indicators

National indicators✓ Motivation :
✓ The productive linkages are the relationships establishedbetween the sectors in the production process.
✓ What happens when the final demand for a goodincreases, be it for final consumption, exports orinvestment?
✓ Each participant in the production chain, as a supplier ofintermediate inputs of the product j, will be affected bythe increase in j production.
✓ How much will these other industries be affected? Well,it's going to depend on the degree to which all industriesare connected. This is called backward linkages (BL)
✓ For the forward linkages (FL), we use the distributioncoefficients B of the Gosh matrix
✓ Main goal : identify key sectors and their wieght on products
Eclac’s Value Chain Dashboard

Eclac’s Value Chain Dashboard
• Leontief Inverse
• Ghosh Inverse
• Backwards and forwards Linkages (FL & BL);
• Identify local value chains and relevant sectors (Drivers, driven, keys,independent)
• Import / Domestic Ratio
National indicators

Eclac’s Value Chain Dashboard• The Leontief inverse matrix (I - A) -1 is a multiplier that reports on how much
the production of the entire economy has to increase to satisfy a increase infinal demand of one sector, the backward productive linkages
• Ghosh Inverse is used as an alternative method of analysis of forward productive linkages.
Ghosh Inverse:

Eclac’s Value Chain Dashboard
• Leontief Inverse
• Ghosh Inverse
• Backwards and forwards Linkages (FL & BL);
• Identify local value chains and relevant sectors
• Import / Domestic Ratio
National indicators

• Backward linkages (BL) Forward linkages (FL)
Eclac’s Value Chain Dashboard

Backward linkages < 1 Backward linkages > 1
Forward linkages > 1(II)
FL
Sectors
(I)
KEY
Sectors
Forward linkages < 1(III)
Independents
Sectors
(IV)
BL
Sectors
Eclac’s Value Chain Dashboard

Year All
Country Argentina
2005 2011
s01 Agricultura y forestalImpulsados Impulsados
s02 Caza y pesca Independientes Independientes
s03 Minería (energía) Independientes Impulsados
s04 Minería (no energía)Independientes Independientes
s05 Carne y derivadosImpulsores Impulsores
s06 Molinería, panadería y pastasClaves Impulsores
s07 Azúcar y productos de confiteríaImpulsores Impulsores
s08 Otros productos alimenticiosClaves Claves
s09 Bebidas Claves Impulsores
s10 Productos de tabacoIndependientes Impulsores
s11 Textiles Independientes Impulsores
s12 Confecciones Impulsores Independientes
s13 Calzado Impulsores Impulsores
s14 Madera y productos de madera y corchoIndependientes Independientes
s15 Pulpa de madera, papel, imprentas y editorialesClaves Independientes
s16 Coque, petróleo refinado y combustible nuclearClaves Claves
s17 Productos químicos básicosIndependientes Independientes
s18 Otros productos químicos (excluye farmacéuticos)Independientes Impulsores
s19 Productos farmacéuticosIndependientes Independientes
s20 Productos de caucho y plásticoClaves Independientes
Eclac’s Value Chain Dashboard
Year 2011
Countries Argentina,Brazil
Argentina Brazil
s01 Agricultura y forestal Impulsados Impulsados
s02 Caza y pesca Independientes Independientes
s03 Minería (energía) Impulsados Independientes
s04 Minería (no energía) Independientes Independientes
s05 Carne y derivados Impulsores Claves
s06 Molinería, panadería y pastas Impulsores Claves
s07 Azúcar y productos de confiteríaImpulsores Impulsores
s08 Otros productos alimenticios Claves Claves
s09 Bebidas Impulsores Impulsores
s10 Productos de tabaco Impulsores Impulsores
s11 Textiles Impulsores Impulsores
s12 Confecciones Independientes Independientes
s13 Calzado Impulsores Impulsores
s14 Madera y productos de madera y corchoIndependientes Impulsores
s15 Pulpa de madera, papel, imprentas y editorialesIndependientes Impulsores
s16 Coque, petróleo refinado y combustible nuclearClaves Claves
s17 Productos químicos básicos Independientes Claves
s18 Otros productos químicos (excluye farmacéuticos)Impulsores Impulsores
s19 Productos farmacéuticos Independientes Independientes
s20 Productos de caucho y plástico Independientes Impulsores

Eclac’s Value Chain Dashboard
• Leontief Inverse
• Ghosh Inverse
• Backwards and forwards Linkages (FL & BL);
• Identify local value chains and relevant sectors (Drivers, driven, keys,independent)
• Import / Domestic Ratio
National indicators
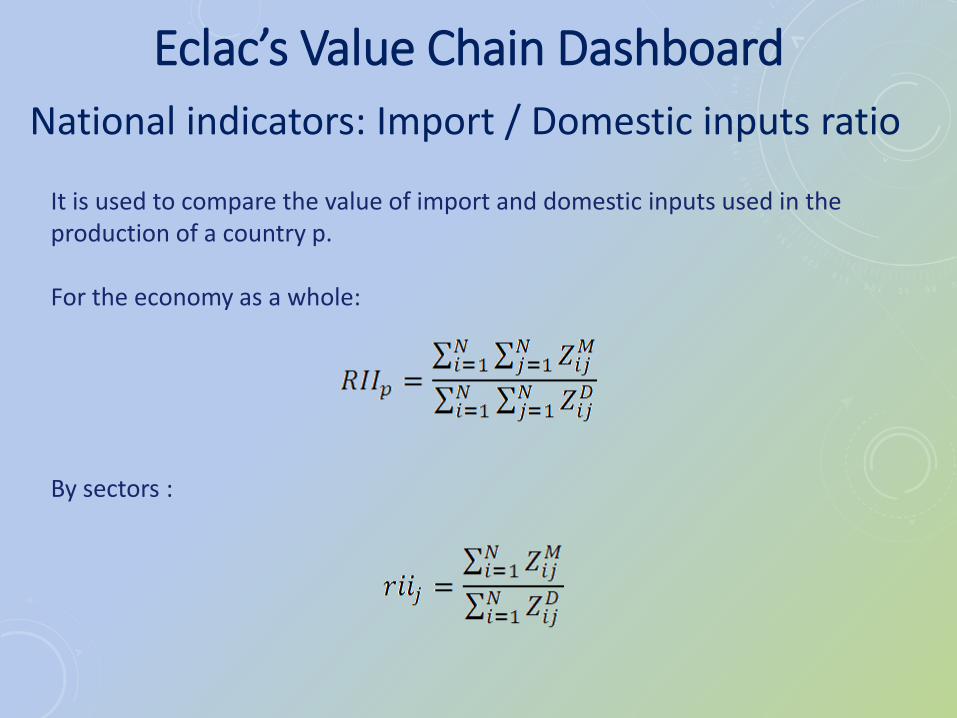
It is used to compare the value of import and domestic inputs used in the production of a country p.
For the economy as a whole:
By sectors :
National indicators: Import / Domestic inputs ratio
Eclac’s Value Chain Dashboard

0.00
0.05
0.10
0.15
0.20
0.25
0.30
0.35
RII Intra-regional RII Extra-regional
Eclac’s Value Chain Dashboard
National indicators: Import / Domestic inputs ratio

Eclac’s Value Chain Dashboard
• Vertical specialization: Imports of intermediate goods needed toexports. Identify sectors
• Value added on exports
• Employment associated with exports
Regionals indicators

• The vertical specialization allows us to identify how much we need toimport to satisfy the gross value of production (or of one of itscomponents, eg exports) :
Where AM is the imported technical coefficients matrix NxN and ê is the vector Nx1 of gross (total) exports of the country p
Eclac’s Value Chain DashboardRegionals indicators : Vertical specialization Imports of intermediate goods needed to exports

• EV1A vertical specialization, total imports needed for satisfy total exports to country B
La EV1B vertical specialization, imports needed from country C to satisfy total exports
EV1C vertical specialization, imports needed from country A for satisfy total exports to
country B
Regionals indicators : Vertical specialization Imports of intermediate goods need to exports
Eclac’s Value Chain Dashboard

Eclac’s Value Chain Dashboard
• Vertical specialization: Imports of intermediate goods needed toexports. Identify sectors
• Value added on exports
• Employment associated with exports
Regionals indicators

• Regional forward linkage, total domestic value added on export to a specifydestination
Eclac’s Value Chain Dashboard
Regionals indicators : Value added on exports

WE CAN CHOOSE ALL THE REPORTERS COUNTRIES FOR ONE YEAR
0
20
40
60
80
100
120
ARG BOL BRA CHL COL CRI ECU MEX NIC PAN PAR PER ROD SLV URY VEN
% of total exports to
Eclac’s Value Chain Dashboard
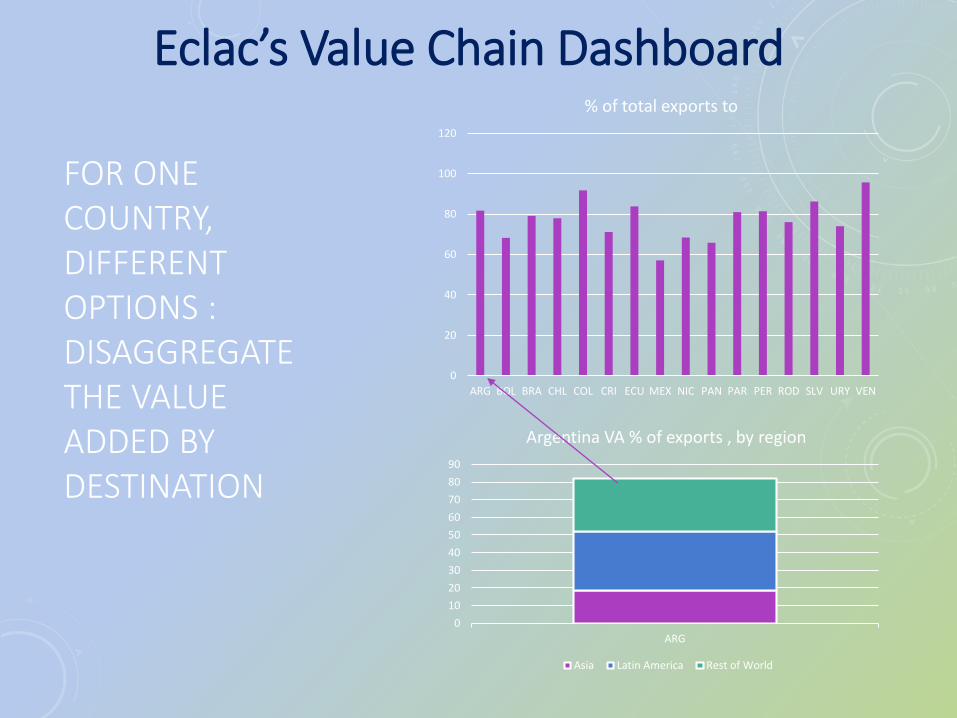
FOR ONE COUNTRY, DIFFERENT OPTIONS : DISAGGREGATE THE VALUE ADDED BY DESTINATION
0
20
40
60
80
100
120
ARG BOL BRA CHL COL CRI ECU MEX NIC PAN PAR PER ROD SLV URY VEN
% of total exports to
0
10
20
30
40
50
60
70
80
90
ARG
Argentina VA % of exports , by region
Asia Latin America Rest of World
Eclac’s Value Chain Dashboard

FOR ONE COUNTRY, DIFFERENT OPTIONS : COMPARE THE VALUE ADDED AS % OF TOTAL EXPORTS BETWEEN REGIONS
0
10
20
30
40
50
60
70
80
90
100
ARG BOL BRA CHL COL CRI ECU MEX NIC PAN PAR PER ROD SLV URY VEN
% of total exports to world
0
10
20
30
40
50
60
70
80
90
100
Asia Latin America Rest of World World
% of total exports to the destination
Eclac’s Value Chain Dashboard

FOR ONE COUNTRY, DIFFERENT OPTIONS : COMPARE VALUE ADDED AS % OF TOTAL EXPORTS BETWEEN SECTORS
0
20
40
60
80
100
120
ARG BOL BRA CHL COL CRI ECU MEX NIC PAN PAR PER ROD SLV URY VEN
% of total exports to world
Eclac’s Value Chain Dashboard
0.00
10.00
20.00
30.00
40.00
50.00
60.00
70.00
80.00
90.00
100.00To
tal
s01
s02
s03
s04
s05
s06
s07
s08
s09
s10
s11
s12
s13
s14
s15
s16
s17
s18
s19
s20
s21
s22
s23
s24
s25
% of VA on total exports, by sector

FOR ONE COUNTRY, DIFFERENT OPTIONS : CHOOSE ONE SECTOR, BY COUNTRY
0
20
40
60
80
100
120
ARG BOL BRA CHL COL CRI ECU MEX NIC PAN PAR PER ROD SLV URY VEN
% of total exports to world
Eclac’s Value Chain Dashboard
0.00
10.00
20.00
30.00
40.00
50.00
60.00
70.00
80.00
90.00
100.00
Tota
l
s01
s02
s03
s04
s05
s06
s07
s08
s09
s10
s11
s12
s13
s14
s15
s16
s17
s18
s19
s20
s21
s22
s23
s24
s25
% of VA on total exports, by sector
0
10
20
30
40
50
60
70
80
90
100
AR
G
BO
L
BR
A
CH
L
CO
L
CR
I
ECU
MEX NIC
PA
N
PA
R
PER
RO
D
SLV
UR
Y
VEN
Tota
l
% VA , for S1 by total exports by country

Eclac’s Value Chain Dashboard
• Vertical specialization: Imports of intermediate goods needed toexports. Identify sectors
• Value added on exports
• Employment associated with exports
Regionals indicators

• Each sector has a given job requirement, for each year, to produce a specific amount of VBP. (CE)
• By pre-multiplying our employment multiplier by the exports of a country, we obtain export employment, those generated in the sector (direct) and those generated in other sectors (indirect)
• The vector e of exports can satisfy different types of research requirements:
• Total exports from Country A to Country B
• Total Exports from Country A to a region of the world ( Latin America, Asia, FEALAC)
Regionals indicators : employment associated with exports
Eclac’s Value Chain Dashboard

From South American to Latin American Input-Output Table (2011 – 2014) and
a project to build a Global IOT
José E. Durán LimaChief of the Regional Integration Unit,
Division of International Trade and Integration, ECLAC, United Nations
OECD, Paris, 27 June 2019