ecological chemistry and engineering a
TRANSCRIPT
SOCIETY OF ECOLOGICAL CHEMISTRY AND ENGINEERING
ECOLOGICAL CHEMISTRY
AND ENGINEERING A
CHEMIA I IN¯YNIERIA EKOLOGICZNA A
Vol. 23 No. 4
OPOLE 2016

EDITORIAL COMMITTEE
Witold Wac³awek (Society of Ecological Chemistry and Engineering, PL) – Editor-in-Chief
Barbara Wiœniowska-Kielian (University of Agriculture, Kraków, PL) – agricultural chemistry
Marina V. Frontasyeva (Joint Institute for Nuclear Research, Dubna, RU) – heavy metals and radionuclides
Maria Wac³awek (Opole University, PL) – alternative energy sources
PROGRAMMING BOARD
Witold Wac³awek (Society of Ecological Chemistry and Engineering, PL) – Chairman
Jerzy Bartnicki (Meteorological Institute – DNMI, Oslo-Blindern, NO)
Mykhaylo Bratychak (National University of Technology, Lviv, UA)
Bogus³aw Buszewski (Nicolaus Copernicus University, Toruñ, PL)
Eugenija Kupcinskiene (University of Agriculture, Kaunas, LT)
Bernd Markert (International Graduate School [IHI], Zittau, DE)
Nelson Marmiroli (University, Parma, IT)
Jacek Namieœnik (University of Technology, Gdañsk, PL)
Lucjan Paw³owski (University of Technology, Lublin, PL)
Krzysztof J. Rudziñski (Institute of Physical Chemistry PAS, Warszawa, PL)
Manfred Sager (Agency for Health and Food Safety, Vienna, AT)
Mark R.D. Seaward (University of Bradford, UK)
Petr Škarpa (Mendel University of Agriculture and Forestry, Brno, CZ)
Piotr Tomasik (University of Agriculture, Kraków, PL)
Roman Zarzycki (University of Technology, £ódŸ, PL)
Ma³gorzata Rajfur (Opole University, PL) – Secretary
STATISTICAL EDITORS
W³adys³aw Kamiñski (Technical University, £ódŸ, PL)
Zbigniew Ziembik (Opole University, Opole, PL)
LANGUAGE EDITOR
Ian Barnes (University of Wuppertal, Wuppertal, DE)
EDITORIAL OFFICE
Opole University
ul. kard. B. Kominka 6, 45–032 OPOLE, PL
phone: +48 77 455 91 49
email: [email protected]
SECRETARY
Ma³gorzata Rajfur
phone: +48 77 401 60 42
email: [email protected]
Copyright © by
Society of Ecological Chemistry and Engineering, Opole
Wersj¹ pierwotn¹ czasopisma jest wersja elektroniczna
ISSN 1898–6188

CONTENTS
Edyta £ASKAWIEC, Mariusz DUDZIAK and Joanna WYCZARSKA-KOKOT
– Assessment of the Possibility of Recycling Backwashing Water from the Swimming
Pool Water Treatment System . . . . . . . . . . . . . . . . . . . . . . 401
Pawe³ WOLSKI – Rheological Parameters of Initially Disintegrated Sewage Sludge
after Fermentation . . . . . . . . . . . . . . . . . . . . . . . . . . . 411
Iwona ZAWIEJA – The Impact of Excess Sludge Disintegration on the Changes
of Total Organic Carbon Value . . . . . . . . . . . . . . . . . . . . . . 421
Grzegorz KUSZA, Beata GO£UCHOWSKA and Magdalena SZEWCZYK – Changes
In Physicochemical Properties of Soils in the Area Affected by Lime Industry . . . . 433
Monika SPOREK and Tomasz CIESIELCZUK – Biomass Of Spring Barley (Hordeumvulgare L.) in Relation to Fertilising . . . . . . . . . . . . . . . . . . . . 443
Katarzyna GRATA – Sensitivity of Fusarium solani Isolated from Asparagus
on Essential Oils . . . . . . . . . . . . . . . . . . . . . . . . . . . 453
Joanna KAPUSTA-DUCH, Barbara KUSZNIEREWICZ, Teresa LESZCZYÑSKA
and Barbara BORCZAK – Effect of Conventional Cooking on Changes
in the Contents of Basic Composition and Glucosinolates in Kale . . . . . . . . . 465
INDEXES
Contents of Volume 23 of “Ecological Chemistry and Engineering A” . . . . . . . . . 483
Author Index of Volume 23 of “Ecological Chemistry and Engineering A” . . . . . . . 487
Subject Index . . . . . . . . . . . . . . . . . . . . . . . . . . . . . . 489
Indeks rzeczowy . . . . . . . . . . . . . . . . . . . . . . . . . . . . . 491
Index of Latin, Polish and English Species Names of Microorganisms,
Plants and Animals and their Anatomical Parts . . . . . . . . . . . . . . . . 493
Index of Acronyms . . . . . . . . . . . . . . . . . . . . . . . . . . . 495
Wykaz akronimów . . . . . . . . . . . . . . . . . . . . . . . . . . . . 497
VARIA
Invitation for ECOpole ’16 Conference . . . . . . . . . . . . . . . . . . . . 501
Zaproszenie na Konferencjê ECOpole ’16 . . . . . . . . . . . . . . . . . . . 503
Guide for Authors . . . . . . . . . . . . . . . . . . . . . . . . . . . . 505


SPIS TREŒCI
Edyta £ASKAWIEC, Mariusz DUDZIAK i Joanna WYCZARSKA-KOKOT – Ocena
mo¿liwoœci recyklingu pop³uczyn z systemu oczyszczania wody basenowej . . . . . . 401
Pawe³ WOLSKI – Parametry reologiczne wstêpnie dezintegrowanych osadów œciekowych
poddanych fermentacji . . . . . . . . . . . . . . . . . . . . . . . . . 411
Iwona ZAWIEJA – Wp³yw dezintegracji osadów nadmiernych na zmiany wartoœci
ca³kowitego wêgla organicznego . . . . . . . . . . . . . . . . . . . . . . 421
Grzegorz KUSZA, Beata GO£UCHOWSKA i Magdalena SZEWCZYK – Zmiany
w³aœciwoœci fizykochemicznych gleb w rejonie oddzia³ywania przemys³u
wapienniczego . . . . . . . . . . . . . . . . . . . . . . . . . . . . 433
Monika SPOREK i Tomasz CIESIELCZUK – Biomasa jêczmienia jarego (Hordeumvulgare L.) jako funkcja nawo¿enia . . . . . . . . . . . . . . . . . . . . 443
Katarzyna GRATA – Wra¿liwoœæ Fusarium solani wyizolowanego ze szparaga na olejki
eteryczne . . . . . . . . . . . . . . . . . . . . . . . . . . . . . . 453
Joanna KAPUSTA-DUCH, Barbara KUSZNIEREWICZ, Teresa LESZCZYÑSKA
i Barbara BORCZAK – Wp³yw gotowania na zmiany zawartoœci sk³adu podstawowego
i glukozynolanów w jarmu¿u . . . . . . . . . . . . . . . . . . . . . . . 465
INDEXES
Contents of Volume 23 of “Ecological Chemistry and Engineering A” . . . . . . . . . 483
Author Index of Volume 23 of “Ecological Chemistry and Engineering A” . . . . . . . 487
Subject Index . . . . . . . . . . . . . . . . . . . . . . . . . . . . . . 489
Indeks rzeczowy . . . . . . . . . . . . . . . . . . . . . . . . . . . . . 491
Index of Latin, Polish and English Species Names of Microorganisms,
Plants and Animals and their Anatomical Parts . . . . . . . . . . . . . . . . 493
Index of Acronyms . . . . . . . . . . . . . . . . . . . . . . . . . . . 495
Wykaz akronimów . . . . . . . . . . . . . . . . . . . . . . . . . . . . 497
VARIA
Invitation for ECOpole ’16 Conference . . . . . . . . . . . . . . . . . . . . 501
Zaproszenie na Konferencjê ECOpole ’16 . . . . . . . . . . . . . . . . . . . 503
Guide for Authors . . . . . . . . . . . . . . . . . . . . . . . . . . . . 505


Edyta £ASKAWIEC1*, Mariusz DUDZIAK1
and Joanna WYCZARSKA-KOKOT1
ASSESSMENT OF THE POSSIBILITY
OF RECYCLING BACKWASHING WATER FROM
THE SWIMMING POOL WATER TREATMENT SYSTEM
OCENA MO¯LIWOŒCI RECYKLINGU POP£UCZYN
Z SYSTEMU OCZYSZCZANIA WODY BASENOWEJ
Abstract: The paper presents the physicochemical analysis and toxicological assessment of backwashing
samples taken after the process of washing filter beds in a raw condition after the process of their aeration and
dechlorination. The backwash water under investigation originated from circulation systems existing in two
indoor swimming pool facilities. The backwash water, as used at the preliminary and the main stages, was
characterized by different physicochemical properties. For toxicological assessment, the Mictorox® bio-
luminescence inhibition test, the Chaoborus sp. insect larva survival test and the phyto test using Lemnaminor fine cilium were involved. The investigation presented in the paper included a preliminary phase
focusing on the ecotoxic characterization of backwash water subjected to aeration and dechlorination
processes. In turn, at the main stage, the effect of aeration duration on the quality of backwash water in terms
of its physicochemical parameters was analyzed. The results of the preliminary stage investigation indicate
that backwash water, both in a raw condition and after 30 minutes’ aeration, could not be discharged directly
to the environment due to the threat to living organisms caused by its high toxicity. Whereas, using
160 minutes’ aeration duration contributed to a significant improvement in the quality of the backwash water
and elimination of its toxic properties with respect to the indicator organisms used. The chemical dechlorina-
tion process brought about varying effects. In the case of the Microtox® test, a stimulation of bacterial
bioluminescence was noted, but, at the same time, the death of individual insect larva specimens was
observed. In spite of the high biomass increase in the Lemna minor test, a gradual discolouration of fronds
under the influence of backwash water was observed. Because of the presence of numerous compounds being
disinfection by-products, as well as coagulant residues in backwash water deriving from swimming pool
systems, it is necessary to seek further solutions that will allow them to be recycled, which will result in
a reduction of water consumption and effluent discharges.
Keywords: swimming pool water, backwashing, toxicological assessment, physicochemical analysis, biotests
DOI: 10.2428/ecea.2016.23(4)30 ECOL CHEM ENG A. 2016;23(4):401-410
1 Institute of Water and Wastewater Engineering, Silesian University of Technology, ul. Konarskiego 18,
44–100 Gliwice, Poland, phone: +48 32 237 16 98, fax: +48 32 237 10 47, email: [email protected];
* Corresponding author: [email protected]

Introduction
Conducting the process of washing swimming pool filters in the correct manner and
at the proper frequency makes it possible to maintain the physicochemical and
bacteriological standard of not only circulating water but also washings which, in terms
of quality, corresponds to surface water in quality class three. The assurance of these
requirements may contribute to a reduction of the discharge of backwash water as
a waste stream to the sewage system and provide the possibility of reusing it [1]. The
quality and quantity of backwash water is determined by numerous other factors,
including: the intensity of conducted washing, the quality of water fed to the circulation
system, the quantity and types of removed impurities, as well as the type and dose of
chemicals used. To assure the correct bed washing process, it is necessary to use 4 to
6 m3 of water per each square metre of the bed, which, in the case of large facilities,
entails high water and energy consumption costs [2]. Backwash water is distinguished
not only by a high content of suspension, but also by residues of coagulants and
disinfectants. In particular, the presence of disinfection by-products, as well as
admixtures and contaminants used in the surface coagulation process is problematic
from the perspective of washing reuse [3, 4]. However, from the technological point of
view, the recovery of water from the waste stream is possible.
The objective of the study was to carry out the physicochemical assessment (by the
measurement of the conductivity, reaction, etc.) and toxicological assessment of
backwash water obtained from the filter bed washing process, as well as the analysis of
the parameters under investigation after the washing aeration and dechlorination
process. The assessment of the toxicity was performed based on the Microtox® bacterial
test, the Chaoborus sp. insect larva survival test, as well as the test using a water plant,
Lemna minor fine cilium.
Materials and research methodology
Physicochemical analysis
Backwash water used at the preliminary investigation stage was taken from the
circulation system of a sports swimming pool and then subjected to analysis for selected
physicochemical properties, including the reaction (pH), conductivity and ultraviolet
absorbance at a wavelength of 254 nm. For the extended stage, on the other hand,
backwash water was taken from the common tank of the circulation systems of the
sports and a leisure swimming pools. In that part, the concentration of (free and total)
chlorine, chlorides, ammonium and nitrate nitrogen, colour, turbidity and total hardness
were additionally measured.
The measurement of the conductivity and pH of water samples was done with an
inoLab® 740 multi-parameter meter (WTW, Measuring and Analytical Technical
Equipment). The absorbance was measured using a UV VIS Cecil 1000 supplied by
Analytik Jena AG, with a cuvette optical pathlength of 1 cm. The absorbance value at
the wavelength of 254 nm was determined based on the UV254 ultraviolet absorbance
402 Edyta £askawiec et al

measurement method in accordance with the standards adopted by US EPA [5]. The
measurement of chlorine concentration by the colorimetric method was done using
a Hach® Pocket ColorimeterTM II portable instrument. The concentration of nitrate and
ammonium nitrogen was determined with a photolyser 400 (Dinotec) tester. The
chloride concentrations were assayed by the Mohr method. For the determination of the
turbidity of samples, an EUTECH Instruments Turbidimeter, Model TN-100, was
employed. The measurement of the colour was performed using a UV VIS Spectro-
quant® Pharo 300 spectrophotometer (Merck). The total hardness, on the other hand,
was determined by the titration method using sodium versenate.
Toxicological assessment
The Microtox® test enables the determination of the magnitude of the toxic effect
based on the suppression of the natural metabolic processes of bacteria in the form of
bioluminescence inhibition. The toxicity analysis was carried out in conformance with
the Screening Testprocedure of the MicrotoxOmni system in a Microtox analyzer,
Model 500, manufactured by Tigret Sp. z. o.o., performing the function of both an
incubator and a photometer. The percentage of inhibitions relative to the control sample
not exposed to the potential toxicant was measured after 5 and 15 minutes’ exposure
time. The toxicity effect was determined as the percentage (%) of inhibition (I)according to Equation 1:
%( )
IE E
EK T
K
�� �100
(1)
where: EK – the value of bioluminescence in an attempt to control,
ET – the value of the bioluminescence in the sample with a toxic substance.
The test of the survival of animal organisms, which were Chaoborus sp. larvae, was
performed following the authors’ own methodology. Acquired from an industrial
culture, the larvae were taken to a laboratory, where their mobility was evaluated. Dead
or immobilized specimens were rejected from the culture. After 24 hours, the review of
the culture was repeated. 3 cm3 washing samples, with 5 specimens being placed in
each of them, were used in the test. The test plates were incubated in darkness at
a temperature of 20oC. The reading of the number of immobilized or dead specimens
was taken after 24 and 48 hours from the start of the test, respectively. The percentage
value of the toxic effect was calculated from Equation 2:
Effect h
h
��
�100
10024
0
L
L% (2)
where: L24h – number of alive specimens in the sample after 24 hrs of the test,
L0h – number of specimens taken to the test.
Assessment of the Possibility of Recycling Backwashing Water... 403

For the classification of toxicity, a system commonly used by many researchers [6]
was adopted, which is based on the size of the observable effect produced in the
indicator organism used (Table 1).
Table 1
The toxicity classification system [6]
Effect [%] Toxicity class
< 25 Non-toxic
25–50 Low toxic
50.1–75 Toxic
75.1–100 Highly toxic
A preliminary toxicological assessment of the backwash water under investigation
was also made based on the growth inhibition of Lemna minor fine cilium according to
the authors’ methodology complying with the OECD recommendations [7]. The frond
growth and inhibition coefficients, Rf and IRf, were determined from Equations 3 and 4,
respectively:
Rf f
tf �
�ln ln2 1
�(3)
where: f2 – number of fronds on the last testing day,
f1 – number of fronds on the first testing day,
�t = t2 – t1 – number of testing days.
IRR R
Rf
fc ft
fc
��
�100% (4)
where: Rfc – coefficient of frond growth in the control sample,
Rft – coefficient of frond growth for successive samples.
As the inhibition signal, positive growth inhibition coefficient values (> 0%) were
taken. By contrast, the growth stimulation was indicated by negative values.
An attempt to determine the influence of washing components on the dye contents of
plants was also made. The concentrations of chlorophyll and carotenoids were
determined by the spectrophotometric method using an acetone extract from the plants.
The chlorophyll determination was made by the method described by Blamowski and
Borowski [8], while for determining the sum of carotenoids, Lichtenthaler’s methodo-
logy [9] was used. The basic parameters of the influence of backwash water on the plant
were determined based on the changes in 7 days’ tests. All biotests were carried out in
three repetitions, and the presented results constitute average values obtained from the
analyses.
404 Edyta £askawiec et al

Washing aeration and dechlorination process
The aeration process was conducted in small laboratory reactors, each of a capacity
of 400 cm3. A HAGEN ELITE OPTIMA double discharge-port pump, with a delivery
of 1500 cm3/min for each discharge port, was used for aeration. The concentration of
oxygen dissolved in backwash water was controlled during the aeration process using
an immersible process probe operating based on an optical measurement method,
equipped with an LDO sensor (HACH LANGE). The concentration of oxygen in the
backwash water used at the preliminary testing stage was 7.61 mgO2/dm3 and the
process was conducted for 30 minutes. At the next stage, on the other hand, the oxygen
concentration was increased up to a maximum of 8.80 mgO2/dm3, and the physico-
chemical parameters were determined after 40, 100 and 160 min after the start of the
process.
The dechlorination process was carried out in compliance with the US EPA
recommendations [10] using anhydrous sodium sulfite, Na2SO3 (Stanlab). Based on the
stoichiometric equation for the reaction of sodium sulfite with hypochlorous acid,
HOCl, it was determined that, in order to carry out the process, 1.775 mg of Na2SO3 had
to be used per 1 mg of free chlorine. Dechlorination was carried out only at the
preliminary testing stage for backwash water from the sports swimming pool circulation
system using a single sodium sulfite dose.
Results and discussion
The physicochemical analysis of backwash water performed at the preliminary stage
(Table 2) indicated variations in parameters under the influence of the processes carried
out. A particularly marked increase in reaction, conductivity and ultraviolet absorbance
was documented in the sample of backwash water subjected to chemical dechlorination.
The processes carried out contributed to a change in the nature of the suspension, which
underwent sedimentation more easily compared to backwash water not subjected to the
cleaning processes.
Table 2
Physicochemical analysis of backwash water examined at the preliminary stage
No. Backwash waterReaction pH
[-]
Conductivity
[�S/cm]
UV254 ultraviolet absorbance
[m–1]
1 Raw 7.38 5526 15.60
2 Aerated (30 min) 7.31 5587 19.10
3 Dechlorinated 8.36 6604 37.70
During carrying out the main testing stages concerning the aeration effects, the scope
of physicochemical analysis was increased (Table 3). With the increase in backwash
water aeration time, an increase in the concentration of bonded chlorine (chloramines)
and chlorides was noted. A similar relationship was observed for the reaction, total
Assessment of the Possibility of Recycling Backwashing Water... 405

hardness and turbidity. In contrast, the longer backwash water aeration time resulted in
a lowering of the concentration of ammonium and nitrate nitrogen.
Table 3
Physicochemical analysis of backwash water
Parameter/Indicator UnitAeration time [min]
0 40 100 160
Free chlorine mgCl2/dm3 0.05 0.06 0.05 0.04
Bonded chlorine mgCl2/dm3 0.34 0.52 0.45 0.44
Total chlorine mgCl2/dm3 0.39 0.58 0.50 0.48
Reaction (pH) — 7.28 7.49 8.08 8.19
Conductivity �S/cm 1386 1389 1396 1389
Turbidity NTU 9.05 10.80 10.40 10.58
Colour m–1 2.00 2.00 2.00 2.00
Ammonium nitrogen mgN-NH4/dm3 2.37 2.32 0.29 0.12
Nitrate nitrogen mgN-NO3/dm3 17.00 12.00 12.00 8.00
Chlorides mgCl–/dm3 188.15 202.35 205.90 205.90
Total hardness mval/dm3 7.60 7.60 7.68 7.84
UV254 ultraviolet absorbance 1/m 5.40 6.30 6.90 7.40
The backwash water under investigation was distinguished primarily by varying
values of UV254 ultraviolet absorbance and conductivity. The backwash water used at
the preliminary stage exhibited much higher values of these parameters, which indicates
a greater fraction of swimming pool water-contaminating substances of the sample
taken.
The bioluminescence inhibition test of backwash water carried out at the preliminary
investigation stage showed also its high toxicity towards bacteria. After 15 minutes of
exposure, the value of inhibition for raw backwash water was over 99% (Fig. 1).
406 Edyta £askawiec et al
Fig. 1. The toxicity of backwash water samples in the Microtox® assay
0–40 –20 20 40 60 80 100
Inhibition of bioluminescence [%]
After dechlorination
After aeration
Raw washings
15 min
5 min
Moreover, subjecting the backwash water to aeration did not bring about any
significant reduction in inhibition value, and the bioluminescence inhibition after
15 minutes’ exposure time was approx. 97%. By contrast, the dechlorination process not
only completely deprived the sample of the toxic effect, but also stimulated the
metabolic processes in the bacteria used in the test.
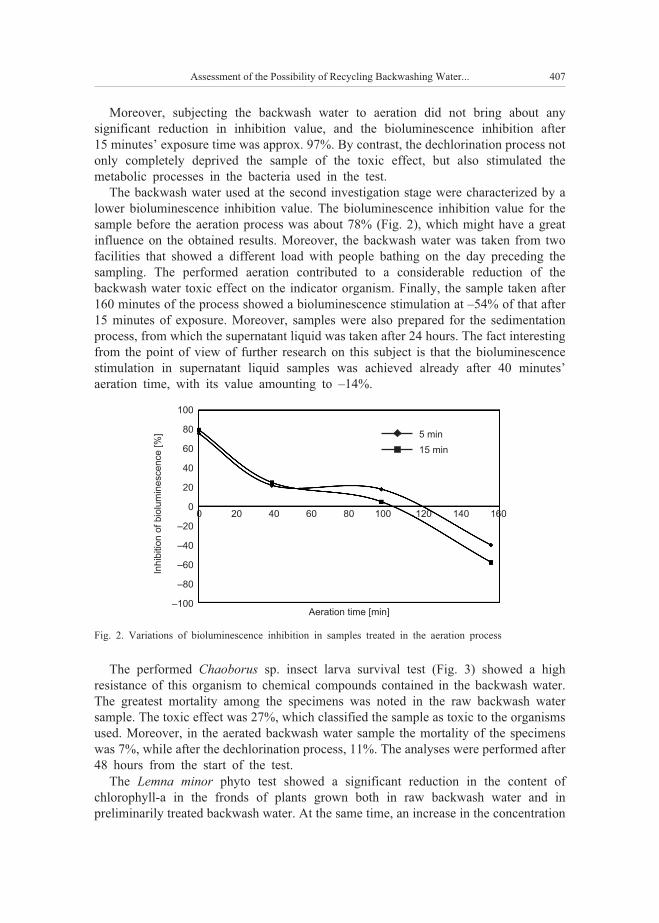
The backwash water used at the second investigation stage were characterized by a
lower bioluminescence inhibition value. The bioluminescence inhibition value for the
sample before the aeration process was about 78% (Fig. 2), which might have a great
influence on the obtained results. Moreover, the backwash water was taken from two
facilities that showed a different load with people bathing on the day preceding the
sampling. The performed aeration contributed to a considerable reduction of the
backwash water toxic effect on the indicator organism. Finally, the sample taken after
160 minutes of the process showed a bioluminescence stimulation at –54% of that after
15 minutes of exposure. Moreover, samples were also prepared for the sedimentation
process, from which the supernatant liquid was taken after 24 hours. The fact interesting
from the point of view of further research on this subject is that the bioluminescence
stimulation in supernatant liquid samples was achieved already after 40 minutes’
aeration time, with its value amounting to –14%.
The performed Chaoborus sp. insect larva survival test (Fig. 3) showed a high
resistance of this organism to chemical compounds contained in the backwash water.
The greatest mortality among the specimens was noted in the raw backwash water
sample. The toxic effect was 27%, which classified the sample as toxic to the organisms
used. Moreover, in the aerated backwash water sample the mortality of the specimens
was 7%, while after the dechlorination process, 11%. The analyses were performed after
48 hours from the start of the test.
The Lemna minor phyto test showed a significant reduction in the content of
chlorophyll-a in the fronds of plants grown both in raw backwash water and in
preliminarily treated backwash water. At the same time, an increase in the concentration
Assessment of the Possibility of Recycling Backwashing Water... 407
Fig. 2. Variations of bioluminescence inhibition in samples treated in the aeration process
Inhib
itio
n o
f bio
lum
inescence [%
]
100
80
60
40
20
0
–20
–40
–60
–80
–100Aeration time [min]
0 20 40 60 80 100 120 140 160
5 min
15 min

of chlorophyll-b and carotenoids was noted. The increase in carotenoid contents might
be caused by the activation of anti-oxidation mechanisms in the presence of impurities
occurring in the test samples [11]. Whereas, the differences in values between chloro-
phyll-a and chlorophyll-b might be due to both the contamination of the samples and the
development variations in the plants, which occur in individual phases of growth [12].
All samples taken during aeration exhibited high ability to stimulate the plant
biomass increase, as indicated by the negative values of the growth inhibition
coefficient (Fig. 4). The strongest stimulation was noted for raw backwash water, while
the weakest stimulation, for backwash water aerated for 160 minutes. This suggests the
occurrence of Lemna minor growth-promoting substances in the backwash water tested.
Conclusions
The performed pre-treatment processes changed the quality of the swimming pool
system backwash water under investigation. The achieved final aeration results were
408 Edyta £askawiec et al
Fig. 3. The individuals of Chaoborus sp. – live (left photo, below one individual) and the dead (on the left
and the right picture – two individuals)
Fig. 4. Variations in the value of the growth inhibition coefficient for fronds in aerated samples
0
–20
–40
–60
–80
–100
–120
Aeration time [min]
0 20 40 60 80 100 120 140 160
Fro
nd
s g
row
th in
hib
itio
n f
acto
r [%
]
significantly influenced by the initial backwash water toxicity value noted in the
biotests. Therefore, it is of particular importance to maintain the filter washing
frequency standards. For toxicological tests, the susceptibility of particular indicator
organisms is also very important, and the utmost care in their selection is necessary.
The application of the aeration or dechlorination process may bring about an
improvement in the quality of the backwash water, which will allow it to be discharged
directly to the soil or water. However, it is necessary to extend the research on the
impact of backwash water-borne chemical compounds on the natural environment.
Acknowledgements
The study was carried out within the framework of the Faculty’s research grant for young scientists
(BKM-536/RIE-4/15) “Quality assessment of swimming pool water aided with ecotoxicology tools”.
References
[1] Wyczarska-Kokot J, Piechurski F. Ocena skutecznoœci filtracji wody i jakoœci wód pop³ucznych
w instalacjach basenowych [Assessing the efficiency of water filtration and the quality of washings in
swimming pools]. Ochr Œrod. 2002;84(1): 33-36.
[2] Wyczarska-Kokot J. Ecol Chem Eng S. 2016; 23(3): 447-459. DOI: 10.1515/eces-2016-0032
[3] McCormick NJ, Porter M, Walsh ME. Water Res. 2010;44: 4581-4589.
DOI: 10.1016/j.watres.2010.05.042.
[4] Leszczyñska M, Sozañski MM. Szkodliwoœæ i toksycznoœæ osadów i pop³uczyn z procesu uzdatniania
wody [The harmfulness and toxicity of the water treatment process residuals]. Ochr Œrod Zasobów
Natur. 2009; 40: 575-585. http://www.ios.edu.pl/pol/pliki/nr40/nr40_68.pdf.
[5] Potter B, Wimsatt J. EPA Document. Method 415.3. 2009.
https://cfpub.epa.gov/si/si_public_record_report. cfm?dirEntryId=103917.
[6] Persoone G, Baudo R, Cotman M, Blaise C, Thompson KCl, Moreira-Santos M, et al. Knowledge and
Management of Aquatic Ecosystems 2009;393(1): 01p01-01p29. DOI: 10.1051/kmae/2009012.
[7] Test No. 221: Lemna sp. Growth Inhibition Test. 2006. OECD Guidelines for the Testing of Chemicals,
Section 2: Effects on Biotic Systems: 1-22. http://www.oecd.org/chemicalsafety/testing/1948054.pdf
[8] Blamowski ZK, Borowski E.: Æwiczenia z fizjologii roœlin [Plant physiology class]. Lublin: Wyd Uniw
Przyr w Lublinie; 2006.
[9] Lichtenthaler HK. Methods Enzymol. 1987;148:350-382. DOI: 10.4236/oalib.1101097.
[10] Wastewater technology fact sheet dechlorination. US Environmental Protect Agency, EPA 832-F-00-
022, 2000. https://nepis.epa.gov/Exe/ZyPDF.cgi/P1001L40.PDF?Dockey=P1001L40.PDF.
[11] Bo³onkowska O, Pietrosiuk A, Syk³owska-Baranek K. Roœlinne zwi¹zki barwne, ich w³aœciwoœci biolo-
giczne raz mo¿liwœci wytwarzania w kulturach in vitro [The biological properties of plant dyes and their
ability to produce in in-vitro cultured]. Bulletin of the Faculty of Pharmacy of the Medical University of
Warszawa, 2011;(1):1-27. http://biuletynfarmacji.wum.edu.pl/1101Bolonkowska/Bolonkowska.pdf.
[12] Gej B. Acta Societatis Botanicorum Poloniae 1996;35(2):209-224.
http://dx.doi.org/10.5586/asbp.1966.017.
OCENA MO¯LIWOŒCI RECYKLINGU POP£UCZYN
Z SYSTEMU OCZYSZCZANIA WODY BASENOWEJ
Instytut In¿ynierii Wody i Œcieków
Politechnika Œl¹ska w Gliwicach
Abstrakt: W pracy przedstawiono analizê fizykochemiczn¹ oraz ocenê toksykologiczn¹ próbek pop³uczyn
pobranych po procesie p³ukania z³ó¿ filtracyjnych w stanie surowym po procesie napowietrzania oraz dechlo-
Assessment of the Possibility of Recycling Backwashing Water... 409

racji. Badane pop³uczyny pochodzi³y z obiegów zlokalizowanych w dwóch obiektach basenowych krytych.
Do oceny toksykologicznej w³¹czono test inhibicji bioluminescencji Mictorox®, prze¿ywalnoœci larw owadów
Chaoborus sp. oraz fitotest z wykorzystaniem rzêsy drobnej Lemna minor. Badania obejmowa³y fazê
wstêpn¹, skupiaj¹c¹ siê na charakterystyce ekotoksykologicznej pop³uczyn poddanych procesom dechloracji
oraz napowietrzania. W etapie zasadniczym badañ analizowano dodatkowo wp³yw czasu napowietrzania na
jakoœæ pop³uczyn pod wzglêdem parametrów fizykochemicznych. Wyniki wstêpnego etapu badañ sygnali-
zuj¹, ¿e pop³uczyny zarówno w stanie surowym, jak i po 30-minutowym napowietrzaniu nie mog³y zostaæ
bezpoœrednio odprowadzone do œrodowiska ze wzglêdu na zagro¿enie dla organizmów ¿ywych, spowodowa-
ne ich wysok¹ toksycznoœci¹. Natomiast zastosowane wyd³u¿enie czasu napowietrzania (160 min) przyczy-
ni³o siê do znacz¹cej poprawy jakoœci pop³uczyn i pozbawienia ich w³aœciwoœci toksycznych w stosunku do
wykorzystanych organizmów wskaŸnikowych. Zró¿nicowane efekty przyniós³ zabieg chemicznej dechloracji.
W przypadku testu Microtox® odnotowano stymulacjê bioluminescencji bakterii, równoczeœnie zaobserwowa-
no œmieræ pojedynczych osobników larw owadów. Pomimo wysokiego przyrostu biomasy w teœcie z Lemnaminor, zaobserwowano stopniowe odbarwienie frondów pod wp³ywem u¿ytych pop³uczyn. Niezbêdne jest
poszukiwanie dalszych rozwi¹zañ umo¿liwiaj¹cych ich recykling, co zapewni ograniczenie zu¿ycia wody
oraz odprowadzania œcieków.
S³owa kluczowe: wody basenowe, pop³uczyny, ocena toksykologiczna, analiza fizykochemiczna, biotest
410 Edyta £askawiec et al

Pawe³ WOLSKI1
RHEOLOGICAL PARAMETERS
OF INITIALLY DISINTEGRATED SEWAGE SLUDGE
AFTER FERMENTATION
PARAMETRY REOLOGICZNE
WSTÊPNIE DEZINTEGROWANYCH OSADÓW ŒCIEKOWYCH
PODDANYCH FERMENTACJI
Abstract: Yield point, viscosity, shear stress are technological parameters useful in practice to control the
pumping of sludge, flow and other processes related to their processing. Increasing the efficiency of
dewatering causes a decrease in their ability to flow through an increase in the limits of flow and thus the
shear stress values. The variability of the stress and the viscosity is the result of changes in the structure
occurring in the sludge during the flow. Any change in the structure of sludge by conditioning affected the
same for their rheological parameters.
The aim of the study was to determine the dependence of shear velocity gradient (flow curves)
pre-conditioned ultrasonic field sludge, and then fermented. In the process of sonication, four of the ultrasonic
wave intensity ie: 2.2; 2.7; 3.2; 3.8 W/cm2 were applied, and the time of sonication equals 600 s. The
fermentation process was carried out in 10 glass flask with a capacity of 0.5 dm3 which were models the
digester. To describe the flow curves used the simplest mathematical rheological Ostwald-de Waele model. It
also presents the total loss of dry mass of sludge undergoing stabilization. The studies reported an increase in
shear stress with the application of higher intensity ultrasonic wave field. Reducing stress values were
observed for fermented sludge with each day of anaerobic stabilization process.
Keywords: sewage sludge, rheological parameters, ultrasonic field, fermentation
Introduction
Rheology of sewage sludge is an important problem that has been explored in studies
on the methods of its final use and control in the processes of stabilization and
dewatering [1]. Determination of the rheological parameters allows for determination of
the sewage sludge flowability during technological processes [2]. Affecting the sewage
sludge structure through the application of the conditioning factors changes the value of
DOI: 10.2428/ECEA.2016.23(4)36 ECOL CHEM ENG A. 2016;23(4):411-419
1 Institute of Environmental Engineering, Faculty of Infrastructure and Environment, Czestochowa
University of Technology, ul. BrzeŸnicka 60a, 42–200 Czêstochowa, Poland, phone: +48 34 325 09 17, email:

stress and viscosity during the flow. Conditioning leads to the increase in the yield
stress, thus intensifying dewatering ability. The increase in the ability to release water
will be connected with reduction in the sewage sludge flowability [3].
Rheological properties of sewage sludge depend on its composition, concentration,
temperature and pH value [4, 5]. Knowledge of these properties is useful for egprocesses of flow, mixing and transport of heat in sewage sludge [6]. Studies have
shown a correlation between rheological parameters and its properties [7]. The use of
thermal, chemical and mechanical modifications and their combinations leads to
changes in the values and characteristics of sewage sludge [8]. Conditioning leads to the
release of intracellular matter and, consequently, to improved biodegradability of the
sludge (increased biogas generation) [9–11]. Rheological properties of the excess sludge
after the mechanical disintegration process point to a significant decline in viscosity,
reaching 60%. Viscosity, which can be used for evaluation of the degree of
disintegration of excess sludge, is reduced through the fermentation process [12].
Flow curves represent the relationship between sheer stresses and sheer rate. They
can be approximated using rheological models. Determination of the rheological models
of sewage sludge contributes to a more detailed description of the sludge and provides
insights into the effect of the conditioning method on final parameters. The simplest
mathematical rheological model used to describe the flow curve for these fluids is the
Ostwald-de Waele power model [5]:
� = k � (�)n,
where k – constant termed consistency coefficient [Pa � s];
n – exponent, termed yield exponent.
The constant k, termed consistency coefficient, and the exponent n, termed the yield
exponent, are the rheological parameters determined empirically at a specific tempera-
ture. The coefficient k represents the measure that describes viscosity of a substrate. The
flow coefficient n adopts varied values. The value of n < 1 means that the process of
shear thinning is observed; if n > 1, shear thickening occurs; if n = 1, the fluid becomes
Newtonian.
Material and methods
The substrate for the study was provided by sewage sludge from treatment of
cellulose and paper sewage sludge. The initial dewatering of 98.32% and dry mass of
16.82 g/dm3 were calculated based on the standard PN-EN-12880:2004 [13]. Initial
conditioning of sewage sludge was performed using the energy of the ultrasonic field
with the intensity of: 2.2 (40%), 2.7 (60%); 3.2 (80%); 3.8 (100%) W/cm2. The
sonication was performed under static conditions for 600 s. Initial power output of the
ultrasound processor was 1500 W, vibration frequency was 20 kHz, whereas maximal
wavelength at maximal intensity of 3.8 W/cm2 was 39.42 �m (100%). The sonication
process was used for sewage sludge samples with volume of 500 cm3.
412 Pawe³ Wolski

The sewage sludge fermentation process occurred in glass flasks that represented
models of fermentation chambers and bioreactor. The laboratory flasks, which represen-
ted the models of fermentation chambers, were put into the laboratory thermostat
(10 flasks) in order to maintain mesophilic conditions. On each day of the fermentation
process, the parameters and values of the rheological models were determined after
removing one of the flasks from the thermostat. Flask volume was V = 0.5 dm3. The
process of 25-day stabilization was performed in the bioreactor with the capacity of
5 dm3. The Reometr RC20 rheometer was used, with shear rate of 0–200 s–1 for the
period of 120 s.
Results and discussions
Analysis of the results demonstrated that the highest values of stress in the case of
sewage sludge initially non-conditioned with the ultrasound field were found for the
non-stabilized sludge (Fig. 1a). The increase in the velocity gradient led to the increase
in shear stresses, and, with the shear rate of 200 s–1, the highest value was obtained
(2.328 Pa). Using the fermentation process with respect to non-conditioned sewage
sludge led to the reduction in the parameters studied. They were lower on consecutive
days of fermentation compared to the non-fermented sludge. The lowest values of shear
stresses were found for the sludge after the 10th day of fermentation, for which the
values of stresses at the shear rate of 200 s–1 were 1.565 Pa. Similar values of stress
were found for sewage sludge after 25 days of fermentation in the bioreactor. Stresses in
sewage sludge were correlated with its viscosity. The highest viscosity was recorded for
the non-fermented sludge. Fermentation led to a reduction in this parameter, with its
values for the shear rate 200 s–1 on the 10th an 25th day maintained at the level of
0.008 Pa � s.
Application of initial conditioning using the energy of the ultrasound field led to the
increase in shear stresses and viscosity of sewage sludge on each consecutive day of the
fermentation process (Fig. 1b). In the case of non-fermented sludge after initial
modification with the ultrasound field with intensity of 2.2 W/cm2, stresses at the shear
rate of 200 s–1 were 3.419 Pa, whereas viscosity was 0.017 Pa � s. For the sludge
subjected to fermentation, the obtained values were the lowest on the 10th day of
stabilization, with shear stresses for the shear rate of 200 s–1 reaching the level of 1.888
Pa and viscosity of 0.009 Pa � s. Elongation of the intensity of the ultrasound field led to
another increase in the value of shear stresses (see Fig. 1c). Analogously to the use of
the ultrasound field with intensity of 2.2 W/cm2, the stresses rose to the level of 3.604
Pa, viscosity rose to 0.018 Pa � s (non-fermented sludge) and 2.031 Pa and 0.01 Pa � s
(sludge on the 10th day of fermentation and shear rate of 200 s–1).
Conditioning of sewage sludge with the ultrasound field with intensity of 3.2 an
3.8 W/cm2 yielded specific changes in the values of stresses (Fig. 1d, e). The highest
stresses were recorded for the sewage sludge on the 2nd day of fermentation, for which
the values at the shear rate of 200 s–1 was 6.252 Pa, whereas viscosity increased to
0.031 Pa � s. The analogous relationship was observed for the highest ultrasound field
Rheological Parameters of Initially Disintegrated Sewage Sludge... 413

414 Pawe³ Wolski
3.0
2.5
2.0
1.5
1.0
0.5
0.0
Sh
ea
r str
ess [
Pa
]
0 50 100 150 200
0.05
0.04
0.03
0.02
0.01
0.00
Vis
co
sity [
Pa
�s]
0 50 100 150 200
Shear velocity [s ]–1 Shear velocity [s ]–1
4.0
3.5
3.0
2.5
2.0
1.5
1.0
0.5
0.0
Sh
ea
r str
ess [
Pa
]
0 50 100 150 200
0.10
0.08
0.06
0.04
0.02
0.00
0 50 100 150 200
Shear velocity [s ]–1 Shear velocity [s ]–1
0 50 100 150 200 0 50 100 150 200
Shear velocity [s ]–1 Shear velocity [s ]–1
0 50 100 150 200 0 50 100 150 200
Shear velocity [s ]–1 Shear velocity [s ]–1
0 50 100 150 200 0 50 100 150 200
Shear velocity [s ]–1 Shear velocity [s ]–1
a)
b)
c)
d)
e)
Vis
co
sity [
Pa
�s]
4.0
3.5
3.0
2.5
2.0
1.5
1.0
0.5
0.0
Sh
ea
r str
ess [
Pa
]
0.10
0.08
0.06
0.04
0.02
0.00
Vis
co
sity [
Pa
�s]
7.0
6.0
5.0
4.0
3.0
2.0
1.0
0.0
Sh
ea
r str
ess [
Pa
]
0.20
0.16
0.12
0.08
0.04
0.00
Vis
co
sity [
Pa
�s]
7.0
6.0
5.0
4.0
3.0
2.0
1.0
0.0
Sh
ea
r str
ess [
Pa
]
0.20
0.16
0.12
0.08
0.04
0.00
Vis
co
sity [
Pa
�s]
0 day 8 day4 day 25 day2 day 10 day6 day
Fig. 1. Flow curves and viscosity curves for sewage sludge after fermentation: a) non-conditioned sludge;
b) sewage sludge + UD40%; c) sewage sludge + UD60%; d) sewage sludge + UD80%; e) sewage
sludge + UD100%
(3.8 W/cm2), with stresses at the shear rate of 200 s–1 reaching the level of 4.937 Pa, and
viscosity – the level of 0.025 Pa � s.
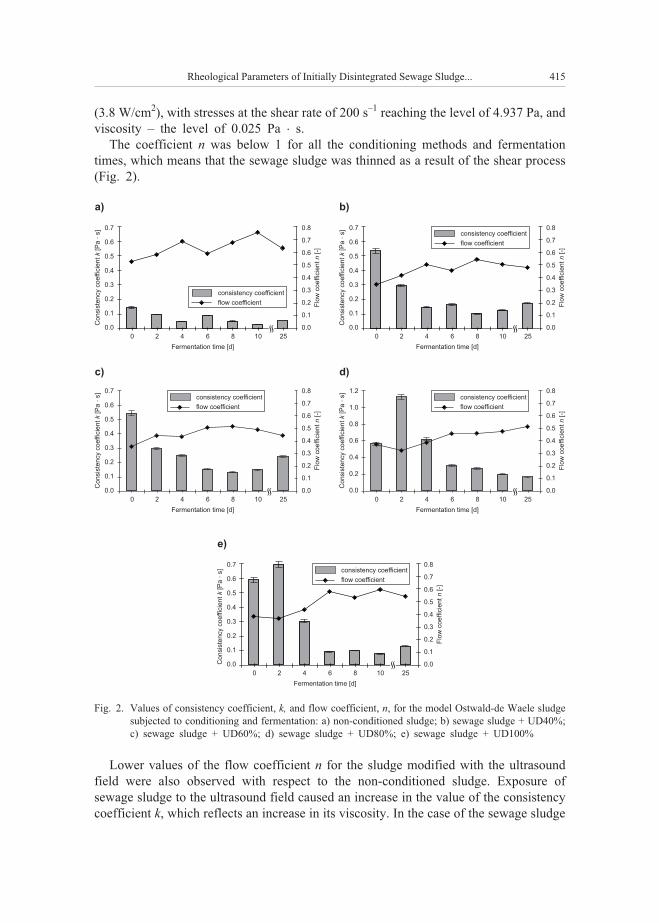
The coefficient n was below 1 for all the conditioning methods and fermentation
times, which means that the sewage sludge was thinned as a result of the shear process
(Fig. 2).
Lower values of the flow coefficient n for the sludge modified with the ultrasound
field were also observed with respect to the non-conditioned sludge. Exposure of
sewage sludge to the ultrasound field caused an increase in the value of the consistency
coefficient k, which reflects an increase in its viscosity. In the case of the sewage sludge
Rheological Parameters of Initially Disintegrated Sewage Sludge... 415
Fermentation time [d]
0.7
0.6
0.5
0.4
0.3
0.2
0.1
0.0
Consis
tency c
oeffic
ient
[Pa
s]
k�
0 2 4 6 8 10 25
Flo
w c
oeffic
ient
[-]
n
0.8
0.7
0.6
0.5
0.4
0.3
0.2
0.1
0.0
consistency coefficient
flow coefficient
Fermentation time [d]
1.2
1.0
0.8
0.6
0.4
0.2
0.0
Consis
tency c
oeffic
ient
[Pa
s]
k�
0 2 4 6 8 10 25
Flo
w c
oeffic
ient
[-]
n
0.8
0.7
0.6
0.5
0.4
0.3
0.2
0.1
0.0
consistency coefficient
flow coefficient
Fermentation time [d]
0.7
0.6
0.5
0.4
0.3
0.2
0.1
0.0
Consis
tency c
oeffic
ient
[Pa
s]
k�
0 2 4 6 8 10 25
Flo
w c
oeffic
ient
[-]
n
0.8
0.7
0.6
0.5
0.4
0.3
0.2
0.1
0.0
Fermentation time [d]
0.7
0.6
0.5
0.4
0.3
0.2
0.1
0.0
Consis
tency c
oeffic
ient
[Pa
s]
k�
0 2 4 6 8 10 25
Flo
w c
oeffic
ient
[-]
n
0.8
0.7
0.6
0.5
0.4
0.3
0.2
0.1
0.0
consistency coefficient
flow coefficient
consistency coefficient
flow coefficient
Fermentation time [d]
0.7
0.6
0.5
0.4
0.3
0.2
0.1
0.0Consis
tency c
oeffic
ient
[Pa
s]
k�
0 2 4 6 8 10 25
Flo
w c
oeffic
ient
[-]
n
0.8
0.7
0.6
0.5
0.4
0.3
0.2
0.1
0.0
consistency coefficient
flow coefficient
a) b)
c) d)
e)
Fig. 2. Values of consistency coefficient, k, and flow coefficient, n, for the model Ostwald-de Waele sludge
subjected to conditioning and fermentation: a) non-conditioned sludge; b) sewage sludge + UD40%;
c) sewage sludge + UD60%; d) sewage sludge + UD80%; e) sewage sludge + UD100%
modified with the ultrasound field with the highest intensity (3.8 W/cm2), the value of
coefficient k was 4 times higher compared to the non-modified sewage sludge.
Regardless of the method of conditioning, sludge fermentation led to the reduction in
sludge viscosity on each consecutive day of the process. The values of the parameters
obtained for the model were correlated with the empirical data. The correctness and
accuracy of the results obtained in the study are demonstrated by the correlation
coefficients B, which, for all the samples studied, were high and ranged from 0.97 to
0.99 (Table 1).
Table 1
Values of correlation coefficient (B) and standard deviation (S) for the Ostwald-de Waele model
of sewage sludge subjected to conditioning and fermentation
Parameters conditioning
sewage sludge
Fermentation time [d]
0 2 4 6 8 10 25
Non-conditioned sludgeB 0.996 0.995 0.994 0.996 0.995 0.992 0.988
S 0.033 0.032 0.035 0.031 0.032 0.037 0.045
Sewage sludge + UD40%B 0.990 0.983 0.988 0.978 0.990 0.984 0.986
S 0.063 0.076 0.054 0.063 0.043 0.056 0.060
Sewage sludge + UD60%B 0.991 0.990 0.989 0.987 0.985 0.981 0.981
S 0.065 0.065 0.055 0.059 0.061 0.064 0.079
Sewage sludge + UD80%B 0.988 0.992 0.990 0.959 0.986 0.977 0.985
S 0.090 0.096 0.094 0.079 0.083 0.090 0.073
Sewage sludge + UD100%B 0.991 0.992 0.983 0.994 0.979 0.993 0.988
S 0.088 0.084 0.089 0.038 0.061 0.036 0.061
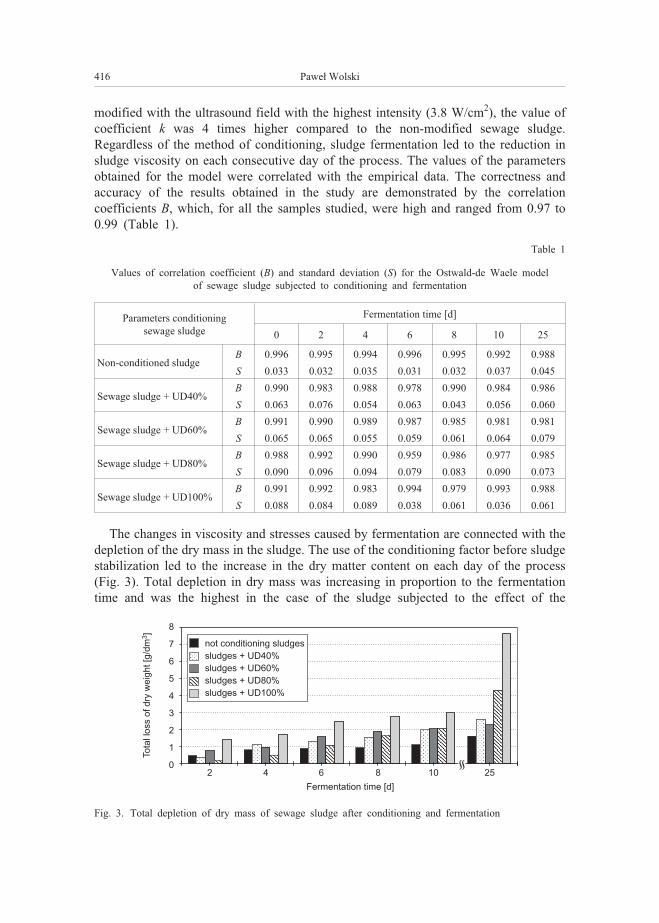
The changes in viscosity and stresses caused by fermentation are connected with the
depletion of the dry mass in the sludge. The use of the conditioning factor before sludge
stabilization led to the increase in the dry matter content on each day of the process
(Fig. 3). Total depletion in dry mass was increasing in proportion to the fermentation
time and was the highest in the case of the sludge subjected to the effect of the
416 Pawe³ Wolski
8
7
6
5
4
3
2
1
02 4 6 8 10 25
Fermentation time [d]
Tota
l lo
ss o
f dry
weig
ht [g
/dm
]3
not conditioning sludges
sludges + UD40%
sludges + UD60%
sludges + UD80%
sludges + UD100%
Fig. 3. Total depletion of dry mass of sewage sludge after conditioning and fermentation

ultrasound field with intensity of 3.8 W/cm2. For the sludge after fermentation in flasks
on the 10th day of the process, total depletion was at the level of 2.98 g/dm3, whereas in
the case of sewage sludge subjected to stabilization in the bioreactor, this value was
7.68 g/dm3. Dispersion of the sludge flocs caused by the ultrasound field caused the
release of organic compounds whereas stabilization led to their mineralization, which
translated into the increase in the number of dry mass.
Interference with the structure induced by the conditioning factor of sludge as well as
a fermentation process is shown in Fig. 4.
Non-conditioned sludge on the first day of fermentation characterized by the
compacted structure, homogeneous, no free water is observed. Subjecting of sludge of
conditioning ultrasonic field individual clusters of sludge floc with free water areas were
observed. In the view field extended sludge floc was recorded. The ten-day fermen-
tation process caused the homogenization of the observed structures. The sludge floc
with free water were mixed, forming a homogeneous mass of individual foci of sludge.
Rheological Parameters of Initially Disintegrated Sewage Sludge... 417
c) d)
a) b)
Fig. 4. Non conditioned structure and pre-conditioned of ultrasonic field sludge: a) non-conditioned sludge
and unfermented; b) non-conditioned sludge on the 10th day of fermentation; c) The conditioned
sludge by ultrasonic field by 3.8 W/cm2 (100%) untreated fermentation; d) The conditioned sludge by
ultrasonic field by 3.8 W/cm2 (100%) on the 10th day of fermentation

Conclusions
Knowledge of characteristics of sewage sludge in a technological line of the
wastewater treatment plant can be acquired based on the evaluation of technical and
technological parameters. The rheological examinations represent the basis for optimi-
zation of technological processes that occur in the wastewater treatment plant. The
correlation between rheological parameters and sludge water content represents the
significant property. This study allowed for development of a more accurate rheological
characterization of sewage sludge after disintegration and fermentation.
The results obtained in this study lead to the following final conclusions:
– the use of ultrasonic energy in sewage sludge preparation causes an increase in
shear stresses with the increase in the ultrasonic field intensity;
– stabilization of initially conditioned sewage sludge leads to a reduction in the value
of shear stresses. The lowest values were recorded for the 10th (flasks) and 25th
(bioreactor) days of fermentation;
– analysis of the Ostwald model demonstrated the increase in viscosity (expressed
with the consistency coefficient) following the sonication process. Stabilization led to
the reduction in the value of the parameter discussed;
– the highest total decline in dry matter of sewage sludge subjected to conditioning
and fermentation (7.68 g/dm3) was found for the highest ultrasound field intensity
(3.8 W/cm2) and stabilization performed in the bioreactor.
Acknowledgements
The research was funded by the project No. BS-PB-401/303/12.
References
[1] FryŸlewicz-Kozak B, D³ugosz O. W³aœciwoœci tiksotropowe wybranych osadów biologicznych (Thixo-
tropic properties of selected biological sludge). In¿ Ap Chem. 2015;54:31-32.
www.http://inzynieria-aparatura-chemiczna.pl/pdf/2015/2015-2/InzApChem_2015_2_031-032.pdf.
[2] Sozañski MM, Kempa ES, Grocholski K, Bieñ J. The rheological experiment in sludge properties
research. Water Sci Technol. 1997;36:69-78. DOI: 10.1016/S0273-1223(97)00671-9.
[3] Wolny L, Wolski P, Zawieja I. Rheological parameters of dewatered sewage sludge after conditioning.
Desalination. 2008;222(1):382-387. DOI: 10.1016/j.desal.2007.01.175.
[4] Tang B, Zhang Z. Essence of disposing the excess sludge and optimizing the operation of wastewater
treatment: Rheological behaviour and microbial ecosystem. Chemosphere. 2014;105:1-13.
http://dx.doi.org/10.1016/j.chemosphere.2013.12.067.
[5] Ruiz-Hernando M, Martinez-Elorza G, Labanda J, Lorens J. Dewaterability of sewage sludge by
ultrasonic, thermal and chemical treatments. Chem Eng J. 2013;230:102-110.
DOI: 10.1016/j.cej.2013.06.046.
[6] Seyssiecq I, Ferasse JH, Roche N. State-of-the-art: rheological characterization of wastewater treatment
sludge. Biochem Eng J. 2003;16:41-56. DOI: 10.1016/S1369-703 X(03)00021-4.
[7] Markis F, Baudez J, Parthasarathy R, Slatter P, Eshtiaghi N. Rheological characterisation of primary and
secondary sludge: Impact of solids concentration. Chem Eng J. 2014;253:526-537.
DOI: 10.1016/j.cej.2014.05.085.
[8] Wolski P, Zawieja I. Effect of ultrasound field on dewatering of sewage sludge. Arch Environ Prot.
2012;38:25-31. DOI: 10.2478/v10265-012-0015-7.
418 Pawe³ Wolski

[9] Ruiz-Hernando M, Labanda J, Lorens J. Effect of ultrasonic waves on the rheological features of
secondary sludge. Biochem Eng J. 2010;52:131-136. DOI: 10.1016/j.bej.2010.07.012.
[10] Zawieja I, Wolny L. Effect of sonicator power on the biodegradability of sewage sludge. Annual Set
Environ Protect. 2011;13:1719-1730. http://ros.edu.pl/images/roczniki/archive/pp_2011_110.pdf.
[11] Zawieja I, Wolny L, Wolski P. Wp³yw procesu hydrolizy ultradŸwiêkowej na generowanie lotnych
kwasów t³uszczowych w procesie kwaœnej fermentacji osadów nadmiernych [The impact of ultrasonic
hydrolysis on the VFA generation in the acid fermentation of excess sludge]. In¿ Ochr Œrodow.
2009;3:207-217. https://is.pcz.pl/static/pdf//2009/zeszyt%20nr%203/T%2012%20nr%203%20Zawieja.pdf.
[12] Aranowski R, Hupka J, Jungnickel Ch. Changes in rheological properties during anaerobic digestion of
activated sludge. Physicochem Probl Miner Process. 2010;44:13-22.
http://www.ppmp.pwr.wroc.pl/sorpa/file/41e225111b2741c79ab82db57ee67c85/download.
[13] Charakterystyka osadów œciekowych. Oznaczanie suchej pozosta³oœci i zawartoœci wody. PN-EN
12880:2004. (Characteristics of sewage sludge. Determination of dry residue and water content. PN-EN
12880:2004). www.pkn.pl.
PARAMETRY REOLOGICZNE WSTÊPNIE DEZINTEGROWANYCH OSADÓW ŒCIEKOWYCH
PODDANYCH FERMENTACJI
Instytut In¿ynierii Œrodowiska, Wydzia³ Infrastruktury i Œrodowiska
Politechnika Czêstochowska, Czêstochowa
Abstrakt: Granica p³yniêcia, lepkoœæ, naprê¿enia styczne s¹ parametrami technologicznymi przydatnymi
w praktyce do kontroli pompowania osadów, p³yniêcia oraz innych procesów technologicznych zwi¹zanych
z ich przeróbk¹. Zwiêkszenie efektywnoœci odwadniania osadów powoduje spadek zdolnoœci ich p³yniêcia po-
przez wzrost granic p³yniêcia, a tym samym wartoœci naprê¿eñ stycznych. Zmiennoœæ naprê¿eñ i lepkoœci jest
wynikiem zmiany struktury zachodz¹cej w osadach w trakcie p³yniêcia. Ka¿da zmiana struktury osadów po-
przez kondycjonowanie wp³ywa³a tym samym na ich parametry reologiczne.
Celem prowadzonych badañ by³o wyznaczenie zale¿noœci naprê¿eñ stycznych i lepkoœci od gradientu prê-
dkoœci (krzywych p³yniêcia i lepkoœci) osadów œciekowych wstêpnie kondycjonowanych polem ultradŸwiêko-
wym, a nastêpnie poddanych fermentacji. W procesie sonifikacji zastosowano cztery natê¿enia fali ultra-
dŸwiêkowej: 2,2; 2,7; 3,2; 3,8 W/cm2, natomiast czas sonifikacji przyjêto 600 s. Proces fermentacji
prowadzono w 10 kolbach szklanych o pojemnoœci 0,5 dm3, stanowi¹cych modele komór fermentacyjnych.
Do opisu krzywych p³yniêcia zastosowano najprostszy matematyczny model reologiczny tzw. model Ostwal-
da. Przedstawiono równie¿ sumaryczny ubytek suchej masy osadów poddanych stabilizacji. W wyniku prze-
prowadzonych badañ odnotowano zwiêkszenie naprê¿eñ stycznych wraz z zastosowaniem wy¿szych natê¿eñ
fali pola ultradŸwiêkowego. Zmniejszenie wartoœci naprê¿eñ zaobserwowano dla osadów poddanych fermen-
tacji z ka¿dym dniem prowadzenia procesu stabilizacji.
S³owa kluczowe: osady œciekowe, naprê¿enia styczne, lepkoœæ, pole ultradŸwiêkowe, fermentacja
Rheological Parameters of Initially Disintegrated Sewage Sludge... 419


Iwona ZAWIEJA1
THE IMPACT OF EXCESS SLUDGE DISINTEGRATION
ON THE CHANGES OF TOTAL ORGANIC CARBON VALUE
WP£YW DEZINTEGRACJI OSADÓW NADMIERNYCH
NA ZMIANY WARTOŒCI CA£KOWITEGO WÊGLA ORGANICZNEGO
Abstract: The efficiency of conversion of organic substances contained in the excess sludge to the dissolved
form is considered as an important factor limiting the process of anaerobic stabilization. Direct effect,
occurring in the disintegrated sludge, lysis process is to increase the value of the total organic carbon (TOC),
correlates with the increase of the concentration of volatile fatty acids (VFAs). The total organic carbon
content is indicative of the supernatant liquid of total organic carbon in dissolved form (DOC) and suspended
(SOC). Together with occurring, as a result of biochemical processes, increase the degree of decomposition of
organic substances contained in the sludge decreases the value of the ratio of COD to TOC. The aim of the
study was to determine the impact of the process of excess sludge disintegration on the changes of the total
organic carbon values. The process of chemical disintegration of excess sludge was treated using the selected
acidic ie HCl, alkaline ie KOH and oxidizing reagents ie H2O2. The modification was carried out at ambient
temperature for 6 and 24 h. During sludge disintegration it was noticed the increase of total organic carbon
values, disintegration degree as well as the concentration of volatile fatty acids that confirmed the
susceptibility of prepared sludge to biodegradation. The highest TOC value of 2150 mg C/dm3 obtained in
case of chemical disintegration of potassium hydroxide at a dose of 12.0 g/dm3 and preparation time 24 h. For
given conditions of preparing a concentration of VFAs was 523 mg CH3COOH/dm3.
Keywords: excess sludge; chemical disintegration; total organic carbon (TOC), disintegration degree, volatile
fatty acids (VFAs)
Introduction
Sewage sludge generated as a result of the industrial and municipal wastewater
treatment, due to the hazardous substances of different nature of origin, have a harmful
effect on the environment. In order to increase the effectiveness of conventional
methods of disposing of looking for new technological solutions, the implementation of
which would provide benefits to both environmental and economic.
DOI: 10.2428/ecea.2016.23(4)35 ECOL CHEM ENG A. 2016;23(4):421-432
1 Institute of Environmental Engineering, Faculty of Infrastructure and Environment, Czestochowa
University of Technology, ul. Brzeznicka 60a, 42–200 Czêstochowa, Poland, phone: +48 34 325 09 17, email:

When the chemical modification used in the energy that comes from a chemical
reaction, in conjunction with the specific conditions of the reaction. Introduced into the
sludge chemical reagents react with the chemical contained therein organic compounds,
leading to changes in the physico-chemical parameters of modified sludge. During the
chemical modification of the cells lysis and the destruction of cell walls of living
microorganisms in sludge is observed and the release of intracellular substances into the
liquid supernatant [1, 2].
Disintegration affect the structure of the sludge and the destruction of microbial
membranes, leading to lysis of microbial cells. These processes result in increased
availability of organic ingredients cells as a substrate for heterotrophic biomass. While
water previously associated intracellularly is released. The process of disintegration is
also aimed to reduce the forces between water molecules and solid phase of sludge thus
facilitating their thickening and dehydration, which may lead the same to the break
chemical bonds that hinder the degradation of sludge. The result of these processes is to
increase the efficiency of the hydrolysis, the waveform is essentially a spontaneous
nature [2, 3].
The heterotrophic microorganisms in a variety of metabolic pathways, preferably
using organic carbon as volatile fatty acids. Their content in the substrate may well be
characterized by its vulnerability to biochemical decomposition [4].
Chemical methods use the energy from a chemical reaction often in combination
with a well defined reaction conditions, ie pressure, temperature. To the most popular
chemical reagents may include [5, 6]: oxygen (O2), ozone (O3), hydrogen peroxide
(H2O2), hydrochloric acid (HCl), sulfuric acid (H2SO4), sodium hydroxide (NaOH),
potassium hydroxide (KOH), calcium hydroxide (Ca (OH)2), magnesium hydroxide
(Mg (OH)2).
In the structure of excess sludge can be distinguished visible areas of the liquid phase
and the solid phase coarse aggregates. The structure of the sludge after chemical
disintegration process is characterized by significant fragmentation of the solid particles
and increased liquefaction residues. The changes that can be observed in the sludge
after the modification process demonstrate improved their susceptibility to biochemical
degradation [7–9].
It is important for the processes of biochemical degradation under anaerobic
conditions is the relationship between organic carbon and other nutrients, as well as the
availability of macro- and microelements in sludge [10].
According to literature data biodegradability usually expressed by comparing the
mass of the decomposed during the time period to the mass, which could theoretically
be unfolded in stoichiometric proportions. Indicators for indirect assessment of the
susceptibility of organic substances contained in the sludge on the biodegradation are
COD or BOD5 and TOC [11].
According to Stelmach et al [12] the maximum rate of biogas production in the case
of municipal waste is observed for the carbon content in the compounds dissolved in the
liquid approx. 1500 mg/dm3. It was also found that the maximum rate of biogas
production is the C/N ratio within a range of 1.5 to 2.0.
422 Iwona Zawieja

In the high processing temperatures high degree of sludge disintegration and an
increase in the concentration of dissolved organic carbon is not synonymous with
improvement in susceptibility sludge to biodegradation due to the formation, among
others, refracting the compounds [13].
Values of BOD and COD can be influenced of organic nitrogen compounds or
inorganic, reducing compounds, which may contribute to an increased demand for
oxygen. The total organic carbon (TOC) is currently the only strictly defined, parameter
defining the content of organic substances in wastewater and sludge [14].
Therefore, the aim of the research was to determine the effect of the chemical
disintegration of excess sludge to changes in the value of total organic carbon.
Material and methods
The substrate for the study was excess sludge, which was taken from the Central
Wastewater Treatment Plant “Warta” in Czestochowa. This wastewater treatment plant
was the classical mechanical-biological treatment plant, and has been upgrading in
terms of nitrogen and phosphorus removal and sludge management with thermal drying.
Currently, wastewater is adjusted to increased regulatory requirements.
Table 1
General characteristics of excess sludge used for research
Dry mass
[g/dm3]
VFAs
[mg CH3COOH/ dm3]
Kjeldahl Nitrogen
[mg N-NH4/ dm3]
pH
[–]
TOC
[mg C/dm3]
10.76 � 0.15 67.5 � 1.7 21.6 � 2.1 7.02 � 0.03 35.3 � 1.5
The following physico-chemical designations were made: pH [PN-9/C-04540/05]
[15], the dry mass [PN-EN-12879] [16], volatile fatty acids by steam distillation
[PN-75/C-04616/04] [17] and Kjeldahl nitrogen [PN-73/C-04576/10] [18]. The evaluate
the effectiveness of chemical sludge disintegration was made on the basis of the TOC
by spectrophotometric method in the infrared (carbon analyzer multi N/C manufactured
by Analytik Jena). Furthermore, the degree of disintegration, assuming as reference the
COD of sludge subjected to alkaline hydrolysis, was determined.
The sludge was conditioned by means of 1-mol solution of NaOH for 10 min, at the
temperature of 90oC, with unchanged volumetric proportion of the sludge and the
solution (1 : 1). For the excess sludge pretreatment in accordance with the above
methodology the COD value was equal 8125 mg O2/dm3.
The degree of disintegration was estimated according the following formula [19]:
DDCOD = (SCOD1 – SCOD2) / (SCOD3 – SCOD2) � 100 (1)
where: DDCOD – disintegration degree [%];
SCOD1 – SCOD level in the pretreatment sludge, mg O2/dm3;
SCOD2 – SCOD level in the unconditioned sludge, mg O2/dm3;
The Impact of Excess Sludge Disintegration on the Changes of Total Organic Carbon Value 423

SCOD3 – SCOD level in the sludge conditioned chemically 1-mol
NaOH with ratio 1 : 1, temp. 90oC for 10 minutes, mg O2/dm3.
Results and discussions
During the research have been indications of selected physical and chemical
parameters modified sludge, the value of which determines the susceptibility of sludge
to biodegradation. Examined the pH of the sludge dry matter and Kjeldahl nitrogen,
depending upon the dose of the reagent. Table 2 and 3 show the values of the selected
indications physico-chemical sludge modified as appropriate for 6 and 24 h.
Table 2
Selected physico-chemical parameters of excess sludge subjected to disintegration
using potassium hydroxide, hydrochloric acid and hydrogen peroxide,
a contact time with reagent 6 h
Reagent Dose of reagentpH
[–]
Kjeldahl Nitrogen
[mg N-NH4/dm3]
Dry mass
[g/dm3]
KOH
[g/dm3]
0.5 8.48 � 0.08 23.4 � 0.5 11.23 � 0.12
1.0 9.62 � 0.12 26.2 � 0.8 12.56 � 0.14
3.0 10.92 � 0.09 32.8 � 0.6 13.89 � 0.21
6.0 12.38 � 0.01 48.4 � 1.1 14.68 � 0.17
9.0 12.68 � 0.04 61.6 � 0.9 15.02 � 0.19
12.0 12.84 � 0.11 83.0 � 0.7 16.24 � 0.22
HCl
[cm3/dm3]
0.5 7.84 � 0.12 31.1 � 1.2 11.38 � 0.23
1.0 7.14 � 0.07 38.4 � 1.7 11.45 � 0.14
3.0 6.93 � 0.05 42.3 � 0.6 11.98 � 0.17
6.0 6.40 � 0.04 50.7 � 2.1 12.36 � 0.23
9.0 6.05 � 0.02 53.8 � 2.0 13.02 � 0.10
12.0 5.82 � 0.07 57.2 � 1.6 13.89 � 0.07
H2O2
[cm3/dm3]
0.5 7.40 � 0.12 48.3 � 1.2 11.01 � 0.11
1.0 7.45 � 0.05 46.8 � 2.4 11.28 � 0.14
3.0 7.50 � 0.07 43.1 � 2.2 11.89 � 0.18
6.0 7.43 � 0.09 38.6 � 1.5 11.97 � 0.09
9.0 7.48 � 0.04 38.9 � 1.6 12.06 � 0.11
12.0 7.53 � 0.10 28.5 � 1.8 12.35 � 0.23
With increasing dose, in the case of all used reagents, there was an increase of dry
matter and the Kjeldahl nitrogen. It was found that prolonged disintegration signi-
ficantly influenced the increase in the value of Kjeldahl nitrogen. The highest value of
tested indicator of 375 mg N-NH4/dm3 obtained for disintegrated sludge by KOH for
24 h, using a dose of 12 g/dm3. By analyzing changes in the pH of the sludge in case of
424 Iwona Zawieja

Table 3
Selected physico-chemical parameters of excess sludge subjected to disintegration
using potassium hydroxide, hydrochloric acid and hydrogen peroxide,
a contact time with reagent 24 h
Reagent Dose of reagentpH
[–]
Kjeldahl Nitrogen
[mg N-NH4/dm3]
Dry mass
[g/dm3]
KOH
[g/dm3]
0.5 8.74 � 0.05 38.4 � 1.5 10.64 � 0.11
1.0 8.87 � 0.07 58.1 � 2.1 11.74 � 0.14
3.0 11.53 � 0.11 63.7 � 1.7 13.73 � 0.21
6.0 12.46 � 0.23 187.6 � 2.3 16.28 � 0.14
9.0 12.70 � 0.25 336.2 � 3.7 19.44 � 0.24
12.0 12.90 � 0.16 375.6 � 2.9 24.81 � 0.08
HCl
[cm3/dm3]
0.5 7.54 � 0.32 25.4 � 1.2 11.45 � 0.11
1.0 7.42 � 0.16 26.5 � 1.1 11.54 � 0.21
3.0 6.84 � 0.43 35.8 � 2.6 12.21 � 0.24
6.0 7.01 � 0.24 42.9 � 3.2 13.32 � 0.16
9.0 6.48 � 0.25 57.2 � 2.7 14.01 � 0.31
12.0 5.98 � 0.21 58.6 � 2.4 14.72 � 0.29
H2O2
[cm3/dm3]
0.5 7.43 � 0.11 55.4 � 1.2 10.32 � 0.21
1.0 7.50 � 0.26 53.3 � 1.6 10.46 � 0.18
3.0 7.51 � 0.23 52.7 � 2.7 11.02 � 0.23
6.0 7.38 � 0.18 50.1 � 2.1 11.56 � 0.36
9.0 7.29 � 0.32 49.5 � 2.8 11.78 � 0.54
12.0 8.04 � 0.37 49.6 � 2.2 12.02 � 0.25
modification of sodium hydroxide and hydrochloric acid were recorded an upward trend
and the declining value of the index. While for modified sludge by hydrogen peroxide
was observed fluctuations in pH. The prolongation of disintegration time up to 24 h, for
all the tested reagents, did not affect the change in pH.
The degree of disintegration of excess sludge pretreatment by the potassium
hydroxide was determined. Figure 1 and 2 show the degree of disintegration of excess
sludge treated by chemical modification of the 6 and 24 h.
The highest value of 79 and 78% degree of disintegration of excess sludge
conditioned with potassium hydroxide was reported for a dose of 6.0 g KOH/dm3 of ex-
cess sludge, the contact time of the reactant 6 and 24 h. For a dose of 9 and 12 g KOH/dm3
reported decrease in the disintegration degree value which could be due to the hetero-
geneous nature of the sample. Figure 3 and 4 show the changes in the TOC value and
volatile fatty acids concentration of modified excess sludge by potassium hydroxide.
The highest value of TOC was observed for doses of 12.0 g KOH/dm3 for the time 6
and 24 h respectively 1870 and 2150 mg C/dm3, while the lowest value of 158 and 218
mg C/dm3 for dose KOH equal 0.5 g/dm3. The highest concentration of VFAs,
The Impact of Excess Sludge Disintegration on the Changes of Total Organic Carbon Value 425

426 Iwona Zawieja
80
70
60
50
40
30
20
10
0
Dis
inte
gra
tion d
egre
e [
%]
0.5 1.0 3.0 6.0 9.0 12.0
Dose of KOH [c /dm ]3m3
Fig. 1. Changes of the disintegration degree value of excess sludge modified by potassium hydroxide by 6 h
80
70
60
50
40
30
20
10
0
Dis
inte
gra
tion d
egre
e [%
]
0.5 1.0 3.0 6.0 9.0 12.0
Dose of KOH [c /dm ]3m3
Fig. 2. Changes of the disintegration degree value of excess sludge modified by potassium hydroxide by 24 h
2500
2000
1500
1000
500
0
TO
C [m
g/d
m]
3
0.5 1.0 3.0 6.0 9.0 12.0
Dose of KOH [g/dm ]3
6 h
12 h
Fig. 3. Changes of the total organic carbon value of excess sludge modified by potassium hydroxide

The Impact of Excess Sludge Disintegration on the Changes of Total Organic Carbon Value 427
600
500
400
300
200
100
0
WFA
s [
mg C
HC
OO
H/d
m]
33
0.5 1.0 3.0 6.0 9.0 12.0
6 h
12 h
Dose of KOH [g/dm ]3
Fig. 4. Changes of the volatile fatty acids concentration of excess sludge modified by potassium hydroxide
50
40
30
20
10
0
Dis
inte
gra
tion d
egre
e [%
]
0.5 1.0 3.0 6.0 9.0 12.0
Dose of HCl [c /dm ]3m3
Fig. 5. Changes of the disintegration degree value of excess sludge modified by hydrochloric acid by 6 h
60
50
40
30
20
10
0
Dis
inte
gra
tio
n d
eg
ree
[%
]
0.5 1.0 3.0 6.0 9.0 12.0
Dose of HCl [c /dm ]3m3
Fig. 6. Changes of the disintegration degree value of excess sludge modified by hydrochloric acid by 24 h

428 Iwona Zawieja
250
200
150
100
50
0
TO
C [
mg/d
m]
3
0.5 1.0 3.0 6.0 9.0 12.0
Dose of HCl [c /dm ]3m3
6 h
12 h
Fig. 7. Changes of the total organic carbon value of excess sludge modified by hydrochloric acid
500
400
300
200
100
0
WFA
s [m
g C
HC
OO
H/d
m]
33
0.5 1.0 3.0 6.0 9.0 12.0
Dose of HCl [c /dm ]3m3
6 h
12 h
Fig. 8. Changes of the volatile fatty acids concentration of excess sludge modified by hydrochloric acid
30
20
10
0
Dis
inte
gra
tion d
egre
e [%
]
0.5 1.0 3.0 6.0 9.0 12.0
Dose of H O [c /dm ]2 23m3
Fig. 9. Changes of the disintegration degree value of excess sludge modified by hydrogen peroxide by 6 h

The Impact of Excess Sludge Disintegration on the Changes of Total Organic Carbon Value 429
30
20
10
0
Dis
inte
gra
tio
n d
eg
ree
[%
]
0.5 1.0 3.0 6.0 9.0 12.0
Dose of H O [c /dm ]2 23m3
Fig. 10. Changes of the disintegration degree value of excess sludge modified by hydrogen peroxide by 24 h
0.5 1.0 3.0 6.0 9.0 12.0
Dose of H O [c /dm ]2 23m3
80
70
60
50
40
30
20
10
0
6 h
12 h
TO
C [m
g/d
m]
3
Fig. 11. Changes of the total organic carbon value of excess sludge modified by hydrogen peroxide
0.5 1.0 3.0 6.0 9.0 12.0
Dose of H O [c /dm ]2 23m3
400
300
200
100
0
WFA
s [m
g C
HC
OO
H/d
m]
33
6 h
12 h
Fig. 12. Changes of the volatile fatty acids concentration of excess sludge modified by hydrogen peroxide

respectively 512 and 523 mg CH3COOH/dm3 was observed for the highest dose of the
reagent 12.0 g KOH/dm3 of sludge, and two periods of preparation. The lowest
concentration of KOH was reported for a dose of 0.5 g KOH/dm3 and was, respectively,
for 6 h – 314 mg CH3COOH/dm3 and 24 h – 342 mg CH3COOH/dm3. Figure 5 and 6 show
the changes in disintegration degree of excess sludge modified with hydrochloric acid.
The highest values of the disintegration degree of excess sludge treated with
hydrochloric acid 42 and 56% was observed at a dose of 12.0 cm3 of HCl/dm3 of sludge
and 6 and 24 hours. Figure 7 and 8 show the changes in the TOC value and volatile fatty
acids concentration of excess sludge modified by hydrochloric acid.
From the Fig. 3 it can be seen that the value of TOC increased with the increase of
reagent dose. The lowest value was observed for a dose of 0.5 cm3 of HCl/dm3 ie for the
time 6 h – 71 mg C/dm3 and for the 24 h – 74 mg C/dm3. The value obtained for the
highest dose of 12.0 cm3 of HCl/dm3 was for a time of 6 h – 195 mg C/dm3 and for 24 h
– 215 mg C/dm3. The highest concentration of VFAs, respectively 454 and 461 mg
CH3COOH/dm3 was observed for the highest dose of the reagent 12.0 cm3 HCl/dm3 of
sludge, and both period of preparation. The lowest concentration of VFAs was reported
for a dose of 0.5 g KOH/dm3 and was, respectively, for 6 h – 212 mg CH3COOH/dm3
and for 24 h – 221 mg CH3COOH/dm3.
Figure 9 and 10 show the changes in the degree of disintegration of excess sludge
modified with hydrogen peroxide.
The highest degree of disintegration of excess sludge chemically modified by
hydrogen peroxide 22% was reported for a dose of 12.0 cm3 H2O2/dm3 of sludge and
pretreatment time equal 6 h. For 24 h the highest value of disintegration degree equal
32% was reported for a dose of 3.0 cm3 H2O2/dm3 of sludge. Figure 11 and 12 show the
changes in the TOC value and volatile fatty acids concentration of excess sludge
modified by hydrogen peroxide.
Increase the value of TOC was observed with increasing doses of a reagent. For the
disintegration time of 6 h and dose of 0.5 cm3 H2O2/ dm3 recorded lowest value of TOC
36 mg C/dm3, while for a 24 h a value of 40 mg C/dm3. The highest value of TOC 54
and 72 mg C/dm3, respectively for the time 6 and 24 h obtained for 12.0 cm3 H2O2/dm3
of sludge. The highest concentration of VFA, respectively 373 and 385 mg CH3COOH/dm3
was observed for the highest dose of the reagent 12.0 cm3 H2O2/dm3 of sludge, and both
period of preparation. The lowest concentration was observed at a dose of 0.5 cm3
H2O2/dm3, and was, respectively, for 6 h – 105 mg CH3COOH/dm3 and for 24 h –
111 mg CH3COOH/dm3.
Conclusions
Based on the results obtained the following conclusions were drawn:
1. By subjecting the excess sludge chemical disintegration was observed with
increasing doses of reagent increase the value of the degree of disintegration, increase
the value of TOC and concentration of VFAs. Increasing the value of these indicators
may indicate an increase in the biodegradability of sludge, which will be confirmed in
further studies regarding the process of anaerobic stabilization of modified sludge.
430 Iwona Zawieja
2. It has been found that the extension of the modification time for 24 h in the case of
the concentration of VFAs did not significantly influence the value of the test indicator.
3. The highest TOC value of chemically modified excess sludge 2150 mg C/dm3 was
reported for a dose of 12.0 g KOH/dm3 and preparation time 24 h.
4. The highest degree of disintegration of excess sludge modified chemically, ie 79%
were obtained with a dose of 6.0 g KOH/dm3 and preparation time 6 h.
5. The highest concentration of VFAs 523 mg CH3COOH/dm3 of sludge obtained for
excess sludge pretreatment at 12.0 cm3/dm3 for 24 h. For the time 6 h a concentration of
VFAs was 512 mg CH3COOH/dm3.
Acknowledgements
The research was funded by the project No. BS-PB-401/303/12 entitled “High-efficiency wastewater
treatment and sludge utilization” funded by the Ministry of Science and Higher Education.
References
[1] Wonglertarak W, Wichitsathian B. Alkaline Pretreatment of Waste Activated Sludge in Anaerobic
Digestion, Journal of Clean Energy Technol. 2014:2(2):118-121. DOI: 10.7763/JOCET.2014.V2.10.
[2] Barañski M, Ma³kowski M, Wolny L. Influence of physical disintegration of excess sludge on the
anaerobic stabilization process. In¿ Ochr Œrodow. 2014:17(2):315-324.
http://yadda.icm.edu.pl/yadda/element/bwmeta1.element.baztech-a1136ab2-2411-4dc9-b1ab-4df3fa2e
bcce/c/Baranski_Malkowski_Wolny_Wplyw_2_2014.pdf
[3] Zawieja I, Wolski P. Effect of hybrid method of excess sludge disintegration on the increase of their
biodegradalibity. Environ Prot Eng. 2013:39(2):153-165. DOI: 10.5277/EPE130215.
[4] Myszograj S. Production of biodegradable hydrolysate from municipal solid waste using thermal
disintegration. In¿ Ochr Œrodow. 2011;14(3):281-290.
http://yadda.icm.edu.pl/yadda/element/bwmeta1.element.baztech-article-LOD7-0032-0031/c/
Myszograj_Biodegradowalnosc_3_2011.pdf
[5] Kim J, Park C, Kim TH, Lee M, Kim S, Kim SW, Lee J. Effects of various pretreatments for enhanced
anaerobic digestion with waste activated sludge. J Biosci Bioeng: 2003:95:271-275.
DOI: 10.1016/S1389-1723(03)80028-2.
[6] Vlyssides A, Karlis P. Thermal-alkaline solubilization of WAS as apretreatment for anaerobic digestion.
Bioresource Technol. 2004;91:201-206. DOI:10.1016/S0960-8524(03)00176-7.
[7] Wolski P, Ma³kowski M. Dewatering of excess sludge submitted anaerobic stabilization assisted
conditioning process. Rocznik Ochr Œrodow. 2014:16:93-104.
http://ros.edu.pl/images/roczniki/2014/pp_2014_01_05.pdf
[8] Wolski P. Wspomaganie koñcowego zagêszczania i odwadniania osadów œciekowych [Support of the
final thickening and dewatering of sludge]. Rocznik Ochr Œrodow. 2016;18:730-742.
http://www.ros.edu.pl/images/roczniki/2016/045_ROS_V18_R2016.pdf.
[9] Wolski P, Ma³kowski M. Dewatering of initially conditioned excess sludge after fermentation. Desalin
Water Treat. 2014;52(19-21):3973-3978. DOI: 10.1080/19443994.2014.887504.
[10] Myszograj S. The effects of the solubilisation of the COD of municipal waste in thermal disintegration.
Archiv Environ Protect. 2013;39(2):57-67. DOI: 10.2478/aep-2013-0014.
[11] Deublein D, Steinhauser A, Biogas from waste and renewable resources, Wiley-VCH Verlag; 2008.
DOI: 10.1002/9783527632794.
[12] Stelmach E, Stelmach J, Krzystek L, Ledakowicz S. Wp³yw zawartoœci wêgla i azotu na szybkoœæ
produkcji biogazu z organicznej frakcji sta³ych odpadów komunalnych [Influence of carbon and nitrogen
content on biogas production rate from organic fraction of municipal solid waste]. In¿ Aparat Chem.
2010;49(1):107-108,
http://inzynieria-aparatura-chemiczna.pl/pdf/2010/2010-1/InzApChem_ 2010_1_107-108.pdf
The Impact of Excess Sludge Disintegration on the Changes of Total Organic Carbon Value 431

[13] Weemaes M, Grootaerd H, Simoens F, Verstraete W. Anaerobic digestion of ozonized biosolids, Water
Res. 2000;34:2330-2336. http://dx.doi.org/10.1016/S0043-1354(99)00373-5
[14] Determination of natural organic matter in water based on determinations of total organic carbon and UV
absorbance.
http://www.staff.amu.edu.pl/~ZTUW/ftp/D5%20Okreslenie%20NOM%20na%20podstawie%20OWO
%20i%20absorbancji.pdf.
[15] Polskie Normy [Polish Standards] (PN-9/C-04540/05), Publishing Standards, Warszawa.
[16] Polskie Normy [Polish Standards] (PN-EN-12879), Publishing Standards, Warsaw.
[17] Polskie Normy [Polish Standards] (PN-75/C-04616/04), Publishing Standards, Warsaw.
[18] Polskie Normy [Polish Standards] (PN-73/C-04576/10), Publishing Standards, Warsaw.
[19] Tiehm A, Nickel K, Zellhorn M, Neis U. Ultrasonic waste activated sludge disintegration for improving
anaerobic stabilization. Water Res. 2001;35(8):2003-2009. DOI: 10.1016/S0043-1354(00)00468-1.
WP£YW DEZINTEGRACJI OSADÓW NADMIERNYCH
NA ZMIANY WARTOŒCI CA£KOWITEGO WÊGLA ORGANICZNEGO
Instytut In¿ynierii Œrodowiska, Wydzia³ Infrastruktury i Œrodowiska
Politechnika Czêstochowska, Czêstochowa
Abstrakt: EfektywnoϾ przemiany substancji organicznych zawartych w osadach nadmiernych do formy
rozpuszczonej jest traktowana jako wa¿ny czynnik limituj¹cy przebieg procesu stabilizacji beztlenowej.
Bezpoœrednim efektem procesu lizy zachodz¹cego w dezintegrowanych osadach jest wzrost wartoœci
ogólnego wêgla organicznego (OWO) oraz koreluj¹cy z nim wzrost wartoœci stê¿enia lotnych kwasów
t³uszczwych (LKT). Ogólny wêgiel organiczny jest wskaŸnikiem zawartoœci w cieczy nadosadowej
ca³kowitego wêgla organicznego w formie rozpuszczonej (RWO) i zawieszonej (ZWO). Wraz z zachodz¹cym
w wyniku procesów biochemicznych wzrostem stopniem rozk³adu substancji organicznych zawartych
w osadach maleje wartoœæ ilorazu ChZT do OWO. Celem badañ by³o okreœlenie wp³ywu procesu
dezintegracji osadów nadmiernych na zmiany wartoœci ca³kowitej wêgla organicznego. Proces chemicznej
dezintegracji osadów nadmiernych prowadzono, stosuj¹c wybrane reagenty kwaœne (HCl), zasadowe (KOH)
i utleniaj¹ce (H2O2). Modyfikacjê przeprowadzono w temperaturze pokojowej w ci¹gu 6 i 24 godzin. Podczas
procesu dezintegracji osadów nadmiernych odnotowano wzrost wartoœci ogólnego wêgla organicznego,
a tak¿e stê¿enia lotnych kwasów t³uszczowych, co potwierdzi³o podatnoœæ preparowanych osadów na
biodegradacjê. Najwy¿sz¹ wartoœæ OWO 2150 mg C/dm3 uzyskano w przypadku chemicznej dezintegracji
wodorotlenkiem potasu w dawce 12 g/dm3 i w czasie preparowania 24 h. Dla podanych powy¿ej warunków
preparowania uzyskano stê¿enie LKT, wynosz¹ce 523 mg CH3COOH/dm3.
S³owa kluczowe: osady nadmierne, ogólny wêgiel organiczny (OWO), stopieñ dezintegracji, lotne kwasy
t³uszczowe (LKT)
432 Iwona Zawieja
Grzegorz KUSZA1*, Beata GO£UCHOWSKA1
and Magdalena SZEWCZYK2
CHANGES IN PHYSICOCHEMICAL PROPERTIES
OF SOILS IN THE AREA AFFECTED
BY LIME INDUSTRY
ZMIANY W£AŒCIWOŒCI FIZYKOCHEMICZNYCH GLEB
W REJONIE ODDZIA£YWANIA PRZEMYS£U WAPIENNICZEGO
Abstract: Lime and cement industry belongs to the best developed branches of industry in Opole
Voivodeship. The plants are located in eastern and central part of the province, in the vicinity of the city of
Opole and the towns of Krapkowice and Strzelce Opolskie due to the location of the resources of calcareous
raw materials (limestones and marls).The impact of lime and cement industry on the natural environment,
especially soils, was studied by many authors, but these works do not concern the Province of Opole, which is
one of the main centers of lime and cement industry in Poland for centuries. The article is an attempt to show
changes in physicochemical properties of soils being under long lasting influence of alkaline dust emissions
coming from the lime plant in Gorazdze. The research was conducted in the years 2010–2013. The range of
the studies included field works in the areas adjacent to the plant, where 12 representative soil pits were
arranged to collect samples for laboratory analyses. The following physicochemical parameters were
determined in the samples: grain size distribution, reaction (pH), electrical conductivity and the content of
calcium carbonate. The studies showed deacidification of the tested sandy soils resulting from alkaline dust
deposition, which primarily concerned forest stands, which were characterized by the rise in reaction by
3–4 pH units. In the case of meadows, arable soils and wastelands, the pH values raised by 1–2 units.
Moreover, alkaline falling dusts enriched the investigated soils in calcium carbonate. It concerns to the
greatest extent the soil pits located nearest to the lime plant, where above 1% of CaCO3 was found. The results
of conductivity measurements proved low salinity of the investigated samples.
Keywords: lime dusts, proper rusty soils, pH, electrical conductivity, calcium carbonate content
DOI: 10.2428/ecea.2016.23(4)33 ECOL CHEM ENG A. 2016;23(4):433-442
1 Independent Chair of Land Protection, University of Opole, ul. Oleska 22, 45–052 Opole, Poland, phone:
+48 77 401 60 01, fax: +48 77 401 60 30.
2 Faculty of Infrastructure and Environment, Czestochowa University of Technology, ul. J.H. D¹browskie-
go 73, 42–201 Czêstochowa, Poland, phone: +48 34 325 04 62, fax: +48 34 325 44 00.
* Corresponding author: [email protected]

Introduction
The Province of Opole is an important center of cement and lime industry in Poland
due to the presence of high-quality deposits of carbonate raw materials (limestones and
marls) in the central and eastern parts of the region. The lime manufacture is the oldest
branch of industry in Opole Province, concentrated in the area of Tarnow Opolski,
Gorazdze, Gogolin and Strzelce Opolskie, where rich deposits of the Triassic limestones
– raw materials for lime production – occur. At the end of the twentieth century, there
operated six departments of lime manufacture, and these days there operate two,
situated in Tarnow Opolski and Gorazdze.
By the end of the last century lime burning took place in shaft furnaces, and now mainly
in modern regenerative Maerz type kilns. Lime plants produce quicklime (burnt
lime) ground and in lumps, hydrated lime, calcium fertilizers (in the form of oxides,
magnesium oxides and carbonates), calcareous aggregates, fodder and painting chalks,
calcareous and glass flours, sorbents for flue gas desulfurization, limestone and special
products.
The process of lime burning has a long tradition in the Opole Province dating from
the 16th century, so the lime dust has impacted on soils of the Opole region for about
500 years, which is not without effect on their composition and properties. This is
confirmed by the study of soils of Opole Province forest reserves, being under the
influence of cement and lime industry, which showed increased magnetic susceptibility
and the content of heavy metals and proved technogenic origin of the magnetic
susceptibility, which was correlated with the content of metals [1, 2].
For decades, the main source of lime dust were shaft furnaces, which did not have
any dust collection equipment and posed environmental hazard [3, 4]. According to the
archive data, in the 90s of the last century lime plants emitted about 1000 Mg of dust
per year, of which more than half came from shaft furnaces. The largest share in dust
pollution of the atmospheric air had the lime plant in Gorazdze, hence the dust from this
plant should be considered the most important from the point of view of environmental
impact. Along with the increase in dust emissions, the increase in dust deposition was
noted. Analyzing historical data it can be seen, that around the lime plants the allowable
standard value of the fall of dust 200 g � m–2� yr–1 was significantly exceeded [5]. The
impact on the quantity and quality of the falling dust was also close proximity to the
cement plant that used raw materials coming from the same deposits.
The aim of the research, presented in this work, carried out in the years 2010–2013,
was assessment of the impact of lime dust on the rusty soils in the vicinity of the
lime plant in Gorazdze, by determination of changes in the physico-chemical proper-
ties of soils and diversity of features of genetic horizons. An attempt has also
made to determine the extent of the impact of emitted lime dust in the selected
transects.
Despite the fact, that the Province of Opole is one of the main centers of lime
industry in Poland for about 500 years, the research into the impact of lime dusts on
soils has not been conducted in this region so far, but mostly in the so called “White
Basin” – the Swietokrzyski region.
434 Grzegorz Kusza et al
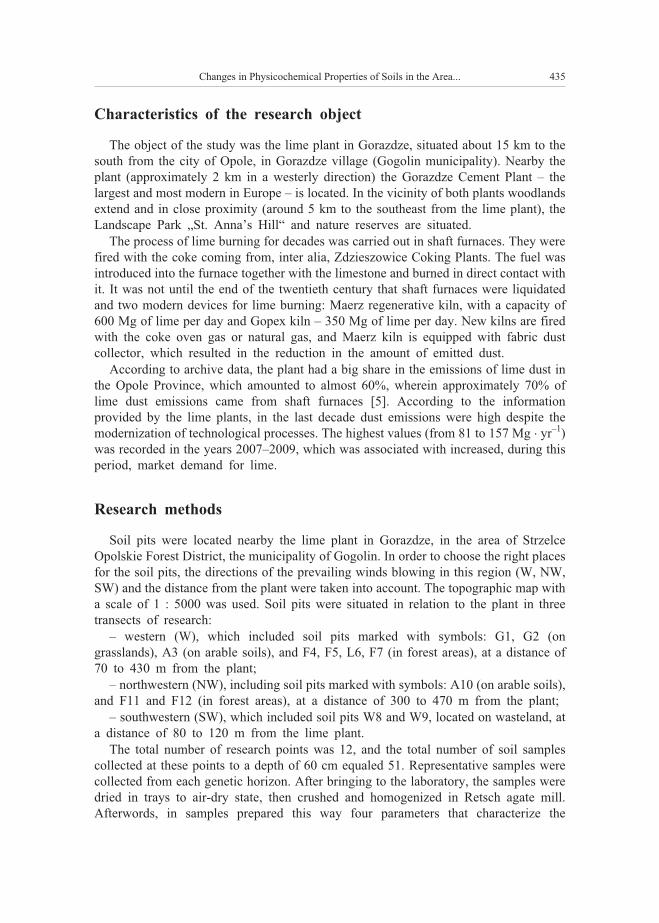
Characteristics of the research object
The object of the study was the lime plant in Gorazdze, situated about 15 km to the
south from the city of Opole, in Gorazdze village (Gogolin municipality). Nearby the
plant (approximately 2 km in a westerly direction) the Gorazdze Cement Plant – the
largest and most modern in Europe – is located. In the vicinity of both plants woodlands
extend and in close proximity (around 5 km to the southeast from the lime plant), the
Landscape Park „St. Anna’s Hill“ and nature reserves are situated.
The process of lime burning for decades was carried out in shaft furnaces. They were
fired with the coke coming from, inter alia, Zdzieszowice Coking Plants. The fuel was
introduced into the furnace together with the limestone and burned in direct contact with
it. It was not until the end of the twentieth century that shaft furnaces were liquidated
and two modern devices for lime burning: Maerz regenerative kiln, with a capacity of
600 Mg of lime per day and Gopex kiln – 350 Mg of lime per day. New kilns are fired
with the coke oven gas or natural gas, and Maerz kiln is equipped with fabric dust
collector, which resulted in the reduction in the amount of emitted dust.
According to archive data, the plant had a big share in the emissions of lime dust in
the Opole Province, which amounted to almost 60%, wherein approximately 70% of
lime dust emissions came from shaft furnaces [5]. According to the information
provided by the lime plants, in the last decade dust emissions were high despite the
modernization of technological processes. The highest values (from 81 to 157 Mg � yr–1)
was recorded in the years 2007–2009, which was associated with increased, during this
period, market demand for lime.
Research methods
Soil pits were located nearby the lime plant in Gorazdze, in the area of Strzelce
Opolskie Forest District, the municipality of Gogolin. In order to choose the right places
for the soil pits, the directions of the prevailing winds blowing in this region (W, NW,
SW) and the distance from the plant were taken into account. The topographic map with
a scale of 1 : 5000 was used. Soil pits were situated in relation to the plant in three
transects of research:
– western (W), which included soil pits marked with symbols: G1, G2 (on
grasslands), A3 (on arable soils), and F4, F5, L6, F7 (in forest areas), at a distance of
70 to 430 m from the plant;
– northwestern (NW), including soil pits marked with symbols: A10 (on arable soils),
and F11 and F12 (in forest areas), at a distance of 300 to 470 m from the plant;
– southwestern (SW), which included soil pits W8 and W9, located on wasteland, at
a distance of 80 to 120 m from the lime plant.
The total number of research points was 12, and the total number of soil samples
collected at these points to a depth of 60 cm equaled 51. Representative samples were
collected from each genetic horizon. After bringing to the laboratory, the samples were
dried in trays to air-dry state, then crushed and homogenized in Retsch agate mill.
Afterwords, in samples prepared this way four parameters that characterize the
Changes in Physicochemical Properties of Soils in the Area... 435

physicochemical properties of the soils were determined with methods commonly used
in soil science [6, 7]:
– the particle size distribution – by Casagrande areometric method in Proszynski’s
modification (silt and clay fractions), and by sieving method (sand fractions);
– reaction (pH) – by potentiometric method, the mass ratio of the soil to the water in
the suspension equaled 1 : 2.5;
– specific conductivity – conductrometrically, the mass ratio of the soil to the water
in the suspension was 1 : 5;
– the content of calcium carbonate – by Scheibler volumetric method.
The tested soils were classified according to the latest international and Polish soil
classsification systems [8–11].
Results and discussion
Profile structure and particle size distribution of soils
In the course of field research it was found, that in the tested area Rusty soils (WRB:
Brunic Arenosols) occurs, the subtype of proper rusty soils, with the following structure
of profile: Ol-Ofh-Ah-Bv-C (soils of forest areas), A1-A2-Bv-C (soils of grasslands)
and ApBv-Bv-C (arable soils). It is known from the literature, that in natural conditions
such soils are formed from the poor in nutrients, carbonateless sands. They are charac-
terized by acid reaction with the dominance of the acidifying processes, ie leaching,
washing, podsolisation, low sorption capacity and small buffering capacity [8–12].
As a result of grain size distribution analysis one granulometric group-sands, and
three subgroups (loose sands, weakly loamy sands and loamy sands) were distinguished
(Table 1). A characteristic feature of granulometry of the tested soils is the presence of
sand fractions only (coarse sands) throughout the soil profile, to an average depth of
50 cm. The differences that occur in the composition of the granulometric subgroups
arise from lithogenic properties of substrate (bedrock), relief and soil forming processes,
affecting the soil substrate [8–11].
Table 1
Schematic layuot of grain size distribution in the tested soils
Particle size distribution arrangement Number of soil pit
Homogeneous
loamy sand G2
sand F5
sand W9
Heterogeneous, binarysand/loamy sand F4, F7, F11, F12, W8
loamy sand/sand A10
Heterogeneous, ternary
loamy sand/sand/loamy sand G1
loamy sand/sand/sand A3
sand/loamy sand/sand L6
436 Grzegorz Kusza et al
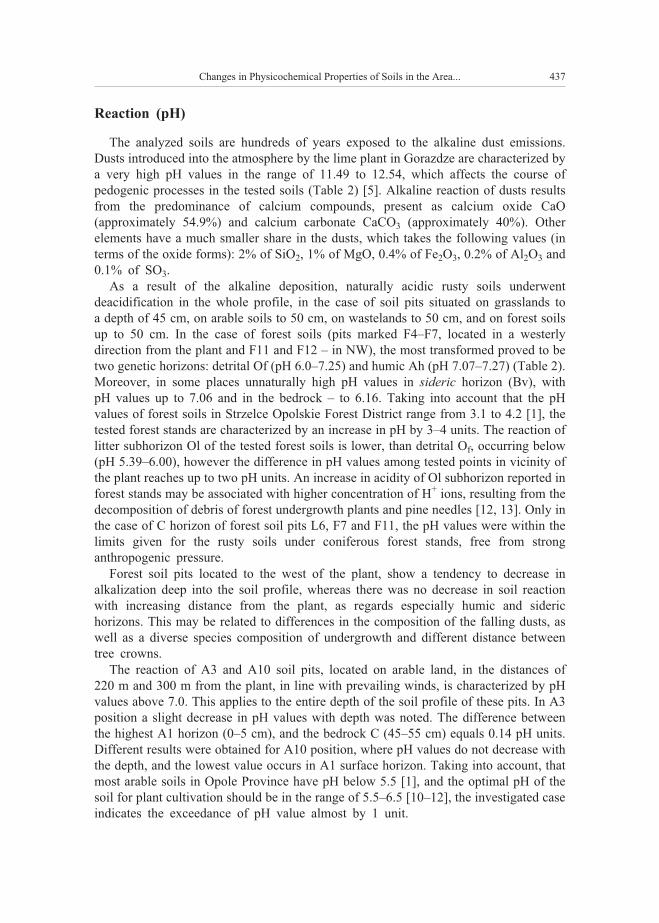
Reaction (pH)
The analyzed soils are hundreds of years exposed to the alkaline dust emissions.
Dusts introduced into the atmosphere by the lime plant in Gorazdze are characterized by
a very high pH values in the range of 11.49 to 12.54, which affects the course of
pedogenic processes in the tested soils (Table 2) [5]. Alkaline reaction of dusts results
from the predominance of calcium compounds, present as calcium oxide CaO
(approximately 54.9%) and calcium carbonate CaCO3 (approximately 40%). Other
elements have a much smaller share in the dusts, which takes the following values (in
terms of the oxide forms): 2% of SiO2, 1% of MgO, 0.4% of Fe2O3, 0.2% of Al2O3 and
0.1% of SO3.
As a result of the alkaline deposition, naturally acidic rusty soils underwent
deacidification in the whole profile, in the case of soil pits situated on grasslands to
a depth of 45 cm, on arable soils to 50 cm, on wastelands to 50 cm, and on forest soils
up to 50 cm. In the case of forest soils (pits marked F4–F7, located in a westerly
direction from the plant and F11 and F12 – in NW), the most transformed proved to be
two genetic horizons: detrital Of (pH 6.0–7.25) and humic Ah (pH 7.07–7.27) (Table 2).
Moreover, in some places unnaturally high pH values in sideric horizon (Bv), with
pH values up to 7.06 and in the bedrock – to 6.16. Taking into account that the pH
values of forest soils in Strzelce Opolskie Forest District range from 3.1 to 4.2 [1], the
tested forest stands are characterized by an increase in pH by 3–4 units. The reaction of
litter subhorizon Ol of the tested forest soils is lower, than detrital Of, occurring below
(pH 5.39–6.00), however the difference in pH values among tested points in vicinity of
the plant reaches up to two pH units. An increase in acidity of Ol subhorizon reported in
forest stands may be associated with higher concentration of H+ ions, resulting from the
decomposition of debris of forest undergrowth plants and pine needles [12, 13]. Only in
the case of C horizon of forest soil pits L6, F7 and F11, the pH values were within the
limits given for the rusty soils under coniferous forest stands, free from strong
anthropogenic pressure.
Forest soil pits located to the west of the plant, show a tendency to decrease in
alkalization deep into the soil profile, whereas there was no decrease in soil reaction
with increasing distance from the plant, as regards especially humic and sideric
horizons. This may be related to differences in the composition of the falling dusts, as
well as a diverse species composition of undergrowth and different distance between
tree crowns.
The reaction of A3 and A10 soil pits, located on arable land, in the distances of
220 m and 300 m from the plant, in line with prevailing winds, is characterized by pH
values above 7.0. This applies to the entire depth of the soil profile of these pits. In A3
position a slight decrease in pH values with depth was noted. The difference between
the highest A1 horizon (0–5 cm), and the bedrock C (45–55 cm) equals 0.14 pH units.
Different results were obtained for A10 position, where pH values do not decrease with
the depth, and the lowest value occurs in A1 surface horizon. Taking into account, that
most arable soils in Opole Province have pH below 5.5 [1], and the optimal pH of the
soil for plant cultivation should be in the range of 5.5–6.5 [10–12], the investigated case
indicates the exceedance of pH value almost by 1 unit.
Changes in Physicochemical Properties of Soils in the Area... 437

Soil pits located on grasslands, overgrown with grassy vegetation (L1 and L2) and on
wastelands (W8 and W9), are characterized by an increased reaction throughout entire
depth. In the case of meadow pits £1 and £2, located at the following distances from the
plant: 70 m and 170 m respectively, in line with the prevailing winds, pH values of soil
horizons vary in the range of 7.4–7.7. Wasteland stands W8 and W9, situated at
distances: 80 m and 120 m from the emitter, are characterized by lower reaction of soil
horizons, with pH values in the range of 7.0–7.5. The optimum pH values for grassy
vegetation growth on mineral soils range from 5.5 to 6.5 [10–12], which indicates the
exceedance of pH limit value from 0.5 to 1 pH unit in the tested soil pits.
Alkalization of soils is one of the best known and widely described in the literature
results of the impact of cement and lime dusts on the environment. The falling dusts, de-
posited on the soil surface, are the reason for breakage soil protective barriers, arising
from its buffer properties. Numerous studies have shown changes in functioning of a variety
of soil buffers, which does not allow to maintain the soil pH in a natural range [11–14].
Particularly noteworthy are the work concerning chemical transformations of forest
soils under the long-term deposition of alkaline dusts coming from cement and lime
plants in the Swietokrzyski region of Poland [15]. The author showed strong
alkalization of soils, manifested in changes in their buffering properties, and the content
of such metals as: Ca, Mg, Mn, Al and Fe, which led to the transformation of plant
communities. She also described the transformations which the alkaline falling dusts are
subjected to in the upper soil horizons. It is the process of decomposition, which
releases and mobilizes dust components into the soil profile, as well as the process of
binding the dusts of hydrophilic properties in poorly soluble compounds. Surface
horizons of forest soils (Of, Oh, Ofh) form the filter catching alkaline dust particles,
which significantly reduces their migration to deeper horizons.
The content of carbonates
The content of calcium carbonate CaCO3 in the tested soils ranged from 0.0 to 3.06%
(Table 2). It was fund, that the amount of this component decreases with the depth of
sampling in the soil profile, and depends on the distance from the plant, which may be
related to the deposition of lime dusts.
Table 2
Physicochemical properties of the tested soils
Symbol
of soil pit
Location
of soil pit
against
the plant
Depth
of sampling
[cm]
Soil
horizon
pH [-]Content
of CaCO3
[%]
Electrical
conductivity
[�S � cm–1]H2O KCl
G170 m
W
0–5
25–45
< 45
A1
C
C
7.84
8.07
8.09
7.41
7.72
7.63
2.23
0.10
0.08
116.5
50.1
48.5
G2170 m
W
0–5
15–25
A1
A2
7.84
7.87
7.44
7.57
3.06
1.39
145.7
115.1
438 Grzegorz Kusza et al

Symbol
of soil pit
Location
of soil pit
against
the plant
Depth
of sampling
[cm]
Soil
horizon
pH [-]Content
of CaCO3
[%]
Electrical
conductivity
[�S � cm–1]H2O KCl
A3220 m
W
0–5
0–30
45–55
A1
Ap
C
7.45
7.47
7.64
7.10
7.01
6.96
0.27
0.31
0.02
58.3
57.1
40.5
F4230 m
W
3–2
2–0
0–15
40–60
< 60
Ol
Ofh
Ah
ABv
C
6.11
7.15
7.68
7.26
6.92
6.00
7.15
7.16
6.67
6.16
—
—
0.17
0.06
0.02
321.0
167.5
102.3
43.9
24.8
F5280 m
W
3–2
2–0
0–20
20–40
< 40
Ol
Ofh
Ah
Bv
C
5.99
7.26
7.76
6.73
6.82
5.88
7.25
7.27
5.95
5.92
—
—
0.21
0.02
0
288.3
132.8
90.9
28.1
28.6
L6330 m
W
7–6
6–0
0–10
10–25
< 25
Ol
Ofh
Ah
Bv
C
5.78
6.57
7.70
7.28
6.09
5.46
6.65
7.22
6.75
4.94
—
—
1.25
0.02
0.02
317.3
207.7
145.7
51.6
40.0
F7430 m
W
6–5
5–0
0–10
10–25
< 25
Ol
Ofh
Ah
Bv
C
5.57
6.69
7.77
6.82
4.80
5.42
6.50
7.23
6.07
4.31
—
—
0.31
0.02
0.04
313.0
145.4
106.8
38.2
47.0
W880 m
SW
0–5
0–25
25–40
< 50
A1
A2
Bv
C
7.65
7.75
7.68
7.76
7.28
7.35
7.09
7.06
0.86
0.11
0.04
0.02
84.3
78.8
39.5
30.6
W9120 m
SW
0–5
10–25
25–40
< 50
A1
A2
Bv
C
7.55
7.78
7.80
7.80
7.18
7.48
7.37
6.97
0.52
0.21
0.11
0
141.9
70.5
52.4
27.2
A10300 m
NW
0–5
25–35
< 50
A1
Ap
C
7.67
7.92
7.91
7.22
7.44
7.34
0.82
0.35
0.02
96.0
66.4
36.9
F11400 m
NW
3–2
2–0
0–10
10–25
< 50
Ol
Ofh
Ah
Bv
C
5.39
7.16
7.41
5.62
5.12
5.39
7.16
7.07
5.13
4.53
—
—
0.73
0.02
0
358.7
169.3
236
293.3
252.7
F12470 m
NW
3–2
2–0
0–10
10–25
< 50
Ol
Ofh
Ah
Bv
C
5.83
6.78
7.72
7.68
6.79
5.78
6.87
7.20
7.06
6.16
—
—
0.79
0.06
0.04
276.7
140.9
115.5
45.9
29.8
Changes in Physicochemical Properties of Soils in the Area... 439
Table 2 contd.
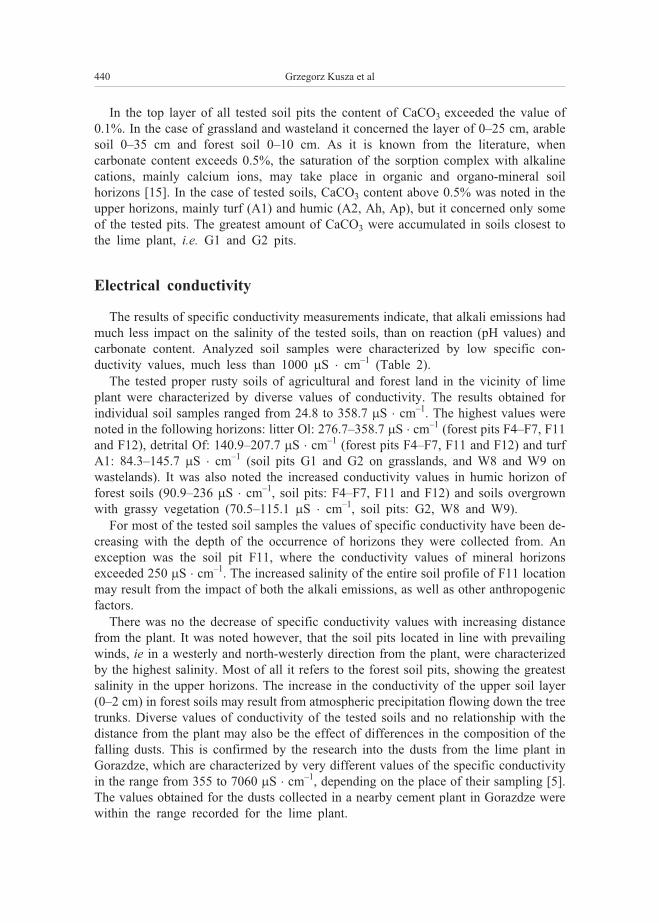
In the top layer of all tested soil pits the content of CaCO3 exceeded the value of
0.1%. In the case of grassland and wasteland it concerned the layer of 0–25 cm, arable
soil 0–35 cm and forest soil 0–10 cm. As it is known from the literature, when
carbonate content exceeds 0.5%, the saturation of the sorption complex with alkaline
cations, mainly calcium ions, may take place in organic and organo-mineral soil
horizons [15]. In the case of tested soils, CaCO3 content above 0.5% was noted in the
upper horizons, mainly turf (A1) and humic (A2, Ah, Ap), but it concerned only some
of the tested pits. The greatest amount of CaCO3 were accumulated in soils closest to
the lime plant, i.e. G1 and G2 pits.
Electrical conductivity
The results of specific conductivity measurements indicate, that alkali emissions had
much less impact on the salinity of the tested soils, than on reaction (pH values) and
carbonate content. Analyzed soil samples were characterized by low specific con-
ductivity values, much less than 1000 �S � cm–1 (Table 2).
The tested proper rusty soils of agricultural and forest land in the vicinity of lime
plant were characterized by diverse values of conductivity. The results obtained for
individual soil samples ranged from 24.8 to 358.7 �S � cm–1. The highest values were
noted in the following horizons: litter Ol: 276.7–358.7 �S � cm–1 (forest pits F4–F7, F11
and F12), detrital Of: 140.9–207.7 �S � cm–1 (forest pits F4–F7, F11 and F12) and turf
A1: 84.3–145.7 �S � cm–1 (soil pits G1 and G2 on grasslands, and W8 and W9 on
wastelands). It was also noted the increased conductivity values in humic horizon of
forest soils (90.9–236 �S � cm–1, soil pits: F4–F7, F11 and F12) and soils overgrown
with grassy vegetation (70.5–115.1 �S � cm–1, soil pits: G2, W8 and W9).
For most of the tested soil samples the values of specific conductivity have been de-
creasing with the depth of the occurrence of horizons they were collected from. An
exception was the soil pit F11, where the conductivity values of mineral horizons
exceeded 250 �S � cm–1. The increased salinity of the entire soil profile of F11 location
may result from the impact of both the alkali emissions, as well as other anthropogenic
factors.
There was no the decrease of specific conductivity values with increasing distance
from the plant. It was noted however, that the soil pits located in line with prevailing
winds, ie in a westerly and north-westerly direction from the plant, were characterized
by the highest salinity. Most of all it refers to the forest soil pits, showing the greatest
salinity in the upper horizons. The increase in the conductivity of the upper soil layer
(0–2 cm) in forest soils may result from atmospheric precipitation flowing down the tree
trunks. Diverse values of conductivity of the tested soils and no relationship with the
distance from the plant may also be the effect of differences in the composition of the
falling dusts. This is confirmed by the research into the dusts from the lime plant in
Gorazdze, which are characterized by very different values of the specific conductivity
in the range from 355 to 7060 �S � cm–1, depending on the place of their sampling [5].
The values obtained for the dusts collected in a nearby cement plant in Gorazdze were
within the range recorded for the lime plant.
440 Grzegorz Kusza et al

Conclusions
1. Long-term deposition of alkaline dusts caused the chemical transformations of the
tested soils. This concerns particularly reaction (pH), and – to a lesser extent –
carbonate content and salinity.
2. Alkaline dusts were the reason for the change of pH values of the tested soils from
acidic to neutral or alkaline in all transects of the reaserch (W, NW, SW).
3. The increased pH values was observed mainly in the upper soil horizons (detrital,
turf) and humic horizons, as well as – to a lesser extent – in sideric horizon and bedrock,
to a depth of about 50 cm.
4. Lime dusts enriched in calcium carbonate mostly turf and humic horizons of
grassland soils, where up to 3.06% CaCO3 at pH values above 7.41 were found.
5. There was a relationship between pH values and calcium carbonate content in the
genetic horizons of the tested soil pits, ie an increase in pH values is accompanied by an
increase in the content of CaCO3.
6. The tested proper rusty soils have lost their natural properties and were
transformed as a result of the impact of alkaline dusts emitted from the lime plant. Only
the profile structure and particle size distribution were not changed – these soil
characteristics remained typical of proper rusty soils.
References
[1] Kusza G, Strzyszcz Z. Forest reserves of Opole Region – state and technogenic hazards, Zabrze: Works
Studies, IPIΠPAN No 63; 2005.
[2] Magiera T, Strzyszcz Z, Kapièka A, Petrovský E. MAGPROX TEAM EU RTD Project No
EVK2-CT-1999-000 19. Discrimination of lithogenic and anthropogenic influences on topsoil magnetic
susceptibility in Central Europe. Geoderma. 2006;130(3-4):299-311.
DOI: 10.1016/j.geoderma.200.02.002.
[3] Ochoa GPA, Gutierrez AS, Martinez JBC, Vandecasteele C. Cleaner production in a small lime factory
by means of process control. J Clean Prod. 2010;18(12):1171-1176.
DOI: 10.1016/j.jclepro.2010.03.019.
[4] Gutiérrez AS, Van Caneghem J, Martínez JBC, Vandecasteele C. Evaluation of the environmental
performance of lime production in Cuba, J Clean Prod. 2012;31:126-136.
DOI: 10.1016/j.jclepro.2012.02.035.
[5] Go³uchowska B, Strzyszcz Z, Kusza G. Magnetic susceptibility and heavy metal content in dust from the
lime plant and the cement plant in Opole Voivodeship. Arch Environ Prot. 2012;38(2):77-80.
DOI: 10.2478/v10265-012-0019-3.
[6] Batjes NH. Overview of procedures and standards in use at ISRIC WDC-Soils. Report 2016/02,
Wageningen: ISRIC – World Soil Information; 2016. DOI: 10.17027/isric-wdcsoils.20160004.
[7] Van Reeuwijk LP (ed). Procedures for soil analysis, Sixth edition 2002, Technical Paper 9, International
Soil Reference and Information Centre ISRIC Food and Agriculture Organization of the United Nations,
pp 120. DOI: 10.17027/isric-wdcsoils.20160005.
[8] Polish Soil Classification. Soil Sci Ann. 2011;62(3):1-142.
[9] IUSS Working Group WRB. 2015. World Reference Base for Soil Resources 2014, update 2015.
International soil classification system for naming soils and creating legends for soil maps. World Soil
Resources Reports No 106. FAO, Rome; pp 203.
[10] Chesworth W (ed). Encyclopedia of Soil Science. University of Guelph Canada. Canada: Springer; 2008.
DOI: 10.1007/978-1-4020-3995-9.
[11] Mocek A (ed). Gleboznawstwo [Soil Science]. Warszawa: PWN; 2015.
[12] Sposito G. The Chemistry of Soils. Second Edition. Oxford: Oxford University Press; 2008.
Changes in Physicochemical Properties of Soils in the Area... 441

[13] Klose S, Makeschin F. Effects of past fly ash deposition on the forest floor humus chemistry of pine
stands in Northeastern Germany. Forest Ecol Manage. 2003;183(1-3):113-126.
DOI: 10.1016/S0378-1127(03)00099-9.
[14] Fujii K, Hayakawa C, Panitkasate T, Maskhao I, Funakawa S, Kosaki T, et al. Acidification and
buffering mechanisms of tropical sandy soil in northeast Thailand. Soil Till Res. 2017;165:80-87.
DOI: 10.1016/j.still.2016.07.008.
[15] Œwiercz A. Chemical transformations in to podzolic soils induced by alkaline and acidic emissions in the
Œwiêtokrzyski region of Poland. Pol J Environ Stud. 2008;17(1):129-138.
http://www.pjoes.com/pdf/17.1/129-138.pdf.
ZMIANY W£AŒCIWOŒCI FIZYKOCHEMICZNYCH GLEB
W REJONIE ODDZIA£YWANIA PRZEMYS£U WAPIENNICZEGO
1 Samodzielna Katedra Ochrony Powierzchni Ziemi, Uniwersytet Opolski2 Wydzia³ Infrastruktury i Œrodowiska, Politechnika Czêstochowska
Abstrakt: Przemys³ wapienniczy i cementowy nale¿y do najlepiej rozwiniêtych ga³êzi przemys³u w wojewó-
dztwie opolskim. Zak³ady zlokalizowane s¹ we wschodniej i œrodkowej czêœci regionu, w s¹siedztwie miast:
Opole, Krapkowice i Strzelce Opolskie, co wynika z wystêpowania na tym terenie z³ó¿ surowców wapien-
nych (wapieni i margli). Wp³yw przemys³u wapienniczego i cementowego na œrodowisko przyrodnicze,
szczególnie gleby, by³ przedmiotem badañ wielu autorów, ale prace te nie dotycz¹ województwa opolskiego,
które od stuleci jest jednym z g³ównych oœrodków produkcji wapna i cementu w Polsce. W artykule podjêto
próbê ukazania zmian w³aœciwoœci fizykochemicznych gleb znajduj¹cych siê pod wieloletnim wp³ywem
emisji py³ów alkalicznych pochodz¹cych z zak³adu wapienniczego w Góra¿d¿ach. Badania prowadzono w la-
tach 2010–2013. Zakres badañ obejmowa³ prace terenowe w rejonie zak³adu, gdzie za³o¿ono 12 reprezenta-
tywnych odkrywek glebowych, z których pobrano próbki do analiz laboratoryjnych. Dla ka¿dej z próbek
glebowych oznaczono nastêpuj¹ce parametry fizykochemiczne: sk³ad granulometryczny, odczyn (pH), prze-
wodnictwo w³aœciwe oraz zawartoœæ wêglanu wapnia. Badania wykaza³y wzrost odczynu badanych gleb pia-
szczystych bêd¹cy efektem depozycji py³ów alkalicznych, co dotyczy³o przede wszystkim odkrywek zlokali-
zowanych na stanowiskach leœnych, które charakteryzowa³y siê wzrostem wartoœci pH o 3–4 jednostki.
W przypadku ³¹k, gleb uprawnych oraz nieu¿ytków wartoœci pH wzros³y o 1–2 jednostki. Ponadto wykazano,
¿e opadaj¹ce py³y alkaliczne wzbogaci³y badane gleby w wêglan wapnia. Dotyczy³o to w najwiêkszym stop-
niu odkrywek glebowych zlokalizowanych najbli¿ej zak³adu wapienniczego, w których zawartoœæ CaCO3
przekracza³a 1%. Wyniki pomiarów przewodnictwa w³aœciwego wskazuj¹ na niski stopnieñ zasolenia bada-
nych próbek glebowych.
S³owa kluczowe: py³y wapiennicze, gleby rdzawe w³aœciwe, pH, przewodnictwo w³aœciwe, zawartoœæ
wêglanu wapnia
442 Grzegorz Kusza et al

Monika SPOREK1* and Tomasz CIESIELCZUK2
BIOMASS OF SPRING BARLEY (Hordeum vulgare L.)
IN RELATION TO FERTILISING
BIOMASA JÊCZMIENIA JAREGO (Hordeum vulgare L.)
JAKO FUNKCJA NAWO¯ENIA
Abstract: The study was aimed to determine the effect of the fertilizer dose on growth of barley. In the
experiment we used calcium sulphate, which is a waste during gas desulphurisation in heat and power
stations. We assumed that dihydrate calcium sulphate would react with aluminium and form insoluble AlSO4+.
We weighed the biomass of barley, underground and aboveground parts separately, determined the content of
chlorophyll and the change in soil reaction caused by the applied doses of fertilisers. The vase experiment
with barley of the brewery variety Propino was conducted in a setting of sub-blocks with fertilizing as the one
changing factor. One experimental block included 5 variants in 5 repetitions. During growth period we
conducted detailed observations of growth and development of barley. Calcium sulphate has positive effect on
the growth of biomass and chlorophyll content in leaves of barley. Application of a double dose of calcium
sulphate did not bring measurable increase in the growth of biomass and the height of barley stems.
Keywords: biomass, mineral fertilization, grain yield, Hordeum vulgare
Cereals are strategic products in national and international economy, because of their
multipurpose utility. Besides consumption by man, cereals are also widely use as a feed
for animals. Barley grain is used specifically for production of malt, which is used in
fermentation, bakery and pharmaceutical trade. The largest amounts of barley are used
in brewing industry.
Mineral fertilisation is one of the most important factors that affect the size of crop.
Fertilizing is efficient at maximum level only if other factors that determine its activity
are optimally adjusted by agrochemical practices. Many studies showed the influence of
fertilizing with nitrogen on crops of cereals, including spring barley [1–4]. Nitrogen not
DOI: 10.2428/ecea.2016.23(4)34 ECOL CHEM ENG A. 2016;23(4):443-452
1 Ecology and Nature Protection Unit, Independent Chair of Biotechnology and Molecular Biology,
University of Opole, ul. kard. B. Kominka 6A, 45–035 Opole, Poland, phone: +48 77 401 60 60, email:
2 Faculty of Natural Sciences and Technology, University of Opole, ul. Oleska 48, 45–052 Opole, Poland,
email: [email protected]
* Corresponding author: [email protected]
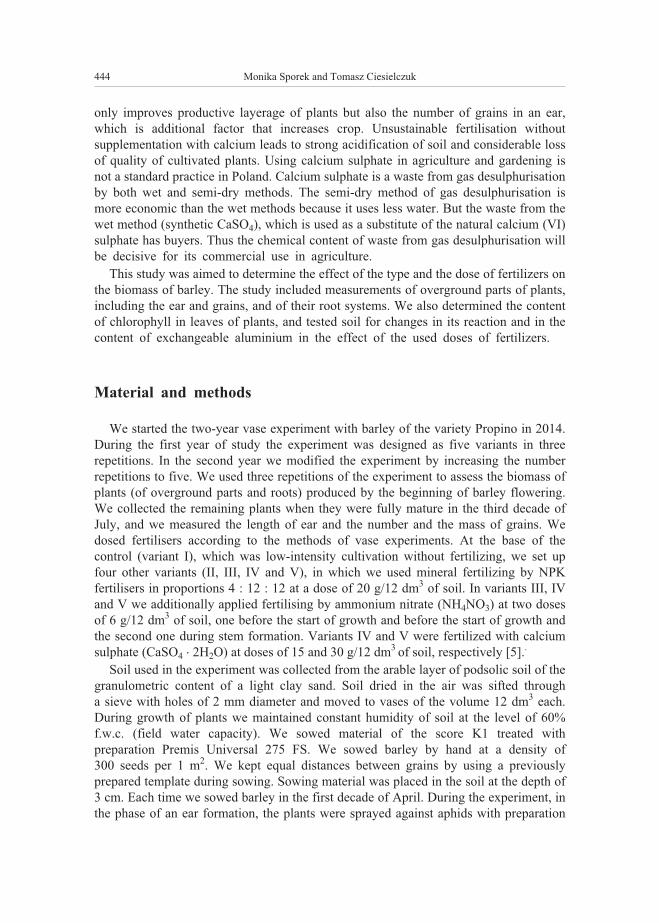
only improves productive layerage of plants but also the number of grains in an ear,
which is additional factor that increases crop. Unsustainable fertilisation without
supplementation with calcium leads to strong acidification of soil and considerable loss
of quality of cultivated plants. Using calcium sulphate in agriculture and gardening is
not a standard practice in Poland. Calcium sulphate is a waste from gas desulphurisation
by both wet and semi-dry methods. The semi-dry method of gas desulphurisation is
more economic than the wet methods because it uses less water. But the waste from the
wet method (synthetic CaSO4), which is used as a substitute of the natural calcium (VI)
sulphate has buyers. Thus the chemical content of waste from gas desulphurisation will
be decisive for its commercial use in agriculture.
This study was aimed to determine the effect of the type and the dose of fertilizers on
the biomass of barley. The study included measurements of overground parts of plants,
including the ear and grains, and of their root systems. We also determined the content
of chlorophyll in leaves of plants, and tested soil for changes in its reaction and in the
content of exchangeable aluminium in the effect of the used doses of fertilizers.
Material and methods
We started the two-year vase experiment with barley of the variety Propino in 2014.
During the first year of study the experiment was designed as five variants in three
repetitions. In the second year we modified the experiment by increasing the number
repetitions to five. We used three repetitions of the experiment to assess the biomass of
plants (of overground parts and roots) produced by the beginning of barley flowering.
We collected the remaining plants when they were fully mature in the third decade of
July, and we measured the length of ear and the number and the mass of grains. We
dosed fertilisers according to the methods of vase experiments. At the base of the
control (variant I), which was low-intensity cultivation without fertilizing, we set up
four other variants (II, III, IV and V), in which we used mineral fertilizing by NPK
fertilisers in proportions 4 : 12 : 12 at a dose of 20 g/12 dm3 of soil. In variants III, IV
and V we additionally applied fertilising by ammonium nitrate (NH4NO3) at two doses
of 6 g/12 dm3 of soil, one before the start of growth and before the start of growth and
the second one during stem formation. Variants IV and V were fertilized with calcium
sulphate (CaSO4 � 2H2O) at doses of 15 and 30 g/12 dm3 of soil, respectively [5]..
Soil used in the experiment was collected from the arable layer of podsolic soil of the
granulometric content of a light clay sand. Soil dried in the air was sifted through
a sieve with holes of 2 mm diameter and moved to vases of the volume 12 dm3 each.
During growth of plants we maintained constant humidity of soil at the level of 60%
f.w.c. (field water capacity). We sowed material of the score K1 treated with
preparation Premis Universal 275 FS. We sowed barley by hand at a density of
300 seeds per 1 m2. We kept equal distances between grains by using a previously
prepared template during sowing. Sowing material was placed in the soil at the depth of
3 cm. Each time we sowed barley in the first decade of April. During the experiment, in
the phase of an ear formation, the plants were sprayed against aphids with preparation
444 Monika Sporek and Tomasz Ciesielczuk

Rapid 060 CS. During growth the relative content of chlorophyll in plants was
measured using chlorophyll meter CCM 200.
Before the plants formed ears, we measured the height, the length of the root
(measurement of the longest root in a bundle) and biomass of the overground and
underground parts of each individual in 15 vases. We used the July harvest of plants
from the remaining 10 vases to estimate the crop of grains. The content of the dry mass
was determined by drying and weighing plant material in 105oC until the mass was
stable. We measured reaction (pH) and the content of exchangeable aluminium in soil
using the method of Sokolow.
Results and discussion
During the period of growth detailed observations of development and growth of
barley while constant humidity of soil was maintained. Density of plants was
determined directly after germination (z0) and after the experiment was finished (z1).
The relative density was between 0.83 and 1.0. (Table 1). Germination was similar in
the control variant and in variant IV, the weakest germination was recorded in the
variant where ammonium nitrate was applied (variant III). The number of individuals
did not change until the end of the experiment.
Table 1
Relative density of individuals
Repetitions
Density of individuals in relation to maximum density
VARIANTS
I II III IV V
z0 z1 z0 z1 z0 z1 z0 z1 z0 z1
1 0.94 0.94 0.94 0.94 0.88 0.88 1.00 1.00 0.94 0.94
2 0.94 0.94 0.88 0.88 0.83 0.83 0.94 0.94 1.00 1.00
3 1.00 1.00 0.94 0.94 0.88 0.88 0.94 0.94 0.88 0.88
4 1.00 1.00 0.88 0.88 0.94 0.94 1.00 1.00 1.00 1.00
5 1.00 1.00 0.94 0.94 0.94 0.94 1.00 1.00 0.88 0.88
Soil used in the experiment had acidic reaction (pHKCl = 4.6). Spring barley belongs
to plants that are sensitive to acidic reaction and associated high concentration of
exchangeable aluminium [6]. We used calcium sulphate for fertilizing (variant IV and
V), which did not change pH of soil, despite it contains calcium. Thus, using calcium
sulphate for de-acidification of acidic soils will not bring the expected effect. However,
calcium sulphate would be good fertilizer in soils of alkaline reaction but with a deficit
of calcium. Application of the calcium sulphate can give good effects where soil
contains calcium in a form temporarily inaccessible for plants [5]. Low content of
aluminium at the level of 0.6 mg/100 g of soil, was obtained by applying fertilizing by
Biomass of Spring Barley (Hordeum vulgare L.) in Relation to Fertilising 445

NPK only (variant II) and in the control variant (0.5 mg/100 g of soil). Other authors [6]
obtained similar results for the control sample, with the content at the level of 0.4
mmol(+) � kg–1. The largest content of aluminium was found in the combination of
fertilizing with NPK and ammonium nitrate (variant III), where pH was also the lowest
among all analysed samples (pHKCl = 3.9). The content of aluminium in this variant of
fertilizing varied from 1.6 to 2.0 mg/100 g, which was caused by acidification effect of
ammonium nitrate [7], which increases amount of exchangeable aluminium [8].
Production of biomass in plants is a function of their assimilation surface, efficiency
of photosynthesis from a unit of this surface, and the duration of photosynthesis. The
amount of biological crop of different plant species is varied and depends on their
productive capacity expressed as the amount of produced dry mass, which is associated
with the size of their organs. According to Pecio [9], the larger the assimilation surface
grows before barley flowers the greater is the chance it produces shapely grain. We used
some simplification in our two years of studies using vases. We did not measure the
assimilation surface. Instead we assessed the biomass of plants before they started
flowering, assuming that assimilation surface that affects the crop increases pro-
portionally to the mass of individuals. We are aware that individual plants of the same
biomass may differ in assimilation surface.
Statistical analyses showed large variation of individuals in biomass, height, length
of stems and in the mass and number of grains. Biometric analysis of the root length of
the spring barley showed that the longest roots occurred in these vases where we
applied calcium sulphate (variants IV and V). In both these variants the length of the
root was about 24 cm (Fig. 1). Thus the double dose of calcium sulphate in variant V
did not cause increase of the root length proportional to fertilizing. The weakest root
systems occurred in variant III, where NPK and ammonium nitrate were applied. In this
variant the mean length of a root was 16 cm, the longest root had 27 cm and the shortest
had 4 cm. The coefficient of variation for the length of roots was between 27%
(variant I) and 54% (variant V) (Table 2).
446 Monika Sporek and Tomasz Ciesielczuk
Fig. 1. Root length of spring barley depending on the dose applied fertilization variants
0
10
20
30
40
50
60
70
I II III IV V
Ro
ot
len
gth
[cm
]
Variants

Biomass of Spring Barley (Hordeum vulgare L.) in Relation to Fertilising 447
Tab
le2
Bio
met
ric
par
amet
ers
of
spri
ng
bar
ley
of
the
var
iety
Pro
pin
oin
rela
tion
toap
pli
eddose
sof
min
eral
fert
iliz
ers,
div
ided
into
over
gro
und
and
under
gro
und
par
ts(h
arves
ted
bef
ore
flow
erin
g)
Mea
sure
s
of
centr
al
tenden
cy
and
dis
per
sion
Bio
met
ric
par
amet
ers
of
spri
ng
bar
ely
inth
evar
iants
of
the
exper
imen
t
III
III
IVV
Over
gro
und
par
tsR
oot
Over
gro
und
par
tsR
oot
Over
gro
und
par
tsR
oot
Over
gro
und
par
tsR
oot
Over
gro
und
par
tsR
oot
[cm
]
Mea
n65.1
18.8
57.2
23.4
58.6
15.6
61.1
23.9
51.0
23.9
SD
9.9
5.1
18.7
7.7
21.2
7.6
16.9
9.5
16.2
12.5
Min
40.0
8.0
22.0
12.0
12.0
4.0
24.0
6.0
15.0
10.0
Max
83.0
31.0
94.0
46.0
84.0
27.0
90.0
54.0
76.0
66.0
Mo
70.0
20.0
70.0
20.0
73.0
21.0
77.0
25.0
61.0
25.0
Me
67.0
20.0
63.0
22.0
72.0
16.0
64.0
23.0
55.0
21.0
v[%
]15.2
27.3
32.7
32.9
38.8
51.7
28.1
40.4
32.5
53.7
Sym
bols
:I
–co
ntr
ol
wit
hout
fert
iliz
ing;
II–
mult
i-co
mponen
tfe
rtil
izer
NP
K(4
%N
;12%
P2O
5,
12%
K2O
);II
I–
NP
K+
NH
4N
O3;
IV–
NP
K+
NH
4N
O3
+
+C
aSO
4�
2H
2O
–at
adose
of
250
kg/h
a;V
–N
PK
+N
H4N
O3
+C
aSO
4�
2H
2O
–at
adose
of
500
kg/h
a;M
ean
–ar
ithm
etic
mea
n,
SD
–st
andar
ddev
iati
on,
Min
–
min
imum
val
ue,
Max
–m
axim
um
val
ue,
Mo
–m
odal
val
ue,
Me
–m
edia
n,
v–
coef
fici
ent
of
var
iati
on
[%].

Similar relationships occurred in the height of individuals. Application of calcium
sulphate at a dose of 250 kg/ha increased the height of plants 16% in relation to the
applied dose of this fertiliser in the variant V (500 kg/ha). Thus, using high dose of
calcium sulphate did not improve the height of barley. A half of studied individuals of
the variant IV reached the height over 64 cm (Table 2, Fig. 2). According to the
producer, the mean height of the barley of the variety Propino is 65 cm. Variation of the
overground parts of plants was smaller than that of the root system, and was between
15% (variant I) and 39% (variant III).
Fertilising had positive effect on the biomass of the underground parts and of the
roots of spring barley. Individuals in vases that were fertilised with calcium sulphate at
a dose of 250 kg/ha reached the largest mean biomass. Dry mass in this variant
increased on average for 56% in relation to the control variant. A half of examined
individuals had greater mass than 2.430 g [dry mass] (Table 4, Fig. 3). Application of
the double dose of calcium sulphate caused 44% increase of biomass in relation to the
control. Introducing NPK fertilizer only into the soil caused 27% increase of the
biomass (variant II). Fertilizing with combination of NPK and ammonium nitrate
(variant III) caused decrease in the mass of roots. General biomass of spring barley
increased for 34% in relation to the control (Table 4), but the root system with this
combination of fertilizers was the smallest of all four variants of fertilizing (Table 3).
This situation may be associated with the content of exchangeable aluminium.
According to Marschner [10] the toxic effect of aluminium affects mostly roots of plants.
Badora [11] also stated that the first symptom of aluminium stress in spring barley is
a significant decrease of the mass of the root system. According to this author the first
symptoms of shortage of phosphorus, magnesium and calcium occur with about 70 mg
of exchangeable Al per one kg of soil, which gives 7 mg/100 g. In our laboratory experi-
ment we observed decrease of the root system already with 2 mg Al/100 g of soil [5].
448 Monika Sporek and Tomasz Ciesielczuk
Fig. 2. The height of spring barley depending on the dose of fertilization
I II III IV V
Variants
100
80
60
40
20
0
Heig
ht [c
m]
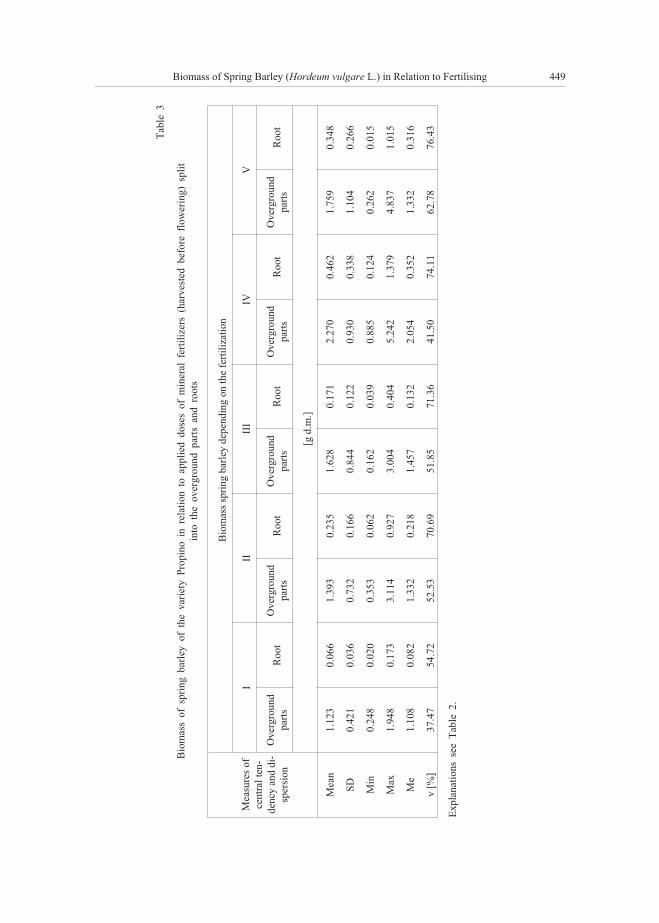
Biomass of Spring Barley (Hordeum vulgare L.) in Relation to Fertilising 449
Tab
le3
Bio
mas
sof
spri
ng
bar
ley
of
the
var
iety
Pro
pin
oin
rela
tion
toap
pli
eddose
sof
min
eral
fert
iliz
ers
(har
ves
ted
bef
ore
flow
erin
g)
spli
t
into
the
over
gro
und
par
tsan
dro
ots
Mea
sure
sof
centr
alte
n-
den
cyan
ddi-
sper
sion
Bio
mas
ssp
ring
bar
ley
dep
endin
gon
the
fert
iliz
atio
n
III
III
IVV
Over
gro
und
par
tsR
oot
Over
gro
und
par
tsR
oot
Over
gro
und
par
tsR
oot
Over
gro
und
par
tsR
oot
Over
gro
und
par
tsR
oot
[gd.m
.]
Mea
n1.1
23
0.0
66
1.3
93
0.2
35
1.6
28
0.1
71
2.2
70
0.4
62
1.7
59
0.3
48
SD
0.4
21
0.0
36
0.7
32
0.1
66
0.8
44
0.1
22
0.9
30
0.3
38
1.1
04
0.2
66
Min
0.2
48
0.0
20
0.3
53
0.0
62
0.1
62
0.0
39
0.8
85
0.1
24
0.2
62
0.0
15
Max
1.9
48
0.1
73
3.1
14
0.9
27
3.0
04
0.4
04
5.2
42
1.3
79
4.8
37
1.0
15
Me
1.1
08
0.0
82
1.3
32
0.2
18
1.4
57
0.1
32
2.0
54
0.3
52
1.3
32
0.3
16
v[%
]37.4
754.7
252.5
370.6
951.8
571.3
641.5
074.1
162.7
876.4
3
Expla
nat
ions
see
Tab
le2.

Table 4
Biomass of spring barley of the variety Propino in relation to applied doses
of mineral fertilizers (harvested before flowering)
Measures
of central tendency
and dispersion
Biomass of spring barley [g d.m.]
I II III IV V
Mean 1.189 1.628 1.798 2.732 2.107
SD 0.430 0.854 0.881 1.160 1.293
Min 0.315 0.511 0.206 1.108 0.298
Max 2.014 3.704 3.408 6.621 5.495
Me 1.197 1.595 1.775 2.430 1.626
v [%] 36.11 52.45 48.98 43.02 61.39
Explanations see Table 2.
The differences in chlorophyll content, depending on the applied fertilizer, were
determined by Chlorophyll Content Index (CCI) – proportional to chlorophyll content in
the sample. The lowest relative content of chlorophyll was observed in the control
variant. Fertilizing with NPK (variant II), as well as adding ammonium nitrate (variant
III) caused small increase in the content of chlorophyll in leaves of barley. But treating
the soil with calcium sulphate doubled the content of chlorophyll in relation to the
control variant.
In our experiment we determined the effect of fertilizing on features of crop
structure. Statistical analysis showed that all factors in the experiment (fertilizing with
NPK, ammonium nitrate and calcium sulphate) had significant effect on layerage
(Table 4) and on the increase of crop (Table 5). The largest improvement of crop was
obtained by fertilizing with a combination of NPK, ammonium nitrate and calcium
sulphate (variant IV). Crop of grain from this variant was 5200 kg/ha, which was 36%
450 Monika Sporek and Tomasz Ciesielczuk
Fig. 3. The average biomass of a single individual (Hordeum vulgare L.) in relation to the fertilizer dose
I II III IV V
Variants
7.0
6.0
5.0
4.0
3.0
2.0
1.0
0.0
Bio
mass [g]

Table 5
The structure of yield depend on fertilization – mean values
Variants
experience
Length of ear
[cm]
Number of productive
ears per m2
Number of grains
per ear
Weight of grains
per ear [g]
I 8.2 377 17.5 0.82
II 8.6 476 19.0 0.88
III 8.5 400 18.8 0.85
IV 9.0 528 19.8 0.97
V 8.8 489 18.9 0.90
increase of harvest of grain in relation to the control (Table 5). It is known from
literature [3] that nitrogen improves layering of plants and increases the number of
grains in an ear, which is an additional important factor that improves crop. In all
combinations of fertilizing the number of grains in a head was greater than in a control
(Table 4). However, too high doses of fertilizing with nitrogen may cause decrease in
the number of grains in an ear, because greater productive layering requires the plant to
feed more grains. The accuracy of grain deteriorates at the same time, which means that
the proportion of shapely grains in crop decreases. With a similar length of the head
(variant II and III) we obtained different number and mass of grain in an ear (Table 5).
Moreover, variant III caused production of low number of ears in comparison to the
remaining variants of fertilizing. The recorded biomass of the overground part of barley
in the variant III (mean = 1.628 g of dry mass) was greater than in the control variant
and the variant with NPK fertilizing (Table 3). This indicates sufficient layering of the
plants. However, a part of plants did not enter the generative phase, which could be
caused by the increased content of aluminium in soil [5, 11].
Conclusions
Based on the study the we drew the following conclusions:
1. Combination of fertilising with NPK, ammonium nitrate and calcium sulphate had
the greatest effect on the crop of spring barley.
2. Calcium sulphate did not change pH of soil, but had a positive effect on the bio-
mass of the overground parts and roots and crop of grain.
3. Application of double dose of calcium sulphate did not cause measurable improve-
ment in layering of plants and thus in crop of grain from barley.
4. In conditions of low content of exchangeable aluminium in soil, larger biomass
produced by barley plants before they flower had a positive effect on production of
shapely grain.
References
[1] Machado S, Petrie S, Rhinhart K, Qu A. Long-term continuous cropping in the Pacific Northwest:
Tillage and fertilizer effects on winter wheat, spring wheat, and spring barley production. Soil Till Res.
2007;94:473-481. DOI: 10,1016/j.still.2006.09.007.
Biomass of Spring Barley (Hordeum vulgare L.) in Relation to Fertilising 451
[2] Dubis B, H³asko-Nasalska A, Hulanicki P. Yield and malting quality of spring barley cultivar prestige
depending on nitrogen fertilization. Acta Sci Pol Agricultura. 2012;11(3):45-56.
http://www.agricultura.acta.utp.edu.pl/uploads/pliki/Artykul%204.pdf.
[3] Valkama E, Salo T, Esala M, Turtola E. Nitrogen balances and yields of spring cereals as affected by
nitrogen fertilization in northern conditions: A meta-analysis. Agr Ecosyst Environ. 2013;164:1-13.
http://dx.doi.org/10.1016/j.agee.2012.09.010.
[4] Muhammad Z, Ahmad G, Iqbal B, Subhanullah, Khan RM, Bari A, et al. Effect of fertilizer dose on the
performance of spring cereals. Pure Appl Biol. 2016;5(3):458-463.
http://dx.doi.org/10.19045/bspab.2016.50059.
[5] Sporek M, Jurasz A, Ciesielczuk T. Effect of fertilisation on the changes of soil pH and exchangeable
aluminium content in soil. Proc ECOpole. 2015;9(2):499-504. DOI: 10.2429/proc.2015.9(2)058.
[6] Rutkowska B, Szulc W, Twardowska A. Wp³yw niezrównowa¿onego nawo¿enia na zmiany odczynu
oraz zawartoœci glinu wymiennego w glebie lekkiej. [Effect of unbalanced fertilization on the changes of
soil pH and exchangeable aluminium content in sandy soil]. Zesz Probl Post Nauk Roln.
2010;556:923-928. http://omega.sggw.waw.pl/sk/media/ PUBLIKACJE_3/rutk_szulc_tward_2010.pdf.
[7] Malhi SS, Harpiak JT, Nyborg M, Wiœniowska-Kielian B. Effect of long-term application of different
nitrogen forms on soil reaction and some microelements contents in soil land bromegrass hay. Zesz Probl
Post Nauk Roln. 1999;465:547-558.
[8] Filipek T, Skowroñska M. Aktualne dominuj¹ce przyczyny oraz skutki zakwaszenia gleb u¿ytkowanych
rolniczo w Polsce. [Current dominant causes and effects of acidification of soils under agricultural use in
Poland]. Acta Agrophys. 2013;20(2):283-294.
http://produkcja.ipan.lublin.pl/uploads/publishing/files/Filipek-283-294.pdf.
[9] Pecio A. Œrodowiskowe i agrotechniczne uwarunkowania wielkoœci i jakoœci plonu ziarna jêczmienia
jarego browarnego. [Environmental and agronomic conditions of the size and quality of the crop of
spring barley] Fragm Agronom. 2002;19(4):6-111.
http://www.up.poznan.pl/pta/pdf/Fragm.%20Agron.%20vol.%2019%20(2002)/19(4)%202002.pdf.
[10] Marschner H. Mechanism of Manganese Acquisition by Roots from Soils. In: Graham RD, Hannam RJ,
Uren EC, editors. Manganese in Soils and Plants. Dordrecht: Kluver Academic Publishers;
1988;191-204.
[11] Badora A, Koz³owska-Strawska J. Wybrane wskaŸniki roœlin uprawnych. [Some quality indicators of
arable plants]. Ochr Œrod Zasob Natur. 2011;48:439-452.
http://www.ios.edu.pl/pol/pliki/nr48/nr_48_441.pdf.
BIOMASA JÊCZMIENIA JAREGO (Hordeum vulgare L.)
JAKO FUNKCJA NAWO¯ENIA
1 Samodzielna Katedra Biotechnologii i Biologii Molekularnej, Uniwersytet Opolski2 Samodzielna Katedra Ochrony Powierzchni Ziemi, Uniwersytet Opolski
Abstrakt: Dwuletnie doœwiadczenie wazonowe z jêczmieniem jarym odmiany browarniczej Propino rozpo-
czêto w 2014 roku. Celem pracy by³a ocena wp³ywu rodzaju i dawki nawozu na biomasê jêczmienia. W na-
wo¿eniu wykorzystano m.in. siarczan wapnia bêd¹cy odpadem odsiarczania spalin w elektrociep³owniach.
Za³o¿ono hipotetycznie, ¿e dwuwodny siarczan wapnia wejdzie w reakcjê z glinem, tworz¹c nierozpuszczaln¹
formê AlSO4+. Zakres badañ obejmowa³ pomiary biometryczne czêœci nadziemnej wraz z k³osem i ziarniaka-
mi oraz system korzeniowy. Okreœlono zawartoœæ chlorofilu w liœciach roœlin, a tak¿e wykonano badania gle-
bowe w zakresie zmiany odczynu i glinu wymiennego pod wp³ywem zastosowanych dawek nawozów.
Najwiêkszy wp³yw na wielkoœæ plonu jêczmienia jarego mia³o zastosowanie kombinacji nawozowej:
NPK, saletry amonowej i siarczanu wapnia. Siarczan wapnia nie wp³ywa na zmianê pH gleby, ale ma korzyst-
ny wp³yw na biomasê czêœci nadziemnej i systemu korzeniowego oraz plon ziarna. Zastosowanie podwójnej
dawki siarczanu wapnia nie przynios³o wymiernych korzyœci w plonie ziarna jêczmienia.
S³owa kluczowe: biomasa, nawo¿enie, plon ziarna, jêczmieñ jary
452 Monika Sporek and Tomasz Ciesielczuk
Katarzyna GRATA1
SENSITIVITY OF Fusarium solani
ISOLATED FROM ASPARAGUS ON ESSENTIAL OILS
WRA¯LIWOŒÆ Fusarium solani
WYIZOLOWANEGO ZE SZPARAGA NA OLEJKI ETERYCZNE
Abstract: The purpose of this study was to evaluate the antifungal properties of sage oil, clove oil and basil
oil against Fusarium solani isolated from white asparagus spears (Asparagus officinalis L.). A dual culture
plate method was used for the assessment of the inhibitory effects of essential oils and volatile components on
mycelium, inoculated into a PDA medium. The culturing process was conducted for 9 days at a temperature
of 26oC and the fungal linear growth was measured every 1–3 days. The conidial germination of the fungus in
the presence of oils was evaluated by microscope method. The results show differences in the fungistatic
activity of oils, dependent on the type and dose of the oil. Generally the oils had a higher impact against the
fungal spores than on mycelium growth of F. solani, however the type of oil and dose determined different
amounts. The conidial germination was most inhibited by the basil oil (98.9% maximum inhibition), followed
by the clove and sage oils at a concentration of 4% (respectively 89.9% and 85.4% maximum inhibition). In
contrast, the oils had much less of an impact on the linear mycelial growth of F. solani. Use of the highest
dose of clove oil reduced the linear growth of mycelium by 29.9%, sage oil by 14.8% and basil oil by 4%.
Furthermore, gas metabolites limited the growth of F. solani. The degree of inhibition of mycelium amounted
to 17.1% for clove oil, 15.5% for sage oil and 9.3% for basil oil used in the maximum concentration 4.0%.
Based on these results, clove oil was the greatest inhibitor of mycelial growth and sporulation of F. solani.
Keywords: Fusarium solani, asparagus, essential oils, antifungal activity
Introduction
Fungi of the genus Fusarium are geographically widespread and occur as saprophytic
organisms in the soil. They have the ability to produce highly toxic secondary
metabolites (fumonisins, moniliformins, beauvericin) and therefore are classified as
opportunistic organisms for plants and people [1–4].
Several pathogenic Fusarium species cause disease in asparagus plants (Asparagusofficinalis L.), such as Fusarium stem and crown rot (FCRPR). These diseases can
occur in asparagus seedlings, however they are most typically observed in mature plants
DOI: 10.2428/ecea.2016.23(4)32 ECOL CHEM ENG A. 2016;23(4):453-464
1 Independent Chair of Biotechnology and Molecular Biology, University of Opole, ul. kard. B. Kominka
6, 45–035 Opole, Poland, phone: +48 77 401 60 56, email: [email protected]

[1, 3, 5–7]. Both white and green asparagus are easily infected by the different
Fusarium species. Researchers have shown that the presence of Fusarium ranges based
on region, with some regions only reporting occasional presence and others a more
dominant presence. Infection of asparagus plants depends particularly on environmental
conditions, agronomic practices and asparagus cultivar susceptibility [2, 5, 8–10]. This
concerns mainly F. proliferatum, F. oxysporum, F. culmorum, F. solani and F. redolens[1, 3, 5, 11–15]. There have been many different approaches used towards minimizing
the damage caused by Fusarium crown and root rot. These have included incorporating
organic matter into the soil, improving soil fertility, applying arbuscular mycorrhizae
(Glomus intraradices), chemical control and biological control (Trichoderma sp.) [14,
16–19].
In recent years there has been increased interest in the possibility of using natural
products such as plant extracts or essential oils as biological agents of plant protection
and plant disease control. The application of essential oils in particular has been
evaluated as a potentially effective and safe alternative to chemicals. Plants have
a limitless ability to synthesize secondary metabolites (eg phenols, flavones, flavonoids,
alkaloids, tannins) which operate as the plant’s defence mechanism against pathogenic
microorganisms. Based on this process, certain essential oils in liquid phase and/or
vapour phase can be used to delay or inhibit the growth of pathogenic and/or toxin
producing fungi [20–27]. Many essential oils have been demonstrated to have biological
activity on many fungal plant microorganisms, including A. flavus, A. niger, Mucor sp.,
Rhizoctonia sp. Fusarium sp. Some studies suggest that within an experimental system
the extent of inhibition of mycelial growth and spore germination depends on the
concentration of essential oils [20, 21, 28, 29].
The aim of this study was to investigate the antifungal activity of three essential oils
(sage oil, basil oil and clovebud oil) against the mycelial growth and spore germination
of Fusarium solani.
Materials and methods
The research material was the strain of Fusarium solani isolated from the spears of
white asparagus plants (Asparagus officinalis L.) exhibiting signs of dry rot. The
essential oils (EOs) used were sage oil (Salvia sclarea L.) and basil oil (Ocimumbasilicum L.), both from plants of the Lamiaceae family, and clovebud oil (Eugeniacaryophyllus) from a tree of the Myrtaceae family [30]. The antimicrobial effect of the
tested oils (in both liquid and vapour phase) was observed by employing various
antifungal assays. The sensitivity of spores and mycelium of F. solani to EOs was
examined using the medium poisoning method (method I), disc volatilization method
(method II) and cavity slide technique (method III) with a few modifications [23, 27,
29, 30–33].
I Poisoning method. The experiments were conducted on a Potato dextrose agar
(PDA) medium. Fungal mycelial discs (8 mm in diameter) were cut with a sterile cork
borer from the periphery of 7 day-old pure culture of F. solani and were placed at the
centre of the medium containing the essential oils at varying concentrations (0.5%,
454 Katarzyna Grata

1.0%, 2.0%, 4.0%). Initially, in order to enhance the oil solubility, the oils were
dissolved with 0.5% dimethyl sulfoxide (DMSO). In the controls tests, EOs were
replaced with 0.5% DMSO solution and inoculated following the same procedure.
II Volatilization method. In order to investigate the effects of the volatile fraction of
the essential oils, petri dishes containing the PDA medium were inoculated with the
fungal mycelial discs (8 mm in diameter). In contrast, the suspension of each EO was
not added into the medium but rather dripped onto the sterilized filter disc (6 cm in
diameter) positioned on the covers of the Petri dishes. A blank sterilized filter disc with
no oil treatment was used as the control. After applying the EOs, the filter discs were
then immediately inverted on top of the lid and hermetically sealed with parafilm to
prevent any leakage of essential vapour. All plates (from methods I and II) were
incubated in the dark at 24 � 2oC for 9 days until the mycelium in the control plates
reached the edge of the plates. The radial mycelia growth was observed and measured in
two perpendicular diameters at intervals of 1–2 days. The experiment was performed in
four replicates, where one repeat was represented by one plate containing the growth
medium with one mycelia disc. The antagonistic activity of the EOs was evaluated
using the growth rate index (GRI) and additionally evaluated using the percentage of
mycelial growth inhibition in comparison to the control [33].
III Cavity slide technic. The evaluation of fungistatic activity of the EOs was also
carried out on the basis of spore germination of F. solani. Conidia of F. solani were
harvested from the 7 day-old culture grown in PDA medium using sterile water
containing 0.5% Tween 80. The conidia suspensions were then filtered through sterile
gauze to remove hyphae and adjusted to a concentration of 1.65 � 106 spores/cm3 using
a haemocytometer Thoma. Subsequently aliquots of 30 mm3 of the essential oil
solutions at different concentrations were mixed with 30 mm3 of the spore suspensions
in a cavity slide. Then they were incubated in a moist chamber at 24 � 2oC for 18 hours.
Microscopic observation and enumeration showed varying degrees of spore germination
as well as no germination. The data evaluated were the rate of conidia germination and
the percentage of spore germination inhibition [34].
All experiments were conducted in triplicate and the means were statistically
compared using two-way analysis of variance with a Tukey’s composition test. The
differences between the means were considered significant for values of p � 0.01. The
data are presented as mean values � standard deviation calculated from four de-
terminations.
Results and discussion
The essential oils were individually tested against Fusarium solani. The mycelial
growth and spore germination of F. solani was affected differently by each of the three
essential oils. The inhibition effect depended on the type of oil, the amount of essential
oil, the incubation period and the susceptibility of the spores and mycelia of the fungus.
All amounts of the essential oil significantly restricted the spore germination of
F. solani with the highest inhibition activity detected for 4% concentration. Basil oil
Sensitivity of Fusarium solani Isolated from Asparagus on Essential Oils 455
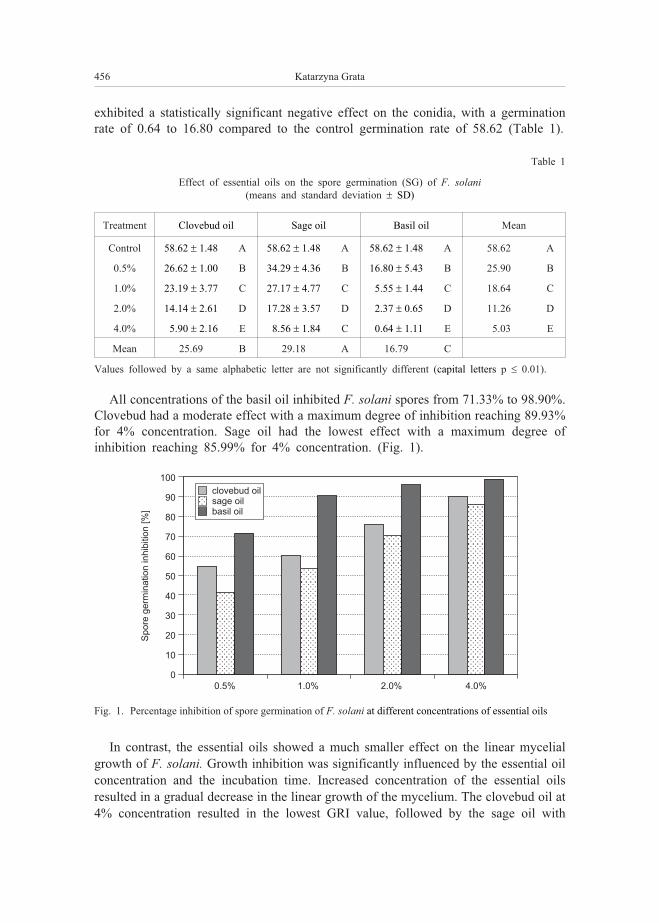
exhibited a statistically significant negative effect on the conidia, with a germination
rate of 0.64 to 16.80 compared to the control germination rate of 58.62 (Table 1).
Table 1
Effect of essential oils on the spore germination (SG) of F. solani(means and standard deviation � SD)
Treatment Clovebud oil Sage oil Basil oil Mean
Control 58.62 � 1.48 A 58.62 � 1.48 A 58.62 � 1.48 A 58.62 A
0.5% 26.62 � 1.00 B 34.29 � 4.36 B 16.80 � 5.43 B 25.90 B
1.0% 23.19 � 3.77 C 27.17 � 4.77 C 5.55 � 1.44 C 18.64 C
2.0% 14.14 � 2.61 D 17.28 � 3.57 D 2.37 � 0.65 D 11.26 D
4.0% 5.90 � 2.16 E 8.56 � 1.84 C 0.64 � 1.11 E 5.03 E
Mean 25.69 B 29.18 A 16.79 C
Values followed by a same alphabetic letter are not significantly different (capital letters p � 0.01).
All concentrations of the basil oil inhibited F. solani spores from 71.33% to 98.90%.
Clovebud had a moderate effect with a maximum degree of inhibition reaching 89.93%
for 4% concentration. Sage oil had the lowest effect with a maximum degree of
inhibition reaching 85.99% for 4% concentration. (Fig. 1).
In contrast, the essential oils showed a much smaller effect on the linear mycelial
growth of F. solani. Growth inhibition was significantly influenced by the essential oil
concentration and the incubation time. Increased concentration of the essential oils
resulted in a gradual decrease in the linear growth of the mycelium. The clovebud oil at
4% concentration resulted in the lowest GRI value, followed by the sage oil with
456 Katarzyna Grata
Sp
ore
ge
rmin
atio
n in
hib
itio
n [
%]
100
90
80
70
60
50
40
30
20
10
0
0.5% 1.0% 2.0% 4.0%
clovebud oilsage oilbasil oil
Fig. 1. Percentage inhibition of spore germination of F. solani at different concentrations of essential oils

a moderate GRI value, and the basil oil with the highest GRI value. At 0.5% EO
concentration, the GRI ranged from 59.76 (clovebud oil) to 63.60 (basil oil), while at
4% EO concentration it ranged from 45.25 (clovebud oil) to 62.79 (basil oil) –
compared to the control GRI of 64.62 (Table 2).
Table 2
Effect of essential oils (liquid phase) on the growth rate index (GRI) of F. solani
Treatment Clovebud oil Sage oil Basil oil Mean
Control 64.62 � 0.71 A 64.62 � 0.71 A 64.62 � 0.71 A 64.62 A
0.5% 59.76 � 0.52 B 62.79 � 0.68 B 63.60 � 0.41 B 62.05 B
1.0% 58.74 � 1.18 C 59.72 � 0.51 C 63.21 � 1.31 C 60.60 C
2.0% 53.22 � 0.61 D 57.73 � 0.58 D 62.24 � 0.38 D 57.73 D
4.0% 45.25 � 0.85 E 55.05 � 1.54 E 62.79 � 0.81 E 54.36 E
Mean 56.32 C 59.98 B 63.29 B
Values followed by a same alphabetic letter are not significantly different (capital letters p � 0.01).
The highest degree of inhibition of mycelium was obtained for clovebud oil
(29.96%), followed by sage oil (14.79%). Basil oil had the least impact on the inhibition
of mycelium at only 4.01% (Table 2, Fig. 2).
Results obtained from the volatilization method indicated that gas metabolites also
significantly limited the growth of tested F. solani. The growth rate index was similar to
that obtained for the oils applied in the liquid phase. The lowest GRI at 4% EO
concentration was found for clovebud oil (52.79), followed by sage oil (53.93) and
finally for basil oil (28.02) (Table 3).
Sensitivity of Fusarium solani Isolated from Asparagus on Essential Oils 457
Gro
wth
ra
te in
de
x in
hib
itio
n [
%]
30
25
20
15
10
5
00.5% 1.0% 2.0% 4.0%
clovebud oilsage oilbasil oil
Fig. 2. Growth inhibition of F. solani by essential oils (liquid phase) at different concentrations

Table 3
Effect of essential oils (vapour phase) on the growth rate index (GRI) of F. solani
Treatment Clovebud oil Sage oil Basil oil Mean
Control 63.69 � 0.62 A 63.69 � 0.62 A 63.69 � 0.62 A 63.69 A
0.5% 58.16 � 0.31 B 58.52 � 0.96 B 62.23 � 0.47 B 59.63 B
1.0% 55.15 � 0.75 C 54.78 � 0.65 C 60.08 � 0.55 C 56.67 C
2.0% 53.74 � 0.24 D 54.46 � 0.98 D 58.88 � 0.85 D 55.69 Dd
4.0% 52.79 � 0.24 E 53.93 � 0.75 E 58.02 � 0.22 E 54.91 Ee
Mean 56.71 B 57.08 B 60.58A A
Values followed by a same alphabetic letter are not significantly different (small letters p � 0.05); capital
letters p � 0.01).
It was observed that the degree of inhibition of mycelium amounted to 17.1% for
clovebud oil, 15.5% for sage oil and 9.3% for basil oil at the maximum concentration
of each oil. However, the EOs in at 4% concentration volatile phase resulted in a two
times smaller growth inhibition value than the EOs in 4% concentration liquid phase
(Figs. 2, 3).
Environmental factors such as temperature, light, day length change during the
vegetation period, as well as genetic factors, organ age impact on the seasonal
quantitative variations in plant components [35–38].
Previous research has shown that the antifungal activity of EOs is not caused by
major compounds, but is rather the result of a synergistic or antagonistic effect of
different compounds present in the mixture, even if in minor percentages [36, 39, 40].
Dzamiæ el al [41] reported that there is a relationship between the high presence of
linalyl acetate and linalool in sage oil and observed moderate antifungal activity. Some
458 Katarzyna Grata
Gro
wth
ra
te in
de
x in
hib
itio
n [
%]
30
25
20
15
10
5
00.5% 1.0% 2.0% 4.0%
clovebud oilsage oilbasil oil
Fig. 3. Growthinhibition of F. solani by essential oils (vapour phase) at different concentrations
studies suggest that the extent of inhibition of fungal growth and mycotoxin production
(aflatoxin B1, G2, fumonisins, deoxynivalenol) depends on the concentration of
essential oil [23, 31, 42–44].
The antimicrobial properties of sage oil have been attributed to the presence of the
major oxygenated monoterpenes 1,8-cineole and camphor [36, 37, 45–48], thujone [45,
47], linalool and linalyl acetate [40, 41, 49, 50]. However Pinto et al [47] demonstrated
that thujone content may not be related to the inhibition of fungal development.
Some studies found that sage oil was active in inhibiting the growth of pre- and
post-harvest phytopathogenic and saprophytic fungi belonging to the genera Fusarium,
Aspergillus, Penicillium, Alternaria, Trichoderma, Gliocladium [41, 43, 45, 47, 48].
Among the Fusarium sp. the most sensitive to sage oils were Fusarium solani,F. equiseti and F. verticillioides whereas F. tricinctum, F. subglutinans were the least
sensitive [45]. According to Gomori et al [31] clary sage inhibited the growth of
F. culmorum by 73.7%, F. graminearum by 9.26% and A. parasiticus by 28,05%. In
another study, sage oil caused a total inhibition of F. graminearum growth [46].
Furthermore, Snieskiene et al [23] observed that volatile fractions of sage essential oils
had the strongest fungicidal effect, after three days of incubation, on F. sambucinum,
F. culmorum, F. oxysporum and A. alternata (reduction of mycelium growth amounted
to more than 90%).
The high inhibition results of clove oil could be attributed to its major aromatic
component, eugenol, which is known to inhibit fungal growth and fungal spore produc-
tion [27, 39, 51–54]. Similarly, the main components of basil oil are eugenol, 1,8-cineole
and linalool, which may exhibit antagonistic properties against certain fungi [42, 55].
Eugenol may cause morphological malformation in fungal cell, dissolve fat of fungal
cell walls and therefore can interfere with the permeability of cells, destroying conidia
and fungal hyphae. The inhibition levels of F. oxysporum by clove oil fractions
containing a high content of eugenol ranged between 84.44–100% [53]. Velluti et al
[51] observed that clove oil reduced F. verticillioides, F. proliferatum and F. grami-nearum colony growth by about 62%. Cosic et al [52] indicated in their results that
clove oil had a stronger impact than sage oil on mycelium growth of Fusarium species.
Sameza et al [27] showed that clove oil could significantly inhibit the mycelia growth
and spore germination of R. stolonifer and F. solani. The oil caused a complete
inhibition of fungal growth in all tested doses and a complete inhibition of spore
germination but only at a dose greater than 31.2 ppm for R. solani and 250 ppm for
F. solani [27].
These results are also in accordance with those obtained by Beg et al [56] for
A. alternata and F. chlamydosporum. Their microscopic observations showed 20–40%
lysis of conidia after 72 h of incubation at 5% concentration. However at higher clove
oil concentration (10%), up to 20% of conidia were lysed after 24 h of incubation.
Clove oil and eugenol considerably reduced the quantity of ergosterol, which is an
important component of fungal cell membrane responsible for maintaining the con-
sistency, integrity and functionality of the cells. Clove oil suppressed the growth of
pathogenic fungi Aspergillus sp., Fusarium sp. and Alternaria sp. by a range of 41% to
65% [57].
Sensitivity of Fusarium solani Isolated from Asparagus on Essential Oils 459
Hussain et al [35] reported that basil essential oils and linalool possessed strong
antifungal activity against A. niger, F. solani and moderate activity against M. mucedo,
R. solani. It has been further observed that essential oils from winter and autumn crops
demonstrated greater activity which might be attributed to be a high content of linalool
and other oxygenated compounds [35]. Other studies have shown a significant impact of
linalool [24] on mycelial growth of A. niger, F. moniliforme, and to a lesser extent, on
A. flavus, P. roquefortii as well as an impact of eugenol [58] against Rhizoctonia sp.,
Alternaria sp.
The antifungal mechanisms of essential oils depend on their components and their
the lipophilic nature. Therefore, volatile phenolic compounds (carvacrol, eugenol,
thymol) may interfere with cell wall enzymes (enzyme inhibition), possibly through
reaction with sulfhydryl groups or through interactions with proteins. They may change
the cell permeability, membrane fluidity and disintegrate fungal hyphae [42, 59–62].
In this study, all of the essential oils investigated exhibited inhibitory effects on
mycelial growth and the fungal spore production of F. solani. However, the extent of
inhibition was significantly dependent upon the concentration of EOs, the type of oil,
and phase type (volatile or liquid phases).
Conclusions
All three of the essential oils demonstrated antagonistic effects to a greater or lesser
extent on Fusarium solani. Depending on the type of oil and the dose, they had a
stronger effect on spore germination (even in small doses) than on mycelium growth of
F. solani. The inhibitory effect of the essential oils increased with the increase of their
concentration. In general, all amounts of the tested essential oils significantly restricted
the spore germination and mycelial growth of F. solani with the maximum activity
detected at 4% EO concentration. Additionally, it was noted that basil oil was the
greatest inhibitor of spore germination (98.90%), whereas clove budoil was the greatest
inhibitor of mycelial growth (29.96% in liquid phase and 17.10% in gaseous phase).
The data obtained in volatilization methods established that all three of the oils in
gaseous phase had fungistatic effect on F. solani but not to a visible degree –
particularly when compared to the liquid phase data in the poisoning method. Taking
into consideration both the germination of conidia and mycelial growth, the findings
indicated that clove oil possesses the strongest inhibitory activity against F. solaniisolated from white asparagus.
References
[1] Stêpieñ £, Waœkiewicz A, Urbaniak M. Wildly growing asparagus (Asparagus officinalis L.) hosts
pathogenic Fusarium species and accumulates their mycotoxins. Microb Ecol. 2016;71:927-937.
DOI: 10.1007/s00248-015-0717-1.
[2] Wang J, Wang X, Zhou Y, Du L, Wan Q. Fumonisin detection and analysis of potential fumonisin-
producing Fusarium spp. in asparagus (Asparagus officinalis L.) in Zhejiang Province of China. J Sci
Food Agric. 2010;90:836-842. DOI: 10.1002/jsfa.3893.
460 Katarzyna Grata

[3] Weber Z, Kostecki M, Bargen S, Gossmann M, Waœkiewicz A, Bocianowski J, Knaflewski M, et al.
Fusarium species colonizing spears and forming mycotoxins in field samples of asparagus from
Germany and Poland. J Phytopathol. 2006;154:209-2016. DOI: 10.1111/j.1439-0434.2006.01085.x.
[4] Waœkiewicz A, Irzykowska L, Bocianowski J, Karolewski Z, Kostecki M, Weber Z, Goliñski P.
Occurence of fusarium and mycotoxins in marketable asparagus spears, Pol J Environ Stud.
2010;19(1):219-225.
[5] Waœkiewicz A, Irzykowska L, Drzewiecka K, Bocianowski J, Dobosz B, Weber Z, Karolewski Z, et al.
Plant-pathogen interactions during infection process of asparagus with Fusarium spp. Cent Eur J Biol.
2013;8(11):1065-1076. DOI: 10.2478s11535-013-0217-6.
[6] Kalomira E. Asparagus diseases. EJPSB. 2007;1(1):76-83.
[7] Grata K. AktywnoϾ biologiczna Bacillus amyloliquefaciens wobec Fusarium spp. wyizolowanych
z pêdów szparaga (Asparagus officinalis L.) [Biocontrol activities of Bacillus amyloliquefaciens against
Fusarium spp. isolated from the white spears of asparagus (Asparagus officinalis L.)]. 2016:7-22. In:
Mikrobiologia oraz metody analityczne w nauce [Microbiology and analytical methods in science].
Kropiwiec K, Szala M, editors, Lublin: TYGIEL Publishers, ISBN 978-83-65598-27-1.
[8] Borrego-Benjumea A, Basallote-Ureba M J, Melero-Vara J, M, Pervaiz A. Characterization of Fusariumisolates from asparagus fields in southwestern Ontario and influence of soil organic amendments on
Fusarium crown and root rot. Phytopathology. 2014;104(4):403-415. DOI: 10.1094/PHYTO-08-13-0231-R.
[9] Waœkiewicz A, Goliñski P, Karolewski Z, Irzykowska L, Bocianowski J, Kostecki M, Weber Z.
Formation of fumonisins and other secondary metabolites by Fusarium oxysporum and F. proliferatum:
a comparative study. Food Add Contam. 2010;27:608-615. DOI: 10.1080/19440040903551947.
[10] Weber Z, Kostecki M, von Bargen S, Gossmann M, Waœkiewicz A, Bocianowski J, Kaflewski M, et al.
Fusarium species colonizing spears and forming mycotoxins in field samples of asparagus from
Germany and Poland. J Phytopathol. 2006;154;209-216. DOI: /10.1111/j.1439-0434.2006.01085.x
[11] Nahiyan ASM, Robinson BL, Jeffries P, Matsubara Y. PCR-SSCP analysis of Fusarium diversity in
asparagus decline in Japan. Eur J Plant Pathol. 2011;130:197-203. DOI: 10.1007/s10658-011-9745-y.
[12] Andrzejak R, Werner M. Grzyby z rodzaju Fusarium, uszkadzaj¹ce wypustki szparagów i ich
patogenicznoœæ wzglêdem m³odych roœlin [Fungi form genus Fusarium spp. damaging asparagus spears
and their pathogenicity towards young plants]. Prog Plant Prot. 2006;46(2):700-703.
[13] Weber Z, Karolewski L, Irzykowska L, Knaflewski M, Kosiada T. Occurrence of Fusarium species in
spears of asparagus (Asparagus officinalis). Phytopathol Pol. 2007;45:9-15.
[14] Elmer W. H. Management of Fusarium crown and root rot of asparagus. Crop Prot. 2013;73:2-6.
DOI: 10.1016/j.cropro.2014.12.005.
[15] Qiu M, Wu Ch, Ren G, Liang X, Wang X, Huang J. Effect of chitosan and its derivatives as antifungal
and preservative agents on postharvest green asparagus. Food Chem. 2014;155:105-111.
DOI: 10.1016/j.foodchem.2014.01.026.
[16] Rubio-Perez DE, Molinero-Ruiz ML, Melero-Vara JM, Basalote-Ureba MJ. Selection of potential
antagonists against asparagus crown and root rot caused by Fusarium spp. Comm Appl Biol Sci.
2008; 3(2):203-204.
[17] Yergeau E, Sommerville DW, Maheux E, Vujanovic V, Hamel Ch, Whalen JK, St-Arnaud M.
Relationships between Fusarium population structure, soil nutrient status and disease incidence in
field-grown asparagus. FEMS Microbiol Ecol. 2006;58:394-403. DOI: 10.1111/j.1574-6941.2006.00161.x.
[18] Borrego-Benjumea AI, Melero-Vara JM, Basallote-Ureba MJ. Organic amendments conditions on the
control of Fusarium crown and root rot of asparagus caused by three Fusarium spp. Spain J Agric Res.
2015;13(4):1-13. DOI: 10.5424/sjar/2015134-7905.
[19] Arriola LL, Hausbeck MK, Rogers J, Safir GR. The effect of Trichoderma harzianum and arbuscular
mycorrhizae on Fusarium root rot in Asparagus. HorTechnology. 2000;10(1):141-144.
[20] Manganyi MC, Regnier T, Olivier EJ. Antimicrobial activities of selected essential oils against Fusariumoxysporium isolates and their biofilms. SAFR J Bot. 2015;99:115-121. DOI: 10.1016/j.sajb.2015.03.192.
[21] Elgorban AM, Bahkali AH, El-Metwally MA, Elsheshtawi M, Abdel-Wahab MA. In vitro antifungal
activity of some plant essential oils. Int J Pharmcol. 2015;11(1):56-61. DOI: 10.3923/ijp.2015.56.61.
[22] Naeini A, Ziglari T, Shokri H., Khosravi AR. Assessment of growth-inhibiting effect of some plant
essential oils on different Fusarium isolates. J Mycol Med. 210;20:174-178.
DOI: 10.1016/j.mycmed.2010.05.005.
[23] Snieškien� V, Stankevièien� A, Varkulevièien� J. The effect of the essential oils on micromycetes
isolated from plants. Zemdirbyste-Agriculture. 2008;95(3):447-452.
Sensitivity of Fusarium solani Isolated from Asparagus on Essential Oils 461

[24] Yaouba A, Tatsadjieu NL, Jazet DPM, Etoa FX, Moses MC. Antifungal properties of essential oils and
some constituents to reduce foodborne pathogen. J Yeast Fungal Res. 2010;1(1):001-008.
[25] Tabassum N, Vidyasagar GM. Antifungal investigations on plant essential oils. A review. Int J Pharm
Pharm Sci. 2013;5(2):19-28.
[26] Malkhan SG, Shahid A, Masood A, Kangabam SS. Efficacy of plant extracts in plant disease
management. Agr Sci. 2012;3:425-433. DOI: 10.4236/as.2012.33050.
[27] Sameza ML, Mabou LCN, Tchameni SN, Bedine MAB, Tchoumbougnang F, Dongmo PMJ, Fekam FB.
Evaluation of clove essential oil as a mycobiocide against Rhizopus stolonifer and Fusarium solani,Tuber Rot Causing Fungi in Yam (Dioscorea rotundata Poir.). J Phytopathol. 2016;164:433-440.
DOI: 10.1111/jph.12468.
[28] Antunes MDC, Cavaco AM. The use of essential oils for postharvest decay control. A review. Flavour
Fragr. 2010;25:351-366. DOI: 10.1002/ffj.1986.
[29] Kumar V, Mathela CS, Tewari AK, Bisht KS. In vitro inhibition activity of essential oils from some
Lamiaceae species against phytopathogenic fungi. Pestic Biochem Phys. 2014;114:67-71.
DOI: 10.1016/j.pestbp.2014.07.001.
[30] http://mazid³a.com
[31] Gömöri C, Nacsa-Farkas E, Kerekes EB, Kocsubé S, Vágvölgyi C, Krisch J. Evaluation of five essential
oils for the control of foodspoilage and mycotoxin producing fungi. Acta Biol Szeged.
2013;57(2):113-116.
[32] Tyagi AK, Malik A. Antimicrobial potential and chemical composition of Mentha piperita oil in liquid
and vapour phase against food spoiling microorganisms. Food Control. 2011;22:1707-1714.
DOI: 10.1016/j.foodcont.2011.04.002.
[33] Burgie³ Z. Wp³yw niektórych herbicydów na wystêpowanie i rozwój patogenów powoduj¹cych choroby
podsuszkowe pszenicy ozimej. [Effect of some herbicides on the incidence and growth of pathogens
causing wheat eyespot]. Cz. II. Rozwój patogenów [Development of pathogens.]. Acta Agr Silv Seria
Agraria. 1984;23:187-196.
[34] Burgie³ Z, Koñczyk D. Reakcje grzyba Fusarium culmorum wyizolowanego z korzeni pszenicy ozimej
na wybrane herbicydy. [The reactions of the fungus Fusarium culmorum isolated from the roots of
winter wheat to selected herbicides]. Acta Agraria et Silvestria 1989;XXVIII:25-31.
[35] Hussain AI, Anwar F, Sherazi STH , Przybylski R. Chemical composition, antioxidant and antimicrobial
activities of basil (Ocimum basilicum) essential oils depends on seasonal variations. Food Chem.
2008;108:986-995. DOI: 10.1016/j.foodchem.2007.12.010.
[36] Daferera DJ, Ziogas BN, Polissiou MG. The effectiveness of plant essential oils on the growth of
Botrytis cinerea, Fusarium sp. and Clavibacter michiganensis subsp. Michiganensis Crop Prot.
2003;22:39-44.
[37] Abu-Darwish MS, Cabral C, Ferreira IV, Gonçalves MJ, Cavaleiro C, Cruz MT, Al-Bdour TH,
Salgueiro L. Essential Oil of Common Sage (Salvia officinalis L.) from Jordan: Assessment of safety in
mammalian cells and its antifungal and anti-inflammatory potential. BioMed Res Int. 2013; Article ID
538940: 9 pages. DOI: 10.1155/2013/538940.
[38] Farhat MB, Jordán MJ, Chaouech-Hamada R, Landoulsi A, Sotomayor JA. Variations in essential oil,
phenolic compounds, and antioxidant activity of tunisian cultivated Salvia officinalis L. J Agr Food
Chem. 2009;57(21):10349-10356. DOI 10.1021/jf901877x.
[39] Gupta A, Sharma S, Naik SN. Biopesticidal value of selected essential oils against pathogenic fungus,
termites, and nematodes. Int Biodeter Biodegr. 2011;65:703-707. DOI: 10.1016/j.ibiod.2010.11.018.
[40] Pitarokili D, Couladis M, Petsikos-Panayotarou N, Tzakou O. Composition and Antifungal Activity on
Soil-Borne Pathogens of the Essential Oil of Salvia sclarea from Greece. J Agric Food Chem.
2002;509(23): 6688-6691. DOI: 10.1021/ jf020422n.
[41] D�amiæ A, Sokoviæ M, Ristiæ M, Grujiæ-Jovanoviæ S, Vukojeviæ J, Marin PD. Chemical composition
and antifungal activity of Ssalvia sclarea (lamiaceae) essential oil. Arch Biol Sci. 2008;60(2):233-237.
DOI: 10.2298/ABS0802233D.
[42] Dambolena JS, Zunino MP, López AG, Rubinstein HR, Zygadlo JA, Mwangi JW, Thoithi GN, Kibwage
IO, et al. Essential oils composition of Ocimum basilicum L. and Ocimum gratissimum L. from Kenya
and their inhibitory effects on growth and fumonisin production by Fusarium verticillioides. Innov. Food
Sci. Emerg Technol. 2010;11:410-414. DOI: 10.1016/j.ifset.2009.08.005.
462 Katarzyna Grata

[43] Sumalan RM, Alexa E, Poiana MA. Assessment of inhibitory potential of essential oils on natural
mycoflora and Fusarium mycotoxins production in wheat. Chem Cent J. 2013;7:32.
DOI: 10.1186/1752-153X-7-32.
[44] Yílar M, Kadíoðlu I. Antifungal Activities of some Salvia Species Extracts on Fusarium oxysporum f.
sp. radicis- lycopersici (Forl) Mycelium Growth In-vitro. Egypt J Biol Pest Co. 2016;26(1):115-118.
[45] Steviæ T, Stankoviæ S, Šavikin K, Goðevac D, Dimkiæ I, Sokoviæ M, Beriæ T. Chemical composition and
inhibitory activity of selected essential oils against fungi isolated from Medicinal plants. LEK SIROV.
2014;349(34):69-80.
[46] Tomescu A, Sumalan RM, Pop G, Alexa E, Poiana MA, Copolovici DM, Mihai CSS, et al. Chemical
composition and protective antifugal activity of Mentha Piperita L. and Salvia Officinalis L. essential
oils against Fusarium graminearum Spp. REV CHIM. 2015;66(7):1027-1030.
[47] Pinto E, Salgueiro LR, Cavaleiro C, Palmeira A, Gonc¸alves MJ. In vitro susceptibility of some species
of yeasts and filamentous fungi to essential oils of Salvia officinalis. Ind Crop Prod. 2007;26:135-141.
DOI: 10.1016/j.indcrop.2007.02.004.
[48] Rus CF, Pop G, Alexa E, �umãlan RM, Copolovici DM. Antifungal activity and chemical composition
of Salvia officinalis l. Essential oil. Res J Agricult Sci. 2015;47(2):186-192.
[49] Fraternale D, Giamperi L, Bucchini A, Ricci D, Epifano F, Genovese S, Curini M. Composition and
antifungal activity of essential oil of Salvia sclarea from Italy. Chem Nat Comp. 2005;41(5):604-606.
DOI: 10.1007/s10600-005-0221-9.
[50] Sharopov FS, Setzer WN. The Essential Oil of Salvia sclarea L. from Tajikistan. Rec Nat Prod.
2012;6(1):75-79.
[51] Velluti A, Martín S, Gonzalez P, Ramos AJ, Sanchis V. Initial screening for inhibitory activity of
essential oils on growth of Fusarium verticillioides, F. proliferatum and F. graminearum on maize-based
agar media. Food Microbiol. 2004;21:649-656. DOI: 10.1016/j.fm.2004.03.009.
[52] Æosiæ J, Vrandeèiæ K, Postiæ J, Jurkoviæ D, Ravliæ M. In vitro antifungal activity of essential oils on
growth of phytopathogenic fungi. POLJOPRIVREDA. 2010;16(2):25-28.
[53] Juniawan, Sastrahidayat IR, Djauhari S, Himawan T. Inhibition Test of Clove Leaf Oils to Fusariumoxysporum f.sp. cubense. IOSR-JAVS. 2016;9(4):01-07. DOI: 10.9790/2380-0904010107.
[54] Koul O, Walia S, Dhaliwal GS. Essential oils as green pesticides: Potential and constraints. Biopestic
Int.2008;4:63-84.
[55] Vieira PRN, Morais SM, Bezerra FHQ, Ferreira PAT, Oliveira IR, Silva MGV. Chemical composition
and antifungal activity of essential oils from Ocimum species. Ind Crop Prod. 2014;55:267-271.
DOI: 10.1016/j.indcrop.2014.02.032.
[56] Beg AZ, Iqbal Ahmad I. In vitro fungi toxicity of the essential oil of Syzygium aromaticum. World J
Microb Biot. 2002;18:313-315. DOI: 10.1023/A:1015242901360.
[57] Javed S, Mushtaq S, Khokhar I, Ahmad R, Haider MS. Comparative antimicrobial activity of clove and
fennel essential oils against food borne pathogenic fungi and food spoilage bacteria. Afr J Biotechnol.
2012;11(94);16065-16070. DOI: 10.5897/AJB11.3058.
[58] Faria TJ, Ferreira RS, Yassumoto L, Souza JRP, Ishikawa NK, Barbosa AM. Antifungal activity of
essential oil isolated from Ocimum gratissimum L. (eugenol chemotype) against phytopathogenic fungi.
Braz Arch Biol Technol. 2006;49:867-871.
[59] Camele I, Altieri L, De Martino L, De Feo V, Mancini E, Rana GL. In vitro control of post-harvest fruit
rot fungi by some plant essential oil components. Int J Mol Sci. 2012;13:2290-2300.
DOI: 10.3390/ijms13022290.
[60] Soylu EM, Soylu S, Kurt S. Antimicrobial activities of the essential oils of various plants against tomato
late blight disease agent Phytophthora infestans. Mycopathologia. 2006;161:119-128.
DOI: 10.1007/s11046-005-0206-z.
[61] Taweechaisupapong S, Ngaonee P, Patsuk P, Pitiphat W, Khunkitti W.. Antibiofilm activity and post
antifungal effect of lemongrass oil on clinical Candida dubliniensis isolate. S Afr J Bot. 2012;78:37-43.
DOI: 10.1016/j.sajb.2011.04.003.
[62] Hashem M, Moharam AM, Zaied AA, Saleh FEM. Efficacy of essential oils in the control of cumin root
rot disease caused by Fusarium spp. Crop Prot. 2010;29:1111-1117. DOI: 10.1016/j.cropro.2010.04.020.
Sensitivity of Fusarium solani Isolated from Asparagus on Essential Oils 463

WRA¯LIWOŒÆ Fusarium solani WYIZOLOWANEGO ZE SZPARAGA NA OLEJKI
ETERYCZNE
Samodzielna Katedra Biotechnologii i Biologii Molekularnej
Uniwersytet Opolski
Abstrakt: Celem badañ by³a ocena przeciwgrzybicznych w³aœciwoœci olejku z sza³wii, olejku goŸdzikowego
i olejku bazyliowego wobec Fusarium solani wyizolowanego z pêdów szparaga (Asparagus officinalis L.)
Ocenê w³aœciwoœci antagonistycznych testowanych olejków i ich metabolitów gazowych wobec grzybni prze-
prowadzono metod¹ hodowlano-p³ytkow¹ na pod³o¿u PDA. Hodowlê prowadzono przez 9 dni w temp. 26oC,
dokonuj¹c pomiarów co 1–3 dni. Natomiast zarodnikowanie grzyba w obecnoœci olejków oceniono metod¹
mikroskopow¹. Przeprowadzone badania wykaza³y ró¿nice w aktywnoœci metabolicznej testowanych olej-
ków. W zale¿noœci od rodzaju olejku i jego dawki, stwierdzono wiêksz¹ aktywnoœæ wobec zarodników grzy-
bów ni¿ na wzrost grzybni F. solani. Najwiêkszy wp³yw na zdolnoœæ kie³kowania zarodników wykaza³ olejek
bazyliowy, nastêpnie kolejno olejek goŸdzikowy i olejek sza³wiowy w stê¿eniu 4%. Stopieñ zahamowania
kie³kowania zarodników wyniós³ odpowiednio: 98,9%, 89,9% oraz 85,4%. Natomiast zdecydowanie mniejszy
wp³yw wykaza³y na wzrost grzybni F. solani. Zastosowanie najwiêkszej dawki olejku goŸdzikowego ograni-
czy³o tempo wzrostu grzyba o 29,9%, olejku sza³wiowego o 14,8% a olejku bazyliowego tylko o 4,0%. Rów-
nie¿ metabolity gazowe ogranicza³y wzrost grzybni F. solani. Stopieñ zahamowania wzrostu wynosi³ odpo-
wiednio 17,1% dla olejku goŸdzikowego, 15,5% dla olejku sza³wiowego i 9,3% dla bazyliowego. Bior¹c pod
uwagê analizowane czynniki, olejek goŸdzikowy okaza³ siê najwiêkszym inhibitorem kie³kowania za-
rodników i wzrostu grzybni F. solani.
S³owa kluczowe: Fusarium solani, szparagi, olejki eteryczne, aktywnoœæ przeciwgrzybowa
464 Katarzyna Grata

Joanna KAPUSTA-DUCH1*, Barbara KUSZNIEREWICZ2,
Teresa LESZCZYÑSKA1 and Barbara BORCZAK1
EFFECT OF CONVENTIONAL COOKING ON CHANGES
IN THE CONTENTS OF BASIC COMPOSITION
AND GLUCOSINOLATES IN KALE
WP£YW GOTOWANIA NA ZMIANY ZAWARTOŒCI
SK£ADU PODSTAWOWEGO I GLUKOZYNOLANÓW W JARMU¯U
Abstract: Brassica vegetables have been strongly recommended as part of human diet because of its high
content of bioactive sulphur compounds, eg glucosinolates. The nutrient and health-promoting compounds in
kale are significantly affected by traditional cooking. The study investigated changes in the levels of dry mass,
ash, fat, total protein, dietary fibre as well as total and individual glucosinolates in the kale due to the
traditional cooking process. As a result of cooking kale, a significant decrease was noted in the content of fat,
dry matter, indole glucosinolates, and a significant growth in the content of protein, ash, dietary fibre, and
aliphatic glucosinolates compared to the raw vegetable.
Keywords: kale, glucosinolates, traditional cooking, dietary fibre, basic composition
Introduction
The Brassicaceae family comprises about 400 genera and 4000 species of vege-
tables, which are commonly grown and popular everywhere in the world. They are
abundant in health-promoting phytochemicals [1]. The kale (Brassica oleracea L. var.
acephala), being a traditional, biannual leafy vegetable of this family, is grown
worldwide. Of the Brassica vegetables, kale was found to have the highest antioxidant
activity and large concentrations of vitamins, minerals, dietary fibre, glucosinolates,
chlorophyll-associated carotenoids, flavonoids, and phenolic acids [2].
According to the epidemiological studies, there is an opposite relationship between
consumption of Brassica vegetables and occurrence of certain cancer forms, cardio-
DOI: 10.2428/ecea.2016.23(4)31 ECOL CHEM ENG A. 2016;23(4):465-480
1 Department of Human Nutrition, Agricultural University of Krakow, ul. Balicka 122, 30–149 Kraków,
Poland, phone: +48 12 662 48 16, fax: +48 12 662 48 12.2 Department of Food Chemistry, Technology and Biotechnology, Gdañsk University of Technology,
ul. G. Narutowicza 11/12, 80–233 Gdañsk, Poland.
* Corresponding author: [email protected]

vascular and degenerative diseases, immune disfunction and aged-related macular
degeneration [3, 4]. Plant-derived bioactive compounds can be classified, according to their
chemical structure, as antioxidants, vitamins, polyphenols, terpene derivatives, sulphur
compounds, phytoestrogens, minerals, polyunsaturated fatty acids, dietary fibre, and phytic
acid. The sulphur compounds are commonly found in Brassica or allium vegetables [5].
The glucosinolates (GLS) belong to a large group of sulfur-containing compounds
occurring in all the Brassicas vegetables of economic importance. Usually, their
structure includes: the �-D-thioglucose group, a sulfonated oxime moiety and a variable
side-chain derived from methionine, tryptophan or phenylalanine, and some branched-
chain amino acids. They are stored in the myrosinase-containing cells in the intact plant
tissue. Upon tissue disruption, glucosinolates undergo hydrolysis by the endogenous
enzyme ‘myrosinase’ (thioglucoside glucohydrolase EC 3 : 2 : 3 : 1) that in turn releases
a range of breakdown products. Depending on the chemical structure of glucosinolates
(aliphatic, aromatic, or indole glucosinolates), coexisting in vegetables factors like
epithiospecifier proteins (ESP), Fe2+ or ascorbic acid, environmental conditions (pH
value), the end products of hydrolyzed glucosinolates are different (isothiocyanates,
nitriles, indoles, thiocyanates and oxazolidines) [6–10]. Furthermore, glucosinolates can
also undergo thermal and chemical degradation. Some factors, like eg: ascorbic acid,
MgCl2, temperature, pH and pressure affect the activity of myrosinase. In addition,
myrosinase-like activity is induced by the gastrointestinal microbiota. Ingestion of the
glucosinolates-containing products in the absence of the active plant-derived myro-
sinase, still results in the formation and absorption of bioactive breakdown products
obtained due to the gut microbiota enzymes. During digestion, such factors as the
degree of cell disruption, time of gastrointestinal transit, individual genotype, meal
composition, and diversity of the colonic microbiota can additionally affect glucosino-
lates [8, 11]. Until now, over 200 different naturally occurring glucosinolates have been
identified in Brassica vegetables in relatively high amounts [3].
Some glucosinolates and their decomposition products have gained more widespread
attention as chemopreventive agents. These are 4-methylsulphinylbutyl isothiocyanate
(sulforaphane), indole-3-carbinol or 3,3’-diindolylmethane. Chemoprevention, accor-
ding to its definition, is the use of natural or synthetic agents which have ability to
reverse, inhibit, or prevent the development of a chronic-degenerative disease [12]. The
advantageous effects of glucosinolates and their breakdown products have been
thoroughly investigated. The studies revealed that glucosinolates and their breakdown
products may to a certain degree regulate or adjust many essential processes like the
inhibition of inflammatory processes; induction of the cytoprotective enzymes; modula-
tion of the signaling pathways in cancer, including cellular proliferation, angiogenesis;
the epithelial-mesenchymal transition; self renewal of cell in cancer stem; suppression
of the diverse oncogenic signaling pathways; modulation of epigenetic alterations; and
regulation of polycomb group proteins or epigenetic cofator modifiers [1, 3].
Glucosinolates along with the products of their decomposition (isothiocyanates,
nitriles, thiocyanates, epithionitriles, and oxazolidines) exhibit also antioxidant, anti
-inflammatory, anti-allergic, anti-fungal, anti-virus, anti-mutagenic, and anti-bacterial
properties [13, 14]. As was reported by some researchers, not only breakdown products
466 Joanna Kapusta-Duch et al

of glucosinolates, but also intact glucosinolates could have a pro-health effect [1, 15].
The protection provided by phytochemicals occurring in the glucosinolates-containing
kale is particularly important in the context of the safe and cost-effective strategy for
combating several chronic diseases.
The glucosinolates content in Brassica vegetables prior to consumption vary
markedly due to differences occurring at various stages of the food supply chain,
including: cultivation; growth condition; climate; plant variety; the tissue-specific
distribution in a plant parts (seeds, leaves, roots, stems); storage and packaging
conditions; and culinary treatment [3, 16].
Generally, kale is not consumed immediately after harvesting. As storage and
cooking affect pro-health components, heat treatment of food induces several bio-
logical, physical and chemical changes. When preparing food, cooking is the most
commonly used technique in processing Brassica vegetables. The process has a great
effect on the health-promoting bioactive compounds and elementary composition of
these plants. Changes in phytochemicals due to cooking may result from two contrary
phenomena: the heat-induced denaturation of enzymes which can catalyse the break-
down of nutrients and phytochemicals and an effect of matrix softening, due to which
the extractability of phytochemicals increases, resulting in their higher concentration
compared to the raw material. The results of previous studies concerning the effect of
processing Brassica vegetables on glucosinolates content are sometimes inconsistent or
contradictory [8, 17]. Hence, it is necessary to evaluate the availability of the
phytochemicals in human diet, discovering what happens to phytochemicals before and
after food processing and monitor their final concentration.
The aim of processing is therefore to enhance beneficial properties of Brassicavegetables by improving bioavailability of glucosinolates and other compounds as well
as extending shelf life. The quality of cooked vegetables depends on quality of the raw
material, parameters and methods of processing, the variety of Brassica vegetables, and
the kind of compounds [2].
The objective of this work was also to examine to what extent the commonly used
process of thermal processing of kale changes the selected parameters of its health
quality such as dry matter content, total protein, fat, ash, dietary fibre, and individual
and total glucosinolates, which are important and potentially health-promoting consti-
tuents of kale. In order to achieve this aim, we hypothesised that the dry matter, total
protein, fat, ash, dietary fibre, as well as individual and total glucosinolates contents in
the raw and cooked kale differed statistically significantly. In general, this study was
undertaken to broaden knowledge on the health-promoting properties of the raw and
conventionally cooked kale in terms of the above indicators.
Material and methods
Plant material
The material investigated consisted of fresh kale (B. oleracea L. var acephala) leaves
and leaves after cooking to consumption consistency. The kale cultivar under investiga-
Effect of Conventional Cooking on Changes in the Contents of Basic Composition... 467

tion was Winterbor F1 and was grown up at the Polan Plant and Horticultural Seed
Production Centre in Krakow, Poland (Experimental Station in Igolomia). The
experimental field was located in the eastern outskirts of the Krakow. The kale was
grown in black soil on loess framework with neutral pH. Mineral fertilization was
applied according to the fertility of soil and the nutritional requirements of the species
and condition treatments were carried out during the growing season (depending on soil
and weather conditions).
Vegetable samples were prepared for analyses directly after harvest. The leaves were
firstly separated (5 kg green mass), then washed under running water, next tiny cut into
strips 2–3 cm in width (exterior and interior parts of the plant) and mixed in order to
obtain the representative average laboratory samples (a minimum of three for each
analysis performed on the fresh material and the same procedure was done on material
after cooking). Another part of fresh material was washed and then dried on the filter
paper; shredded mechanically; frozen at –22oC; and next freeze-dried in the Christ
Alpha 1–4 apparatus (Christ, Germany). The material, having undergone freeze-drying,
was additionally comminuted in the Knifetec 1095 Sample Mill (Tecator, Sweden) until
reaching a homogenous sample with possibly the smallest particle diameter. At the
same time, the other vegetable batch was cooked in the traditional way (by domestic
cooking methods), in a stainless steel pot on the electric stove top. Vegetables were
cooked in unsalted water and in the initial phase of hydrothermal treatment – without
a lid but in accordance with the principle “from farm to fork”. The proportion of water
to the raw material being 5 : 1 by weight. The cooking time applied was 15 minutes.
The boiled vegetables were then prepared as described for fresh vegetables.
Analytical methods
The dry matter of the prepared samples of vegetables was determined according to
PN-90/A-75101/03 [18]. The determination principle comprised determining the de-
crease in mass upon removal of water from the product during thermal drying at the
temperature of 105oC, under normal pressure conditions.
In raw freshly and lyophilized kale the following analyses were also performed:
protein content using Tecator Kjeltec 2200 (Tecator, Sweden); fat content, using
Tecator Soxtec Avanti 2050 (Tecator, Sweden); ash content by dry mineralisation in
mufl Snol 8.2/1100 (Snol, Lithuania) on oven at 525oC (PN-A-79011-8:1998 [19]) and
dietary fibre content with enzymatic-gravimetry method using Tecator Fibertec System
E (Tecator, Sweden).
The procedure of protein determination employ mineralization of the product in
concentrated sulphuric acid (IV) (“the aqueous mineralization”), followed by alkalizing
the solution, distillation of ammonia released and its qualitative determination according
to PN-EN ISO 8968-1:2004 [20].
Fat determination is based on the extraction of fat from the dried material with an
organic solvent (petroleum ether), distilling off the solvent, drying the residue and de-
termining the weight of the extracted “crude fat” according to PN-A-79011-4:1998 [21].
Dietary fibre content was determined according to PN-A-79011-15:1998 [22] by
means of enzymatic and gravimetric methods. Lyophilized samples of kale were subjec-
468 Joanna Kapusta-Duch et al

ted to gelatinization with a thermally stable �-amylase, then digested by enzymes invol-
ving protease and amyloglucosidase to remove protein and starch present in the sample.
Soluble dietary fibre was precipitated by adding ethanol. The sediment was then filtered
off, washed in ethanol and acetone and, after drying, weighed. Half the samples was
analysed for the presence of protein and the remainder incinerated. Total dietary fibre
has been calculated as the weight of sediment minus the weight of protein and ash.
Determination of glucosinolates
In order to determine the content of glucosinolates, the ISO 9167-1 method with
modifications described by Kusznierewicz was used [23]. For this purpose, 200 mg of
each lyophilized Brassica sample was extracted three times with boiling methanol
(2 cm3, 70%). The known amount of glucotropaeolin (0.2 cm3, 5 mM, AppliChem
GmbH, Darmstadt, Germany) was added to each sample just before the first extraction
as an internal standard for the HPLC analysis. The extracted glucosinolates were
purified on column filled with 0.5 cm3 of DEAE Sephadex A-25 anion-exchange resin
(Sigma Chemical Co., St. Louis, MO, USA). The column was washed with 2 cm3
imidazole formate (6 M) and twice with 1 mL Millipore water and then loaded with 6
cm3 of each extract. Afterwards sulphatase water solution (1.67 mg/cm3, 250 mm3)
(Helix pomatia type H1, Sigma Chemical Co., St. Louis, MO, USA) was introduced
onto the column and the columns were incubated for 12 h at room temperature. Next
day, the desulfo-glucosinolates were eluted with deionized water (2 � 0.75 cm3) and
injected (50 mm3) into LC-DAD-ESI-MS system (Agilent Technologies, Wilmington,
DE, USA) using a Grace Altima HP AQ RP-C18 column (150 � 4.6 mm, 3 mm). The
mobile phase contained water (A) and acetonitrile/water (20 : 80, v/v, B). Chromato-
graphic resolution was performed at 30oC with 1 cm3/min flow rate and the following
gradient program: linear gradient rinsing from 5% B to 100% B within 10 min and then
isocratic separation with 100% B for 15 min. The chromatographic peaks were first
detected by DAD (Agilent Technologies, 1200 series, Wilmington, DE, USA) at 229
nm, then the identity of individual ds-glucosinolates was confirmed by API-ESI-MS
(Agilent Technologies, 6130 Quadrupole LC/MS, Wilmington, DE, USA). MS para-
meters were as follows: capillary voltage, 3000 V; fragmentor voltage, 120 V; drying
gas temperature, 350oC; gas flow (N2), 12 dm3/min; nebulizer pressure, 35 psig. The
instrument was operated both in positive and negative ion modes, scanning from m/z
100 to 800. The glucosinolates content of each sample was quantified by the internal
standard method using glucotropaeolin – method according to ISO protocols (ISO
Method 9167-1, 1992). However, in calculations of the content of individual glucosino-
lates, the updated UV response factors proposed by Clarke [24] were used. Glucosino-
lates concentrations are expressed in micromoles per gram of dry matter.
Statistical analysis
All analyses were carried out in three parallel replications and mean � standard
deviation (SD) were calculated for the values obtained (three independent pooled curly
Effect of Conventional Cooking on Changes in the Contents of Basic Composition... 469
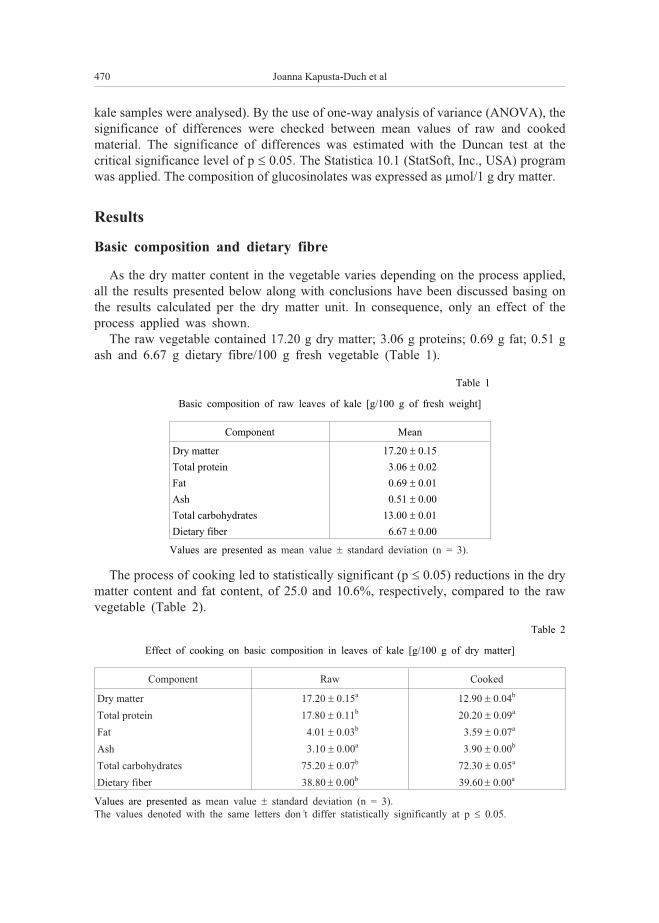
kale samples were analysed). By the use of one-way analysis of variance (ANOVA), the
significance of differences were checked between mean values of raw and cooked
material. The significance of differences was estimated with the Duncan test at the
critical significance level of p � 0.05. The Statistica 10.1 (StatSoft, Inc., USA) program
was applied. The composition of glucosinolates was expressed as �mol/1 g dry matter.
Results
Basic composition and dietary fibre
As the dry matter content in the vegetable varies depending on the process applied,
all the results presented below along with conclusions have been discussed basing on
the results calculated per the dry matter unit. In consequence, only an effect of the
process applied was shown.
The raw vegetable contained 17.20 g dry matter; 3.06 g proteins; 0.69 g fat; 0.51 g
ash and 6.67 g dietary fibre/100 g fresh vegetable (Table 1).
Table 1
Basic composition of raw leaves of kale [g/100 g of fresh weight]
Component Mean
Dry matter 17.20 � 0.15
Total protein 3.06 � 0.02
Fat 0.69 � 0.01
Ash 0.51 � 0.00
Total carbohydrates 13.00 � 0.01
Dietary fiber 6.67 � 0.00
Values are presented as mean value � standard deviation (n = 3).
The process of cooking led to statistically significant (p � 0.05) reductions in the dry
matter content and fat content, of 25.0 and 10.6%, respectively, compared to the raw
vegetable (Table 2).
Table 2
Effect of cooking on basic composition in leaves of kale [g/100 g of dry matter]
Component Raw Cooked
Dry matter 17.20 � 0.15a 12.90 � 0.04b
Total protein 17.80 � 0.11b 20.20 � 0.09a
Fat 4.01 � 0.03b 3.59 � 0.07a
Ash 3.10 � 0.00a 3.90 � 0.00b
Total carbohydrates 75.20 � 0.07b 72.30 � 0.05a
Dietary fiber 38.80 � 0.00b 39.60 � 0.00a
Values are presented as mean value � standard deviation (n = 3).
The values denoted with the same letters don’t differ statistically significantly at p � 0.05.
470 Joanna Kapusta-Duch et al

Simultaneously, the same process resulted in statistically significant increases (p � 0.05)
in the other components analysed like protein (13.4%), ash (25.8%) and dietary fibre
(2.27%), compared to the vegetable before processing.
Total and individual glucosinolates
In the analysed kale, the following 6 aliphatic glucosinolates were identified:
glucoiberin (GIB), progoitrin (PRO), sinigrin and glucoraphanin (SIN/GRA), gluco-
napin (GNA), glucoerucin (GER), as well as 3 indoles glucosinolates: glucobrassicin
(GBS), metoxybrassicin (MGBs) and neo-glucobrassicin (neoGBS).
Total glucosinolate content in the raw kale was 2.25 �mol/g dry matter (Table 3).
The content of aliphatic and indole glucosinolates in the total amount of these
compounds was similar, being 49 and 51%, respectively. There was no the presence of
aryl glucosinolates. The amounts of aliphatic and indole glucosinolates, expressed in
absolute values, were respectively 1.10 and 1.15 �mol/g dry matter of raw material;
sinigrin (SIN) and glucoraphanin (GRA) accounted for more than half of aliphatic
glucosinolates (54.4%) and almost one-third of the total glucosinolates content (26.7%).
Considering the absolute values, successive aliphatic glucosinolates occurring in raw
kale were glucoiberin (GIB) (0.22 �mol/g dry matter) and glucoerucin (GER) (0.21
�mol/g dry matter). The proportion of aliphatic glucosinolates in total glucosinolates
content was the lowest, for example, gluconapin (GNA) and progoitrin (PRO) occurred
in kale in trace amounts (approx. 0.04 �mol/g dry matter).
Table 3
Content of glucosinolates in fresh and cooked kale [�mol/g of dry matter]
Glucosinolates Kale raw Kale cooked
Glucoiberin 0.22 � 0.04a 0.98 � 0.04b
Progoitrin 0.04 � 0.02a 0.20 � 0.02b
Sinigrin/Glucorafanin 0.60 � 0.04a 2.34 � 0.02b
Gluconapin 0.04 � 0.00a 0.10 � 0.01b
Glucoerucin 0.21 � 0,02a 0.17 � 0,02a
Glucobrassicin 0.53 � 0.01b 0.09 � 0.02a
Metoxyglucobrassicin 0.11 � 0.02b 0.02� 0.00a
Neoglucobrassicin 0.50 � 0.03b 0.21 � 0.04a
Total gucosinolates 2.25 � 0.09a 4.21 � 0.10b
Values are presented as mean value � SD (n = 3) and expressed in dry matter. Means in
rows with different superscript letters in common differ significantly (p � 0.05)
Of the indole glucosinolates, the proportion of glucobrassicin (GBS) (46.5%) and
neoglucobrassicin (neoGBS) (43.8%) in this group was the largest; the remainder being
methoxyglucobrassicin (MGBS). In kale, glucobrassicin (GBS) content comprised
23.5% total glucosinolates amount (almost one-fourth), while neoglucobrassicin (neoGBS)
22.2%. On the other hand, after converting values to the vegetable dry matter, the
Effect of Conventional Cooking on Changes in the Contents of Basic Composition... 471

glucobrassicin (GBS) content in kale was 0.53 �mol/g, neoglucobrassicin (neoGBS)
0.50 �mol/g, and methoxyglucobrassicin (MGBS) 0.11 �mol/g.
As a result of cooking, there was a significant (p � 0.05) increase in the amount of
total glucosinolates (of 87.4%) compared to the raw vegetable. In each of the analysed
aliphatic glucosinolates increases were significant (p � 0.05); compared to the raw
vegetables they were of 345.0% (GIB); 455.5% (PRO); 290.5% (SIN/GRA); 150.0%
(GNA); and 40.0% (GER). Simultaneously, hydrothermal treatment resulted in a signi-
ficant (p � 0.05) reduction in the level of indole glucosinolates: of 82.8% (GBS); 78.2%
(MGBS); and 57.2% (neoGBS) compared to the raw vegetables.
Discussion
Basic composition
Dry mass
The content of dry matter in the raw kale was 17.2 g/100 g, which is similar to the
results reported by other authors. According to the literature, dry mass content in raw
kale fluctuates broadly from 10.4 to 21.19 g/100 g fresh vegetable [2, 25–27]. The dry
matter content in the vegetable is affected by many factors, which may include variety
as well as climatic conditions and agro-technical practices. This experiment revealed
that during cooking dry matter content decreased by 25.0%. In the study of Florkiewicz
et al [28] and Volden et al [14] cooking of fresh cauliflower and red cabbage caused
significant decrease of dry matter level. A decrease in dry matter due to heat treatment
in an aqueous environment may result from extraction of soluble components to water
and/or absorption of the water by tissues as well as leaving some water on the surface of
raw material, particularly if the surface is uneven and undulated [2]. On the other hand,
in the paper of Gebczynski and Kmiecik [29] the increase of dry matter content was
observed during boiling, probably because of the loss of water from the tissue and the
contraction of the raw material.
Protein
The results obtained in this work are close to the values found by other authors.
According to the literature data, protein content in raw kale ranges broadly from 2.4 to
9.6 g/100 g of the vegetable [27, 30, 31]. Protein in kale is regarded as the high grade
protein due to large amounts of essential amino acids such as glutamic acid, aspartic
acid, proline, and fewer levels of cysteine and methionine. The presence of above
compounds and other exogenic aminoacids corresponds to great nutritive value of kale
protein [27, 32]. As Almeida et al [33] reports, total protein content in kale is strongly
affected by the conditions of cultivation (fertilization, kind and composition of soil) and
variety. Deficiency of certain minerals in the soil, for example, phosphorous and
potassium has an effect on the quantity and quality of protein in the vegetable [34].
This study revealed that cooking led to a 13.4% increase in protein content. Slupski
et al [35] also reported that technological and culinary processing of New Zealand
472 Joanna Kapusta-Duch et al

spinach caused a significant increase in amino acid content in 100 g of edible portion,
except for methionine and cystine in frozen products prepared for eating. On the other
hand, Lisiewska et al [36] showed a 14% loss of protein during cooking Brussels
sprouts, while the losses in protein content found by Czapski [37] and Florkiewicz et al
[28] during cooking broccoli and cauliflower were of 15.6 and 10.5%, respectively. The
increase in protein content in dry matter of the cooked kale could result from more
efficient leaching of other constituents soluble in boiling water, which, in turn, increases
the proportion of these constituents in 100 g dry matter.
Fat
As was reported by Ayaz et al [30], kale leaves contain mainly linoleic, �-linolenic
and palmitic acids. In this work, the fat content in the examined raw kale was minimal
(0.69 g per 100 g fresh weight of the vegetable) that almost fully agrees with the
amounts found by Sikora and Bodziarczyk [27] and Skapski and Dabrowska [38],
which were respectively 0.67 g and 0.4–1.3 g/100 g fresh vegetable. The process of
cooking, investigated in this experiment, resulted in a 10.6% reduction of this
component. Greater losses due to cooking, amounting to 57%, were reported by the US
sources [39] and Florkiewicz et al [28] (25.3%), while Czapski [37] observed an
increase in the fat content of 10.8%, when cooking broccoli.
Ash
The ash content determined in the raw kale in this work was 0.51 g/100 g vegetable
fresh weight, which does not concur with the findings of other authors. Ash contents
reported by other authors were within the range 1.1–2.18 g [27, 38, 40]. The process of
cooking in this experiment, resulted in a 25.8% growth of this component, while
Florkiewicz et al [28] reported the opposite trend. Among the green leafy vegetables,
kale is an excellent source of minerals, especially accumulating high levels of calcium,
phosphorus and magnesium. Calcium is easily assimilated, mainly due to the lack of
oxalic acid, which limits its assimilation. Kale contains from 535 to 551 mg calcium,
117–106 mg magnesium [41], and 5.73 mg phosphorus per 1 g vegetable dry weight
[30]. The most important microelements in kale are iron, zinc and manganese [30].
According Fadigas et al [41], 100 g of kale contains from 1.48 to 2.13 mg iron,
1.95–2.63 mg zinc and 1.34–2.05 mg manganese. Hence, due to these constituents this
vegetable should be recommended, especially for children.
The apparent increase in ash content in dry matter of the cooked kale could result
from more efficient leaching or by a potential release of cellular bound of other
constituents soluble in boiling water, which increases the proportion of these consti-
tuents in 100 g dry matter.
Dietary fibre
The dietary fibre plays a significant role in the prevention of several diseases.
Brassica vegetables are an excellent source of dietary fibre. In kale, the proportion of
Effect of Conventional Cooking on Changes in the Contents of Basic Composition... 473

non-digestible carbohydrates, ie dietary fibre comprising mainly water insoluble
hemicelluloses and water soluble pectins responsible for the increased bacteria
proliferation in the colon, is significant and ranges from 0.8 to 3.8% [31]. The content
of dietary fibre in the examined raw kale was 6.67 g/100 g fresh vegetable weight,
which agrees with the findings of Sikora and Bodziarczyk [27] (7.40–9.56 g/100 g).
Thermal treatment of the examined vegetable, which was performed in this work, led to
the small increase in dietary fibre content of 2.27%. Czapski [37] and Komolka and
Gorecka [42] also observed an increase in dietary fibre content in other Brassicavegetables; the first in broccoli (26.9%) and the others in the white cabbage (56.7%),
red cabbage (60.5%), and the Italian cabbage (38.5%). During wet heat processing,
insoluble fibre can be broken into smaller fragments and then dissolved in the water.
In this study also the percentage of carbohydrates was calculated on as the difference
between 100 g of fresh product and the sum of water (g), total fat (g), protein (g) and
mineral compounds – ash (g). Fructose, glucose and sucrose are the major soluble
sugars found in kale leaves [30]. It has been found in this work that 100 g the raw kale
had 13.0 g total carbohydrates. The amounts reported by Sikora and Bodziarczyk [27]
and American sources [39] were slightly lower and were respectively 10.14 g/100 g and
10.1 g/100 g. As Skapski and Dabrowska [38] demonstrated, in kale sucrose prevails
over the simple sugars and the level of these constituents increases after the ground
frost.
Cooking applied in this experiment caused a 3.94% decrease in the content of the
aforementioned compounds. According to the USDA Nutrient Database for Standard
Reference [39], the losses in carbohydrates due to cooking amounted to 35.6%;
however, these noted by Czapski [37] in the cooked broccoli were much lower (10.8%).
Total and individual glucosinolates
The literature data on the total glucosinolates contents generally were close to the
results obtained in this work [10, 43]. On the other hand, the value reported by Korus et
al [16] much more exceeded the value obtained in the present work. According to the
authors, usually there are two processes responsible for the reduction in the levels of
glucosinolates: glucosinolates breakdown by myrosinase and thermal treatment of
vegetables. During the first one, the enzyme initiates the process of hydrolysis that leads
to an impairment of plant tissue and leakage of cell fluid [44]. The temperatures up to
60oC enhance the activity of myrosinase, while higher temperatures lead to inactivation
of the enzyme by denaturing the enzyme both in the cabbage and after leaking into the
cooking water [45]. With regard to the second process, substantial glucosinolates losses
due to this process were reported by Ciska and Kozlowska [46] and Volden et al [14].
Glucosinolates, as water-soluble, are leached out into the cooking water. Moreover,
their heat resistance is various [47]. Most authors stated a decline in the amount of
glucosinolates due to blanching and cooking in the selected Brassica vegetables, for
example, in Brussels sprouts, white and green cauliflower, broccoli, and curly kale [48];
in kale [2]; in broccoli [49]; in cauliflower [14]; in broccoli [50]; in Brussels sprouts
[51] or in cabbages [46, 52]. According to Kapusta-Duch et al [53] the process of
474 Joanna Kapusta-Duch et al
cooking Brassica vegetables caused a generally significant (p � 0.05) decrease in the
total glucosinolates content compared with raw vegetables: 6.6% in the rutabaga; 68.9%
in green cauliflower; and 69.2% in purple cauliflower. On the other hand, the authors
found the increase in the levels of certain individual glucosinolates in rutabaga. As for
the effects of different cooking techniques (boiling, steaming etc.) on glucosinolates
content, these reported in the literature are not so clear-cut. There are however reports in
the available literature, which indicate an increase in their amount resulting from
cooking, which partially agrees with the results obtained in the present work.
D’Antuono et al [54] reported that the total glucosinolates content was two-fold higher
in boiled cauliflower in comparison to raw. The authors reported that this was due to
higher extractability of these compounds in the cooked than in the raw plant tissues.
According to Vallejo et al [55], inactivation of myrosinase and a breakdown of plant
tissue upon heat provide partial explanation for their well-preserving or increase.
Gliszczynska-Swig³o et al [49] claimed that part of such molecules bound to the cell
walls is released only after a breakdown of cell structures.
Ciska et al [51] found that 5-minute cooking Brussels sprouts led to a significant
increase in the majority of aliphatic glucosinolates and one indole glucosinolates
compared to the raw vegetable. Such trend was observed for glucoiberin, progoitrin,
sinigrin, gluconapin, glucoraphanin, and glucobrassicin. However, these increases were
not as high as in this work. After 15-minute cooking Brussels sprouts, an increase was
significant only in case of glucoiberin and sinigrin. Extended cooking time (30 minutes)
caused losses in the number of all individual glucosinolates. Ciska et al [51], Oerlemans
et al [56] and Rosa and Heaney [57] noted that losses due to cooking were greatest in
the case of indole glucosinolates, which is consistent with our findings. According to
Vallejo et al [55], cooked broccoli contained significantly more glucoiberin, gluco-
alyssin, and progoitrin. Verkerk and Dekker (2004) and Oerlemans et al [56] observed
an increase in total glucosinolates in steamed and conventional boiled red cabbage of
60% and 35%, respectively, compared to the raw vegetable, while the increase of total
glucosinolates level determined by Roque-Sala [59] in Brussels sprouts was of 86%
when compared to those before steaming (steaming time – approx. 5 minutes). Ciska et
al [51] found that sinigrin and glucoraphanin showed the highest thermal stability
during cooking. On the other hand, Sosinska and Obiedzinski [60] noticed that there are
various factors affecting these differences, such as species, variety, storage conditions,
cooking time, and the degree of sample fragmentation. As was also reported by Miglio
et al [61], broccoli cooked by steaming had higher glucosinolates level compared to the
fresh ones but the level was also higher when compared to those cooked by
a conventional method. Numerous authors report that myrosinase is inactivated, for
example, after: 5 minutes [62]; 2–5 minutes, depending on the applied treatment
techniques [63]; or 4.8 minutes [58]. Researchers explain the phenomenon of an
increase in these compounds by extractiveness of glucosinolates from the vegetable
material after heating that in turn gives higher amounts of the glucosinolates accessible
to extraction and determination [60]. In order to reach maximum activity, myrosinase,
like other enzymes, must have appropriate conditions (pH, temperature, presence of
co-factors such as ions of iron and vitamin C or the presence of other proteins) [64].
Effect of Conventional Cooking on Changes in the Contents of Basic Composition... 475
The differences observed in glucosinolates thermal degradation may be caused by the
specific plant components negatively influencing glucosinolates stability. The higher
glucosinolates content in plant tissue, the higher is their sensitivity to heat degradation.
The process of cooking causes that some components, like glucosinolates, migrate into
water and become diluted. Probably, there may be another mechanism affecting the
variations in the glucosinolates thermal stability in different environments.
The results obtained indicate that further studies are needed to explain changes in
glucosinolates contents during convectional cooking not only kale, but other Brassicavegetables. As the results presented by other authors and those obtained in this work are
not clear-cut, the research problem seems to be interesting. Therefore, the aim should be
to optimize hydrothermal processes in order to make the best possible use of pro-health
substances occurring in Brassica vegetables in human nutrition.
Conclusions
The current study clearly shows that nutrient and health-promoting compounds in
kale are significantly affected by traditional cooking. Raw kale (var. Winterbor F1) was
characterized by the rich primary composition and the significant content of gluco-
sinolates.
The commonly used thermal processing method resulted in a statistically significant
(p � 0.05) increase in the level of total protein, ash, dietary fibre, total and aliphatic
glucosinolates and a substantial reduction in the content of fat, carbohydrates, total dry
matter, indole glucosinolates compared to the raw vegetable.
References
[1] Avato P, Argentieri MP. Brassicaceae: a rich source of health improving phytochemicals. Phytochem
Rev. 2015;14:1019-1033. DOI: 10.1007/s11101-015-9414-4.
[2] Olsen H, Grimmer S, Aaby K, Saha S, Borge GIA. Antiproliferative effects of fresh and thermal
processed green and red cultivars of curly kale (Brassica oleracea L. convar. Acephala var. Sabellica).
J Agric Food Chem. 2012;60(30):7375-7383. DOI: 10.1021/jf300875f.
[3] Fuentes F, Paredes-Gonzalez X, Kong ANT. Dietary glucosinolates sulforaphane, Phenethyl isothio-
cyanate, indole-3-carbinol/3,3’-diindolylmethane: Anti-oxidative stress/inflammation, Nrf2, epigenetics/
epigenomics and in vivo cancer chemopreventive efficacy. Curr Pharmac Rep. 2015;1:179-196.
DOI: 10.1007/s40495-015-0017-y.
[4] Hanschen FS, Lamy E, Schreiner M, Rohn S. Reactivity and stability of glucosinolates and their
breakdown products in foods. Angew Chem Int Ed. 2014;53(43):11430-11450.
DOI: 10.1002/anie.201402639.
[5] Barba FJ, Esteve MJ, Frígola A. Bioactive components from leaf vegetable products. Studies Natural
Products Chem. 2014;41:321-346. DOI: 10.1016/B978-0-444-63294-4.00011-5.
[6] Girgin N, El SN. Effects of cooking on in vitro sinigrin bioaccessibility, total phenols, antioxidant and
antimutagenic activity of cauliflower (Brassica oleraceae L. var. Botrytis). J Food Comp Anal.
2015;37:119-127. DOI: 10.1016/j.jfca.2014.04.013.
[7] Mithen RF, Dekker M, Verkerk R, Rabot S, Johnson IT. The nutritional significance, biosynthesis and
bioavailability of glucosinolates in human foods. J Sci Food Agric. 2000; 80(7):967-984.
DOI: 10.1002/(SICI)1097-0010(20000515)80:7<967:: AID-JSFA597>3.0.CO;2-V.
[8] Nugrahedi PY, Verkerk R, Widianarko B, Dekker M. A mechanistic perspective on process-induced
changes in glucosinolate content in brassica vegetables: A review. Crit Rev Food Sci Nutr.
2015;55(6):823-838. DOI: 10.1080/10408398.2012.688076.
476 Joanna Kapusta-Duch et al

[9] Tang L, Paonessa JD, Zhang Y, Ambrosone CB, MCcann SE. Total isothiocyanate yield from raw
cruciferous vegetables commonly consumed in the United States. J Funct Foods. 2013;5(4):1996-2001.
DOI: 10.1016/j.jff.2013.07.011.
[10] Verkerk R, Schreiner M, Krumbein A, Ciska E, Holst B, Rowland I, De Schrijver R, Hansen M,
Gerhäuser C, Mithen R, Dekker M. Glucosinolates in Brassica vegetables: the influence of the food
supply chain on intake, bioavailability and human health. Mol Nutr Food Res. 2009;53:S219.
DOI: 10.1002/mnfr.200800065.
[11] Rungapamestry V, Duncan AJ, Fuller Z, Ratcliffe B. Effect of cooking brassica vegetables on the
subsequent hydrolysis and metabolic fate of glucosinolates. Proc Nutr Soc. 2007;66(01):69-81.
DOI: 10.1017/S0029665107005319.
[12] Fimognari C, Turrini E, Ferruzzi L, Lenzi M, Hrelia P. Natural isothiocyanates: genotoxic potential
versus chemoprevention. Mutat Res Rev Mutat Res. 2012;750(2):107-131.
DOI: 10.1016/j.mrrev.2011.12.001.
[13] Kapusta-Duch J, Kopeæ A, Pi¹tkowska E, Borczak B, Leszczyñska T. The beneficial effects of Brassicavegetables on human health. Roczn Pañstw Zak³ Hig. 2012;63(4):389-395.
http://wydawnictwa.pzh.gov.pl/roczniki_pzh/the-beneficial-effects-of-brassica-vegetables-on-human-
health? lang=en
[14] Volden J., Bengtsson, B.G., Wicklund, T. Glucosinolates, L-ascorbic acid, totalphenols, anthocyanins,
antioxidant capacities and colour in cauliflower (Brassica oleracea L. ssp. Botrytis); effect of long-term
freezerstorage. Food Chem. 2009;112:967-976. DOI: 10.1016/j.foodchem.2008.07.018.
[15] Abdull Razis AF, Bagatta M, De Nicola GR, Iori R, Ioannides C. Intact glucosinolates modulate hepatic
cytochrome P 450 and phase II conjugation activities and may contribute directly to the chemopreventive
activity of cruciferous vegetables. Toxicology. 2010;277:74-85. DOI: 10.1016/j.tox.2010.08.080.
[16] Korus A, S³upski J, Gêbczyñski P, Banaœ A. Effect of preliminary processing and method of
preservation on the content of glucosinolates in kale (Brassica oleracea L. var. acephala) leaves. LWT.
Food Sci Technol. 2014;59:1003-1008. DOI: 10.1016/j.lwt.2014.06.030.
[17] Palermo M, Pellegrini N, Fogliano V. The effect of cooking on the phytochemical content of vegetables.
J Sci Food Agric. 2014;94:1057-1070. DOI: 10.1002/jsfa.6478.
[18] Polska Norma. 1990. PN-90/A-75101/03. Polski Komitet Normalizacyjny. Przetwory owocowe i wa-
rzywne – Przygotowanie próbek i metody badañ fizykochemicznych – Oznaczanie zawartoœci suchej
masy metod¹ wagow¹. [Polish Standard. 1990. PN-90/A-75101/03. Polish Committee for Standardiza-
tion. Fruit and vegetable products – Preparation of samples for physico-chemical studies – Determination
of dry matter content by gravimetric method]. http://sklep.pkn.pl/pn-a-75101-03-1990p.html.
[19] Polska Norma. 1998. PN-A-79011-8:1998. Polski Komitet Normalizacyjny. Koncentraty spo¿ywcze –
Metody badañ – Oznaczanie zawartoœci popio³u ogólnego i popio³u nierozpuszczalnego w 10 pro-
centowym (m/m) roztworze kwasu chlorowodorowego. [Polish Standard. PN-A-79011-8:1998. Polish
Committee for Standardization. Dry food mixes. Test methods. Determination of Total Ash and Ash
Insoluble in 10 Percent (m/m) Hydrochloric Acid]. http://sklep.pkn.pl/pn-a-79011-8-1998p.html.
[20] Polska Norma. 2004. PN-EN ISO 8968-1:2004. Polski Komitet Normalizacyjny. Mleko – Oznaczanie
zawartoœci azotu – Czêœæ 1: Metoda Kjeldahla. [Polish Standard. PN-EN ISO 8968-1:2004. Polish
Committee for Standardization. Milk – Determination of Nitrogen Content – Part 1: Determination of
nitrogen by the Kjeldahl method]. http://sklep.pkn.pl/pn-en-iso-8968-1-2004p.html.
[21] Polska Norma. 1998. PN-A-79011-4:1998. Polski Komitet Normalizacyjny. Koncentraty spo¿ywcze –
Metody badañ – Oznaczanie zawartoœci t³uszczu. [Polish Standard. PN-A-79011-4:1998. Polish
Committee for Standardization. Dry food mixes – Test methods – Determination of fat content].
http://sklep.pkn.pl/pn-a-79011-4-1998p.html.
[22] Polska Norma. 1998. PN-A-79011-15:1998P. Polski Komitet Normalizacyjny. Koncentraty spo¿ywcze –
Metody badañ – Oznaczanie zawartoœci b³onnika pokarmowego. [Polish Standard. PN-A-79011-15:
1998P. Polish Committee for Standardization. Dry food mixes – Test methods – Determination of
dietary fiber contents]. http://sklep.pkn.pl/pn-a-79011-15-1998p.html.
[23] Kusznierewicz B, Iori R, Piekarska A, Namieœnik J, Bartoszek A. Convenient identification of
desulfoglucosinolates on the basis of mass spectra obtained during liquid chromatography-diode
array-electrospray ionisation mass spectrometry analysis: Method verification for sprouts of different
Brassicaceae species extracts. J Chromatogr A. 2013;1278:108-115.
DOI: 10.1016/j.chroma.2012.12.075.
Effect of Conventional Cooking on Changes in the Contents of Basic Composition... 477

[24] Clarke DB. Glucosinolates, structures and analysis in food. Anal Methods. 2010;2:310-325.
DOI: 10.1039/B9AY00280D.
[25] Cao G, Sofic E, Prior RL. 1996. Antioxidant capacity of tea and common vegetables. J Agric Food
Chem. 1996;44:3426-3431. DOI: 10.1021/jf9602535.
[26] Lo Scalzo R, Genna A, Branca F, Chedin M, Chassaigne H. Anthocyanin composition of cauliflower
(Brassica oleracea L. var. botrytis) and cabbage (B. oleracea L. var. capitata) and its stability in relation
to thermal treatments. Food Chem. 2008;107:136-144. DOI: 10.1016/j.foodchem.2007.07.072.
[27] Sikora E, Bodziarczyk I. Composition and antioxidant activity of kale (Brassica oleracea L. var.
acephala) raw and cooked. Acta Sci Pol Technol Aliment. 2012;11(3):239-248.
http://www.food.actapol.net/pub/3_3_2012.pdf.
[28] Florkiewicz A, Filipiak-Florkiewicz A, Topolska K, Cieœlik E, Kostogrys RB. The effect of techno-
logical processing on the chemical composition of cauliflower. Ital J Food Sci. 2014;26(3):275-281.
http://search.proquest.com/openview/e1d3f1315dc3e8d8bd1f38d664dcc43e/1?pq-origsite=gscholar.
[29] Gêbczyñski P, Kmiecik W. Effects of traditional and modified technology, in the production of frozen
cauliflower, on the contents of selected antioxidative compounds. Food Chem. 2007;101(1):229-235.
DOI: 10.1016/j.foodchem.2006.01.021.
[30] Ayaz FA, Glew RH, Millson M, Huang HS, Chuang LT, Sanz C, Hayirlioglu-Ayaz S. Nutrient contents
of kale (Brassica olerace L. var. acephala DC.) Food Chem. 2006;96:572-579.
DOI: 10.1016/j.foodchem.2005.03.011.
[31] Kunachowicz H, Nadolna I, Przygoda B, Iwanow K. Tabele sk³adu i wartoœci od¿ywczej ¿ywnoœci. [The
nutritional value of selected food products and typical dishes]. Warszawa: Publishing house PZWL;
2016. http://www.ikamed.pl/tabele-skladu-i-wartosci-odzywczej-zywnosci-pzwl00463.
[32] Lisiewska Z, Kmiecik W, Korus A. The amino acid composition of kale (Brassica oleracea L. var.
acephala), fresh and after culinary and technological processing. Food Chem. 2008;108:642-648.
DOI: 10.1016/j.foodchem.2007.11.030.
[33] Almeida D, Rosa E, Monteiro AA. Protein and mineral concentration of Portuguese kale (Brassicaoleracea var. acephala) related to soil composition. Acta Hortic. 1996;407:269-276.
DOI: 10.17660/ActaHortic.1996.407.33.
[34] Eppendorfer WH, Søren, WB. Free and total amino acid composition of edible parts of beans, kale,
spinach, cauliflower and potatoes as influenced by nitrogen. J Sci Food Agric. 1996;71(4):449-458.
DOI: 10.1002/(SICI)1097-0010(199608)71:4<449::AID-JSFA601>3.0.CO;2-N.
[35] S³upski J, Achrem-Achremowicz J, Lisiewska Z, Korus A. Effect of processing on the amino acid
content of New Zealand spinach (Tetragonia tetragonioides Pall. Kuntze). Int J Food Sci Technol.
2010;45:1682-1688. DOI: 10.1111/j.1365-2621.2010.02315.x.
[36] Lisiewska Z, S³upski J, Skoczeñ-S³upska R, Kmiecik W. Content of amino acid and the quality of
protein in Brussels sprouts, both raw and prepared for consumption. Int J Refrig. 2009;32(2):272-278.
DOI: 10.1016/j.ijrefrig.2008.05.011.
[37] Czapski J. Cancer preventing properties of cruciferous vegetables. Veg. Crop. Res. Bull. 2009;70:5-18.
DOI: 10.2478/v10032-009-0001-3.
[38] Sk¹pski H, D¹browska B. Uprawa warzyw w polu. [Growing vegetables in the field]. Warszawa:
Publishing house SGGW; 1994.
http://krwil.pl/index.php?section=publications&subsection=pub_view&p=books.
[39] USDA Nutrient Database for Standard References. www.nal.usda.gov
[40] Emebu PK, Anyika JU. Proximate and mineral composition of kale (Brassica oleracea) grown in Delta
State, Nigeria. Pak J Nutr. 2011;10(2):190-194. DOI: 10.3923/pjn.2011.190.194.
[41] Fadigas CJ, Santos Dos MPA, Raildo MJ, Lima CD, Fragoso DW, David MJ, Ferreira LCS. Use of
multivariate analysis techniques for the characterization of analytical results for the determination of the
mineral composition of kale. Microchem J. 2010;96(2):352-356. DOI: 10.1016/j.microc.2010.06.006.
[42] Komolka P, Górecka D, Dziedzic K. The effect of thermal processing of cruciferous vegetables on their
content of dietary fiber and its fraction. Acta Sci Pol Technol Aliment. 2012;11(4):347-354.
http://www.food.actapol.net/pub/3_4_2012.pdf.
[43] Castro A, Aires A, Rosa E, Bloem E, Stulen I. Distribution of glucosinolates in Brassica oleracea culti-
vars. Phyton-Ann Rei Bot A. 2004;44:133-143. http://www.zobodat.at/pdf/PHY_44_1_0133-0143.pdf
[44] Jia CG, Xu CJ, Wei J, Yuan J, Yuan GF, Wang BL, Wang QM. Effect of modified atmosphere
packaging on visual quality and glucosinolates of broccoli florets. Food Chem. 2009;114(1):28-37.
DOI: 10.1016/j.foodchem.2008.09.009.
478 Joanna Kapusta-Duch et al
[45] Deng Q, Zinoviadou KG, Galanakis CM, Orlien V, Grimi N, Vorobiev E, Lebovka N, Barba FJ. The
effects of conventional and non-conventional processing on glucosinolates and its derived forms,
isothiocyanates: extraction, degradation, and applications. Food Eng Rev. 2015;7:357-381.
DOI: 10.1007/s12393-014-9104-9.
[46] Ciska E, Kozlowska H. The effect of cooking on the glucosinolates content in white cabbage. Eur Food
Res Technol. 2001;212(5):582-587. DOI: 10.1007/s002170100293.
[47] De Vos RH, Blijleven WGH. The effect of processing conditions on glucosinolates in cruciferous
vegetables. Z Lebensm Unters F A. 1988;187:525-529. DOI: 10.1007/BF01042383.
[48] Cieœlik E, Leszczyñska T, Filipiak-Florkiewicz A, Sikora E, Pisulewski PM. Effects of some
technological processes on glucosinolate contents in cruciferous vegetables. Food Chem.
2007;105:976-981. DOI: 10.1016/j.foodchem.2007.04.047.
[49] Gliszczyñska-Œwig³o A, Ciska E, Pawlak-Lemañska K, Chmielewski J, Borkowski T, Tyrakowska B.
Changes in the content of healthpromoting compounds and antioxidant activity of broccoli after
domestic processing. Food Addit Contam. 2006;23(11):1088-1098. DOI: 10.1080/02652030600887594.
[50] Yuan GF, Sun B, Yuan J, Wang QM. Effects of different cooking methods on health-promoting
compounds of broccoli. J Zhejiang Uni Sci B. 2009;10(8):580-588. DOI: 10.1631/jzus.B0920051.
[51] Ciska E, Drabiñska N, Honke J, Narwojsz A. Boiled Brussels sprouts: A rich source of glucosinolates
and the corresponding nitriles. J Funct Foods. 2015;19:91-99. DOI: 10.1016/j.jff.2015.09.008.
[52] Ciska E, Drabiñska N, Narwojsz A, Honke J. Stability of glucosinolates and glucosinolate degradation
products during storage of boiled white cabbage. Food Chem. 2016; 203:340-347.
DOI: 10.1016/j.foodchem.2016.02.079.
[53] Kapusta-Duch J, Kusznierewicz B, Leszczyñska T, Borczak B. Effect of cooking on the contents of
glucosinolates and their degradation products in selected Brassica vegetables. J Funct Foods.
2016;23:412-422. DOI: 10.1016/j.jff.2016.03.006.
[54] D’antuono LF, Elementi S, Neri R. Sensory attributes, health promoting aspects and new uses of edible
Brassicaceae. Acta Hortic. 2007;741:65-72. DOI: 10.17660/ActaHortic.2007.741.8.
[55] Vallejo F, Tomas-Barberan FA, Garcia-Viguera C. Glucosinolates and vitamin C content in edible parts
of Broccoli florets after domestic cooking. Eur Food Res Technol. 2002;215:310-316.
DOI: 10.1007/s00217-002-0560-8.
[56] Oerlemans K, Barrett DM, Bosch Suades C, Verkerk R, Dekker M. Thermal degradation of
glucosinolates in red cabbage. Food Chem. 2006;95:19-29. DOI: 10.1016/j.foodchem.2004.12.013.
[57] Rosa EAS, Heaney RK. The effect of cooking and processing on the glucosinolate content: studies on
four varieties of Portuguese cabbage and hybrid white cabbage. J Sci Food Agric. 1993;62:259-265.
DOI: 10.1002/jsfa.2740620309.
[58] Verkerk R, Dekker M. Glucosinolates and myrosinase activity in red cabbage (Brassica oleracea L. var.
Capitata f. rubra DC.) after various microwave treatments. J Agric Food Chem. 2004;52:7318-7323.
DOI: 10.1021/jf0493268.
[59] Roqué-Sala N. Thermal breakdown of glucosinolates in brussels sprouts. Modelling and validation in
a canning process. Wageningen, The Netherlands: Wageningen University; 2005.
[60] Sosiñska E, Obiedziñski MW. Effect of processing on the content of glucobrassicin and its degradation
products in broccoli and cauliflower. Food Control. 2011;22(8):1348-1356.
DOI: 10.1016/j.foodcont.2011.02.011.
[61] Miglio C, Chiavaro E,Visconti A, Fogliano V, Pellegrini N. Effects of different cooking methods on
nutritional and physicochemical characteristics of selected vegetables. J Agric Food Chem.
2008;56:139-147. DOI: 10.1021/jf072304b.
[62] Shapiro TA, Fahey JW, Wade KL, Stephenson KK, Talalay P. Chemoprotective glucosinolates and
isothiocyanates of broccoli sprouts: Metabolism and excretion in humans. Cancer Epidemiol.
Biomarkers Prev. 2001;10:501-508. http://cebp.aacrjournals.org/content/10/5/501.full.
[63] Rungapamestry V, Duncan AJ, Fuller Z, Ratcliffe B. Changes in glucosinolate concentrations,
myrosinase activity, and production of metabolites of glucosinolates in cabbage (Brassica oleracea var.
capitata) cooked for different durations. J Agric Food Chem. 2006;54(20):7628-7634.
DOI: 10.1021/jf0607314.
[64] Travers-Martin N, Kuhlmann F, Müller C. Revised determination of free and complexed myrosinase
activities in plant extracts. Plant Physiol Biochem. 2008;46:506-516.
DOI: 10.1016/j.plaphy.2008.02.008.
Effect of Conventional Cooking on Changes in the Contents of Basic Composition... 479

WP£YW GOTOWANIA NA ZMIANY ZAWARTOŒCI SK£ADU PODSTAWOWEGO
I GLUKOZYNOLANÓW W JARMU¯U
1 Katedra ¯ywienia Cz³owieka, Uniwersytet Rolniczy w Krakowie2 Katedra Chemii, Technologii i Biotechnologii ¯ywnoœci, Politechnika Gdañska
Abstrakt: Warzywa kapustne s¹ szczególnie zalecane w diecie ze wzglêdu na wysok¹ zawartoœæ sk³adników
biologicznie czynnych zawieraj¹cych siarkê, tj. glukozynolanów. Celem pracy by³o sprawdzenie jak zmie-
niaj¹ siê wybrane parametry jakoœci zdrowotnej jarmu¿u (tj. zawartoœæ: bia³ka, t³uszczu, popio³u, wêglowoda-
nów, b³onnika pokarmowego, suchej masy i glukozynolanów) pod wp³ywem tradycyjnego gotowania w wo-
dzie. W wyniku omawianego procesu zaobserwowano istotne statystycznie obni¿enie zawartoœci suchej masy,
t³uszczu oraz glukozynolanów indolowych, a tak¿e istotny statystycznie wzrost zawartoœci bia³ka, popio³u,
b³onnika pokarmowego oraz glukozynolanów alifatycznych, w stosunku do surowego warzywa.
S³owa kluczowe: jarmu¿, glukozynolany, proces gotowania, b³onnik pokarmowy, sk³ad podstawowy
480 Joanna Kapusta-Duch et al

Indexes


CONTENTS OF VOLUME 23
OF “ECOLOGICAL CHEMISTRY AND ENGINEERING A”
SPIS TREŒCI TOMU 23
KWARTALNIKA „CHEMIA I IN¯YNIERIA EKOLOGICZNA A”
Papers/Artyku³y
1
1. Marcin NIEMIEC, Barbara WIŒNIOWSKA-KIELIAN, Monika KOMOROWSKA,
Krzysztof ¯MUDA and Natalya KUZMINOWA – Content of Zinc and Lead in Water
and in Algae from Selected Black Sea Bays near Sevastopol . . . . . . . . . . 7
2. Izabela BOJAKOWSKA, Weronika BUREÆ-DREWNIAK and Bogus³aw WI£KOMIRSKI
– Dependence between the Content of Copper and the Content of Major Elements
in Sediments of Polish Lakes . . . . . . . . . . . . . . . . . . . . . . 21
3. Krzysztof BORYCZKO – Water Age in the Water Supply Network as Health Risk
Factor Associated with Collective Water Supply . . . . . . . . . . . . . . . 33
4. Marzena MATEJCZYK, Stanis³aw Józef ROSOCHACKI and Agata JAB£OÑSKA-
TRYPUÆ – Monitoring of Pharmaceutical Residues of Non-steroidal Drugs
with Use of Escherichia coli-gfp Biosensors . . . . . . . . . . . . . . . . . 45
5. Lidia D¥BROWSKA – Fractionation of Heavy Metals in Bottom Sediments and
Sewage Sludges Using Sequential Extraction . . . . . . . . . . . . . . . . . 63
6. Monika MIERZWA-HERSZTEK, Krzysztof GONDEK and Micha³ KOPEÆ – The Sulfur
Content in Soil after Application of Composted Materials Containing Foils . . . . . 77
7. Joanna KAPUSTA-DUCH, Teresa LESZCZYÑSKA and Barbara BORCZAK – Effect
of Packages on Nitrates and Nitrites Contents in Sauerkrauts . . . . . . . . . . . 89
8. Kamila MIZERNA and Justyna KUTERASIÑSKA – The Release of Leachable Constituents
from Copper Slag Depending on Conditions of the Leaching Process . . . . . . . . 101
2
9. Mariusz LENART and Tomasz OLSZOWSKI – Indoor-Outdoor Relations
for PM10 Mass Concentration Based on University Building . . . . . . . . . . . 127
10. Anna JANICKA, Daniel MICHNIEWICZ, Maria SKRÊTOWICZ, Kamil TRZMIEL,
Rados³aw WRÓBEL and Maciej ZAWIŒLAK – Exposure of the Driver Staying
Inside the Car Cabin to Volatile Organic Compounds . . . . . . . . . . . . . 139
11. Ma³gorzata KUTY£OWSKA – Prediction of Water Conduits Failure Rate
– Comparison of Support Vector Machine and Neural Network . . . . . . . . . . 147
12. El¿bieta BEZAK-MAZUR and Dagmara ADAMCZYK – Adsorption of Mixture
of Two Dyes on Activated Carbon . . . . . . . . . . . . . . . . . . . . 161
13. Krzysztof FR¥CZEK, Dariusz ROPEK and Anna LENART-BOROÑ – The Effect
of Heavy Metals on the Growth of Waterborne Escherichia coli of Municipal
Landfill Origin . . . . . . . . . . . . . . . . . . . . . . . . . . . . 173
14. Gabriela KAMIÑSKA, Mariusz DUDZIAK, Jolanta BOHDZIEWICZ
and Edyta KUDLEK – Effectivness of Removal of Selected Biologically Active
Micropollutants in Nanofiltration . . . . . . . . . . . . . . . . . . . . . 185
15. Milena RUSIN, Janina GOSPODAREK and Aleksandra NADGÓRSKA-SOCHA
– The Effect of Petroleum-Derived Substances on Chemical Composition
of Winter Wheat . . . . . . . . . . . . . . . . . . . . . . . . . . . 199
16. Karolina PETELA and Andrzej SZLÊK – Assesment of Passive Cooling
in Residential Application under Moderate Climate Conditions . . . . . . . . . . 211
17. Jakub SIKORA, Marcin NIEMIEC, Anna SZEL¥G-SIKORA, Micha³ CUPIA£
and Anna KLIMAS – Utilization of Post-Ferment from Co-Fermentation Methane
for Energy Purposes . . . . . . . . . . . . . . . . . . . . . . . . . . 227
18. Krzysztof SORNEK – The Impact of Micro Scale Combustion of Biomass Fuels
on Environment . . . . . . . . . . . . . . . . . . . . . . . . . . . 239
3
19. Andrzej D£UGOÑSKI and Marek SZUMAÑSKI – Use of Recreational Park Bio-Waste
as Locally Available Energy Resource . . . . . . . . . . . . . . . . . . . 265
20. El¿bieta S£ODCZYK and Dariusz SUSZANOWICZ – Optimization of Carbon Dioxide
Concentration in the Didactic Rooms by the Regulation of Ventilation . . . . . . . 275
21. Iwona DESKA and Katarzyna £ACISZ – The Possibility of the Light Non-Aqueous
Phase Liquids Migration in the Layered Porous Medium . . . . . . . . . . . . 287
22. Katarzyna PIETRUCHA-URBANIK and Andrzej STUDZIÑSKI – Surveys of Consumer
Preferences of the Operation and Management of Water Supply . . . . . . . . . 299
23. Anna KWIECIÑSKA, Tomasz ILUK and S³awomir STELMACH – Membrane Processes
in the Utilization of Wastewater Generated during Waste Gasification . . . . . . . 313
24. Alicja MACHNICKA and Ewelina NOWICKA – The Influence of Mechanical
and Thermal Disintegration on Gravitational Separation of Surplus Sludge . . . . . . 321
25. S³awomir WIERZBA and Tobiasz KORBECKI – Biosorption of Cr(III) from Aqueous
Solution by Activated Sludge . . . . . . . . . . . . . . . . . . . . . . 337
26. Anna CHRZAN – Assessment of Heavy Metal Contamination in Topsoil and Soil
Invertebrates from the Niepolomice Forest . . . . . . . . . . . . . . . . . 347
27. Joanna KAPUSTA-DUCH, Teresa LESZCZYÑSKA and Barbara BORCZAK – Influence
of Packages on Nutritional Quality of Pickled Chilled Stored Cucumbers . . . . . . 357
28. Izabela PIETKUN-GREBER – DC01 Steel Corrosion Resistance in Cathodic
Polarization . . . . . . . . . . . . . . . . . . . . . . . . . . . . . 373
4
29. Edyta £ASKAWIEC, Mariusz DUDZIAK and Joanna WYCZARSKA-KOKOT
– Assessment of the Possibility of Recycling Backwashing Water from the Swimming
Pool Water Treatment System . . . . . . . . . . . . . . . . . . . . . . 401
30. Pawe³ WOLSKI – Rheological Parameters of Initially Disintegrated Sewage Sludge
after Fermentation . . . . . . . . . . . . . . . . . . . . . . . . . . 411
31. Iwona ZAWIEJA – The Impact of Excess Sludge Disintegration on the Changes
of Total Organic Carbon Value . . . . . . . . . . . . . . . . . . . . . 421
32. Grzegorz KUSZA, Beata GO£UCHOWSKA and Magdalena SZEWCZYK – Changes
In Physicochemical Properties of Soils in the Area Affected by Lime Industry . . . . 433
33. Monika SPOREK and Tomasz CIESIELCZUK – Biomass Of Spring Barley (Hordeumvulgare L.) in Relation to Fertilising . . . . . . . . . . . . . . . . . . . 443
484 Indexes

34. Katarzyna GRATA – Sensitivity of Fusarium solani Isolated from Asparagus
on Essential Oils . . . . . . . . . . . . . . . . . . . . . . . . . . . 453
35. Joanna KAPUSTA-DUCH, Barbara KUSZNIEREWICZ, Teresa LESZCZYÑSKA
and Barbara BORCZAK – Effect of Conventional Cooking on Changes
in the Contents of Basic Composition and Glucosinolates in Kale . . . . . . . . . 465
Indexes 485


ADAMCZYK Dagmara (2) 161, 12
BEZAK-MAZUR El¿bieta (2) 161, 12BOHDZIEWICZ Jolanta (2) 185, 14BOJAKOWSKA Izabela (1) 21, 2BORCZAK Barbara (1) 89, 7; (3) 357, 27; (4) 465,
35BORYCZKO Krzysztof (1) 33, 3BUREÆ-DREWNIAK Weronika (1) 21, 2
CHRZAN Anna (3) 347, 26CIESIELCZUK Tomasz (4) 443, 33CUPIA£ Micha³ (2) 227, 17
D¥BROWSKA Lidia (1) 63, 5DESKA Iwona (3) 287, 21D£UGOÑSKI Andrzej (3) 265, 19DUDZIAK Mariusz (2) 185, 14; (4) 401, 29
FR¥CZEK Krzysztof (2) 173, 13
GO£UCHOWSKA Beata (4) 433, 32GONDEK Krzysztof (1) 77, 6GOSPODAREK Janina (2) 199, 15GRATA Katarzyna (4) 453, 34
ILUK Tomasz (3) 313, 23
JAB£OÑSKA-TRYPUÆ Agata (1) 45, 4JANICKA Anna (2) 139, 10
KAMIÑSKA Gabriela (2) 185, 14KAPUSTA-DUCH Joanna (1) 89, 7; (3) 357, 27;
(4) 465, 35KLIMAS Anna (2) 227, 17KOMOROWSKA Monika (1) 7, 1KOPEÆ Micha³ (1) 77, 6KORBECKI Tobiasz (3) 337, 25KUDLEK Edyta (2) 185, 14KUSZA Grzegorz (4) 433, 32KUSZNIEREWICZ Barbara (4) 465, 35KUTERASIÑSKA Justyna (1) 101, 8KUTY£OWSKA Ma³gorzata (2) 147, 11KUZMINOWA Natalia (1) 7, 1KWIECIÑSKA Anna (3) 313, 23
LENART Mariusz (2) 127, 9LENART-BOROÑ Anna (2) 173, 13LESZCZYÑSKA Teresa (1) 89, 7; (3) 357, 27; (4)
465, 35
£ACISZ Katarzyna (3) 287, 21
AUTHOR INDEX OF VOLUME 23
OF “ECOLOGICAL CHEMISTRY AND ENGINEERING A”
WYKAZ AUTORÓW PUBLIKACJI
ZAMIESZCZONYCH W TOMIE 23 KWARTALNIKA
„ECOLOGICAL CHEMISTRY AND ENGINEERING A /
CHEMIA I IN¯YNIERIA EKOLOGICZNA A”
Meaning of the digits in the index entries – (no. of issue) first page, no. of the article(in the volume contents).
Sposób zapisu odnoœników hase³ – (nr zeszytu) pierwsza strona artyku³u, nr artyku³u(w spisie treœci rocznika).

£ASKAWIEC Edyta (4) 401, 29
MACHNICKA Alicja (3) 321, 24MATEJCZYK Marzena (1) 45, 4MICHNIEWICZ Daniel (2) 139, 10MIERZWA-HERSZTEK Monika (1) 77, 6MIZERNA Kamila (1) 101, 8
NADGÓRSKA-SOCHA Aleksandra (2) 199, 15NIEMIEC Marcin (1) 7, 1; (2) 227, 17NOWICKA Ewelina (3) 321, 24
OLSZOWSKI Tomasz (2) 127, 9
PETELA Karolina (2) 211, 16PIETKUN-GREBER Izabela (3) 373, 28PIETRUCHA-URBANIK Katarzyna (3) 299, 22
ROPEK Dariusz (2) 173, 13ROSOCHACKI Stanis³aw Józef (1) 45, 4RUSIN Milena (2) 199, 15
SIKORA Jakub (2) 227, 17
SKRÊTOWICZ Maria (2) 139, 10S£ODCZYK El¿bieta (3) 275, 20SORNEK Krzysztof (2) 239, 18SPOREK Monika (4) 443, 33STELMACH S³awomir (3) 313, 23STUDZIÑSKI Andrzej (3) 299, 22SUSZANOWICZ Dariusz (3) 275, 20SZEL¥G-SIKORA Anna (2) 227, 17SZEWCZYK Magdalena (4) 433, 32SZLÊK Andrzej (2) 211, 16SZUMAÑSKI Marek (3) 265, 19
TRZMIEL Kamil (2) 139, 10
WIERZBA S³awomir (3) 337, 25WI£KOMIRSKI Bogus³aw (1) 21, 2WIŒNIOWSKA-KIELIAN Barbara (1) 7, 1WOLSKI Pawe³ (4) 411, 30WRÓBEL Rados³aw (2) 139, 10WYCZARSKA-KOKOT Joanna (4) 401, 29
ZAWIEJA Iwona (4) 421, 31ZAWIŒLAK Maciej (2) 139, 10¯MUDA Krzysztof (1) 7, 1
488 Indexes

SUBJECT INDEX
Meaning of the digits in the index entries – (no. of issue) first page, no. of the article(in the volume contents).
activated carbon (2) 161, 12activated sludge (3) 337, 25actual thickness (3) 287, 21aerosols (2) 127, 9air contamination (2) 127, 9alternative fuels (3) 313, 23antifungal activity (4) 453, 34antioxidant activity (3) 357, 27apparent thickness (3) 287, 21asparagus (4) 453, 34
backwashing (4) 401, 29basic composition (4) 465, 35bioaccumulation (1) 7, 1bioconcentration factor values (3) 347, 26biogas (2) 227, 17biologically active compounds (2) 185, 14biomass (2) 239, 18; (4) 443, 33bioremediation (2) 199, 15biosorption (3) 337, 25biotests (4) 401, 29Black Sea (1) 7, 1bottom sediment (1) 63, 5
calcium carbonate content (4) 433, 32car vehicle interior (2) 139, 10carbon dioxide concentration (3) 275, 20cathode polarization (3) 373, 28chemical disintegration (4) 421, 31chromium(III) (3) 337, 25clay minerals (1) 21, 2clean combustion (2) 239, 18cold stored (1) 89, 7; (3) 357, 27compost (1) 77, 6confined LNAPL (3) 287, 21consumer assessment (3) 299, 22contamination (1) 33, 3cooper slag (1) 101, 8copper (1) 21, 2
corn starch (1) 77, 6correlations (1) 21, 2corrosion resistance (3) 373, 28Cystoseira barbata (1) 7, 1cytotoxicity (1) 45, 4
Dactylis glomerata L. (1) 77, 6didactic rooms (3) 275, 20dietary fibre (4) 465, 35disintegration degree (4) 421, 31dry ice (3) 321, 24dye adsorption (2) 161, 12
electrical conductivity (4) 433, 32environmental monitoring (1) 45, 4Escherichia coli (2) 173, 13essential oils (4) 453, 34excess sludge (4) 421, 31
Fenton reagent (2) 161, 12fermentation (4) 411, 30Fusarium solani (4) 453, 34
gasification (3) 313, 23genotoxicity (1) 45, 4gfp biosensors (1) 45, 4glucosinolates (4) 465, 35grain yield (4) 443, 33gravitational separation sludge (3) 321, 24
heavy metals (1) 63, 5; (1) 101, 8; (2) 173, 13; (2)
199, 15; (3) 347, 26Hordeum vulgare (4) 443, 33hydrodynamic cavitation (3) 321, 24hydrogen (3) 373, 28hydrogen content (3) 373, 28
indoor air quality (2) 139, 10
iron compounds (1) 21, 2
kale (4) 465, 35
lakes (1) 21, 2layered porous medium (3) 287, 21leaching (1) 101, 8lime dusts (4) 433, 32LNAPL (3) 287, 21Lodz city (3) 265, 19
methyl blue (2) 161, 12micro scale systems (2) 239, 18microwave radiation (3) 321, 24mineral fertilization (4) 443, 33modelling (2) 147, 11municipal waste (2) 173, 13municipal waste landfill (2) 173, 13
nanofiltration (2) 185, 14naphthol green B (2) 161, 12Niepolomice Forest (3) 347, 26nitrates (1) 89, 7; (3) 357, 27nitrites (1) 89, 7; (3) 357, 27nocturnal sky (2) 211, 16non-steroidal anti-inflammatory drugs (1) 45, 4nutrients (2) 199, 15
optimization (3) 275, 20organic matter (1) 21, 2organic recycling (2) 227, 17
packaging (1) 89, 7; (3) 357, 27park bio-waste (3) 265, 19passive cooling (2) 211, 16PCA (2) 127, 9petroleum-derived substances (2) 199, 15pH (4) 433, 32phosphates (1) 21, 2physicochemical analysis (4) 401, 29pickled cucumbers (3) 357, 27pipelines (2) 147, 11pollution (1) 7, 1polyethylene (1) 77, 6predators (3) 347, 26proper rusty soils (4) 433, 32public building (2) 127, 9
radial basis functions (2) 147, 11recreational park (3) 265, 19regression methods (2) 147, 11regulation (3) 275, 20renewable energy (2) 227, 17residential cooling (2) 211, 16rheological parameters (4) 411, 30
saprophags (3) 347, 26sequential extraction procedures (1) 63, 5sewage sludge (1) 63, 5; (4) 411, 30soil (1) 77, 6solar collector (2) 211, 16sour red cabbage (1) 89, 7sour white cabbage (1) 89, 7SRFs (3) 313, 23stove-fireplace with accumulation (2) 239, 18sulphur (1) 77, 6surplus activated sludge (3) 321, 24swimming pool water (4) 401, 29
tars (3) 313, 23total organic carbon (TOC) (4) 421, 31toxicological assessment (4) 401, 29traditional cooking (4) 465, 35trophic groups (3) 347, 26
ultrasonic field (4) 411, 30Ulva rigida (1) 7, 1
ventilation (3) 275, 20vitamin C (3) 357, 27volatile fatty acids (VFAs) (4) 421, 31volatile organic compounds (2) 139, 10
waste disposal (2) 227, 17wastewater (3) 313, 23water (1) 7, 1water network (3) 299, 22water quality (1) 33, 3water supply network (1) 33, 3water supply system functioning analysis (3) 299,
22winter wheat (2) 199, 15
490 Indexes
INDEKS RZECZOWY
Sposób zapisu odnoœników hase³ – (nr zeszytu) pierwsza strona artyku³u, nr artyku³u(w spisie treœci rocznika).
adsorpcja barwników (2) 161, 12aerozole (2) 127, 9aktywnoœæ antyoksydacyjna (3) 357, 27aktywnoœæ przeciwgrzybowa (4) 453, 34analiza fizykochemiczna (4) 401, 29analiza funkcjonowania systemu zaopatrzenia w wo-
dê (3) 299, 22azotany(III) (1) 89, 7; (3) 357, 27azotany(V) (1) 89, 7; (3) 357, 27
bioakumulacja (1) 7, 1biogaz (2) 227, 17biomasa (2) 239, 18; (4) 443, 33bioodpady (3) 265, 19bioremediacja (2) 199, 15biosorpcja (3) 337, 25biotest (4) 401, 29b³êkit metylowy (2) 161, 12b³onnik pokarmowy (4) 465, 35budynki u¿ytecznoœci publicznej (2) 127, 9
ch³odzenie pasywne (2) 211, 16ch³odzenie radiacyjne (2) 211, 16chrom(III) (3) 337, 25Cystoseira barbata (1) 7, 1cytotoksycznoœæ (1) 45, 4czyste spalanie (2) 239, 18
drapie¿ne (3) 347, 26
energia odnawialna (2) 227, 17Escherichia coli (2) 173, 13
fermentacja (4) 411, 30fosforany (1) 21, 2Fusarium solani (4) 453, 34
genotoksycznoϾ (1) 45, 4
gfp biosensory (1) 45, 4gleba (1) 77, 6gleby rdzawe w³aœciwe (4) 433, 32glukozynolany (4) 465, 35grupy troficzne (3) 347, 26
jakoœæ powietrza wewnêtrznego (2) 139, 10jakoœæ wody (1) 33, 3jarmu¿ (4) 465, 35jeziora (1) 21, 2jêczmieñ jary (4) 443, 33
kapusta kiszona bia³a (1) 89, 7kapusta kiszona czerwona (1) 89, 7kawitacja hydrodynamiczna (3) 321, 24kolektor s³oneczny (2) 211, 16kompost (1) 77, 6korelacje (1) 21, 2kupkówka pospolita (1) 77, 6
lepkoœæ (4) 411, 30LNAPL (3) 287, 21lotne kwasy t³uszczowe (LKT) (4) 421, 31lotne zwi¹zki organiczne (2) 139, 10
materia organiczna (1) 21, 2membrany (3) 313, 23metale ciê¿kie (1) 63, 5; (1) 101, 8; (2) 173, 13; (2)
199, 15; (3) 347, 26metody regresyjne (2) 147, 11mi¹¿szoœæ pozorna (3) 287, 21mi¹¿szoœæ rzeczywista (3) 287, 21miedŸ (1) 21, 2minera³y ilaste (1) 21, 2modelowanie (2) 147, 11monitoring œrodowiskowy (1) 45, 4Morze Czarne (1) 7, 1

nanofiltracja (2) 185, 14napiêta LNAPL (3) 287, 21naprê¿enia styczne (4) 411, 30nawo¿enie (4) 443, 33niesterydowe przeciwzapalne leki (1) 45, 4nocny niebosk³on (2) 211, 16
ocena konsumencka (3) 299, 22ocena toksykologiczna (4) 401, 29odczynnik Fentona (2) 161, 12odpady komunalne (2) 173, 13odpornoœæ korozyjna (3) 373, 28ogólny wêgiel organiczny (OWO) (4) 421, 31ogórki kiszone (3) 357, 27olejki eteryczne (4) 453, 34opakowania metalizowane PET/met/PE (1) 89, 7;
(3) 357, 27opakowania strunowe z PE-LD (1) 89, 7; (3) 357,
27osad czynny (3) 337, 25osad czynny nadmierny (3) 321, 24osad denny (1) 63, 5osad œciekowy (1) 63, 5; (4) 411, 30osady nadmierne (4) 421, 31oœrodek porowaty o budowie warstwowej (3) 287,
21
park wypoczynkowy (3) 265, 19PCA (2) 127, 9pH (4) 433, 32piecokominek (2) 239, 18plon ziarna (4) 443, 33polaryzacja katodowa (3) 373, 28pole elektromagnetyczne (3) 321, 24pole ultradŸwiêkowe (4) 411, 30polietylen (1) 77, 6pop³uczyny (4) 401, 29procedury ekstrakcji sekwencyjnej (1) 63, 5proces gotowania (4) 465, 35przechowywanie ch³odnicze (1) 89, 7; (3) 357, 27przewodnictwo w³aœciwe (4) 433, 32pszenica ozima (2) 199, 15Puszcza Niepo³omicka (3) 347, 26py³y wapiennicze (4) 433, 32
radialne funkcje bazowe (2) 147, 11recykling organiczny (2) 227, 17regulacja (3) 275, 20
ruroci¹gi (2) 147, 11
sale dydaktyczne (3) 275, 20saprofagi (3) 347, 26siarka (1) 77, 6sieæ wodoci¹gowa (1) 33, 3; (3) 299, 22sk³ad podstawowy (4) 465, 35sk³adniki pokarmowe (2) 199, 15sk³adowisko odpadów komunalnych (2) 173, 13skrobia kukurydziana (1) 77, 6smo³y (3) 313, 23spalarnie bioodpadów (3) 265, 19SRF (3) 313, 23stê¿enie CO2 (3) 275, 20stopieñ dezintegracji (4) 421, 31substancje ropopochodne (2) 199, 15suchy lód (3) 321, 24systemy mikroskalowe (2) 239, 18szparagi (4) 453, 34
œcieki (3) 313, 23
Ulva rigida (1) 7, 1utylizacja odpadów komunalnych (2) 227, 17
wentylacja (3) 275, 20wêgiel aktywny (2) 161, 12witamina C (3) 357, 27w³asnoœci grawitacyjne osadu (3) 321, 24wnêtrze kabiny pojazdu (2) 139, 10woda (1) 7, 1wodór (3) 373, 28wody basenowe (4) 401, 29wskaŸnik biokoncentracji (3) 347, 26wymywalnoœæ (1) 101, 8wytwarzanie energii (3) 265, 19
zanieczyszczenia powietrza (2) 127, 9zanieczyszczenie (1) 7, 1; (1) 33, 3zawartoœæ wêglanu wapnia (4) 433, 32zawartoœæ wodoru (3) 373, 28zgazowanie (3) 313, 23zieleñ naftolowa B (2) 161, 12zwi¹zki aktywne biologicznie (2) 185, 14zwi¹zki ¿elaza (1) 21, 2
¿u¿el pomiedziowy (1) 101, 8
492 Indexes

INDEX OF LATIN, POLISH AND ENGLISH SPECIES NAMES
OF MICROORGANISMS, PLANTS AND ANIMALS
AND THEIR ANATOMICAL PARTS
WYKAZ £ACIÑSKICH, POLSKICH I ANGIELSKICH NAZW
MIKROORGANIZMÓW, ROŒLIN I ZWIERZ¥T
I ICH CZÊŒCI ANATOMICZNYCH
Meaning of the digits in the index entries – (no. of issue) first page, no. of the article(in the volume contents).
Sposób zapisu odnoœników hase³ – (nr zeszytu) pierwsza strona artyku³u, nr artyku³u(w spisie treœci rocznika).
asparagus (4) 453, 34
Cystoseira barbata (1) 7, 1
Dactylis glomerata L. (1) 77, 6drapie¿ne (3) 347, 26
Escherichia coli (2) 173, 13Fusarium solani (4) 453, 34
Hordeum vulgare (4) 443, 33
jarmu¿ (4) 465, 35jêczmieñ jary (4) 443, 33
kale (4) 465, 35
kupkówka pospolita (1) 77, 6
predators (3) 347, 26
pszenica ozima (2) 199, 15
saprofagi (3) 347, 26
saprophags (3) 347, 26
Ulva rigida (1) 7, 1
winter wheat (2) 199, 15


INDEX OF ACRONYMS
Meaning of the digits in the index entries – (no. of issue) first page, no. of the article(in the volume contents).
LNAPL – light non-aqueous phase liquids (3) 287, 21PCA – principal component analysis (2) 127, 9PE-LD – low density polyethylene (1) 89, 7; (3) 357, 27PET/met/PE – metalized polyethylene terephthalate (1) 89, 7; (3) 357, 27SRFs – solid recovered fuels (3) 313, 23TOC – total organic carbon (4) 421, 31VFAs – volatile fatty acids (4) 421, 31


WYKAZ AKRONIMÓW
Sposób zapisu odnoœników hase³ – (nr zeszytu) pierwsza strona artyku³u, nr artyku³u(w spisie treœci rocznika).
LKT – lotne kwasy t³uszczowe (4) 421, 31LNAPL – lekkie ciecze organiczne niemieszaj¹ce siê z wod¹ (3) 287, 21OWO – ogólny wêgiel organiczny (4) 421, 31PCA – analiza sk³adowych g³ównych (2) 127, 9PE-LD – polietylen o ma³ej gêstoœci (1) 89, 7; (3) 357, 27PET/met/PE – metalizowany politereftalan etylenu (1) 89, 7; (3) 357, 27SRFs – sta³e paliwa z odpadów (3) 313, 23


Varia


INVITATION FOR
ECOpole ’16 CONFERENCE
CHEMICAL SUBSTANCES IN ENVIRONMENT
We have the honour to invite you to take part in the 25th annual Central European
Conference ECOpole ’16, which will be held in 5–8.10.2016 (Wednesday–Saturday) in
Hotel Antalowka in Zakopane, PL.
The Conference Programme includes oral presentations and posters and will be
divided into four sections:
– SI Chemical Pollution of Natural Environment and Its Monitoring
– SII Environment Friendly Production and Use of Energy
– SIII Forum of Young Scientists and Environmental Education in Chemistry
– SIV Impact of Environment Pollution on Food and Human Health
The Conference language is English.
Contributions to the Conference will be published as:
– abstracts on the CD-ROM (0.5 page of A4 paper sheet format),
– extended Abstracts (6–8 pages) in the semi-annual journal Proceedings of ECOpole,
– full papers will be published in successive issues of the Ecological Chemistry andEngineering/Chemia i In¿ynieria Ekologiczna (Ecol. Chem. Eng.) ser. A or S.
Additional information one could find on Conference website:
ecopole.uni.opole.pl
The deadline for sending the Abstracts is 15th
July 2016 and for the Extended Abs-
tracts: 1st
October 2016. The actualized list (and the Abstracts) of the Conference con-
tributions accepted for presentation by the Scientific Board, one can find (starting from
31st
July 2016) on the Conference website.
The papers must be prepared according to the Guide for Authors on Submission of
Manuscripts to the Journals.
At the Reception Desk each participant will obtain abstracts of the Conference
contributions as well as the Conference Programme recorded on electronic media (the
Programme will be also published on the ECOpole ’16 website).

After the ECOpole ’16 Conference it will be possible to publish electronic version
of presented contributions (oral presentations as well as posters) on this site.
Further information is available from:
Prof. dr hab. in¿. Maria Wac³awek
Chairperson of the Organising Committee
of ECOpole ’16 Conference
University of Opole
email: [email protected]
phone: +48 77 401 60 42
fax +48 77 401 60 51
Conference series
1. 1992 Monitoring ’92 Opole
2. 1993 Monitoring ’93 Turawa
3. 1994 Monitoring ’94 Pokrzywna
4. 1995 EKO-Opole ’95 Turawa
5. 1996 EKO-Opole ’96 Kêdzierzyn KoŸle
6. 1997 EKO-Opole ’97 Duszniki Zdrój
7. 1998 CEC ECOpole ’98 Kêdzierzyn-KoŸle
8. 1999 CEC ECOpole ’99 Duszniki Zdrój
9. 2000 CEC ECOpole 2000 Duszniki Zdrój
10. 2001 CEC ECOpole ’01 Duszniki Zdrój
11. 2002 CEC ECOpole ’02 Duszniki Zdrój
12. 2003 CEC ECOpole ’03 Duszniki Zdrój
13. 2004 CEC ECOpole ’04 Duszniki Zdrój
14. 2005 CEC ECOpole ’05 Duszniki Zdrój
15. 2006 CEC ECOpole ’06 Duszniki Zdrój
16. 2007 CEC ECOpole ’07 Duszniki Zdrój
17. 2008 CEC ECOpole ’08 Piechowice
18. 2009 CEC ECOpole ’09 Piechowice
19. 2010 CEC ECOpole ’10 Piechowice
20. 2011 CEC ECOpole ’11 Zakopane
21. 2012 CEC ECOpole ’12 Zakopane
22. 2013 CEC ECOpole ’13 Jarno³tówek
23. 2014 CEC ECOpole ’14 Jarno³tówek
24. 2015 CEC ECOpole ’15 Jarno³tówek
502 Varia

ZAPRASZAMY DO UDZIA£U
W ŒRODKOWOEUROPEJSKIEJ KONFERENCJI ECOpole ’16
SUBSTANCJE CHEMICZNE
W ŒRODOWISKU PRZYRODNICZYM
w dniach 5–8 X 2016 r. w hotelu Anta³ówka w Zakopanem
Bêdzie to dwudziesta pi¹ta z rzêdu konferencja poœwiêcona badaniom podstawo-
wym oraz dzia³aniom praktycznym dotycz¹cym ró¿nych aspektów ochrony œrodowiska
przyrodniczego.
Doroczne konferencje ECOpole maj¹ charakter miêdzynarodowy i za takie s¹ uznane
przez Ministerstwo Nauki i Szkolnictwa Wy¿szego. Obrady konferencji ECOpole ’16
bêd¹ zgrupowane w czterech Sekcjach:
– SI Chemiczne substancje w œrodowisku przyrodniczym oraz ich monitoring
– SII Odnawialne Ÿród³a energii i jej oszczêdne pozyskiwanie oraz u¿ytkowanie
– SIII Forum M³odych (FM) i Edukacja proœrodowiskowa
– SIV Wp³yw zanieczyszczeñ œrodowiska oraz ¿ywnoœci na zdrowie ludzi
Materia³y konferencyjne bêd¹ opublikowane w postaci:
– abstraktów (0,5 strony formatu A4) na CD-ROM-ie,
– rozszerzonych streszczeñ o objêtoœci 6–8 stron w pó³roczniku Proceedingsof ECOpole,
– artyku³ów: w abstraktowanych czasopismach: Ecological Chemistry and Engineering/
Chemia i In¿ynieria Ekologiczna (Ecol. Chem. Eng.) ser. A i S oraz w pó³roczniku
Chemistry – Didactics – Ecology – Metrology (Chemia – Dydaktyka – Ekologia –Metrologia).
Termin nadsy³ania angielskiego i polskiego streszczenia o objêtoœci 0,5–1,0 stro-
ny (wersja cyfrowa) planowanych wyst¹pieñ up³ywa w dniu 15 lipca 2016 r., a roz-
szerzonych streszczeñ – 1 paŸdziernika 2016 r. Lista prac zakwalifikowanych przez
Radê Naukow¹ Konferencji do prezentacji bêdzie sukcesywnie publikowana od 31 lipca
2016 r. na stronie webowej konferencji. Aby praca (dotyczy to tak¿e streszczenia, które
powinno mieæ tytu³ w jêzyku polskim i angielskim, s³owa kluczowe w obydwu jêzy-
kach) przedstawiona w czasie konferencji mog³a byæ opublikowana, jej tekst winien byæ
przygotowany zgodnie z wymaganiami stawianymi artyku³om drukowanym w czaso-

pismach Ecological Chemistry and Engineering ser. A oraz S, które s¹ dostêpne w wie-
lu bibliotekach naukowych w Polsce i za granic¹. Zalecenia te s¹ równie¿ umieszczone
na stronie webowej Towarzystwa Chemii i In¿ynierii Ekologicznej:
tchie.uni.opole.pl
Wszystkie nadsy³ane prace podlegaj¹ zwyk³ej procedurze recenzyjnej.
Wszystkie streszczenia oraz program konferencji zostan¹ wydane na CD-ROM-ie,
który otrzyma ka¿dy z uczestników podczas rejestracji. Program bêdzie tak¿e umiesz-
czony na stronie webowej konferencji
ecopole.uni.opole.pl
Po konferencji bêdzie mo¿liwoœæ opublikowania elektronicznej wersji prezen-
towanego wyst¹pienia (wyk³adu, a tak¿e posteru) na tej stronie.
Prof. dr hab. in¿. Maria Wac³awek
Przewodnicz¹ca Komitetu Organizacyjnego
Konferencji ECOpole ’16
Wszelkie uwagi i zapytania mo¿na kierowaæ na adres:
[email protected] lub [email protected]
tel. 77 401 60 42 lub fax 77 401 60 51
504 Varia

GUIDE FOR AUTHORS
A digital version of the manuscript should be sent to:
Prof dr hab. Witold Wac³awek,
Editor-in-Chief of Ecological Chemistry and Engineering A
Uniwersytet Opolski
ul. kard. B. Kominka 6
45–032 Opole
Poland
phone +48 77 401 60 42, +48 77 455 91 49
fax +48 77 401 60 51
email: [email protected]
The Editor assumes, that an Author submitting a paper for publication has been
authorised to do that. It is understood the paper submitted to be original and unpub-
lished work, and is not being considered for publication by another journal. After
printing, the copyright of the paper is transferred to Towarzystwo Chemii i In¿ynieriiEkologicznej (Society for Ecological Chemistry and Engineering).
“Ghostwriting” and “guest authorship” are a sign of scientific misconduct. To counter-
act them, please provide information, for the Editor, on the percentage contribution of
individual Authors in the creation of publications (including the information, who is the
author of concepts, principles, methods, etc.). Editorial Board believes that the main
responsibility for those statements bears the Author sending the manuscript.
In preparation of the manuscript please follow the general outline of papers published
in Ecological Chemistry and Engineering A, available on the website:
tchie.uni.opole.pl
a sample copy can be sent, if requested.
Papers submitted are supposed to be written in English language and should include
a summary and keywords, if possible also in Polish language.
Generally, a standard scientific paper is divided into:
– Introduction: you present the subject of your paper clearly, indicate the scope of the
subject, present state of knowledge on the paper subject and the goals of your paper;
– Main text (usually divided into: Experimental – you describe methods used;
Results and Discussion);
– Conclusions: you summarize your paper;
– References.

The first page should include the author’s (authors’) given name(s) without titles or
scientific degrees like Prof., Ph.D., etc., their affiliations, phone and fax numbers and
their email addresses however, with the corresponding author marked by an asterisk.
It is urged to follow the units recommended by the Systéme Internationale d’Unites(SI). Graph axis labels and table captions must include the quantity units.
Symbols recommended by the International Union of Pure and Applied Chemistry (Pure
and Appl Chem. 1979;51:1-41) are to be followed. Graphics (drawings, plots) should be
supplied in the form of digital vector-type files, eg CorelDraw v.9, Excel, Inkscape or at
least in a bitmap format (TIF, JPG) 600 DPI. In the case of any query please feel free to
contact with the Editorial Office. Footnotes, tables and graphs should be prepared as se-
parate files. References cited chronologically should follow the examples given below:
[1] Lowe DF, Oubre CL, Ward CH. Surfactants and cosolvents for NAPL reme-
diation. A technology practices manual. Boca Raton: Lewis Publishers; 1999.
[2] Fasino CR, Carino M, Bombelli F. Oxidant profile of soy standardized extract.
In: Rubin R, Stryger CS, editors. Joint Meeting 2001 – Book Abstracts ‘2001
Year of Natural Products Research’. New York: Harper and Row; 2001.
[3] Wosiñski S. Effect of composition and processing conditions of ceramic and
polymer composites on the electric field shielding ability [PhD Thesis]. Poznañ:
Poznan University of Technology; 2010.
[4] Trapido M, Kulik N, Veressinina Y, Munter R. Water Sci Technol.
2009;60:1795-1801. DOI: 10.2166/wst.2009.585.
[5] Cañizares P, Lobato J, Paz R, Rodrigo MA, Sáez C. Chemosphere.
2007;67:832-838. DOI: 10.1016/j.chemosphere.2006.10.064.
[6] Hakala M, Nygård K, Manninen S, Huitari S, Buslaps T, Nilsson A, et al.
J Chem Phys. 2006:125:084504-1-7. DOI: 10.1063/1.2273627.
[7] Kowalski P. Statistical calibration of model solution of analytes. Ecol Chem Eng
A. Forthcoming 2016.
Please remember that every sign in the references counts.
Journal titles should preferably follow the Chem. Abst. Service recommended
abbreviations.
Each publication is evaluated by at least two independent Reviewers from outside of
the unit. In the case of paper written in a foreign language, at least one of Reviewers is
affiliated to a foreign institution other than the Author’s work.
As a rule double-blind review process is used (the Author(s) and Reviewers do not
know their identities). In any case Editor must be sure that no conflict of interest (direct
personal relationships, professional relationships, or direct scientific cooperation in the
past two years) occurs between the Reviewer and the Author. Reviewer has to fill in the
Reviewers report. On its end must be an explicit request to the approval of the article for
publication or its rejection.
Receipt of a paper submitted for publication will be acknowledged by email. If no
acknowledgement has been received, please check it with the Editorial Office by email,
fax, letter or phone.
In the case of any query please feel free to contact with the Editorial Office.
Editors
506 Varia

TECHNICAL EDITOR
Halina Szczegot
LAYOUT
Jolanta Brodziak
COVER DESIGN
Jolanta Brodziak
Druk: „Drukarnia Smolarski”, Józef Smolarski, 45–326 Opole, ul. Sandomierska 1. Objêtoœæ: ark. wyd. ???,
ark. druk. ???. Nak³ad: 150 egz. + 5 nadb. aut.
