ecologically representative distance measures for spatial modeling in stream networks erin peterson,...
Post on 20-Dec-2015
214 views
TRANSCRIPT

Ecologically representative distance measures for spatial modeling in stream networks
Erin Peterson, David M. Theobald, and Jay Ver Hoef
Natural Resource Ecology Laboratory
Colorado State University
Fort Collins, Colorado

This research is funded by
U.S.EPA �Science To AchieveResults (STAR) ProgramCooperativeAgreement # CR - 829095
This research is funded by
U.S.EPA �Science To AchieveResults (STAR) ProgramCooperativeAgreement # CR - 829095
The work reported here was developed under STAR Research Assistance Agreements CR-829095 awarded by the U.S. Environmental Protection Agency (EPA) to Colorado State
University. This presentation has not been formally reviewed by EPA. EPA does not endorse any products or commercial services
mentioned in this presentation.
Space-Time Aquatic Resources Modeling and Analysis Program

Overview~
IntroductionBackground
ObjectiveMethodology
ProductsImprovements
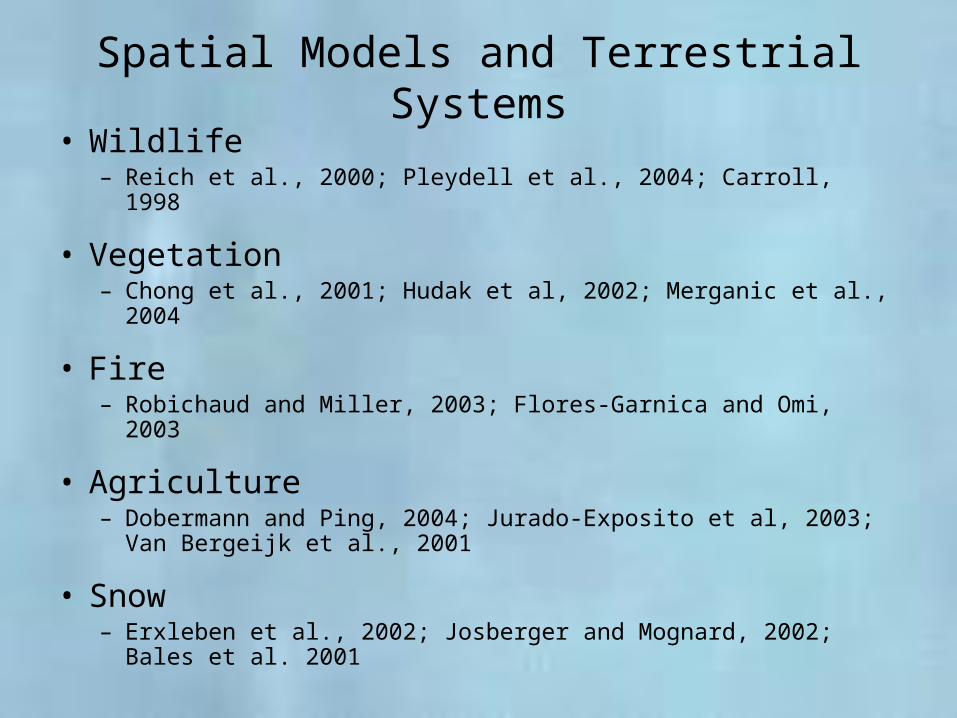
Spatial Models and Terrestrial Systems
• Wildlife– Reich et al., 2000; Pleydell et al., 2004; Carroll, 1998
• Vegetation– Chong et al., 2001; Hudak et al, 2002; Merganic et al., 2004
• Fire– Robichaud and Miller, 2003; Flores-Garnica and Omi, 2003
• Agriculture– Dobermann and Ping, 2004; Jurado-Exposito et al, 2003; Van
Bergeijk et al., 2001
• Snow– Erxleben et al., 2002; Josberger and Mognard, 2002; Bales et al.
2001
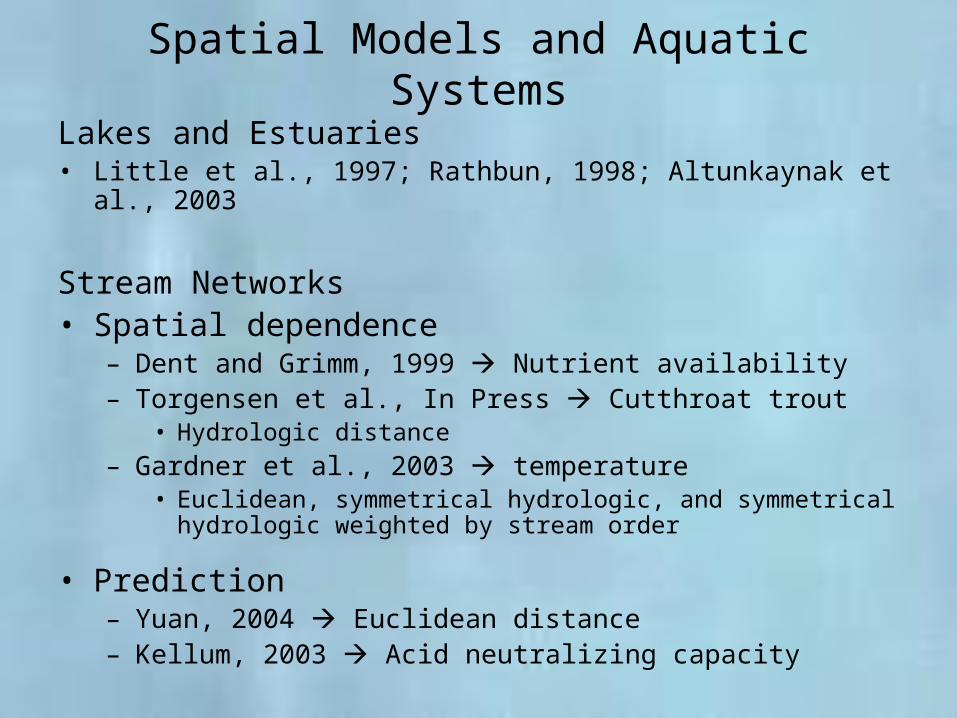
Spatial Models and Aquatic Systems
Lakes and Estuaries• Little et al., 1997; Rathbun, 1998; Altunkaynak et al., 2003
Stream Networks• Spatial dependence
– Dent and Grimm, 1999 Nutrient availability– Torgensen et al., In Press Cutthroat trout
• Hydrologic distance
– Gardner et al., 2003 temperature• Euclidean, symmetrical hydrologic, and symmetrical hydrologic
weighted by stream order
• Prediction– Yuan, 2004 Euclidean distance– Kellum, 2003 Acid neutralizing capacity

Distance measures for stream data
Stream data: chemical, physical, biological
Functional distances: Must represent the biological or ecological nature of the variable of interest
• Euclidean distance: Is it an appropriate measure of distance?– Influential continuous landscape variables: geology or
agriculture
• Symmetrical hydrologic distance– Hydrologic connectivity: Fish movement
• Asymmetrical hydrologic distance– Longitudinal transport of material: Benthic
macroinvertebrates or water chemistry
A
B
C
Distances and relationships are represented differently depending on
the distance measure
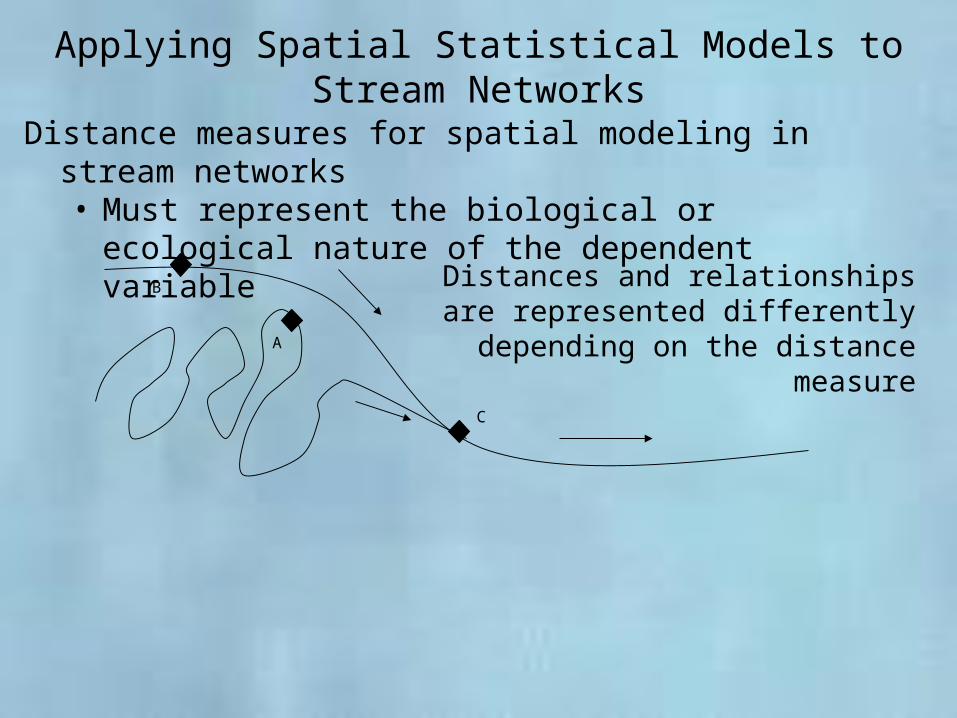
Applying Spatial Statistical Models to Stream Networks
Distance measures for spatial modeling in stream networks• Must represent the biological or ecological nature of the
dependent variable

Distances and relationships are represented differently depending on
the distance measure
Applying Spatial Statistical Models to Stream Networks
A
B
C
Distance measures for spatial modeling in stream networks• Must represent the biological or ecological nature of the
dependent variable
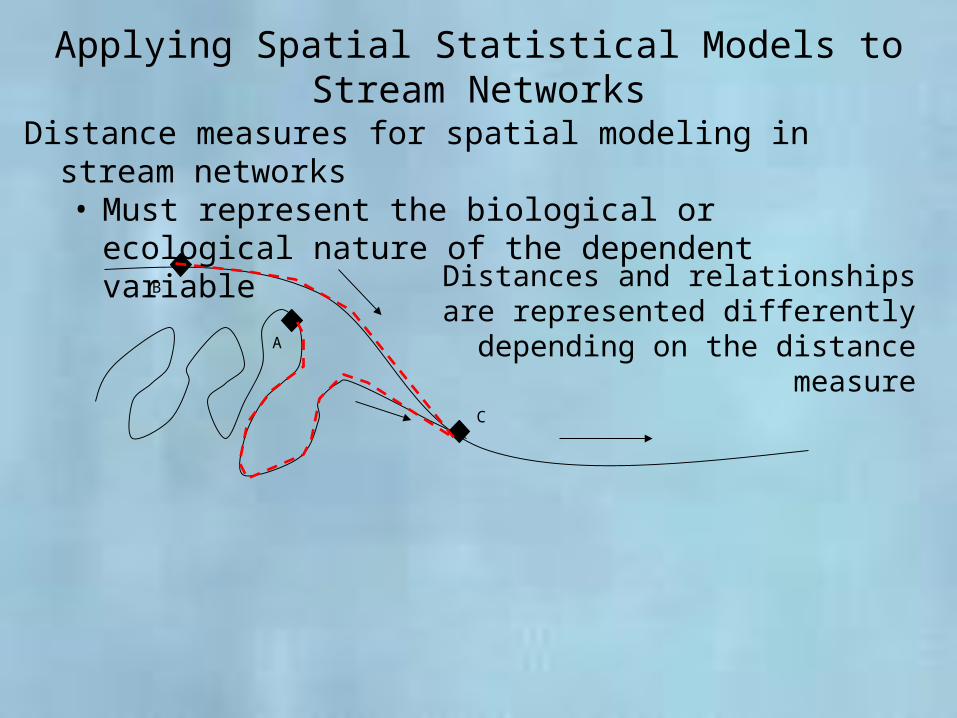
Distances and relationships are represented differently depending on
the distance measure
Applying Spatial Statistical Models to Stream Networks
A
B
C
Distance measures for spatial modeling in stream networks• Must represent the biological or ecological nature of the
dependent variable

Distances and relationships are represented differently depending on
the distance measure
Applying Spatial Statistical Models to Stream Networks
A
B
C
Distance measures for spatial modeling in stream networks• Must represent the biological or ecological nature of the
dependent variable

A
B
C
Distances and relationships are represented differently depending on
the distance measure
Applying Spatial Statistical Models to Stream Networks
Challenge: • Spatial autocovariance models developed for Euclidean
distance may not be valid for stream distances
Distance measures for spatial modeling in stream networks• Must represent the biological or ecological nature of the
dependent variable

New Spatial Statistical Models for Stream Networks
• Developed by Jay Ver Hoef, Alaska Department of Fish and Game (Ver Hoef et al., Submitted)
• Spatial statistical models for stream networks– Moving average models– Incorporate flow and use
hydrologic distance– Represents discontinuity at
confluences• Important for pollution monitoring
Flow

Measuring Hydrologic Distance
On the ground– Hip chain or tape measure
Manually using a map– Topographic maps or air photos– Scale master, string, straight edge
Geographical information system (GIS)– Gardner et al., 2003 ArcView script– Rathbun, 1998
• Estuaries: Digitizing shoreline, partition estuary and streams into convex polygons, and finding shortest path through polygons
– Torgensen et al., In Press • Coastal cutthroat trout in Oregon• ArcInfo AML

Objective
To develop the tools needed to
programmatically extract and format the spatial data necessary for spatial interpolation along stream networks

Flow Dependent Example
• Asymmetric hydrologic distance
• Weight tributaries by flow volume
Methodology
A
B
C

• Calculate reach contributing areas (RCAs) for each stream segment
• Accumulating RCAs: Calculate digitally derived explanatory variables and spatial weights
• Calculate hydrologic distance
• Calculate proportional influences
GIS Tools

• Automated = more efficient for large datasets– MAHA National Hydrography dataset (NHD) = 186,290
stream segments
– Sample points
• Hydrologic distance between every sample point and every other connected point
– Written in Visual Basic for Applications (VBA) using ArcObjects and ArcGIS version 8.3
• Use easily accessible input data with national coverage – NHD
– Digital elevation model (DEM)
• Free data!– Makes regional analysis more cost effective
Tool Requirements

Create reach contributing areas (RCAs)
• Methods and VBA program developed by David M. Theobald and John Norman
• Input Data: – NHD waterbodies and reaches, DEM, & flowdirection grid
• “Grows” contributing areas away from each stream segment using WATERSHED command– Stops at a depression in DEM
• “Bumps” RCA boundary at each iteration– Prevents boundary delineation at slight depression in DEM
• Output: – Overland hydrologic contributing area for each NHD segment
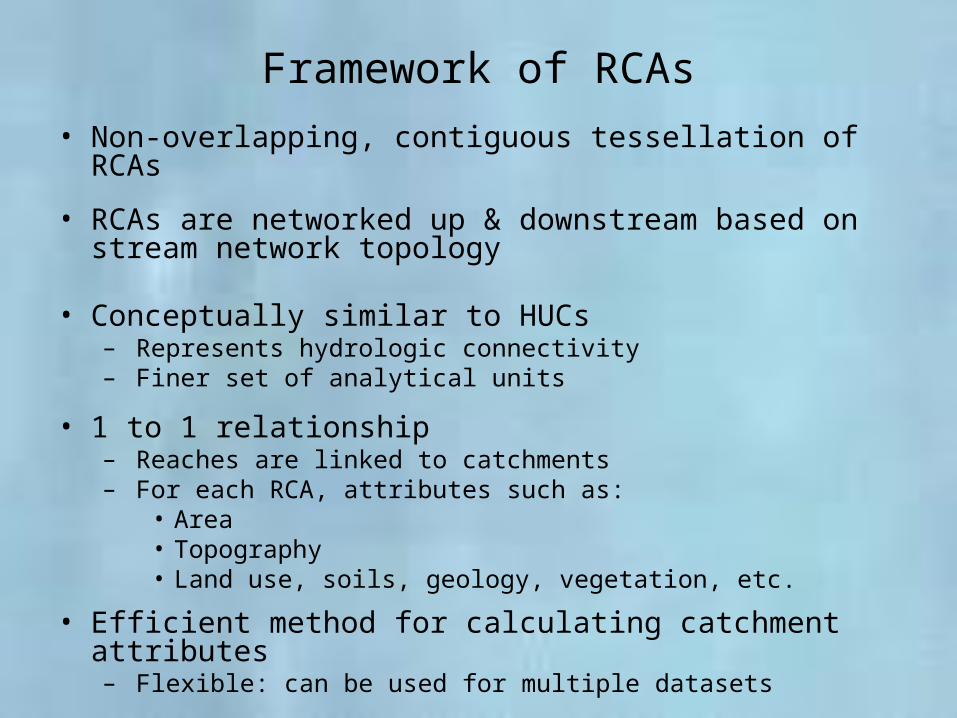
Framework of RCAs
• Non-overlapping, contiguous tessellation of RCAs
• RCAs are networked up & downstream based on stream network topology
• Conceptually similar to HUCs– Represents hydrologic connectivity– Finer set of analytical units
• 1 to 1 relationship– Reaches are linked to catchments– For each RCA, attributes such as:
• Area• Topography• Land use, soils, geology, vegetation, etc.
• Efficient method for calculating catchment attributes – Flexible: can be used for multiple datasets
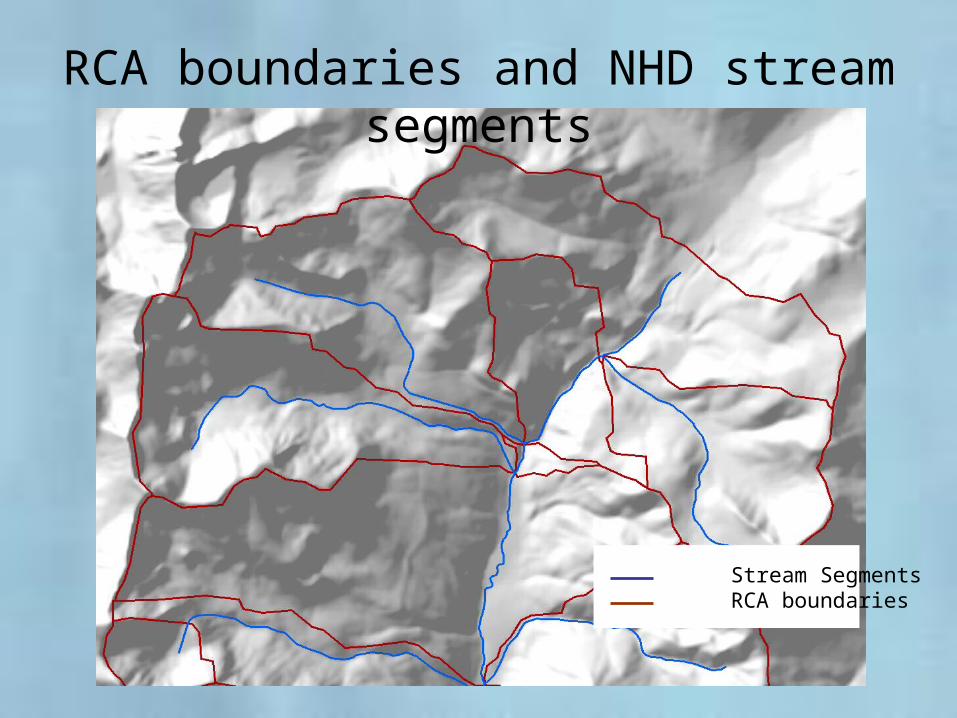
Stream Segments RCA boundaries
RCA boundaries and NHD stream segments

RCA Example
• US ERF1.2 & 1 km DEM: 60,833 RCAs
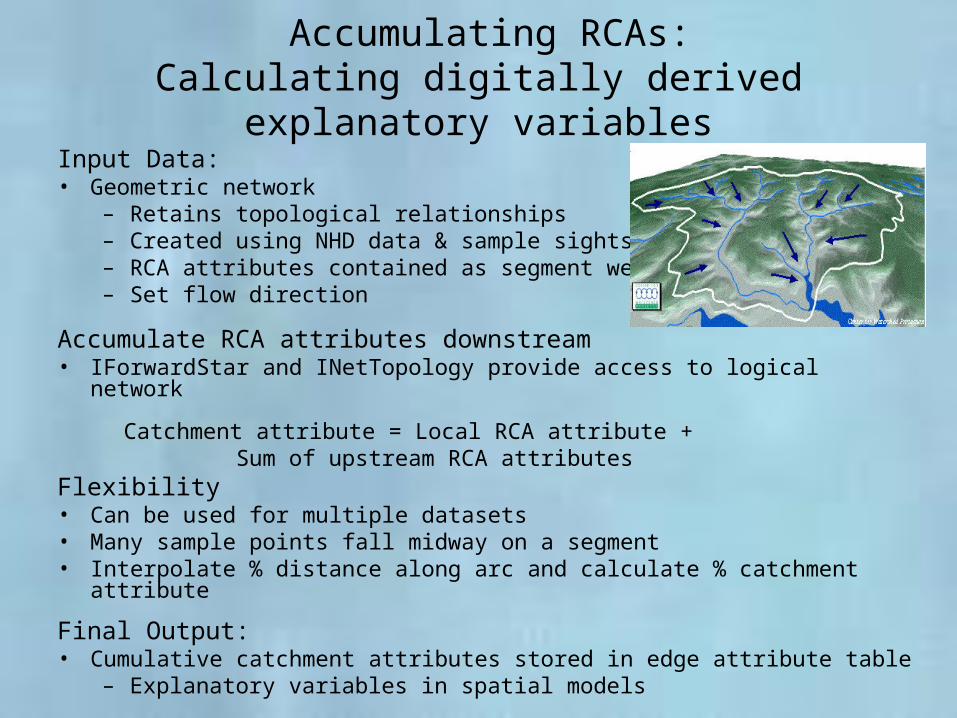
Accumulating RCAs:Calculating digitally derived explanatory variables
Input Data: • Geometric network
– Retains topological relationships– Created using NHD data & sample sights– RCA attributes contained as segment weights– Set flow direction
Accumulate RCA attributes downstream• IForwardStar and INetTopology provide access to logical network
Catchment attribute = Local RCA attribute + Sum of upstream RCA attributes
Flexibility• Can be used for multiple datasets• Many sample points fall midway on a segment • Interpolate % distance along arc and calculate % catchment attribute
Final Output: • Cumulative catchment attributes stored in edge attribute table
– Explanatory variables in spatial models
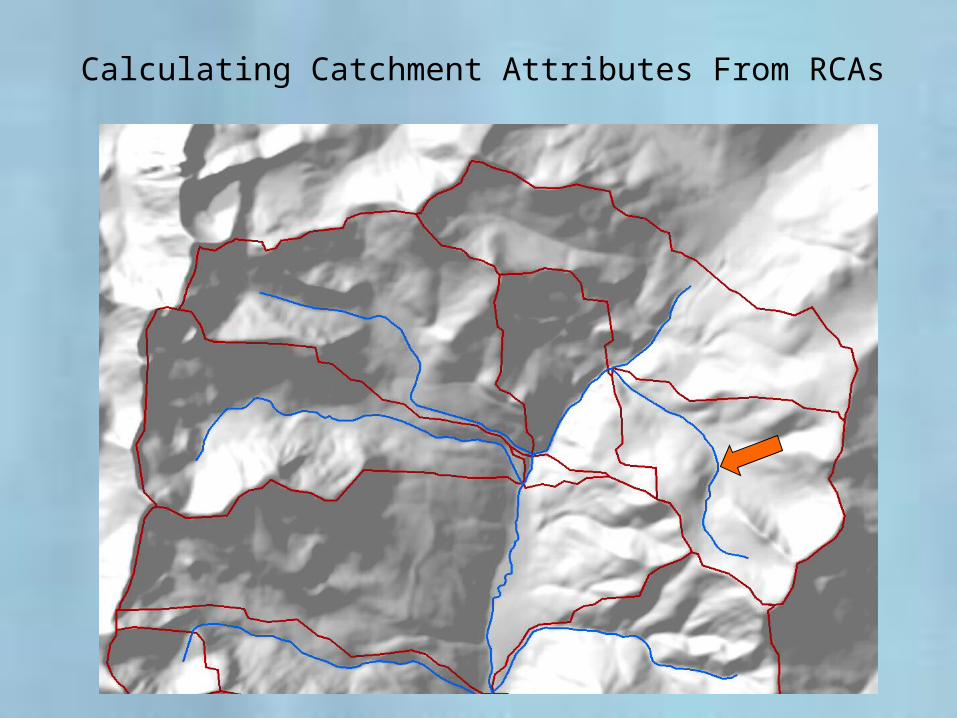
Calculating Catchment Attributes From RCAs
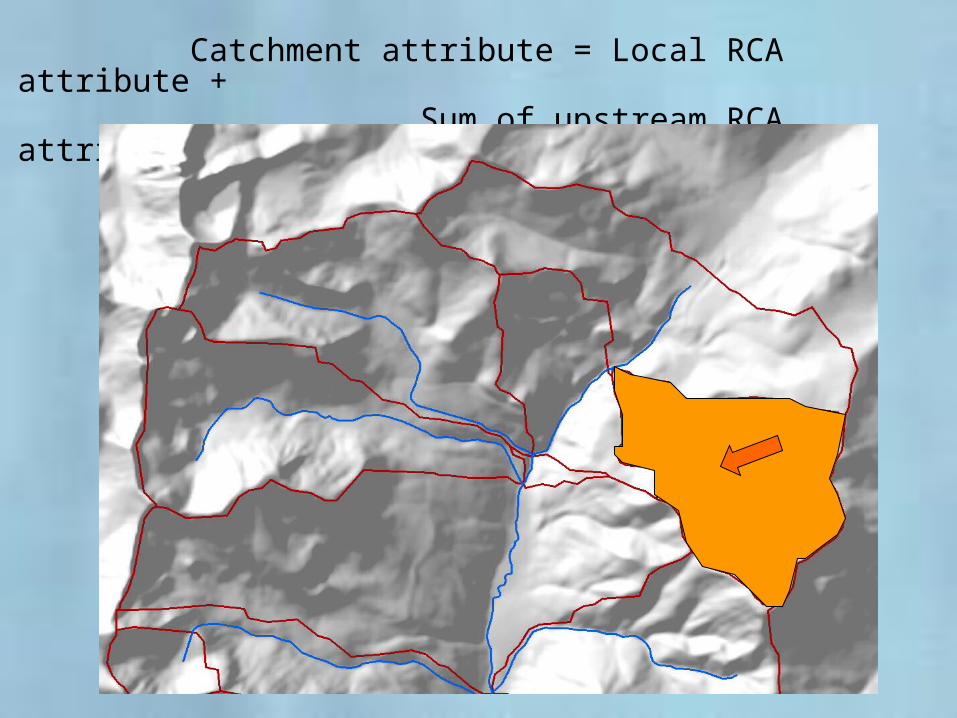
Catchment attribute = Local RCA attribute + Sum of upstream RCA attributes

Calculating Catchment Attributes From RCAs
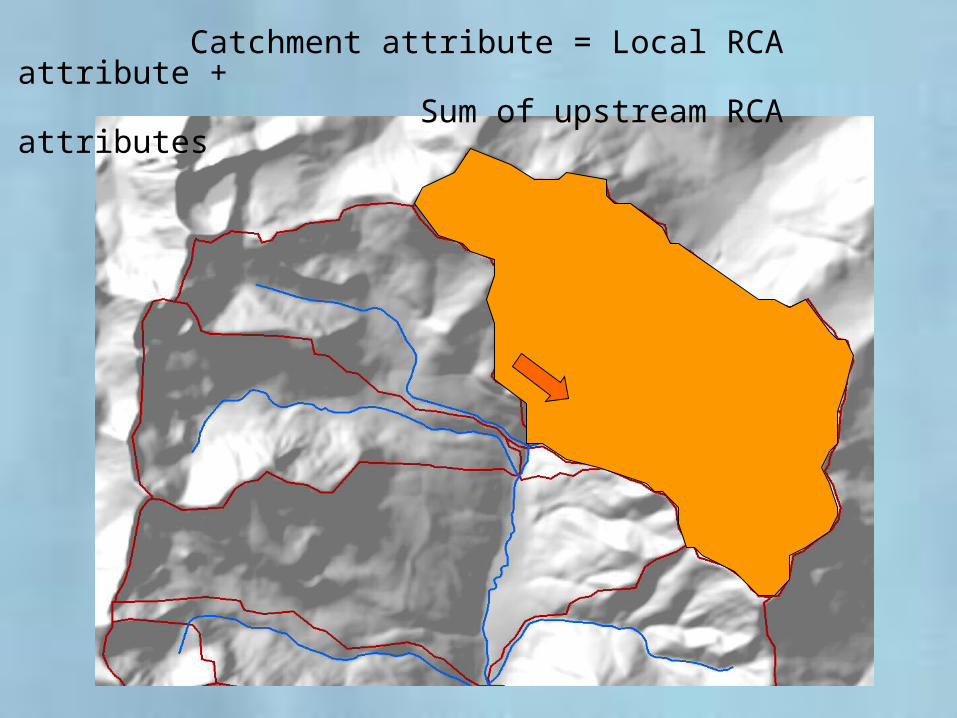
Catchment attribute = Local RCA attribute + Sum of upstream RCA attributes
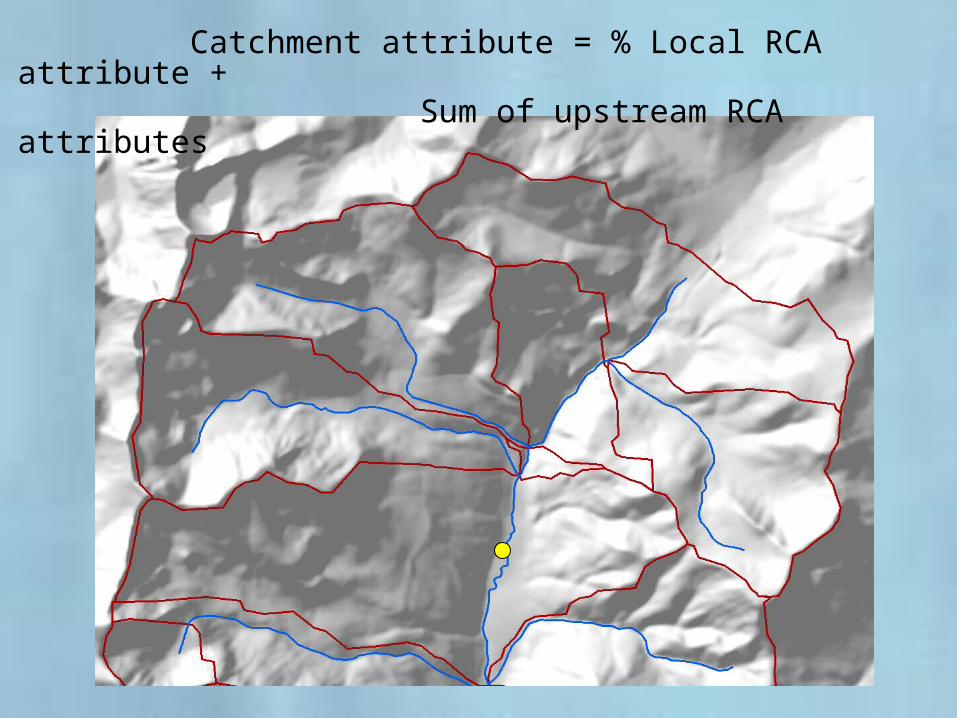
Catchment attribute = % Local RCA attribute + Sum of upstream RCA attributes

Catchment attribute = % Local RCA attribute + Sum of upstream RCA attributes
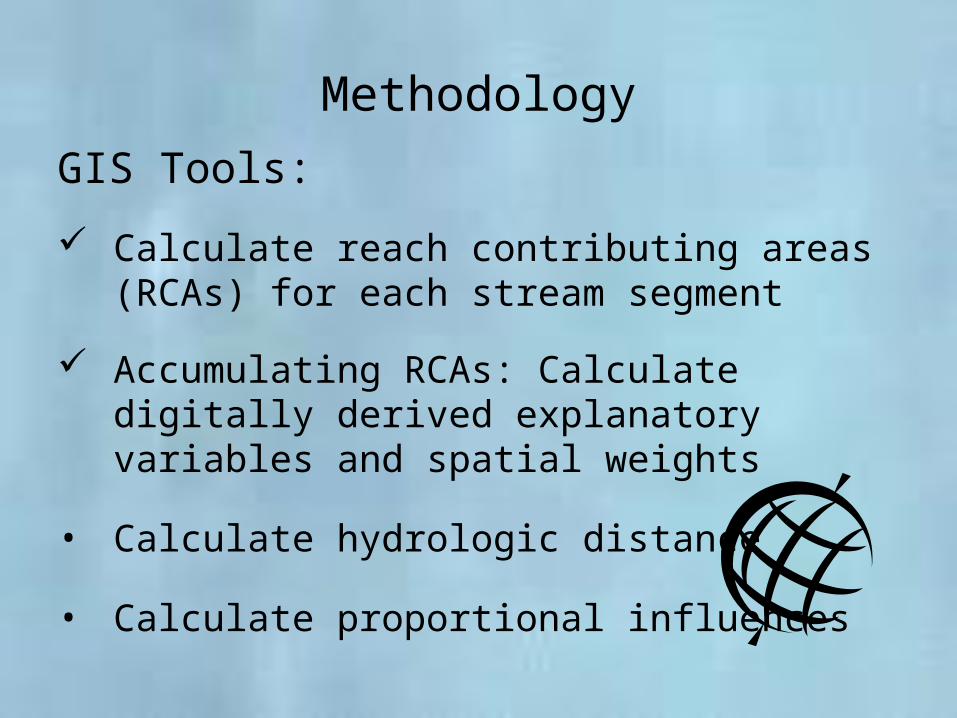
Methodology
GIS Tools:
Calculate reach contributing areas (RCAs) for each stream segment
Accumulating RCAs: Calculate digitally derived explanatory variables and spatial weights
• Calculate hydrologic distance
• Calculate proportional influences
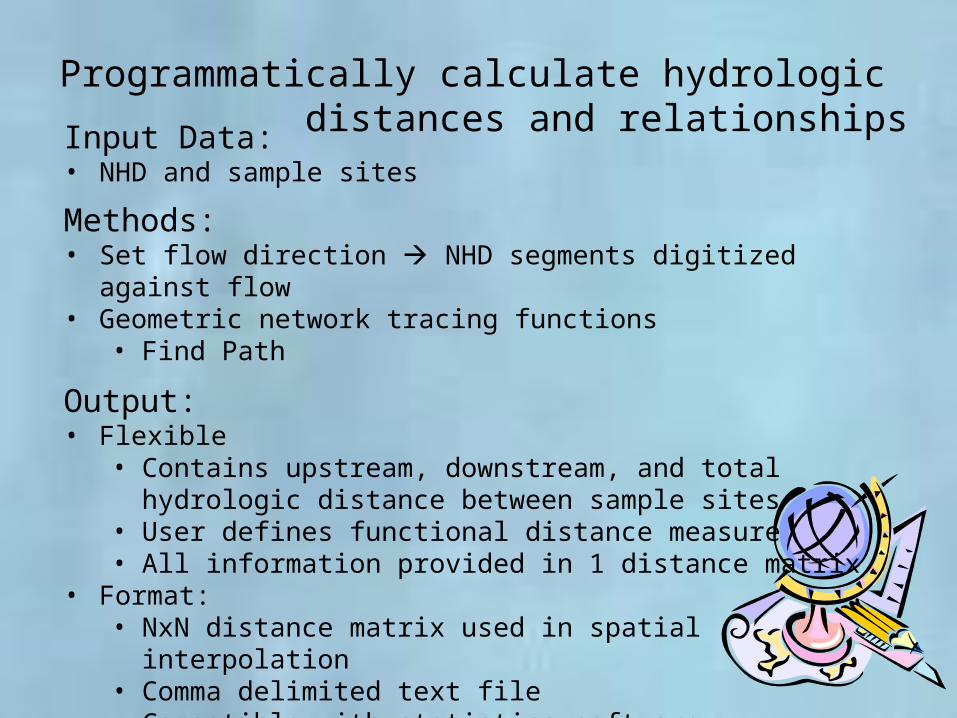
Input Data: • NHD and sample sites
Methods:• Set flow direction NHD segments digitized against flow• Geometric network tracing functions
• Find Path
Output: • Flexible
• Contains upstream, downstream, and total hydrologic distance between sample sites
• User defines functional distance measure• All information provided in 1 distance matrix
• Format: • NxN distance matrix used in spatial interpolation• Comma delimited text file• Compatible with statistics software
Programmatically calculate hydrologic distances and relationships

A
C
B
D
A B C D
A 0 2 5 7
B 3 0 6 8
C 3 3 0 5
D 0 0 0 0
Records downstream distance only• Contains information for:
• Downstream, upstream, and total distance
Distance Matrix

A
C
B
D
A B C D
A 0 2 5 7
B 3 0 6 8
C 3 3 0 5
D 0 0 0 0
C
B
D
Downstream distance A B = 2
A
Distance Matrix

A
C
B
D
A B C D
A 0 2 5 7
B 3 0 6 8
C 3 3 0 5
D 0 0 0 0
C
B
D
Upstream distance A B = Downstream distance B A = 3
A
Distance Matrix
A
C
B
D
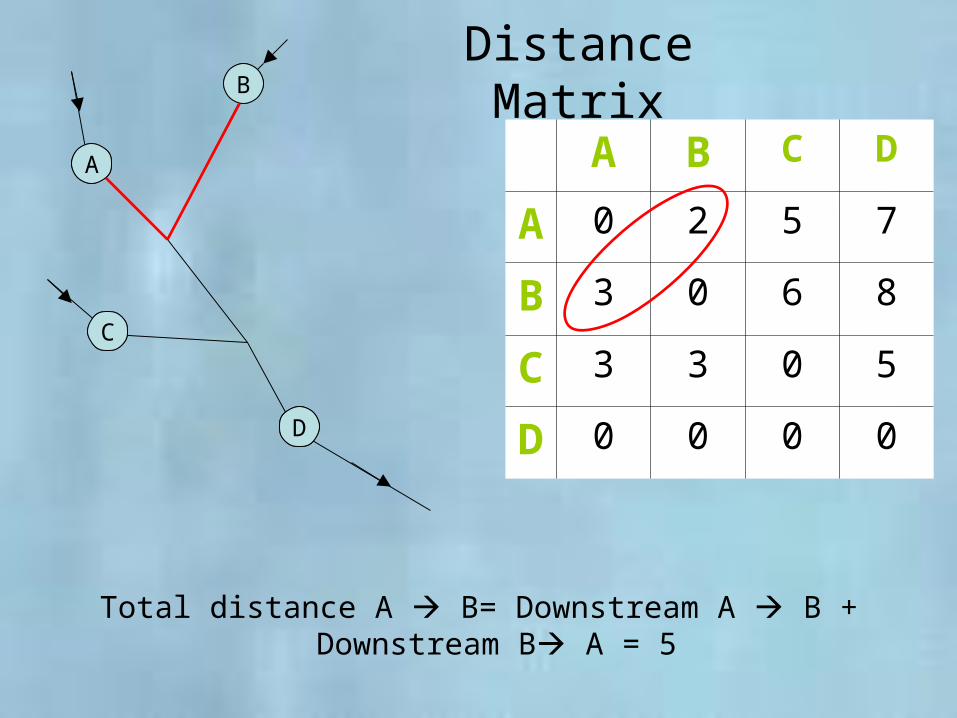
Distance Matrix
A B C D
A 0 2 5 7
B 3 0 6 8
C 3 3 0 5
D 0 0 0 0
C
B
D
Total distance A B= Downstream A B + Downstream B A = 5
A
AC
B1.0
0.6749
0.3251
0.5612
0.4312
0.1982
0.80181.0
1.0
Edge proportional influenceSample pointStream network
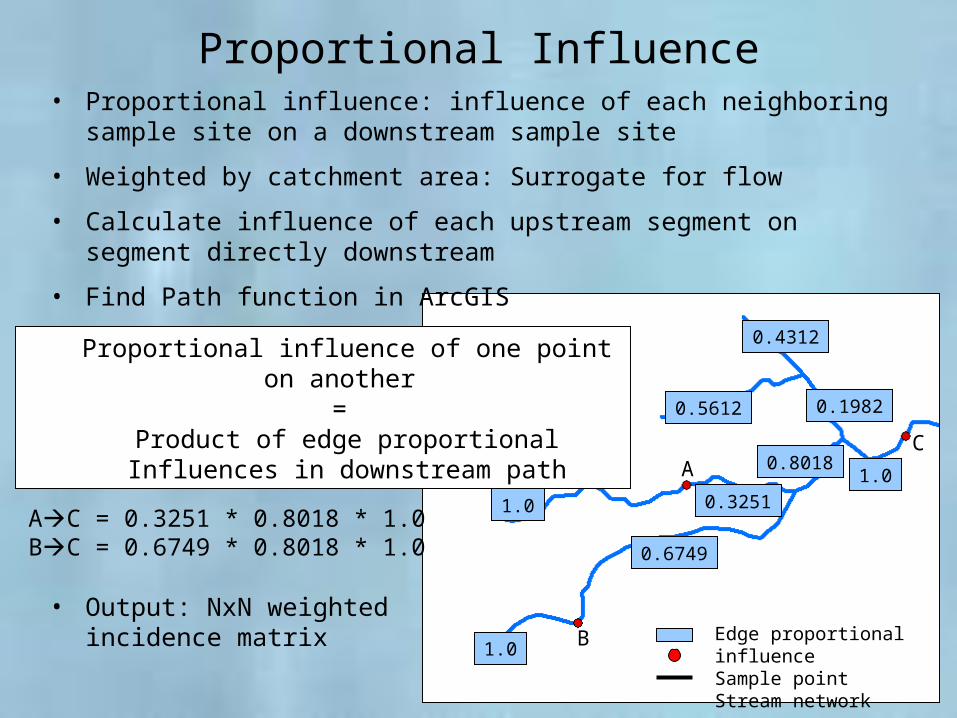
AC = 0.3251 * 0.8018 * 1.0BC = 0.6749 * 0.8018 * 1.0
Proportional Influence
Proportional influence of one point on another =
Product of edge proportional Influences in downstream path
• Output: NxN weighted incidence matrix
• Proportional influence: influence of each neighboring sample site on a downstream sample site
• Weighted by catchment area: Surrogate for flow
• Calculate influence of each upstream segment on segment directly downstream
• Find Path function in ArcGIS

ProductsData Required for Spatial Modeling
1. Observed values• Sample points
2. Explanatory variables• Catchment attributes: Area, landuse type, topography
3. NxN distance matrix• Hydrologic distance from every sample point to every other
sample point• Represents flow relationships
4. NxN weighted distance matrix• Neighbors weighted by catchment area• Surrogate for flow
• ArcGIS Version 9
• GeoNetwork– Not ESRI’s Geometric Network– Replaces the IForwardStar Object– Faster and more efficient
• Python scripts allow faster development & better user documentation
• Building the Functional Linkage of Watersheds and Streams (FLOWS) toolbox
Improvements
Future Research
• Collaborations between ecology, GIS, and statistics– Functional distances
• Can new functional distance measures be applied using existing statistical methods?
• Develop new statistical methods– Allow spatial models to
more accurately represent processes in aquatic systems

Questions?