economic crisis, innovation strategies and firm performance · mazzanti, pini, tortia, 2006;...
TRANSCRIPT

Economic Crisis, Innovation Strategies and Firm Performance.Evidence from Italian Firm-level Data
Davide Antonioli*♦, Annaflavia Bianchi♠♦, Massimiliano Mazzanti♦, Sandro Montresor♣, Paolo Pini♦
This version: August 2011
Abstract
Several empirical works have shown the robust and positive relation between growth and innovation at macroeconomic level and between firm economic performance and innovation at microeconomic level. However, the economists have had less opportunities to study such linkages during severe global downturns of the economic cycle. Moreover, the present disruptive economic downturn has forced the firms to implement survival strategies. One of such strategic behaviour regards the way of intervention on product and process areas through innovative actions. Focusing the attention on the micro level, the present work provides an empirical analysis on the basis of more than 500 Italian manufacturing firms located in Emilia-Romagna region, with the aim of disentangling the relations between pre-crisis innovation strategies with: on the one hand, firm economic performance during the crisis; on the other hand, innovative actions implemented to react to the recession’s challenges. The results suggest the existence of strong relationships between past innovative activities and the capacity to react to the challenges brought by the crisis through innovative actions along product, process and organization/HRM dimensions, although the role of complementarities among past innovative activities does not emerge robustly. When the dependent variables are performance indicators the impact of pre-crisis innovation strategies emerges as robust for technological and organizational spheres, while intense innovative activities before the crisis on spheres like ICT, training and environment seems to be detrimental for performances in the crisis
Keywords: innovation strategies, economic crisis, firm performance.
JEL classification: L1, L23, L6, O33
♦ University of Ferrara, Department of Economics Institutions and Territory; *Corresponding author: [email protected]
♠ Fondazione Faber
♣ University of Bologna, Department of Economics.

1. Introduction
A consistent amount of empirical works has shown the existence of a significant positive
relationship between growth and innovation, both at the macroeconomic level and at the
microeconomic one, that is between firms’ economic performance and their innovativeness. As for
the former, be enough to mention, for example, the works by Griliches (1995), Brynjolfsson and
Yang (1996) Lipsey, Carlaw, Bekar (2005), Pianta and Vaona (2007) and Bartel, Ichniowski and
Shaw (2005), as for the latter, those by Black and Lynch (2001), Caroli and Van Reenen (2001),
Hall, Lotti and Mairesse (2009) and Antonioli, Mazzanti, Pini (2010), among the others. In these
studies, the fact that innovation - not only technological, but also organizational - is an important
driver of growth and competitiveness, of both countries and firms, emerges as a general result,
which holds true across different geographical contexts and industrial sectors. Still, the same result
is generally obtained, and theoretically discussed, on the background of “normal” macroeconomic
conditions, that is in the absence of those severe global downturns which cyclically interrupt long-
term, growth trends (e.g. Reinhart, Rogoff, 2008).
The severity and pervasiveness of the economic recession brought about by the sub-prime
financial crisis burst in 2007 urged a re-analysis of the link between innovation and economic
performance in times of economic crises. For the Italian case the situation is even more peculiar
than that of other developed countries: the economic crisis has hit a stagnant economy, which had
shown a rate of growth of the GDP near zero since in the last decade, with a brief positive interval
in 2006-2007. The decline in productivity growth has opened a debate on its determinants (Faini,
Sapir, 2005; Brandolini, Bugamelli, 2009). Several structural factors have been called into question
to explain the stagnation of the Italian economy, ranging from the insufficient competitiveness of
the Italian economic system, to the dimensional problem of the Italian firms, passing through a
shortage in infrastructures or through an excessive rigidity of the labour market. If we do not take a
dogmatic position we can say it is likely the diverse determinants of the decline co-exist, summing
up each other negative effects on the economic growth, leading to the widening of the gap between
the growth of our economy and that of other developed countries.
Taking a wider look we may state that the experimented recession was detrimental for any
economy, however it has also opened a period of deep turmoil, not yet closed, creating new
business opportunities. The capacity of the economic actors, such as the firms, to react actively to
the challenges brought by the crisis, deeply influences the capacity of the whole economy to recover
in the medium run and to grow. Thus, given the economic crisis and the Italian economy situation it
becomes of extreme interest to verify for a sample of Italian firms their reaction to the crisis and
2

their economic performance, with a special focus on the determinants both of the strategic reaction
in the field of innovative activities and of the economic performance.
A sample of 555 manufacturing firms located in the Emialia-Romagna region were surveyed in
order to collect information concerning innovative strategies and economic performances, coupled
with several other information about firm level industrial and labour relations and working
conditions. The regional level choice is motivated by the regional nature of the so innovation
strategies of the firm, also spurred by regional subsidies rather than national ones, and because
Emilia-Romagna is one of the two most innovative regions (with Lombardia) in Italy (Regional
Innovation Scoreboard, 2009).The paper is organized as follows. The second section provides a
brief overview of the background literature, which is useful in defining the research questions of
this work. The third sections reports the data and the methodology used in the empirical part. The
fourth section is left to a brief description of firms reactions to the crisis and their performance. The
following section provides a discussion of the econometric results, while the last section is left to
conclusions and remarks.
2. Firms, innovation strategies and the economic crisis
The link between innovation and firm performance has been extensively investigated in
economic literature. However, the empirical analysis has often been directed to verify the effect
exerted by (or the linkage between) a single innovative activity on the economic performance, while
the innovative strategy of a firm should be considered in its all multifaceted aspects.
On the basis of recent empirical contributions we can distinguish between several types of
innovative areas: technology, ICT, organisation, training, environment and strategies of
internationalisation. As far as the first area (technology) is concerned we cannot neglect the strong
relation between technological progress and growth analysed by more than a century of economic
theory and tested at empirical level (Aghion, Howitt, 1998; Griliches, 1995; Pianta, Vaona 2007;
Hall, Lotti, Mairesse, 2009). Technological progress means several things but it has been mainly
conceived as innovation in product and process till the 90s, when the sharp and rapid diffusion of
ICT “stole the show” to the product and process innovations as main engine economic growth
(Brynjolfsson, Yang, 1996; Bartel, Ichniowski, Shaw, 2005; Morrison, 1997). Both innovations in
product and process and new ICT lead to productivity growth, especially when the phenomenon of
“productiviy pardox” is avoided thanks to the joint introduction of organisational practices that fit
the organisational environment of the firms and the workforce to better exploit the potential of the
new technologies (Hughes, Scott Morton, 2005). Thus, the organisational dimension and the
management practices (Bloom, Van Reenen, 2007) are crucial as they represent an innovation area
3
which deserves investments in order to directly generate better performances for the organisation
and it is also a ground that may sustain complementary innovation activities and investments in
other areas of innovation (Huselid, 1995; Huselid, Becker, 1996; Black, Lynch, 2001; Zwick, 2004;
Janod, Saint-Martin; 2004; Antonioli, Mazzanti, Tortia, Pini, 2004; Pini, Santangelo, 2005, 2010;
Mazzanti, Pini, Tortia, 2006; Antonioli, 2009; Antonioli, Mazzanti, Montresor, Pini, 2010). An
autonomous role in determining the economic growth, at macro level, and the productivity
performance of the firm, at micro level, can be assigned to the training activities adopted within the
firm, even if the training strategies might be included in the organisational area. In line with the
implications of the human capital theory several contributions have stressed the importance of a
better trained workforce in determining labour productivity (see among others Conti, 2005; Zwick,
2005; Guidetti, Mazzanti 2007, Wheeler, 2007; Andersson, Grasjo, Karlsson, 2007). In addition, it
is worth stressing the very complementary nature of the training strategies to the other innovative
activities, because they provides skills and competences that enable the workers to fully exploit the
innovation implemented or to be implemented.
The environmental dimension of the innovation activity is strongly linked to the other innovative
dimensions, although the firms have to face the nature of impure public good of the environmental
innovation, because the rents generated by such kind of innovations are only partially appropriable
to the firm (Mancinelli, Mazzanti, 2004; Mazzanti, Zoboli, 2009). However, intense innovative
strategies on the environmental side, when integrated with other innovative spheres, may increase
the firm competitiveness, in addition to the creation of positive social externalities. A sustainable
growth characterised by the de-linking between the dynamic of indicators of environmental impact
and economic growth (Mazzanti, Montini, 2010) is no longer a negligible issue, thus the
environmental innovation strategies have to be included in a comprehensive analysis of the
innovative activities at the firm level.
Last but not least, the internationalisation strategies are here considered as an integrated and
complementary element of the innovative strategy of a firm. The link between innovation and
internationalisation is sound and it has been theoretically stressed and empirically proved (e.g .
Castellani, Zanfei, 2006; Frenz, Ietto-Gillies, 2009; Crespi et al., 2008; Keller, 2004). It is
consolidated a sort of “consensus-view” on the bi-directional causal relation between innovation
and internationalisation. On the one hand, those firms included in global value chains may acquire
innovative capabilities coming from abroad as well as they can benefit from innovative spillovers
generated at local level by multinational firms. On the other hand, the most innovative firms are
those more able to penetrate international markets in order to exploit investment opportunities in
foreign countries. The couple of strategic activities given by internationalisation and innovation
4

may induce virtuous cumulative effects for the firm (see as an example the recent contribution by
Filippetti et al, 2009), which also include the firm’s economic performance.
The above considerations formulated on the base of the international literature provide a
framework of interdependencies among the innovation spheres, which induce to take into
consideration the potential complementary and synergic role they may exert on the economic
performance of the firm, with a not negligible role given by internationalisation strategies. For such
a reason this work takes a broader perspective, when compared to that of the majority of the
contributions on innovation and its effect on firm performances mentioned above, which is based on
the assumption that different types of innovative activities reinforce each other's effects on firms’
performance and therefore can be considered complementary to each other (Antonioli, 2009).
Organisational capabilities and human capital are crucial enablers of innovation activities along the
technological dimension (Coriat, Weinstein, 2002; Brynjolfsson, Yang, 1996; Leiponen, 2005). The
accumulation of capabilities determines the absorptive capacity of the firms towards technological
innovations with the effect of helping to set the innovative path, from a technological point of view,
along which the firm moves. At the same time innovation adopted may need further new
knowledge, which need to be managed, maybe requiring changes in the organisational structure of
the firm (Hall, Mairesse, 2006). Changes on the side of knowledge and skill base of the firm, as
well as in the management of the innovation-knowledge, may generate a wider capacity to absorb
and implement environmental innovations, generating positive externalities. A corollary of such
processes may be given by the capacity of the firm to penetrate new markets and to set up
internationalisation strategies that are not only addressed to reduce production and labour costs.
In synthesis, the single innovative spheres discussed above may be brought back to an integrated
and consistent framework that can be used to determine what kind of relationships between the
several dimensions of the innovative strategies of the firm are those more useful to explain
sustained competitive advantages and economic performances above the average even in period of
severe economic downturn.
The importance of a coherent and consistent set of innovative strategies should last in time and
the dynamic of the strategies has a crucial role. Hence, because the crisis may induce radical
changes in the firm strategic decision, a first aim of the present work is to verify the consistency of
the innovative strategies of the firm before and during the crisis. More specifically we aim to test
whether the more innovative firms before the crisis are also those more active in the innovation
fields during the crisis, using innovation as a way to exit from the crisis and to cope with challenges
brought by the latter.
5

The second objective is that of analysing the role of the innovative activities on the economic
performances of the firm during the crisis, focusing the attention on the complementarities existing
among the innovative dimensions, hypothesising a positive role of integrated innovative strategies
in increasing the firm resilience to the challenges brought by the economic crisis. Once controlled
for firm specific characteristics the aim is to test the influence of past innovative strategies on the
economic performances of the firm at the light of the hypothesis that being an innovator leads to
economic performances above the average. However, such an hypothesis should sound quite trivial
for relatively stable periods of the business cycle, but it turns out to be much more interesting and
stimulating once we consider the relation between innovation and performance in periods of deep
recession: the positive relation hypothesised could be broken by the disruptive power of the crisis;
those firms across a period of internal transformation, undergone also through innovative actions,
just before the crisis could be those more heavily displaced by the impact of the recession; dynamic
firms opened to international markets, accomplishing wide innovation strategies in order to remain
competitive, could be hit strongly by the drop in international demand brought by the recession
3. Data and methodology
The answer to the main research questions are based on micro level data coming from a unique dataset
concerning a sample of 555 Italian manufacturing firms with at least 20 employees located in Emilia-
Romagna region (Tab.1).
Tab.1: Population and sample distribution (%) by sector and sizePopulation distribution (%) Size
Sector 20-49 50-99 100-249 250+ Total Total (a.v.)
FOOD 5,65 1,94 1,16 0,64 9,39 382TEXTILE 6,17 1,47 0,71 0,37 8,73 355WOOD, PAPER AND OTHER INDUSTRIES 7,79 1,67 0,79 0,42 10,67 434CHEMICAL AND RUBBER 5,01 1,87 1,11 0,42 8,41 342NON METALLIC MINERAL PRODUCTS 3,81 1,23 1,18 0,79 7,01 285METALLURGY 16,99 3,29 1,18 0,25 21,71 883MACHINERY 21,44 6,37 4,06 2,24 34,10 1387Total 66,86 17,85 10,18 5,11 100,00Total (a.v.) 2720 726 414 208 4068Sample distribution (%) Size
Sector 20-49 50-99 100-249 250+ Total Total (a.v.)
FOOD 2,88 3,78 1,62 0,54 8,83 49TEXTILE 2,70 1,44 1,62 0,54 6,31 35WOOD, PAPER AND OTHER INDUSTRIES 3,60 2,88 1,08 0,90 8,47 47CHEMICAL AND RUBBER 3,78 3,42 1,80 1,08 10,09 56NON METALLIC MINERAL PRODUCTS 1,62 2,16 1,62 2,16 7,57 42METALLURGY 8,83 5,77 2,16 0,18 16,94 94MACHINERY 14,05 15,32 7,39 5,05 41,80 232Total 37,48 34,77 17,30 10,45 100,00Total (a.v.) 208 193 96 58 555
6

The information collected mainly refer to the pre-crisis period (2006-2008), with specific questions
concerning firm economic performance and actions (innovations included) adopted by the firms to react to
the crisis, concerning also the 2009. The random sample is stratified by size, province (geographic location)
and sector. It is well representative of the population, showing only minor distortions.
The information provided by the questionnaire administered to firm’s management concern several sets
of variable.
Controls (CONT) and past performance (PERF2006-2008)
The structural variables used as controls aim at capturing some firm specific elements and also peculiar
characteristics of the production context (Tab.2). Within this group we have the usual sector dummies, size
dummies and also the geographical location of the “registered office” of the firm, the “openness” to
international markets provided by a variable capturing the percentage of turnover made on international
markets and the belonging to a national or international group. It is also known if a firm is a supplier and the
percentage of turnover made as a supplier. The workforce structure in terms of manual and non-manual
workers is another element potentially influencing both the absorptive capacity of the firm and its innovative
propensity as well as its economic performance. Such controls are thought to be partially exogenous
elements influencing the propensity to innovate in a time of crises. Coupled with such controls we also use
more endogenous variables, because more strongly related to the strategic decisions of the firms, that help in
explaining the propensity to adopt more or less intense innovative intervention to cope with the crisis.
The first set of variables is given by industrial relations ones. With such information we aim to verify the
linkage between cooperative industrial relations and the propensity to innovate, as well as the potential
relation with firm economic performance, although the linkage with the latter might be weak because passing
through the boost a more participative work environment provides to the innovative activities (Antonioli,
2009; Antonioli, Mazzanti, Pini, 2010) which in turn impact on the economic performance.
The set of variables used as additional controls is the trend in past performance indicators (2006-2008).
We may argue that the better is their trend the higher the probability to robustly intervene with innovation
during the crisis because of a sounder financial situation and competitive position. However, it can also be
said that firms in financial troubles before the crisis ‘exploit’ the crisis time itself to implement innovation
activities with an intensity above the average in order to survive. Past performances are also valid control for
the firm performance during the crisis, although the latter could have so strongly displaced the firm to cut
any linkage between past performance (2006-2008) and present performance (2009).
A third set of variables capturing firm specific aspects is given by the indexes concerning the workers
conditions. The higher the index the better is the workers welfare along several dimension of the working
environment (workers effort, economic incentives, degree of autonomy and responsibility, injuries, etc…). If
the workers welfare is high it is more likely to have satisfied employees, which in turn translates into more
7

productive employees (e.g. Bartel et al, 2004) and possibly into employees more able and prone to use and
implement innovations.
Finally, we also know whether or not each firm received subsidies to support innovative programs in the
past, mainly related to R&D projects with specific characteristics1. The role of such subsidies may endure in
time, leading the beneficiary firms to be more innovative and pro-active in time of crisis, as well as better
equipped to cope with the challenges brought by the recession and thus showing higher economic
performances.
Tab.2: Construction and descriptive statistics of control variablesControls Construction Mean Min Max
STANDARD CONTROLS
PAVITT SECTORS (d)Dummies (5) identifying the sectors the firm belong to on the base of the OECD-
Pavitt taxonomy/ 0 1
GEO (d) Dummies of geographical location of the firm (5 province clusters). / 0 1
SIZE (d) Size dummies by employees: 20-49; 50-99; 100-249; > 249. / 0 1
EXPORT Percentage of turnover made on international markets 0.33 0 1
GROUP_INTERNAT (d) Dummy: 1 firm is part of an international group; 0 otherwise 0.07 0 1
GROUP_NAT (d) Dummy: 1 firm is part of a national group; 0 otherwise 0.23 0 1
SUPPLIER Percentage of turnover made as supplier 0.28 0 1SKILL_RATIO Log of non manual/manual ratio 0.85 0 5.1
PROACTIVEDummy variable: 1 if the firm is active in terms of strategic innovation behaviour; 0
otherwise0.40 0 1
DEFENSIVEDummy variable: 1 if the firm is
defensive in terms of strategic behaviour; 0 otherwise
0.14 0 1
MIXDummy variable: 1 if the firm shows a mixed behaviour in terms of strategy; 0
otherwise0.13 0 1
INDUSTRIAL RELATIONS
UNION_INV
Union representatives involvement in decisions concerning innovative activities. Original values: 0 unions absence or not
involved; 1 informed; 2 consulted; 3 bargained with. Index normalized on the
interval (0,1)
0.28 0 1
UNION_INF Index as average of union information over 7 innovative activities 0.40 0 1
UNION_CONS Index as average of union consultation over 7 innovative activities 0.14 0 1
UNION_BARG Index as average of union bargaining over 7 innovative activities 0.05 0 1
1 The regional subsidies have been provided in the framework of the PRRIITT program:
8
EMP_INV
Employees involvement in decisions concerning innovative activities. Original
values: 0 not involved; 1 informed; 2 consulted. Index normalized on the
interval (0,1)
0.50 0 1
EMP_INF Index as average of employees information over 7 innovative activities 0.66 0 1
EMP_CONS Index as average of employees consultation over 7 innovative activities 0.17 0 1
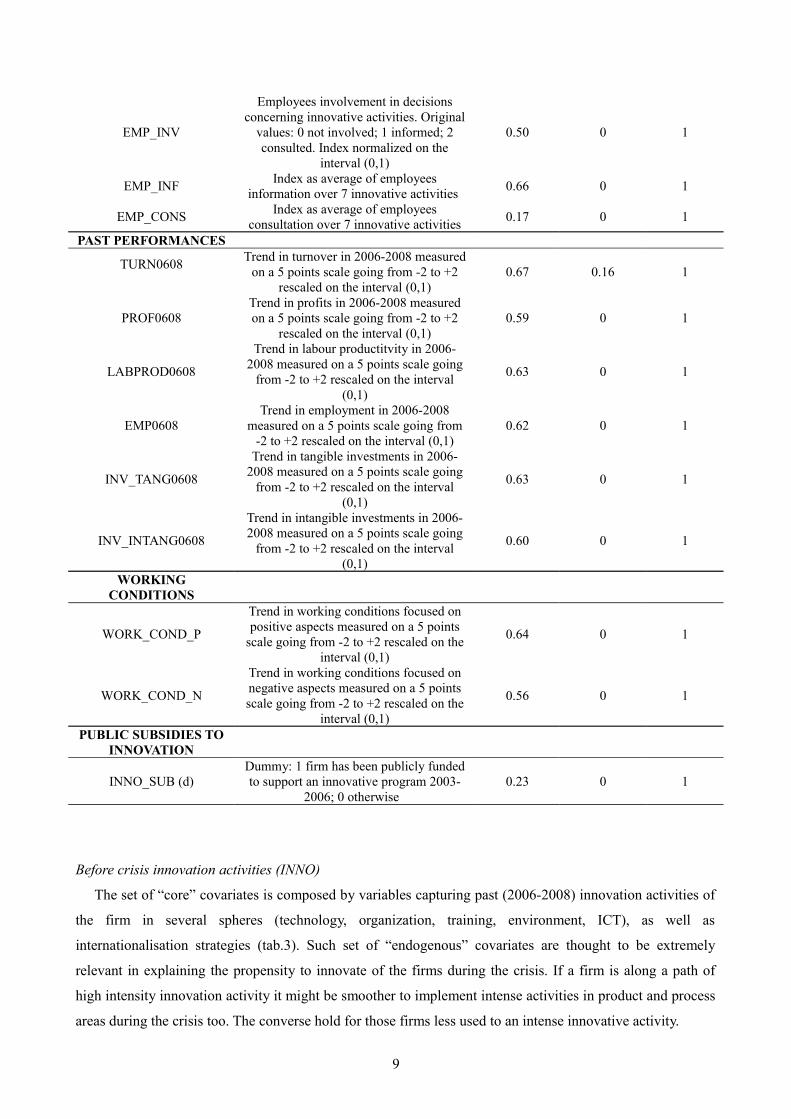
PAST PERFORMANCES
TURN0608 Trend in turnover in 2006-2008 measured on a 5 points scale going from -2 to +2
rescaled on the interval (0,1)0.67 0.16 1
PROF0608Trend in profits in 2006-2008 measured on a 5 points scale going from -2 to +2
rescaled on the interval (0,1)0.59 0 1
LABPROD0608
Trend in labour productitvity in 2006-2008 measured on a 5 points scale going
from -2 to +2 rescaled on the interval (0,1)
0.63 0 1
EMP0608Trend in employment in 2006-2008
measured on a 5 points scale going from -2 to +2 rescaled on the interval (0,1)
0.62 0 1
INV_TANG0608
Trend in tangible investments in 2006-2008 measured on a 5 points scale going
from -2 to +2 rescaled on the interval (0,1)
0.63 0 1
INV_INTANG0608
Trend in intangible investments in 2006-2008 measured on a 5 points scale going
from -2 to +2 rescaled on the interval (0,1)
0.60 0 1
WORKING CONDITIONS
WORK_COND_P
Trend in working conditions focused on positive aspects measured on a 5 points
scale going from -2 to +2 rescaled on the interval (0,1)
0.64 0 1
WORK_COND_N
Trend in working conditions focused on negative aspects measured on a 5 points scale going from -2 to +2 rescaled on the
interval (0,1)
0.56 0 1
PUBLIC SUBSIDIES TO INNOVATION
INNO_SUB (d)Dummy: 1 firm has been publicly funded to support an innovative program 2003-
2006; 0 otherwise 0.23 0 1
Before crisis innovation activities (INNO)
The set of “core” covariates is composed by variables capturing past (2006-2008) innovation activities of
the firm in several spheres (technology, organization, training, environment, ICT), as well as
internationalisation strategies (tab.3). Such set of “endogenous” covariates are thought to be extremely
relevant in explaining the propensity to innovate of the firms during the crisis. If a firm is along a path of
high intensity innovation activity it might be smoother to implement intense activities in product and process
areas during the crisis too. The converse hold for those firms less used to an intense innovative activity.
9

In addition, the complementary nature of the innovative actions should lead to higher economic
performance, thus intense activities on several innovative dimensions should provide the firm of higher level
of resilience to the crisis. However it cannot be excluded that the most dynamic firms in terms of innovation
could have been more strongly crowded out by the crisis because they were in a moment of change and they
were possibly financially stressed because of huge investments in innovations.
Tab.3: Construction and descriptive statistics of innovation variable (period 2006-2008)Innovations (2006-2008) Construction Mean Min Max
TECHNOLOGICAL INNOVATION
INNO_TECH..Composite index of innovation intensity in the technological sphere. Values on the
interval (0,1)0.22 0 0.60
OUTPUT_TECHIndex including innovation aspects
belonging to the dimension of technological output
0.12 0 0.82
INPUT_TECHIndex including innovation aspects
belonging to the dimension of technological input
0.32 0 0.65
ORGANISATIONAL INNOVATION
INNO_ORG…Composite index of innovation intensity in the organizational sphere. Values on
the interval (0,1)0.26 0 0.75
OUTSOURCING Index of outsourcing activities 0.11 0 0.8
ORG_COLL Index of collaboration activities to carry out organisational innovations 0.20 0 1
PROD_PRACTICES Index as the average number of production organisation practices 0.48 0 1
LAB_PRACTICES Index as the average number of labour organisation practices 0.25 0 1
TRAINING
TRAINING… Composite index of intensity in training policies. Values on the interval (0,1) 0.50 0 1
TRAIN_TYPE Index of training typologies 0.42 0 1
COV_INDET Percentage of permanent workers involved in training programs 0.38 0 1
COV_DET Percentage of fixed-term workers involved in training programs 0.21 0 1
TRAIN_COMP Index of training competencies covered by training programs 0.44 0 1
ENVIRONMENTAL INNOVATION
INNO_ENV…Composite index of innovation intensity in the environmental sphere. Values on
the interval (0,1)0.13 0 0.89
ENV_BEN Index of benefits due to environmental innovations 0.13 0 1
ENV_MOT Index of motivations that induced environmental innovations 0.09 0 1
ENV_PROC Index of environmental innovation procedures 0.06 0 1
ICT
ICT…
Composite index of innovation intensity in information and communication technologies sphere. Values on the
interval (0,1)
0.59 0 1
INSTR_ICT Index of ICT instruments implemented 0.83 0 1
10
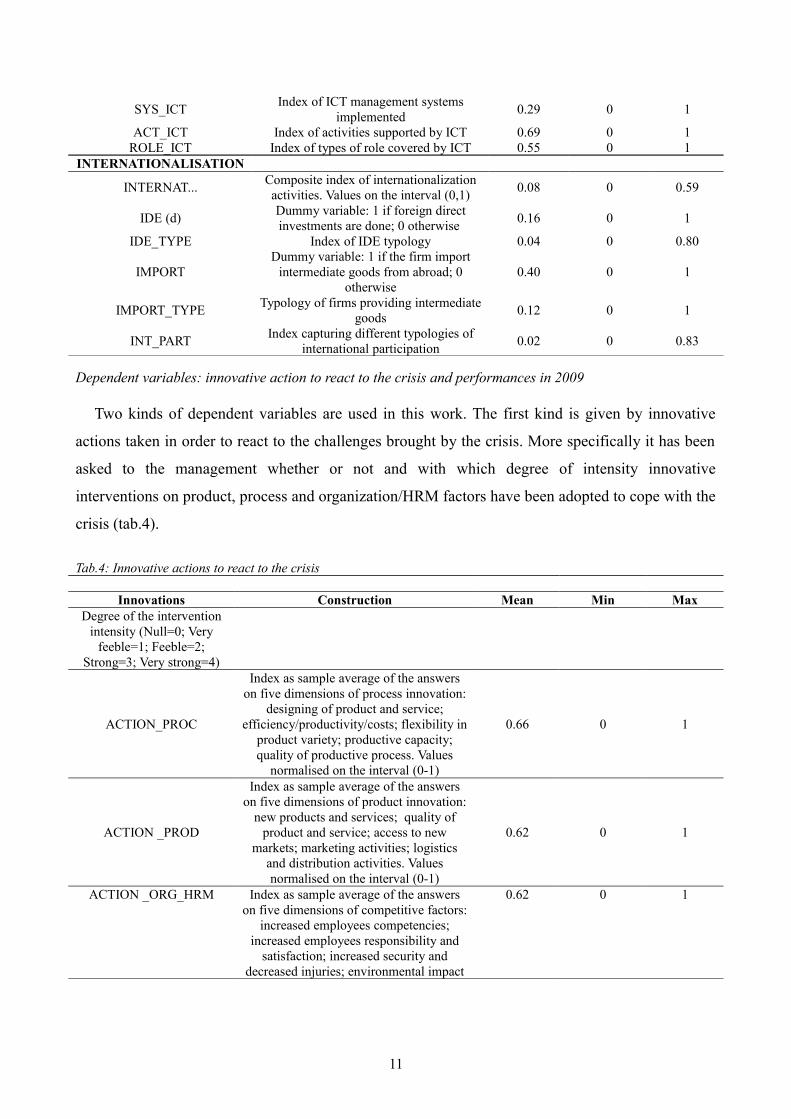
SYS_ICT Index of ICT management systems implemented 0.29 0 1
ACT_ICT Index of activities supported by ICT 0.69 0 1ROLE_ICT Index of types of role covered by ICT 0.55 0 1
INTERNATIONALISATION
INTERNAT... Composite index of internationalization activities. Values on the interval (0,1) 0.08 0 0.59
IDE (d) Dummy variable: 1 if foreign direct investments are done; 0 otherwise 0.16 0 1
IDE_TYPE Index of IDE typology 0.04 0 0.80
IMPORTDummy variable: 1 if the firm import
intermediate goods from abroad; 0 otherwise
0.40 0 1
IMPORT_TYPE Typology of firms providing intermediate goods 0.12 0 1
INT_PART Index capturing different typologies of international participation 0.02 0 0.83
Dependent variables: innovative action to react to the crisis and performances in 2009
Two kinds of dependent variables are used in this work. The first kind is given by innovative
actions taken in order to react to the challenges brought by the crisis. More specifically it has been
asked to the management whether or not and with which degree of intensity innovative
interventions on product, process and organization/HRM factors have been adopted to cope with the
crisis (tab.4).
Tab.4: Innovative actions to react to the crisis
Innovations Construction Mean Min MaxDegree of the intervention
intensity (Null=0; Very feeble=1; Feeble=2;
Strong=3; Very strong=4)
ACTION_PROC
Index as sample average of the answers on five dimensions of process innovation:
designing of product and service; efficiency/productivity/costs; flexibility in
product variety; productive capacity; quality of productive process. Values
normalised on the interval (0-1)
0.66 0 1
ACTION _PROD
Index as sample average of the answers on five dimensions of product innovation:
new products and services; quality of product and service; access to new
markets; marketing activities; logistics and distribution activities. Values normalised on the interval (0-1)
0.62 0 1
ACTION _ORG_HRM Index as sample average of the answers on five dimensions of competitive factors:
increased employees competencies; increased employees responsibility and
satisfaction; increased security and decreased injuries; environmental impact
0.62 0 1
11

reduction; adjustment to standard laws. Values normalised on the interval (0-1)
ACTION_INDEX Overall average of the preceding indexes Values normalised on the interval (0-1) 0.63 0 1
Each index is the expression of the average of the intensity degree of the intervention over
several dimensions for three typologies of intervention: process, product and organization/HRM
factors, mainly concerning organizational and human resources management aspects. As it is shown
in table 4 the average degree of intervention intensity is quite high and close to a strong degree for
all the three typologies of innovative action. As a whole the firm privilege an intervention on the
process dimension rather than on the other two.
As far as the other set of dependent variables is considered we face different indicators of
economic performance of the firm, ranging from labour productivity to the employment, passing
through profits and turnover and investments (tab.5). For each indicator it has been asked to the
management what was the perceived trend in the first two quarters of 2009, the period of deepest
crisis, just before the faint signals of economic recovery registered in the last part of the 2009. The
trend ranges from very negative (-2) to very positive (+2) and it is possible to verify how the
average trend for each indicator is closer to the lower bound of the range rather than to the upper
one, because of the severe slowdown.
Tab.5: Performances in 2009Performances Construction Min Max Mean
LABPROD2009 Average of the trend of Labour productivity. Original index range (-2-2) normalised in the interval (0-1) 0.43 0 1
TURN2009 Average of the trend of Turnover. Original index range (-2-2) normalised in the interval (0-1) 0.37 0 1
PROF2009 Average of the trend of Profits. Original index range (-2-2) normalised in the interval (0-1) 0.36 0 1
EMP2009 Average of the trend of Employment. Original index range (-2-2) normalised in the interval (0-1) 0.43 0 1
Setting the reduced form models
Provided that we have at our disposal a wide range of information and given the considerations
reported in the second section it is possible to set up two reduced form models as follows in order to
answer our research questions:
1) INNO_ACTi,2009 = α0+ α 1i,2006-2008(CONT) + α 2i,2006-2008(PERF)+ α3i,2006-2008(INNO) + α 4i,2006-
2008(INTERACTION) + ei,t
2) PERFi,2009= β0 + β1i,2006-2008(CONT) + β2i,2006-2008(PERF) + β3i,2006-2008(INNO) + β4i,2006-2008(INTERACTION)+ εi,t
12

where i identifies the single firm and 2009 and 2006-2008 stands for the period considered. Because
the variables on the left hand side are measured on a different period with respect to those on the
right hand side it is possible to exploit such diachronic nature in order to partially mitigate the
endogeneity problem given by the potential simultaneous determination of dependent and
independent variables (Michie, Sheean, 2003), while the richness of the data reduces to some extent
the likelihood of relevant variables being omitted. The specifications reported in section 5 below go
from the basic one with controls (specification 1) to more exhaustive ones capturing the effect of
interaction2 terms between innovation indexes (specification 4) and between innovation indexes and
industrial relations variables (specification 5). The last two specifications are used in order to verify
the existence of potential synergies and complementarities between the interacted variables.
Intermediate types of specifications, but extremely relevant ones, include composite innovation
indexes (specification 2) and disaggregated innovation indexes (specification 3). With the former
we can disentangle the role of innovative strategies carried out at the level of innovation spheres as
a whole; with the latter we may single out the impact of specific innovative activities undergone
within each innovation sphere.
4. The firms before and during the crisis
One question has been explicitly addressed to the respondents in order to check the firm situation
before the economic crisis. It markedly assesses the “health status” of the firm in terms of its
competitiveness and its capacity of generating profits and sustaining innovation activities. It also
captures the relative stability of the firm or its crisis even in years characterized by a good
performance of the Italian economic system, in comparison to the preceding years of the same
decade that were marked by a substantial stagnation.
The great majority of the firms was in a situation of good capacity to compete and it also was
engaged in a recent innovative effort (tab.6). Such a result is in line with an interpretation
concerning the dynamic of the Italian production system as a whole (Bugamelli, Cristadoro, Zevi,
2009), which is seen in a moment of “structural changing” in the last decade. Such evolution implies
a strong effort to be devoted to innovative activities, which bring economic benefits in the medium-
long run. The “changing momentum” has been abruptly interrupted by the global economic crisis
that could have crowded out in a stronger way just those firms more engaged in the transformation
process, that is to say those firms more engaged in the innovative effort. The innovating firms could
also have been hit by the crisis in a moment of financial stress given by the monetary effort to
2 The interacted variables have been centered around their mean, before producing the interaction terms, in order to reduce problems of multicollinearity in the specifications.
13

sustain the innovation process, put it another way they have been hit when they were more
vulnerable.
Tab.6: Firm’s pre-crisis condition (% proportion of answers with respect to the total number of firms)
Answer Firm’s condition when the international economic crisis hit %1- The firm was competitive on the market and it was realizing high levels of profits 72,892- The firm was engaged in an innovative effort and it was close to enjoy the first benefits deriving
from the investments in innovation70,02
3- The firm was substantially stable 53,144- The firm was in a difficult situation because of the competitive pressure coming from other firms.
especially those firms located in emerging countries (China. India. Brasil. etc..)19,39
5- The firm was suffering from structural high costs of production. labour and financial capital and it was losing competitiveness with respect to its competitors 22,44
Note: more than one answer allowed
The second questions of the structured questionnaire was addressed to capture the respondents
preferences in terms of policies (international, national and local) to be implemented in order to
cope with the crisis (tab.7). The net preference goes to a policy aimed to reduce labour costs and
taxes (82%). Although such need seems to be shared by many social and political actors it cannot be
neglect the cost-saving defensive character of such a policy, which probably adds to other defensive
strategies implemented by the firm. It is also well recognised the crucial role the national
government can play in sustaining the demand (50%), but also in supporting those “enablers” of
economic recovery (schooling system, professional training programmes, development of firm level
innovations) and long run growth (41%). Finally, it is perceived as important a policy oriented to
reduce the effect of the credit crunch for the small firms, which are struck in a harder way by this
problem with respect to bigger companies that likely have the financial capacity to sustain their
business and, possibly, their innovative strategies.
Tab.7: Policies to cope with the crisis (%proportion of answers with respect to the total number of firms)Answer Policies %1 – Firms should be helped through a reduction in labour costs and taxes 82,412 – National government should favour the growth of internal aggregate demand sustaining the
earnings 50,45
3 – The European monetary authority should induce a more favourable Exchange rate of the euro (competitive devaluation of the euro) 24,42
4 – The European Union should introduce measures of protectionism. safeguarding the National productions of the single members states 17,95
5 – There is a need of policies that shift the real economy at the centre of economic choices sustaining the production system. empowering the schooling system and the professional training and sustaining the development of firm level innovations
40,93
6 – It is necessary a new world governance of economic systems based on shared policies that favour social inclusion and a fairer wealth distribution 10,77
7 – Strongly favour the areas of free commercial trade ruled by bilateral or multilateral agreements between countries 5,39
8 – Actions of industrial and trade policies pursued both by Italian government and the EU with the aim of supporting policies sustaining the export of the small and medium Italian firms towards emerging markets and/or their entrance in such markets
13,11
9 – Policies contrasting the credit crunch, especially addressed to favour credit accessibility for 39,68
14

small and medium firms 10 – Industrial policies sustaining innovation and research designed by the Emilia-Romagna
Region 12,57
On the side of reactions to the crisis through innovative activities, which represent the first set of
dependent variables in our econometric exercise, we find that on average the firms’ interventions
are mainly along the process dimension rather than the product one or the dimension concerning
other competitive factors (tab.8). Looking at the results by firm size it is clear the capacity of large
firms to intervene with higher intensity along the three dimensions of innovative activities with
respect to the small firms. This finding may be linked to the capacity of larger firms to self-finance
(to some extent) their activities, capacity that small firms are less likely to have.
The results by sectors a là OECD-Pavitt shows that the Science Based (SB) firms are those more
active in reacting to the crisis through innovation. The results seems to imply that the firms more
used to innovate, such as the SB ones, consider the innovative activities as a strategic element to
cope with the crisis, likely besides and behind cost-saving strategies, which are rational strategies in
front of a sudden drop in the demand, but that do not guarantee the capacity to survive once the
deepest point of the crisis has passed. Accordingly, it is not a surprise that Labour Intensive (LI)
firms are those less inclined to use innovation as an instrument to cope with the crisis: innovative
activities are less relevant as part of the firm competitive strategies for this sector with respect to the
other considered, especially with respect to the SB one.
Tab. 8: Indices of action intensity on process. product and other competitive factors in order to cope with the crisis. Interval (0-1)
Size Intensity of actions on the process
Intensity of actions on the product
Intensity of actions on organization/HRM factors
20-49 0.61 0,56 0,5850-99 0.67 0,63 0,65
100-249 0.64 0,68 0,65>249 0.69 0,68 0,65
Sector Intensity of actions on the process
Intensity of actions on the product
Intensity of actions on organization/HRM factors
Labour Intensive (LI) 0.62 0.57 0.60Resource Intensive (RI) 0.65 0.63 0.64
Science Based (SB) 0.68 0.68 0.62Scale Intensive (SI) 0.64 0.60 0.62
Specialised Suppliers (SS) 0.66 0.65 0.63Total 0.65 0.62 0.62
To conclude this brief overview of the firms behavior in front of the crisis and their perception of
the consequences and needs derived by the crisis we show the perceived economic performance in
2009, comparing it with that of the preceding years (tab.9): the higher the performance index the
better the performance of the firm. It is straightforward and trivial, to some extent, highlighting the
drop in the performance in 2009 with respect to the preceding years, but it is interesting to show the
15

relative performance of the different sectors and size. As a whole the smallest firm in our sample
(20-49 employees) are those declaring to suffer less with compared to the other size classes, and at
the same time the best performing sector in 2009 is the Science Based, whose firms are the most
innovative during the 2009. Innovative activities and better performance for the Science Based
firms in 2009, in relative terms, go together. On the other hand, it is clear the economic suffering of
Specialised Suppliers, Scale Intensive and Labour Intensive firms, whose management declares for
the 2009 an overall performance which is more or less a halve of that perceived for 2006 and 2007,
the only biennium of relative growth for the Italian economy after 2001.
Tab. 9: Overall economic performance indicator (productivity, turnover, profits). Interval (0-1)Size Perf 2009 Perf 2006 Perf 2007 Perf 2008
20-49 0.40 0.63 0.63 0.5850-99 0.37 0.64 0.65 0.61
100-249 0.38 0.67 0.67 0.63>249 0.39 0.65 0.66 0.63
Sector Perf 2009 Perf 2006 Perf 2007 Perf 2008Labour Intensive (LI) 0.34 0.63 0.64 0.58
Resource Intensive (RI) 0.45 0.63 0.62 0.58Science Based (SB) 0.50 0.63 0.62 0.60Scale Intensive (SI) 0.37 0.63 0.64 0.59
Specialised Suppliers (SS) 0.37 0.66 0.67 0.64Total 0.39 0.64 0.64 0.60
5. Innovation and performance: results of the econometric exercise
5.1 Actions for innovations
Starting the discussion from our first line of econometric analysis as expressed in equation 1,
which has as dependent the indexes of firm strategic reaction to the crisis through the
implementation of innovative activities in process (column 1), product (column 2) and
organization/HRM dimensions (column 3), with also an overall index (column 4) synthesizing the
intensity in reaction for all the three dimensions, we may stress the subsequent principal points
(tabb.10-14).
The controls have the following behavior across the diverse specifications (from 1 to 5).
About the firm size the most active seems to be the small-medium firms (50-99 employees),
especially on process and organization/HRM practices. The smallest firms (20-49 employees) and
the medium large (100-249 employees) show some criticalities once industrial and employment
relationships are considered as interacted with innovation. By sectors a là OECD/Pavitt we can see
16

that Science Based (SB) firms are those better equipped to react to the crisis through the instrument
of innovation activities. Since SB firms are those more likely to be involved in innovative or
research activities in daily routines they are probably called even in recession times to endure along
an innovative path that allow them to remain on the market and to be competitive. The geographical
location seems to play a role as well. The provinces (Forlì-Cesena, Ravenna, Rimini and Piacenza),
that have not been hit so hard as those representing the core of the manufacturing system of the
region (Reggio Emilia, Modena, Bologna and Parma) are also those that are capable of reacting
with more intense innovative activities. If a firm is part of a group or if it does a large amount of
turnover as a supplier the innovation activities in product are hampered, while the opposite holds
when the export increases, which seems to positively influences also the innovative activities on
process dimension. The ratio between non-manual and manual workers is significant with a
negative sign when the dependent is the process dimension. Having a relative larger amount of
manual workers with respect to the non-manuals increases the intensity in interventions for the
process activities3.
It is interesting to show that the index qualifying the firm as proactive and dynamic in innovative
strategies according to the respondent perception about the firm strategic position before the crisis
and the need of specific policies to overcome the crisis is strongly related to innovative activities as
reactions to the crisis, while the index identifying firms having a defensive behaviour is negatively
associated with innovation during the crisis.
In terms of past performances the evidence supports the idea of a positive relation between past
labour productivity and innovative activities on process dimension, while high levels of turnover in
the past are negatively associated to action in organization and HRM dimension. At the same time
an effort on intangible investments before the crisis is negatively associated mainly to the reaction
through product innovation. A strong financial effort in the past could have hampered the capacity
of the firm to sustain innovation activities in the period of deepest recession.
The variables capturing the participative nature of industrial and employment relationships are
positively associated to the innovative actions implemented to react to the crisis. It is worth
stressing the fact that the significance level persists across different specifications, witnessing a
substantial robustness of the link between involvement of union representatives and employees and
innovative strategic reaction. More specifically we notice that for union representatives the two
modalities of interaction used by the management that are linked to the innovative capacity in the
crisis are information and bargaining, with less room for an intermediate instrument such as
3 Innovation subsidies reveived in the past do not have any impact on innovative actions to cope with the crisis.
17

consultation. About employees is the information process, rather than consultation, to be more
closely related to innovative activities.
Finally, good quality working conditions are related to the innovation activities as well, across all
the three dimensions and even to the overall index of intervention. The workers well being is crucial
for the innovative activities of the firm, because the implementation of each single innovation
passes through the human resource or it has consequences on the work environment. Good quality
working conditions are likely to make the workers more prone to adopt, implement and utilize the
innovations introduced.
As a whole we can synthesis the results for the group of controls as follows. The presence of
participative industrial and employment relationships coupled with good quality working
conditions, a pro-active/innovative behaviour of the firm before the crisis and some specificities
related to the size, sectors and geographical location represent the mix of firm characteristics that
are overall more likely to positive influence the innovative activities in order to react to the
recession’s challenges.
Once we have controlled for a wide range of firm specificities, the attention turns on the core
group of covariates, that is on those variables capturing the innovative effort of the firm in the
period 2006-2008 on several dimensions of the innovation field.
As far as the composite indexes are concerned (tab.11, specification 2) it is possible to highlight
their impact, in order of number of linkages and their robustness: 1. organizational and
technological innovations; 2. ICT and training; 3. environmental innovation. The
internationalization strategies does not impact on innovative activities in the crisis. The past
innovative activities on organisational and technological innovation spheres provide the firm of the
necessary capabilities to cope with the crisis through the implementation of intense reaction on
process, product and organizational/HRM dimensions. The other innovation spheres are less
capable of giving the firm the capacity to react through intense activities on all the three
dimensions, but they give the firm the capacity to intensely react at least on one dimension: ICT and
training impact positively on product and organizational/HRM dimensions, with the latter that is
positively influenced, although in a weak way, by environmental innovation as well.
When the composite innovation indexes are disaggregated in their sub-components (tab.12,
specification 3) the following results emerge. The diffusion of production and labour organizational
practices drive the sign of the composite innovation index of the organizational sphere. As expected,
both the two aspects are mainly related to organization/HRM dependent, with production practices
also linked to the process dimension. For the technological sphere the aspects that can be defined as
18
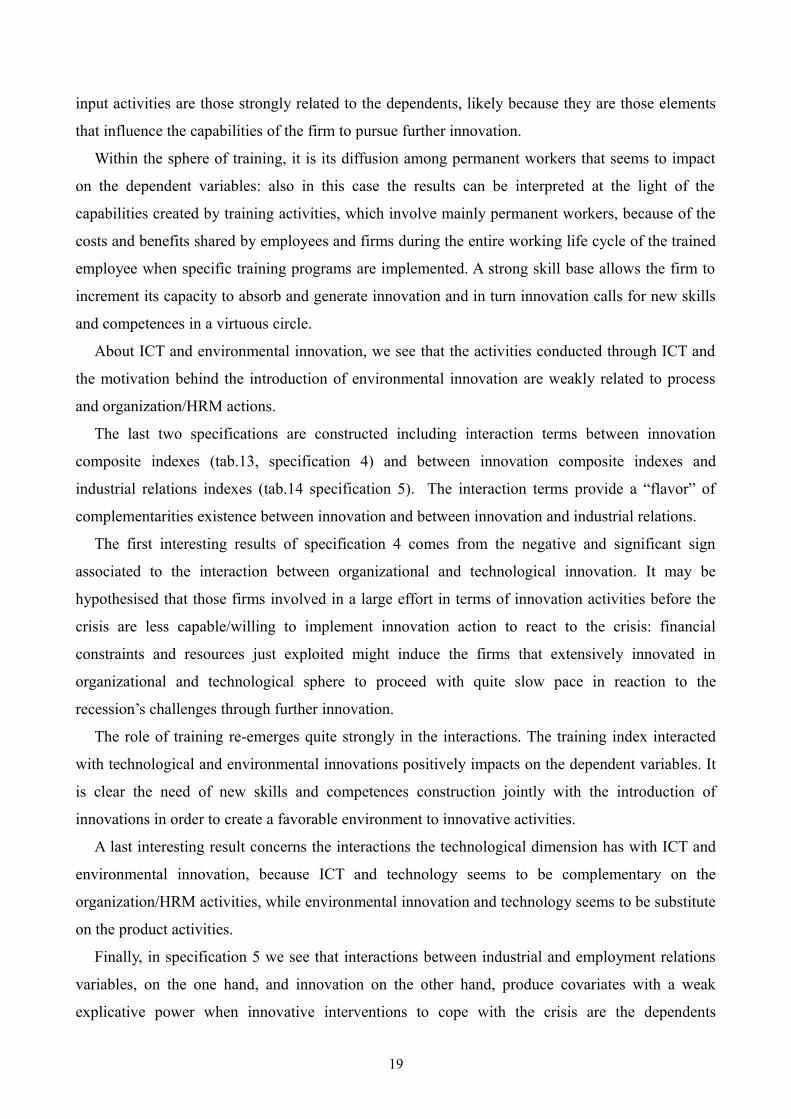
input activities are those strongly related to the dependents, likely because they are those elements
that influence the capabilities of the firm to pursue further innovation.
Within the sphere of training, it is its diffusion among permanent workers that seems to impact
on the dependent variables: also in this case the results can be interpreted at the light of the
capabilities created by training activities, which involve mainly permanent workers, because of the
costs and benefits shared by employees and firms during the entire working life cycle of the trained
employee when specific training programs are implemented. A strong skill base allows the firm to
increment its capacity to absorb and generate innovation and in turn innovation calls for new skills
and competences in a virtuous circle.
About ICT and environmental innovation, we see that the activities conducted through ICT and
the motivation behind the introduction of environmental innovation are weakly related to process
and organization/HRM actions.
The last two specifications are constructed including interaction terms between innovation
composite indexes (tab.13, specification 4) and between innovation composite indexes and
industrial relations indexes (tab.14 specification 5). The interaction terms provide a “flavor” of
complementarities existence between innovation and between innovation and industrial relations.
The first interesting results of specification 4 comes from the negative and significant sign
associated to the interaction between organizational and technological innovation. It may be
hypothesised that those firms involved in a large effort in terms of innovation activities before the
crisis are less capable/willing to implement innovation action to react to the crisis: financial
constraints and resources just exploited might induce the firms that extensively innovated in
organizational and technological sphere to proceed with quite slow pace in reaction to the
recession’s challenges through further innovation.
The role of training re-emerges quite strongly in the interactions. The training index interacted
with technological and environmental innovations positively impacts on the dependent variables. It
is clear the need of new skills and competences construction jointly with the introduction of
innovations in order to create a favorable environment to innovative activities.
A last interesting result concerns the interactions the technological dimension has with ICT and
environmental innovation, because ICT and technology seems to be complementary on the
organization/HRM activities, while environmental innovation and technology seems to be substitute
on the product activities.
Finally, in specification 5 we see that interactions between industrial and employment relations
variables, on the one hand, and innovation on the other hand, produce covariates with a weak
explicative power when innovative interventions to cope with the crisis are the dependents
19

variables. The few and weak significant terms provide a fragmented framework from which only
the positive coefficients associated to the interaction between employees involvement and
internationalization strategies assumes a certain relevance. It might be hypothesised that only where
employees are involved with a certain intensity they are capable of exploiting positive externalities
in terms of innovation and knowledge coming from the international nature of the firm and
constructing, in so doing, a good skill base that spur further innovation.
Tab. 10: Results for the controls (Equation 1) Specification 1 1 2 3 4
ACTION_PROC ACTION_PROD ACTION_ORG_HRM ACTION_INDEXSIZE 20-49 -0.0579** -0.0249SIZE 50-99 0.0324* -0.0235 0.0391** 0.0121SIZE 100-249 -0.0162 0.0209LABOUR INTENSIVE -0.0333 -0.0193RESOURCE INTENSIVE 0.0182SCIENCE BASED 0.0570** 0.0595** 0.0192 0.0408**SCALE INTENSIVE -0.028 -0.0154BOREMOPR 0.0258FCRARN 0.0254 0.0421** 0.0422 0.0249*FE 0.045PC 0.0578**GROUP -0.0554*** 0.0269 -0.0157EXPORT 0.0632** 0.0670** 0.0428*SUPPLIER -0.0282 -0.0511** -0.0261*SKILL_RATIO -0.0269 0.0149INNO_SUB 0.0203DEFENSIVE -0.0432 -0.0427 -0.0276 -0.0358*PROACTIVE 0.0667*** 0.0576*** 0.0376** 0.0546***MIX 0.019 0.0304 0.017LABPROD0608 0.133**EMP0608 0.0514 0.0497 0.052TURN0608 -0.077 -0.0767 -0.0954 -0.0858PROF0608 -0.0628 0.0444INV_TANG0608 0.153** 0.134* 0.108*INV_INTANG0608 -0.0544 -0.149** -0.103 -0.110*UNION_INF 0.024 0.0585*** 0.0387** 0.0395***UNION_BARG 0.0741*** 0.0997*** 0.0702*** 0.0814***EMP_INF 0.0381* 0.0335 0.0661*** 0.0519**EMP_CONS 0.0778** 0.0325WORK_COND_P 0.181*** 0.202*** 0.160** 0.186***WORK_COND_N 0.0643 0.0823 -0.0393 0.036Constant 0.453*** 0.425*** 0.372*** 0.438***Observations 547 547 547 547Adjusted R2 0.117 0.17 0.081 0.174F 4.812 6.834 3.661 6.576Notes: * p < 0.10, ** p < 0.05, *** p < 0.01; a stepwise procedure has been applied in order to end up with parsimonious specifications starting from more general ones (probability threshold to keep the variable is 0.5); empty cells mean the variables have been dropped according to the stepwise procedure.
20

Tab.11: Results for controls and composite indexes of innovation strategies (Equation 1) Specification 2
1 2 3 4ACTION_PROC ACTION_PROD ACTION_ORG_HRM ACTION_INDEX
SIZE 20-49 0.0339 0.0403 0.0216SIZE 50-99 0.0516*** 0.0159 0.0584** 0.0398*SIZE 100-249 0.0363 0.033 0.0193RESOURCE INTENSIVE 0.0181 0.0282 0.0246 0.0244SCIENCE BASED 0.0462* 0.0466 0.0312SCALE INTENSIVE -0.0295 -0.0214 -0.021BOREMOPR -0.0316* 0.0293FCRARN 0.0196 0.0369 0.0202FE 0.0402PC 0.0640*** -0.0477GROUP -0.0529*** 0.0195 -0.0159EXPORT 0.0502 0.0520* 0.0292SUPPLIER -0.0285 -0.0548*** -0.0187 -0.0329**SKILL_RATIO -0.0404** -0.0148INNO_SUB -0.0216DEFENSIVE -0.0454* -0.0429 -0.0232 -0.0381*PROACTIVE 0.0579*** 0.0418** 0.0313** 0.0431***LABPROD0608 0.133** 0.0393TURN0608 -0.0801 -0.05 -0.0848 -0.0747*PROF0608 -0.0617 0.0492INV_TANG0608 -0.0605 0.101 0.102 0.0492INV_INTANG0608 -0.0473 -0.142** -0.0971 -0.0962*UNION_INF 0.0199 0.0578*** 0.0317* 0.0357**UNION_BARG 0.0530** 0.0782*** 0.0418* 0.0580***EMP_INF 0.0226 0.0277 0.0395 0.0301**EMP_CONS -0.026 0.0327WORK_COND_P 0.140** 0.153** 0.0973 0.134**WORK_COND_N 0.0577 0.061 0.0299INNO_ORG 0.133** 0.112* 0.275*** 0.169***TRAINING 0.0983*** 0.0266INNO_TECH 0.243*** 0.400*** 0.228***INNO_ENV -0.0489 0.0490*ICT 0.0848 0.134** 0.0745*INTERNAT -0.0576Constant 0.402*** 0.326*** 0.337*** 0.365***Observations 547 547 547 547Adjusted R2 0.152 0.227 0.147 0.243F 5.202 7.97 5.062 8.072Notes: * p < 0.10, ** p < 0.05, *** p < 0.01; a stepwise procedure has been applied in order to end up with parsimonious specifications starting from more general ones (probability threshold to keep the variable is 0.5); empty cells mean the variables have been dropped according to the stepwise procedure.
21

Tab.12: Results for controls and disaggregated innovation indexes (Equation 1) Specification 3 1 2 3 4
ACTION_PROC ACTION_PROD ACTION_ORG_HRM ACTION_INDEXSIZE 20-49 0.0237 0.0232 0.02SIZE 50-99 0.0398* 0.0138 0.0388 0.0345*SIZE 100-249 0.0434** 0.0313 0.0245RESOURCE INTENSIVE 0.02 0.0295 0.0319 0.0275SCIENCE BASED 0.0377 0.0458 0.0308SCALE INTENSIVE -0.0236 -0.0243 -0.0206BOREMOPR -0.0343* 0.0256FCRARN 0.0178 0.0288 0.0187FE 0.0424PC 0.0744*** -0.0366 0.015GROUP -0.0172 -0.0556*** -0.0212EXPORT 0.0550* 0.0514* 0.0317SUPPLIER -0.0263 -0.0527** -0.0224 -0.0350**SKILL_RATIO -0.0361* -0.0135INNO_SUB 0.0229DEFENSIVE -0.0454* -0.0472* -0.0246 -0.0391**PROACTIVE 0.0604*** 0.0423** 0.0289* 0.0461***LABPROD0608 0.137** 0.0364TURN0608 -0.089 -0.0417 -0.105* -0.0772*PROF0608 -0.0578 0.0671INV_TANG0608 -0.0704 0.103 0.0765 0.0412INV_INTANG0608 -0.0478 -0.161** -0.0832 -0.0977*UNION_INF 0.0269 0.0603*** 0.0334* 0.0363**UNION_BARG 0.0515** 0.0758** 0.0361* 0.0492***EMP_INF 0.0409* 0.0311**EMP_CONS -0.0454* -0.0323 0.0225WORK_COND_P 0.145** 0.166** 0.1 0.138***WORK_COND_N 0.0555 0.0656 0.0434OUTSOURCING 0.0611 -0.0394PROD_PRACTICES 0.0562** 0.0219 0.0693*** 0.0487**LAB_PRACTICES 0.0699 0.0818 0.177*** 0.104***TRAIN_TYPE 0.0411 0.0208COV_INDET 0.0369** 0.0517*** 0.0254*COV_DET 0.0208TRAIN_COMP -0.0625** -0.0305 -0.0265 -0.0383INPUT_TECH 0.201*** 0.337*** 0.0927* 0.205***OUTPUT_TECH 0.0483 0.0484 -0.0593ENV_BEN -0.037ENV_PROC 0.0679 -0.0543ENV_MOT -0.0582 0.0781*INSTR_ICT 0.0508 0.036 0.0426SYS_ICT 0.0291 -0.0393ACT_ICT 0.0537* 0.0523 0.0361ROLE_ICT 0.0262IDE 0.0392 0.0315 -0.0517IMPORT 0.0208INT_PART -0.11 -0.0765IDE_TYPE -0.154 -0.115 0.131IMPORT_TYPE -0.0488Constant 0.385*** 0.344*** 0.338*** 0.338***Observations 547 547 547 547Adjusted R2 0.163 0.231 0.176 0.262F 4.444 6.263 4.667 7.595Notes: * p < 0.10, ** p < 0.05, *** p < 0.01; a stepwise procedure has been applied in order to end up with parsimonious specifications starting from more general ones (probability threshold to keep the variable is 0.5); empty cells mean the variables have been dropped according to the stepwise procedure.
22

Tab.13: Results for controls and interactions among innovative strategies (Equation 1) Specification 4 1 2 3 4
ACTION_PROC ACTION_PROD ACTION_ORG_HRM ACTION_INDEXSIZE 20-49 0.0313 0.0371 0.0232SIZE 50-99 0.0508** 0.0588** 0.0403**SIZE 100-249 0.03 0.0312 0.0201LABOUR INTENSIVE -0.027RESOURCE INTENSIVE 0.017 0.0285 0.0227SCIENCE BASED 0.0508** 0.0366 0.0369*SCALE INTENSIVE -0.0472* -0.0141 -0.0192BOREMOPR -0.0343* 0.0293FCRARN 0.0183 0.0385 0.0205FE 0.0406PC 0.0667*** -0.052GROUP -0.0138 -0.0493** 0.0176 -0.0148EXPORT 0.0449 0.0355 0.0244SUPPLIER -0.0294 -0.0554*** -0.0173 -0.0346**SKILL_RATIO -0.0413** -0.0135 0.0145 -0.0131INNO_SUB -0.0282 -0.0112DEFENSIVE -0.0497* -0.0446 -0.0331 -0.0437**PROACTIVE 0.0638*** 0.0438** 0.0359** 0.0492***LABPROD0608 0.127** 0.033TURN0608 -0.0988* -0.0606 -0.0659 -0.0837**PROF0608 -0.0552INV_TANG0608 -0.0569 0.109 0.127* 0.0478INV_INTANG0608 -0.067 -0.154** -0.122* -0.112**UNION_INF 0.0257 0.0655*** 0.0356** 0.0424***UNION_BARG 0.0435* 0.0811*** 0.0321 0.0522***EMP_INF 0.0448** 0.03 0.0491* 0.0357**EMP_CONS 0.0314WORK_COND_P 0.142** 0.153** 0.0901 0.142***WORK_COND_N 0.0448 0.0624INNO_ORG (centered) 0.145** 0.11 0.300*** 0.185***TRAINING (centered) 0.0980*** 0.0331INNO_TECH (centered) 0.229*** 0.420*** 0.232***INNO_ENV (centered) -0.0451 -0.0181ICT (centered) 0.0942* 0.130** 0.0813**INNO_ORG*TRAINING 0.204INNO_ORG*INNO_TECH -1.243** -0.951 -1.173** -1.081**INNO_ORG*INNO_ENV 0.22INNO_ORG*ICT -0.305INNO_ORG*INTERNAT -0.506TRAINING*INNO_TECH 0.565** 0.590* 0.274 0.523**TRAINING*INNO_ENV 0.122 0.238** 0.171**TRAINING*ICT 0.205 -0.299TRAINING*INTERNAT -0.397 -0.504 -0.343INNO_TECH*INNO_ENV -0.654** 0.245 -0.131INNO_TECH*ICT 1.296*** 0.271INNO_TECH*INTERNAT 0.451INNO_ENV*ICT -0.173 0.224INNO_ENV*INTERNAT 0.278 0.265 0.214ICT*INTERNAT 0.692 0.322Constant 0.549*** 0.556*** 0.461*** 0.539***Observations 547 547 547 547Adjusted R2 0.161 0.233 0.167 0.252F 4.504 6.395 5.337 7.086Notes: * p < 0.10, ** p < 0.05, *** p < 0.01; a stepwise procedure has been applied in order to end up with parsimonious specifications starting from more general ones (probability threshold to keep the variable is 0.5); empty cells mean the variables have been dropped according to the stepwise procedure.
23

Tab.14: Results for controls and interaction between innovation and industrial relations variables (Equation 1) Specification 5 1 2 3 4
ACTION_PROC ACTION_PROD ACTION_ORG_HRM ACTION_INDEXSIZE 20-49 0.0281 -0.018 0.0355 SIZE 50-99 0.0483** 0.0562** 0.0216*SIZE 100-249 0.0274 0.0315RESOURCE INTENSIVE 0.0264 0.0356 0.0348* 0.0314*SCIENCE BASED 0.0532** 0.0368 0.0269SCALE INTENSIVE -0.0267 -0.0236 -0.0219BOREMOPR -0.0326* 0.0344FCRARN 0.0214 0.0361 0.0175FE 0.0427PC 0.0622*** -0.0559*GROUP -0.0142 -0.0524** 0.0159 -0.0196EXPORT 0.0534 0.0499 0.0299SUPPLIER -0.0307 -0.0494** -0.0251 -0.0336**SKILL_RATIO -0.0360* -0.0131INNO_SUB -0.0223DEFENSIVE -0.0468* -0.0395 -0.0257 -0.0395**PROACTIVE 0.0574*** 0.0518** 0.0299* 0.0438***MIX 0.0215LABPROD0608 0.131** 0.0361TURN0608 -0.0853 -0.0392 -0.0923* -0.0725*PROF0608 -0.0592 0.0466INV_TANG0608 -0.0569 0.0984 0.0868 0.0465INV_INTANG0608 -0.0495 -0.143** -0.0813 -0.0957*WORK_COND_P 0.136* 0.165** 0.0894 0.138**WORK_COND_N 0.0467UNION_INV (centered) 0.0326 0.042 0.0238EMP_INF (centered) 0.0234 0.0446** 0.0533** 0.0405***EMP_CONS (centered) -0.0276 0.0336INNO_ORG (centered) 0.156** 0.101 0.286*** 0.179***TRAINING (centered) -0.0253 0.0967*** 0.0193INNO_TECH (centered) 0.205*** 0.374*** 0.209***INNO_ENV (centered) -0.0426 0.0488*ICT (centered) 0.0954* 0.148*** 0.0844**INTERNAT (centered) 0.0698UNION_INV*INNO_ORG -0.307 -0.172 -0.12UNION_INV*TRAINING -0.103 0.0954UNION_INV*INNO_TECH 0.21 -0.309 0.365UNION_INV*INNO_ENV 0.057UNION_INV*ICT 0.239UNION_INV*INTERNAT -0.378EMP_INVa*INNO_ORG 0.303 0.129EMP_INVa*TRAINING -0.0832 -0.104 -0.073EMP_INVa*INNO_TECH 0.261 -0.247EMP_INVa*INNO_ENV 0.0623 0.160** 0.0767EMP_INVa*ICT 0.114 -0.102EMP_INVa*INTERNAT 0.184 0.452** 0.15 0.279*Constant 0.574*** 0.584*** 0.522*** 0.586***Observations 547 547 547 547Adjusted R2 0.147 0.217 0.148 0.238F 4.132 6.936 4.229 7.407Notes: * p < 0.10, ** p < 0.05, *** p < 0.01; a stepwise procedure has been applied in order to end up with parsimonious specifications starting from more general ones (probability threshold to keep the variable is 0.5); empty cells mean the variables have been dropped according to the stepwise procedure; a) the variable EMP_INV is a synthetic index for the employees involvement, which include in its construction both EMP_INF and EMP_CONS variables
24

5.2 Performances in the crisis
The same series of specifications have been applied for the set of four performance indicators,
labour productivity, turnover, profit, employment as represented in equation 2 in the preceding
section (tabb.15-19).
The usual controls, size, sector and geographical location within the Emilia-Romagna region
seem to capture relevant aspects influencing the economic performance of the firm (see tab.15,
specification1, for a glance to the controls only), as emerge in all the five specifications. The small
size is positively related to indicators of profitability and to the trend of employment. The Science
Based and the Resource Bases firms are positively related to all the indicators of economic
performance. In terms of geographical location of the firm we have, as expected, a negative and
significant sign associated to the cluster of provinces that have been hit harder by the economic
crisis. Being part of a group generates a positive impact on labour productivity and the skill ratio,
which is proxied by the ratio of non-manual over manual workers, positively impact on the turnover
of the firm. Innovation subsidies received in the past have a null impact, as in the case of innovative
reaction to the crisis, or a weak negative one on the profits. As stressed before there are some firm’s
specificities that influence the capacity to have good economic performances. In particular, the
production sector and the dimension of the firm seem to be of crucial relevance.
The past performances of each indicator matter in determining the present trend. The same hold
for the past investments in intangibles. Having a good performance before the crisis and sound
investments in intangible activities help the firm to better cope to the recession.
Turning our focus on the industrial relations aspects it emerges how union involvement is
detrimental for the economic performance of the firm. The opposite holds for the linkage between
employees consultation and the turnover of the firm. The negative sign associated to union
involvement may be interpreted as the consequence the crisis have had on the highly unionized
machinery sector. Traditional productions have been strongly “bitten” by the fall in the demand,
especially the international one, given the high export propensity of the Emilia-Romagna firms. At
the same time the machinery sector as well as the non metallic mineral products are sectors where
the cooperative and participative aspects of industrial relations were and are diffused and have been
evolved for decades in a region characterized by dialogue between institutional actors and the
production system. Thus, we could say that union involvement is not detrimental per-se, although
unions can act as rent seekers, but that competitive firms, opened to international markets, with
good quality industrial relations have been hit harder than others by the crisis.
25

The last set of control variables includes the indexes of working conditions. The positive aspects
of workers welfare positively impact on the economic performances of the firm even in the
recession, showing the importance of the working environment not only for the workers but also for
the firm. The workers well being emerges as a sort of mediating element through which the firms
should pass in order to have not only a higher capacity to innovate but also better economic
performances.
Looking now more specifically to the specifications where innovation variables have been
included, we have in specification 2 (tab.16) the positive impact of organizational and technological
innovations on the labour productivity, while past training programs and environmental innovations
are negatively linked to economic profit, turnover and employment and ICT are negatively related
to labour productivity. The negative signs of some the innovation indexes may be interpreted at the
light of the asymmetric way in which the economic crisis have hit: those firms more exposed on
international markets and the firms belonging to specific sectors have been harder bitten on average
with respect to other types of firm, smaller and more related to local markets. As an example, it is
likely the case that firms interested by international competition as the machinery ones in the central
Emilia-Romagna are those firms more active in innovation activities such as ICT and environmental
innovation before the crisis and, thus, generating a negative linkage between past innovation
activities and performance during the crisis. Linkage that would have been positive in the absence
of the international recession, that interrupts a path of changes undergone by the firms, displacing
them in a deep way.
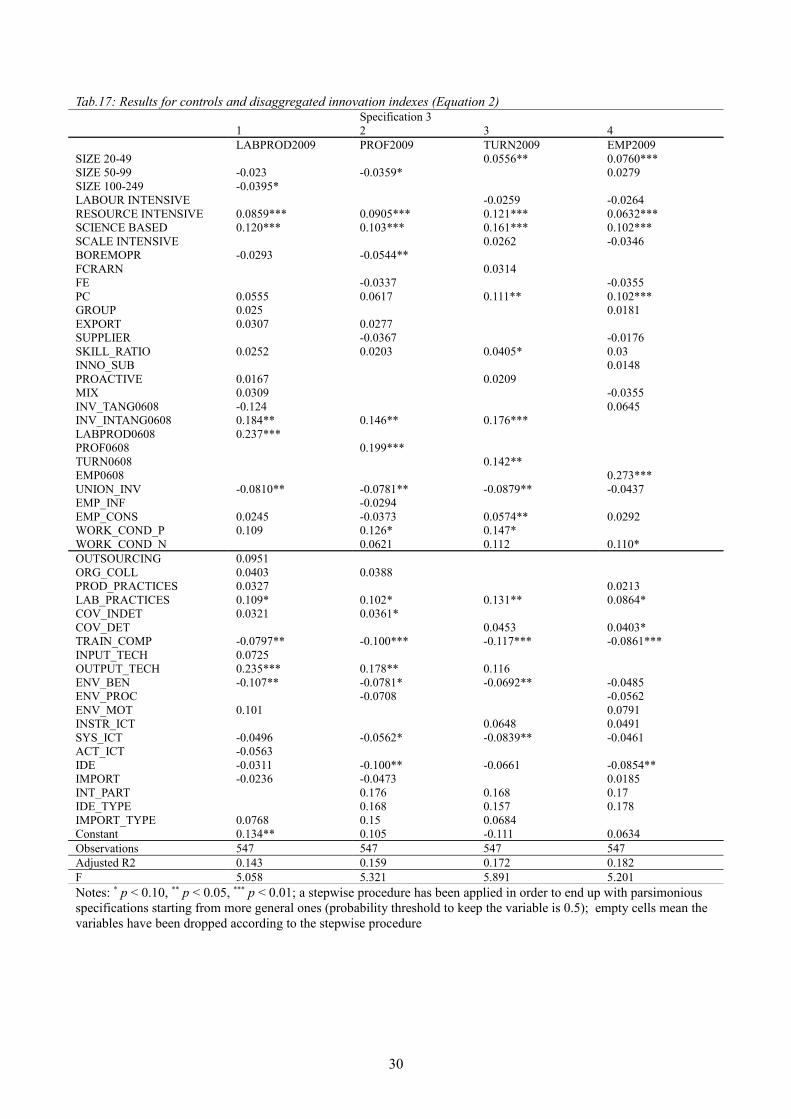
In specification 3 (tab.17) it is possible to single out the specific aspect of innovative activities
that positively or negatively impact on the dependents and that drive the signs of the composite
indexes. Changes in labour organizational practices positively influence all the dimensions of
economic performance considered, while the technological output, that drives the sign of the
technological composite index, mainly impact on labour productivity and profits. As far as training
is concerned, we can see that the extension of training, captured by the percentage of employees
covered by training programs, is positively related to the economic performance. In particular, as
increases the permanent workers involved in training programs the turnover of the firm increases,
and as increases the percentage of short-term workers involved in training programs the
occupational performance of the firm increases. In the latter case the specific human capital
acquired by non permanent workers would make it costly for the firm to dismiss such workers,
inducing to retain them even in a period of recession.
The environmental aspects driving the negative sign of the composite index and those of the ICT
sphere seem to confirm the above interpretation. When firms are moved by reasons laying within
26

the boundaries of corporate social responsibility as the introduction of green innovation to reduce
emission, improve recycling and reduce the impact on soil, water and air or when firms introduce
complex systems of ICT to manage several aspects of the production process, then their
performance is less good during the recession. As said we may hypothezsise that the firms more
active before the crisis are those more heavily crowded out by the challenges brought by the
recession as the credit crunch, because more financially vulnerable given the investments in green
innovations or ICT. However the latter hypothesis seems to hold only if ICT and environmental
innovations are not jointly considered. In fact, in specification 4 (tab.18), when potential synergies
among innovations are captured through the utilization of interacted terms, we notice that just only
the joint introduction of ICT and green innovations positively impact on the economic performance.
Hence, we may further refine our interpretation at the light of the existence of complementarities
between ICT and environmental innovations. When high intensity levels of innovations on both ICT
and green spheres are implemented by the firm, then the economic performance is better than
average. However, it should be considered that the disruptive power of the economic recession
cancel out the complementarities effects that we found in other works on Emilia-Romagna local
production systems (Antonioli, 2009; Antonioli, Mazzanti, Pini 2009) in period of relatively stable,
although weak, growth for the Italian economy.
Finally, the last specification (tab.19) puts in evidence that synergies between participative
industrial relations and innovations are not likely to exert their effect on economic performance in
the crisis. Only when training and union involvement are jointly high we have a positive and
significant impact on profits and occupation; in few other cases employees involvement interacted
with innovation in ICT, environmental aspects and with internationalization strategies have a weak
positive impact on profits and employment. Overall we cannot say the synergies between industrial
relations and innovation strongly influence firm’s economic performance, although it should not be
neglected the fact that union involvement in some cases of interaction changes sign turning from
negative to positive.
27

Tab.15: Results for the controls (Equation 2) Specification 1 1 2 3 4
LABPROD2009 PROF2009 TURN2009 EMP2009SIZE 20-49 0.0253 0.0402* 0.0585*** 0.0840***SIZE 50-99 0.0381*SIZE 100-249 -0.0194 0.0266LABOUR INTENSIVE -0.0194 -0.0238 -0.0201RESOURCE INTENSIVE 0.0751*** 0.0877*** 0.118*** 0.0607***SCIENCE BASED 0.140*** 0.135*** 0.177*** 0.113***SCALE INTENSIVE 0.0251 0.0311 -0.0271BOREMOPR -0.0362* -0.0640***FCRARN 0.0347FE -0.0313 -0.0294PC 0.0673 0.0736 0.122*** 0.104***GROUP 0.0398* 0.023 0.0308*EXPORT 0.0266 0.0317SUPPLIER -0.0324 -0.0166SKILL_RATIO 0.0196 0.0364 0.0282INNO_SUB -0.0367 -0.0214PROACTIVE 0.0132 0.0154MIX 0.0312 -0.0346INV_TANG0608 0.0852 0.0601INV_INTANG0608 0.114* 0.0738 0.140**LABPROD0608 0.214***PROF0608 0.178***TURN0608 0.149**EMP0608 0.280***UNION_INV -0.0768** -0.0734** -0.0949*** -0.0434EMP_INF -0.0383EMP_CONS 0.0397* -0.0428 0.0539* 0.0295WORK_COND_P 0.131* 0.114 0.129WORK_COND_N 0.0638 0.119 0.102*Constant 0.112* 0.0974 -0.0514 0.0903Observations 547 547 547 547Adjusted R2 0.116 0.118 0.141 0.166F 6.257 5.371 6.626 7.414Notes: * p < 0.10, ** p < 0.05, *** p < 0.01; a stepwise procedure has been applied in order to end up with parsimonious specifications starting from more general ones (probability threshold to keep the variable is 0.5); empty cells mean the variables have been dropped according to the stepwise procedure
28

Tab.16: Results for controls and composite indexes of innovation strategies (Equation 2) Specification 2 1 2 3 4
LABPROD2009 PROF2009 TURN2009 EMP2009SIZE 20-49 0.0284 0.0385* 0.0771** 0.0766***SIZE 50-99 0.0234 0.0352*SIZE 100-249 -0.0188 0.0344 0.0233LABOUR INTENSIVE -0.0194 -0.0188 -0.0221RESOURCE INTENSIVE 0.0767*** 0.101*** 0.131*** 0.0642***SCIENCE BASED 0.118*** 0.126*** 0.182*** 0.110***SCALE INTENSIVE 0.0334 0.0416 -0.0243BOREMOPR -0.0294 -0.0580***FCRARN 0.0373FE -0.0337PC 0.0672 0.0773 0.129*** 0.110***GROUP 0.0363* 0.0233 0.0288EXPORT 0.0258SUPPLIER -0.0247SKILL_RATIO 0.0236 0.0196 0.0378* 0.0329INNO_SUB -0.0158 -0.0382* -0.0236PROACTIVE 0.0143 0.0177MIX 0.0243 -0.0398INV_TANG0608 -0.0832 0.0917 0.0564INV_INTANG0608 0.149* 0.0568 0.150**LABPROD0608 0.226***PROF0608 0.192***TURN0608 0.160**EMP0608 0.282***UNION_INV -0.0823** -0.0805** -0.0885** -0.0443EMP_INFEMP_CONS 0.025 0.0579** 0.0304WORK_COND_P 0.116 0.133* 0.142*WORK_COND_N 0.0999 0.0984*INNO_ORG 0.183** 0.0784 0.0858 0.0761TRAINING -0.0288 -0.0649* -0.0638* -0.0547*INNO_TECH 0.239*** 0.1INNO_ENV -0.105*** -0.0687*ICT -0.118*INTERNAT 0.0937Constant 0.140** 0.0655 -0.0808 0.0965*Observations 547 547 547 547Adjusted R2 0.134 0.136 0.146 0.17F 6.378 6.075 5.317 7.253Notes: * p < 0.10, ** p < 0.05, *** p < 0.01; a stepwise procedure has been applied in order to end up with parsimonious specifications starting from more general ones (probability threshold to keep the variable is 0.5); empty cells mean the variables have been dropped according to the stepwise procedure
29
Tab.17: Results for controls and disaggregated innovation indexes (Equation 2) Specification 3 1 2 3 4
LABPROD2009 PROF2009 TURN2009 EMP2009SIZE 20-49 0.0556** 0.0760***SIZE 50-99 -0.023 -0.0359* 0.0279SIZE 100-249 -0.0395*LABOUR INTENSIVE -0.0259 -0.0264RESOURCE INTENSIVE 0.0859*** 0.0905*** 0.121*** 0.0632***SCIENCE BASED 0.120*** 0.103*** 0.161*** 0.102***SCALE INTENSIVE 0.0262 -0.0346BOREMOPR -0.0293 -0.0544**FCRARN 0.0314FE -0.0337 -0.0355PC 0.0555 0.0617 0.111** 0.102***GROUP 0.025 0.0181EXPORT 0.0307 0.0277SUPPLIER -0.0367 -0.0176SKILL_RATIO 0.0252 0.0203 0.0405* 0.03INNO_SUB 0.0148PROACTIVE 0.0167 0.0209MIX 0.0309 -0.0355INV_TANG0608 -0.124 0.0645INV_INTANG0608 0.184** 0.146** 0.176***LABPROD0608 0.237***PROF0608 0.199***TURN0608 0.142**EMP0608 0.273***UNION_INV -0.0810** -0.0781** -0.0879** -0.0437EMP_INF -0.0294EMP_CONS 0.0245 -0.0373 0.0574** 0.0292WORK_COND_P 0.109 0.126* 0.147*WORK_COND_N 0.0621 0.112 0.110*OUTSOURCING 0.0951ORG_COLL 0.0403 0.0388PROD_PRACTICES 0.0327 0.0213LAB_PRACTICES 0.109* 0.102* 0.131** 0.0864*COV_INDET 0.0321 0.0361*COV_DET 0.0453 0.0403*TRAIN_COMP -0.0797** -0.100*** -0.117*** -0.0861***INPUT_TECH 0.0725OUTPUT_TECH 0.235*** 0.178** 0.116ENV_BEN -0.107** -0.0781* -0.0692** -0.0485ENV_PROC -0.0708 -0.0562ENV_MOT 0.101 0.0791INSTR_ICT 0.0648 0.0491SYS_ICT -0.0496 -0.0562* -0.0839** -0.0461ACT_ICT -0.0563IDE -0.0311 -0.100** -0.0661 -0.0854**IMPORT -0.0236 -0.0473 0.0185INT_PART 0.176 0.168 0.17IDE_TYPE 0.168 0.157 0.178IMPORT_TYPE 0.0768 0.15 0.0684Constant 0.134** 0.105 -0.111 0.0634Observations 547 547 547 547Adjusted R2 0.143 0.159 0.172 0.182F 5.058 5.321 5.891 5.201Notes: * p < 0.10, ** p < 0.05, *** p < 0.01; a stepwise procedure has been applied in order to end up with parsimonious specifications starting from more general ones (probability threshold to keep the variable is 0.5); empty cells mean the variables have been dropped according to the stepwise procedure
30

Tab.18: Results for controls and interactions among innovative strategies (Equation 2) Specification 4 1 2 3 4
LABPROD2009 PROF2009 TURN2009 EMP2009SIZE 20-49 0.0273 0.0384* 0.0812** 0.0765***SIZE 50-99 0.0242 0.0307SIZE 100-249 -0.0192 0.0346 0.0242LABOUR INTENSIVE -0.0157 -0.0196 -0.0199RESOURCE INTENSIVE 0.0742*** 0.0910*** 0.125*** 0.0671***SCIENCE BASED 0.120*** 0.117*** 0.182*** 0.123***SCALE INTENSIVE 0.0323 0.0366 -0.0244BOREMOPR -0.0304 -0.0567***FCRARN 0.0382FE -0.0252PC 0.067 0.0744 0.126** 0.109***GROUP 0.0423** 0.0195 0.03 0.0335*SUPPLIER -0.0324SKILL_RATIO 0.0238 0.02 0.0348 0.033INNO_SUB -0.0173 -0.0384* -0.0263DEFENSIVE -0.0159PROACTIVE 0.0134 0.0179MIX 0.0246 -0.0413*INV_TANG0608 -0.0826 0.118* 0.0542INV_INTANG0608 0.134* 0.144**LABPROD0608 0.222***PROF0608 0.200***TURN0608 0.157**EMP0608 0.263***UNION_INV -0.0769** -0.0775** -0.0796** -0.0345EMP_CONS 0.025 0.0547* 0.0254WORK_COND_P 0.125* 0.132* 0.148*WORK_COND_N 0.0959 0.0797INNO_ORG (centered) 0.197*** 0.0805 0.0988 0.0965TRAINING (centered) -0.026 -0.0741* -0.0667* -0.0507INNO_TECH (centered) 0.232*** 0.115INNO_ENV (centered) -0.0346 -0.109*** -0.0763* -0.0387ICT (centered) -0.121*INTERNAT (centered) 0.147INNO_ORG*TRAINING 0.324 0.208 0.281INNO_ORG*INNO_TECH -0.559INNO_ORG*INNO_ENV -0.415INNO_ORG*ICT -0.33 -0.431INNO_ORG*INTERNAT -0.873 -0.494 -0.651TRAINING*INNO_TECH 0.354 0.553*TRAINING*ICT -0.228 -0.26TRAINING*INTERNAT -0.501 -0.65INNO_TECH*INNO_ENV -0.261 -0.504 -0.629* -0.192INNO_TECH*ICT -0.436INNO_TECH*INTERNAT 0.959 1.177 0.746INNO_ENV*ICT 0.660*** 0.658*** 0.579** 0.496**INNO_ENV*INTERNAT 0.349ICT*INTERNAT -0.406Constant 0.159*** 0.0815 -0.087 0.113*Observations 547 547 547 547Adjusted R2 0.145 0.145 0.155 0.179F 5.92 4.642 4.197 6.028Notes: * p < 0.10, ** p < 0.05, *** p < 0.01; a stepwise procedure has been applied in order to end up with parsimonious specifications starting from more general ones (probability threshold to keep the variable is 0.5); empty cells mean the variables have been dropped according to the stepwise procedure
31

Tab.19: Results for controls and interaction between innovation and industrial relations variables (Equation 1) Specification 5 1 2 3 4
LABPROD2009 PROF2009 TURN2009 EMP2009SIZE 20-49 0.0325 0.0391* 0.0540** 0.0754***SIZE 50-99 0.0304SIZE 100-249 -0.0213 0.0335LABOUR INTENSIVE -0.0205RESOURCE INTENSIVE 0.0838*** 0.109*** 0.139*** 0.0682***SCIENCE BASED 0.115*** 0.129*** 0.187*** 0.110***SCALE INTENSIVE 0.0349 0.0520** -0.0201BOREMOPR -0.0295 -0.0532**FCRARN 0.0383FE -0.0238PC 0.0623 0.0839* 0.129*** 0.110***GROUP 0.0350* 0.0231 0.0324*EXPORT 0.0229 0.0389SUPPLIER -0.028SKILL_RATIO 0.0232 0.0184 0.0455** 0.0351*INNO_SUB -0.0443* -0.0241DEFENSIVE -0.0178PROACTIVE 0.0144 0.0191MIX 0.0229 -0.0353INV_TANG0608 -0.0802 0.0756 0.0528INV_INTANG0608 0.144* 0.0748 0.145**LABPROD0608 0.226***PROF0608 0.173***TURN0608 0.170**EMP0608 0.288***WORK_COND_P 0.130* 0.127* 0.151*WORK_COND_N 0.0465 0.0975 0.0889UNION_INV (centered) -0.0811** -0.0714** -0.0858** -0.0486EMP_INF (centered) 0.0217EMP_CONS (centered) 0.0256 0.0595** 0.0503INNO_ORG (centered) 0.166** 0.120* 0.0839 0.0778TRAINING (centered) -0.052 -0.0608 -0.044INNO_TECH (centered) 0.229**INNO_ENV (centered) -0.101*** -0.0738** -0.0263ICT (centered) -0.122**INTERNAT (centered) 0.0827UNION_INV*INNO_ORG -0.195 -0.461* -0.448* -0.446*UNION_INV*TRAINING 0.194 0.245* 0.162 0.222*UNION_INV*INNO_TECH 0.381 0.265UNION_INV*INNO_ENV 0.098 -0.0781UNION_INV*ICT -0.175 -0.248 0.165UNION_INV*INTERNAT -0.277EMP_INVa*INNO_ORG 0.274EMP_INVa*TRAINING 0.0779 0.081 0.115EMP_INVa*INNO_TECH -0.195 -0.363EMP_INVa*INNO_ENV -0.0694 0.187*EMP_INVa*ICT 0.236 0.254* 0.169EMP_INVa*INTERNAT 0.245 0.418**Constant 0.111* 0.0228 -0.11 0.0812Observations 547 547 547 547Adjusted R2 0.133 0.147 0.151 0.181F 5.547 4.936 5.277 5.922Notes: * p < 0.10, ** p < 0.05, *** p < 0.01; a stepwise procedure has been applied in order to end up with parsimonious specifications starting from more general ones (probability threshold to keep the variable is 0.5); empty cells mean the variables have been dropped according to the stepwise procedure; a) the variable EMP_INV is a synthetic index for the employees involvement, which include in its construction both EMP_INF and EMP_CONS variables
32

6. Conclusions
The present work has shown the reaction of Emilia-Romagna manufacturing firms in front of the
economic downturn experimented in 2009 though the data analysis provided by a structured survey
carried out in 2009.
The descriptive analysis of information related to the pre-crisis firms conditions, to the policies
the firms perceive have to be applied in order to cope with the crisis by local, national and
international institutions, to the innovative activities implemented to answer to the recession and to
the economic performance during the recession, provide a framework that tells us what follows.
Many firms were involved in an innovative effort in the moment the economic crisis burst. This
may have made the firms financially vulnerable in front of the credit crunch that accompanied the
drop in demand, crowding out the more innovative firms in a stronger way with respect to those not
engaged in innovative effort before the recession. The manufacturing firms are aware of the
importance of economic policies oriented to sustain the demand and the innovation, although they
perceive the labour cost as the first issue to be addressed in the short run. The reaction to the crisis
through innovations and the resilience in terms of economic performance seems to be sector based.
As a whole we are in front of a manufacturing sector showing a persistent innovation dynamic
before the crisis, good economic performances and a capacity to recognize the importance of
policies that are innovation oriented to exit from the slowdown with competitive advantages to be
exploited on international markets.
The econometric exercise has provided answers to the main research questions concerning the
linkages between pre-crisis innovative strategies and the capacity to react to the crisis through
innovative activities, on the one hand, and the economic performance of the firm during the crisis
on the other hand.
The reduced form model with innovative activities in the crisis as dependent variables has shown
clearly how some firm specificities are important in sustaining innovation as an instrument to react
to the crisis. Because it is not straightforward to thing about an innovative strategy as a mean to
overcome the recession criticalities, we consider the characteristics that positively impact on the
innovative intensity in the crisis as extremely relevant. As a matter of fact, a sustained innovative
activity may contribute in a crucial way to the survival and to the competitive capacity of the firm at
the end of the slowdown. Good quality industrial relations, workers well being, a pro-
active/innovative behavior of the firm before the crisis, a small-medium size, belonging to the
Science Based sector, and the geographical position of the firm, far from the core manufacturing
provinces in the heart of the region, are all element that spur innovative strategy as a way to
overcome the crisis, putting the root for the creation of competitive advantages at the end of the
33

recession. This strategic orientation is also consistent with past innovation intensity. In particular the
spheres of technology and organisation innovation show robust and positive linkages with
innovative actions to cope with the crisis in all the three dimensions considered: process, product
and organizational/HRM. Also training programs and ICT innovation carried out in the past are
linked to innovative intensity in product and organizational/HRM dimensions. The presence of
complementarities between innovation in the past that exert their influence on the capacity to
innovate to react to the crisis is, however, not strongly supported by the evidence. Doing intensively
innovation on the two spheres of organisation and technology negatively impact on innovative
reactions to the recession’s challenges. The result may be interpreted as the weaker capacity of
those firms that heavily innovated in the past to carry out innovative activities in the crisis, likely
because of the financial effort recently beard and because the changes introduce have not been yet
completely closed or ‘routinised’ in the production process. An interesting point in terms of
complementarities and synergies concerns the role of training which re-emerges when interacted
with other innovative activities, witnessing the relevance of a strong skill base to undergone
innovation strategies with intensity also during the crisis.
The second line of analysis, synthesized by the reduced form model with economic performance
as dependent variables provides interesting results, with quite clear differences with respect to the
results of the preceding analysis. In this analysis as in the preceding one some firm specific aspects
influence the dynamic of economic performances (labour productivity, profits, turnover and
employment) of the firm during the deepest period of economic crisis. In particular, small size and
specific sectors are positively related to performance indicators, while geographical position is
important but the signs reflect the impact of the crisis on specific local areas of the Emilia-Romagna
region. Then, as expected the past performance matter: there is a sort of auto-correlation in the
performance indicators, even if they are perceived ones and they do not come from balance sheets.
Union involvement is negatively associated to the performance, but it is possible to hypothesise that
the recession has hit highly competitive and unionized firms with participative industrial relations
rather than participative industrial relations have induced worse than average economic
performances. Moreover, it is likely the case that the effect of good quality industrial relations
impact on firm’s performances through the positive effect they have on innovation activities
(Antonioli, 2009), rather than having a direct impact on economic performances. The employees
involvement, on the contrary, is positively related to some indicators of performance, witnessing the
important role that direct participation can play in determining firms resilience to the crisis. The
importance of the human resources emerges even by the positive impact of working conditions on
34

the economic performance. The commitment to the firm, which also passes through workers well
being, may constitute a point of strength for the firm during economic downturn.
Once we take into account past innovation strategy as explicative factors for the economic
performance in the crisis the results are less clear cut than in the first line of analysis. On the one
hand technological and organizational innovations positively impact on firm performance (labour
productivity), but on the other hand training, environmental innovations and ICT have a negative
impact on other performance indicators. The signs are driven by specific innovative elements that
are included in each innovation sphere, thus it should not be correct to say that ICT, environmental
innovations or training programs negatively impact on economic performances, rather it is better
saying that some elements of those innovation spheres are negatively related to the performance of
the firm in the crisis. Moreover, it can by hypothesized that the more dynamic and competitive
firms before the crisis, opened to international competition and for such reason active on several
innovation spheres are those more largely displaced by the drop in international demand with
respect to the firms linked to local markets, which had a less intense innovative activity. More
dynamic firms before the crisis could show worse economic performance during the crisis, but they
potentially have the capacity to survive and to better compete in the medium-long run. The
resilience of the firm to the recession is not even related to the existence of complementarities
between innovation strategies. The disruptive power of the recession seems to have shadowed the
potential role of innovation synergies on the economic performance of the firm. The same
irrelevance of complementarities emerges between industrial relations and innovation strategies,
although industrial relations when interacted with innovation activities turn their sign from negative
to positive in some cases.
Before concluding we notice that what is relevant of the past innovative strategy of the firm and
of the firm’s specificities in spurring innovative reaction to the crisis is not necessarily what is
relevant to obtaining good economic performances in the crisis.
The results here discussed represent a first attempt to evaluate the importance of the before crisis
innovative strategy of the firm in determining the capacity to survive and react to the crisis itself.
The evidence suggests that designing a consistent and coherent innovation strategy that could help
the firm both to maintain above the average economic performance during periods of slowdown and
to construct its capacity to react to the crisis through innovation, using it as an exit strategy capable
of creating post-crisis competitive advantages, results to be very complex and challenging. The
importance of the issue calls for further research and refinement of the present one, such as:
econometric exercises to test the relevance of pre-crisis balance sheet data on firm performance as
determinants of both innovative activities and higher performances in 2009; collecting future
35

balance sheets data in order to verify the linkage between innovative activities during the crisis and
the capacity to exit from the crisis maintaining good economic performances and competitive
advantages.
References
Aghion, P. & Howitt, P. (1998), Endogenous Growth Theory, MIT Press, Cambridge (Mass.).
Andersson, M.; Grasjo, U. & Karlsson, C. (2007), 'Human Capital and Productivity in a Spatial Economic System - Relating the Extent of Spatial Dependence to Localities’ Position', Annales d'Economie et de Statistique 87-88, 104-125.
Antonioli, D. (2009), 'Industrial Relations, Techno-Organizational Innovation and Firm Economic Performance', Economia Politica XXVI(1), 21-52.
Antonioli, D., Bianchi, A., Mazzanti, M., Montresor, S. & Pini, P. (2010) "Valutazione dell’impatto del programma per le attività produttive 2003-2005 (Azione 3.1.A) sulle imprese manifatturiere dell’Emilia-Romagna", Università di Ferrara, Regione Emilia-Romagna, Rapporto Tecnico, Bologna, mimeo.
Antonioli, D.; Mazzanti, M.; Montresor, S. & Pini, P. (2010), Does outsourcing increase labour productivity? Evidence for a local production system in Emilia Romagna (Italy), in Guglielmetti C. Dallago B. (eds.), Local Economies and Global Competitiveness, Palgrave – MacMillan, London.
Antonioli, D.; Mazzanti, M. & Pini, P. (2010), 'Productivity, Innovation Strategies and Industrial Relations in SME. Empirical evidence for a local manufacturing system in Northern Italy', International Review of Applied Economics 24(4), 453-482.
Antonioli, D.; Mazzanti, M.; Pini, P. & Tortia, E. (2004), 'Adoption of Techno-Organizational Innovations, and Industrial Relations in Manufacturing Firms: An Analysis for a Local Industrial System', Economia Politica XXI(1), 11-52.
Bartel, A.; Ichniowski, C. & Shaw, K. (2005), 'How does Information Really Affect Productivity? Plant-Level Comparisons of Product Innovation, Process Improvement and Worker Skills', Working paper 11773, NBER..
Bianchi, A. & Pini, P. (2009), ‘Riflessioni circa la natura della crisi. Le vie per uscirne e le opportunità da (non) cogliere’, Economia e Società Regionale 2009(1-2), 32-55.
Black, S. & Lynch, L. (2001), 'How to Compete: The Impact of Workplace Practices and Inoformation Technology on Productivity', The Review of Economics and Statistics 83(3), 434-445.
Bloom, N. & Reenen, J. V. (2007), 'Measuring and Explaining Management Practices Across Firms and Countries', Quarterly Journal of Economics CXXII(4), 1351-1408.
Brandolini, A. & Bugamelli, M.B. (eds.) (2009), 'Rapporto sulle tendenze nel sistema produttivo italiano', Banca d’Italia, Questioni di Economia e Finanza. n. 45.
Brynjolfsson, E. & Yang, S. (1996), 'Information Technology and Productivity: A Review of the
36

Literature', Advances in Computers 43(1), 179-214.
Bugamelli, M., Cristadoro, R. & Zevi, G. (2009), 'La crisi internazionale e il sistema produttivo italiano: un’analisi su dati a livello d’impresa', Banca d’Italia, Occasional Papers, n.58.
Caroli, E. & Reenen, J. V. (2001), 'Skilled-biased Organizational Change? Evidence from a Panel of British and French Establishments', The Quarterly Journal of Economics 116(4), 1449-1492.
Castellani, D. & Zanfei, A. (2006), Multinational Firms, Innovation and Productivity, Edward Elgar, Cheltenham.
Conti, G. (2005), 'Training, Productivity and Wages', Labour Economics 12(4), 557-576.
Coriat, B. & Weinstein, O. (2002), 'Organizations, Firms and Institutions in the Generation of Innovation', Research Policy 32(2), 273-290.
Crespi, G.; Criscuolo, C. & Haskel, J. (2008), 'Productivity, Exporting, and the Learning-by-Exporting Hypothesis: Direct Evidence from UK Firms', Canadian Journal of Economics 41(2), 619–638.
EUROPE, P. I. (2009), 'Regional Innovation Scoreboard', Technical report, PRO INNO EUROPE.
Faini, R. & Sapir, A. (2005), Un modello obsoleto ? Crescita e specializzazione dell’economia italiana, in Ichino A., Pisauro G., Scarpa C., Boeri T. & Faini R., (eds.), Oltre il declino, Il Mulino, Bologna.
Filippetti, A., Frenz, M. & Archibugi, D. (2009), 'The Effects of the Economic Downturn on Innovation: Creative Destruction versus Creative Accumulation', 4th Annual Conference of the GARNET Network.
Frenz, M. & Ietto-Gillies, G. (2009), 'The impact on Innovation Performance of Different Sources of Knowledge: Evidence from the UK Community Innovation Survey', Research Policy 38(7), 1125-1135.
Griliches, Z. (1995), R&D and Productivity: Econometric Results and Measurement Issues, in P. Stoneman, (ed.), Handbook of the Economics of Innovation and Technological Change, Blackwell, London.
Guidetti, G. & Mazzanti, M. (2007), 'Firm Training Activities and Complementarities in Production: Conceptual Insights and Empirical Evidence', Journal of Socio-Economics 36(6), 875-894.
Hall, B., Lotti, F. & Mairesse, J. (2009), 'Innovation and Productivity in SMEs: Empirical Evidence for Italy', Small Business Economics 33(1), 13-33.
Hall, B. & Mairesse, J. (2006), 'Empirical Studies of Innovation in the Knowledge Driven Economy', NBER Working Paper No. 12320.
Hughes, A. & Morton, M. S. (2005), 'ICT and Productivity Growth – The Paradox Resolved?', MIT Sloan School of Management Research Paper n.4579-05, Cambridge.
Huselid, M. (1995), 'The Impact of Human Resource management Practices on Turnover,
37
Productivity, and Corporate Financial performance', Academy of Management Journal 38(3), 635-672.
Huselid, M. & Becker, B. (1996), 'Methodological issues in Cross-Sectional and Panel Estimates of the Human Resource-Firm Performance Link', Industrial Relations 35(3), 400-422.
Janod, V. & Saint-Martin, A. (2004), 'Measuring the Impact of Work Reorganization on Firm Performance: Evidence from French Manufacturing', Labour Economics 11(3), 785-798.
Keller, W. (2004), 'International Technology Diffusion', Journal of Economic Literature 42, 752–782.
Leiponen, A. (2005), 'Skills and Innovation. International Journal of Industrial Organization', 23(5-6), 303-323.
Lipsey, R., Carlaw, K. & Bekar, C. (2005), Economic Transformations: General Purpose Technologies and Long Term Economic Growth, Oxford University Press, Oxford.
Mancinelli, S. & Mazzanti, M. (2004), 'Agent’s Cooperation and Network Sustainability. A Note on a Microeconomic Approach to Social Capital', Economia Politica, XXI(2), 299-321.
Mazzanti, M. & Montini, A. (eds.) (2010), Environmental Efficiency, Innovation and Economic Performance, Routledge, London.
Mazzanti, M., Pini, P. & Tortia, E. (2006), 'Organisational Innovations, Human Resources and Firm Performance. The Emilia-Romagna Food Sector', Journal of Socio-Economics 35(1), 123-141.
Mazzanti, M. & Zoboli, R. (2009), 'Environmental Efficiency and Labour Productivity: Trade-off or Joint Dynamics?', Ecological Economics 68(4), 1182-1194.
Michie, J. & Sheehan, M. (2003), 'Labour Market Deregulation, 'Flexibility' and Innovation', Cambridge Journal of Economics 27(1), 123-143.
Morrison, C. (1997), 'Assessing the Productivity of Information Technology Equipment in U.S. Manufacturing Industries', Review of Economics and Statistics 79(3), 471-481.
Pianta, M. & Vaona, A. (2007), 'Innovation and Productivity in European Industries', Economics of Innovation and New Technology 16(7), .485-499.
Pini, P. & Santangelo, G. (2005), 'Innovation Types and Labour Organisational Practices: A Comparison of Foreign and Domestic Firms in the Reggio Emilia Industrial Districts', Economics of Innovation and New Technology 14(4), 251-276.
Pini, P. & Santangelo, G. (2010), 'The Underlying Internal Learning Processes of Incremental and Radical Innovations. An Analysis in the Emilia-Romagna Region', Economia Politica, XXVII(1), 55-81.
Reinhart, C. & Rogoff, K. (2008), 'Is the 2007 Sub-prime Financial Crisi so Different? An International Historical Comparison', American Economic Review: Paper & Proceedings 98(2), 339-344.
38

Wheeler, C. (2007), 'Do Localization Economies Derive From Human Capital Externalities?', Annals of Regional Science 41(1), 31-50.
Zwick, T. (2005), 'Continuing Vocational Training Forms and Establishment Productivity in Germany', German Economic Review 6(2), 155-184.
Zwick, T. (2004), 'Employee Participation and Productivity', Labour Economics 11(3), 715-740.
39