economic development of interior british columbia
TRANSCRIPT
Economic Development of Interior British Columbia:
A Case Study of Wages in the Okanagan, 1911–21
Roger Sugden and Keith Sugden*
Our first article concerning the economic development of Interior British Columbia was a case study of occupations in the Okanagan from 1881 to 1921.1 Our analysis used censuses and
trade directories to examine the nature and speed of growth, showing that the agricultural labour force increased by approximately thirtyfold over the period, supported by urbanization and the rise of a strong service sector. The analysis challenged the notion that a city was defined simply by incorporation or size.2 The three Okanagan settlements of Vernon, Kelowna, and Penticton developed as cities because of the nature of the work undertaken by the people who lived there, particularly those employed in the service sector. Some occupations, such as electrician, telephone operator, banker, lawyer, doctor, stenographer, and architect, were found largely, albeit not exclusively, in the three urban centres and were seldom found in rural areas. This article builds upon that earlier work and considers four major questions: (1) How was Okanagan or-charding organized? (2) How did differing occupational structures and wage profiles reflect the local community and its economy? (3) Can
* We would like to thank the two anonymous referees whose insights significantly helped to improve this article. We would also like to thank participants in the Canadian Economics Association Annual Conference, Antigonish, June 2017; and in the UBC Research Workshop titled “The Impact of Rapid Socio-Economic Change in the Okanagan Nation Territory, 1881–2031,” Community Core of Westbank First Nation, June 2017, for their comments on early drafts of this work.
1 Roger Sugden and Keith Sugden, “Economic Development of BC Interior: A Case Study of Occupations in the Okanagan, 1881–1921,” BC Studies 194 (2017): 65–89.
2 The Baldwin Act, 1849, allowed an incorporated city, town, or village to run its own affairs through an elected council. Before 1941, any Canadian place that was incorporated was defined as urban, regardless of size. The rest of the population was considered rural. See Mary Louise McAllister, Governing Ourselves? The Politics of Canadian Communities (Vancouver: UBC Press, 2004). The 1951 census redefined an urban space as one that has a population of at least one thousand people, whether incorporated or not. See K.G. Basavarjappa and Bali Ram, “Population and Migration,” in Historical Statistics of Canada, ed. M.C. Urquhart and K.A.H. Buckley, 2nd ed., (Ottawa: Statistics Canada, 1983), A67–69.
93bc studies, no. 201, Spring 2019

bc studies94
any differences in wages across urban centres be attributed to changing local circumstances? (4) How did Okanagan wages compare with those elsewhere in British Columbia? Our objective is to understand wage differentials by occupation, by gender, and by place; to investigate spatial variances; and to position those within the context of wages paid elsewhere, notably in Vancouver, and the cost of basic commodities. We begin by placing the Okanagan within the context of British Columbia and by considering the present-day importance of the region to the economic development of the province and of Canada. A brief review of Canadian wage historiography follows. The sources are then discussed, data presented, and conclusions drawn.
The Okanagan
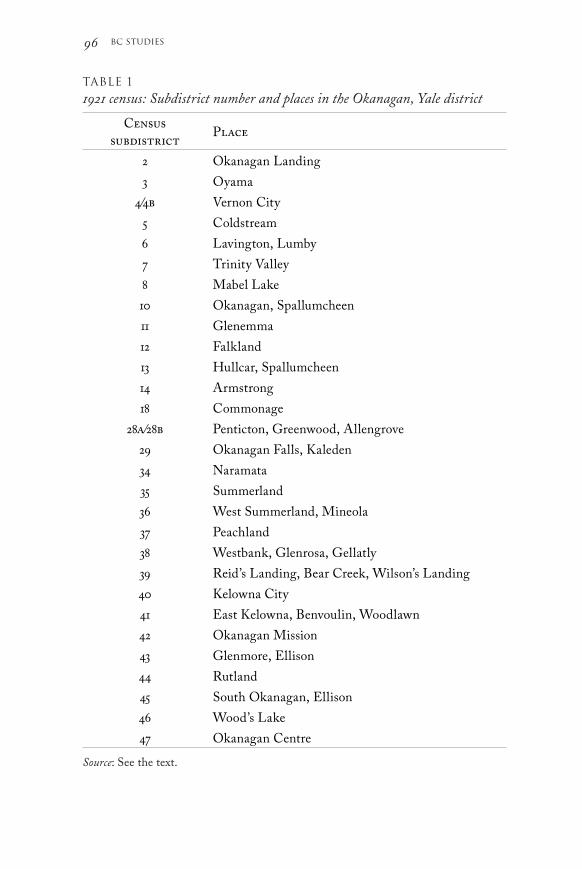
The Okanagan, situated in Syilx First Nation territory, covers an area of approximately 21,000 square kilometres. It is about 260 kilometres long and 130 wide. It forms part of the present-day Thompson Okanagan development region of Interior BC (Map 1).3 The economic development of the region is significant because today it is the main trading area between Vancouver and Alberta, a key part of the economy of Interior British Columbia, and one of the major entrepreneurial regions of Canada.4 The present-day economy of the central Okanagan is wide-ranging, with approximately thirteen thousand diverse businesses, based upon agriculture, tourism, manufacturing, forestry and construction; over six hundred technology companies; and approximately 240 wineries.5 The principal city, Kelowna, has grown to become the largest metropolitan area in British Columbia outside of Vancouver and Victoria, the fastest-growing city in the province, and the fifth fastest in Canada.6 For the purposes of this study, the Okanagan is defined from the subdistricts identified by the 1921 census (Table 1).7 The location of these places is shown on Map 2.
3 Thompson Okanagan Development Region, http://www.bcstats.gov.bc.ca/StatisticsBy-Subject/Geography/ReferenceMaps/DRs.aspx; https://www.syilx.org/about-us/.
4 Keith Culver, Nicky Dhaliwal, Malida Mooken, and Roger Sugden, “Regional Social and Economic Development in the Okanagan, Canada: Envisioning the Future to Initiate a Strategy,” in Smart Strategies for Shaping Territorial Competitiveness, ed. Jesus M. Valdaliso and James R. Wilson, 194–217 (Oxford: Routledge, 2015).
5 2013 Economic profile: Okanagan Valley, http://www.investokanagan.com/sites/default/files/PDF/OVEDS-Eco-Profile-1.pdf; Central Okanagan Economic Development Commission, http://www.investkelowna.com/.
6 Statistics Canada, cited by Global News, Canada, 13 February 2015, http://globalnews.ca/news/1829530/kelowna-fastest-growing-city-in-b-c/.
7 The 1921 Census of Canada, British Columbia, Yale, www.ancestry.ca.

95Economic Development
MAP 1
British Columbia Development Regions
Source: Copyright Province of British Columbia. All rights reserved. Reproduced with permission of the Province of British Columbia. Downloaded from the Shapefile available at https://www2.gov.bc.ca/gov/content/data/geographic-data-services/land-use/administrative-boundaries [Accessed: April 2019]. See also https://www.syilx.org/about-us/
European settlers established a mission in the central Okanagan in 1859.8 The first wagon trains arrived in the same year, carrying goods to sell to gold miners in the Cariboo. In the mid-1860s, a cattle and horse ranch, blacksmith, post office, and sawmill opened.9 Cattle rearing and grain growing, both of which required relatively little initial capital outlay, developed in response to demand from the local market in the mining settlements.10 In 1892, Okanagan Landing on the northern end of Okanagan Lake was connected to the Canadian Pacific Railway (CPR) at Shuswap, and the following year the CPR linked the entire Okanagan Valley to the railhead by operating paddle steamers and barges on the
8 First Annual Report of the Okanagan Historical and Natural History Society (Vernon, BC: Okanagan Historical Society, 1926), 8.
9 Ibid., 7.10 Paul M. Koroscil, The British Garden of Eden: Settlement History of the Okanagan Valley, British
Columbia, 2nd ed. (Burnaby, BC: Simon Fraser University, 2008), 23–52, 24.
bc studies96
Table 1
1921 census: Subdistrict number and places in the Okanagan, Yale district
Census subdistrict
Place
2 Okanagan Landing3 Oyama
4/4b Vernon City5 Coldstream6 Lavington, Lumby7 Trinity Valley8 Mabel Lake10 Okanagan, Spallumcheen11 Glenemma12 Falkland13 Hullcar, Spallumcheen14 Armstrong18 Commonage
28a/28b Penticton, Greenwood, Allengrove29 Okanagan Falls, Kaleden34 Naramata35 Summerland36 West Summerland, Mineola37 Peachland38 Westbank, Glenrosa, Gellatly39 Reid’s Landing, Bear Creek, Wilson’s Landing40 Kelowna City41 East Kelowna, Benvoulin, Woodlawn42 Okanagan Mission43 Glenmore, Ellison44 Rutland45 South Okanagan, Ellison46 Wood’s Lake47 Okanagan Centre
Source: See the text.

97Economic Development
Source: Cartography by Eric Leinberger, University of British Columbia.
MAP 2
The Okanagan

bc studies98
Okanagan Lake.11 These transport connections enabled rapid links beyond the local market. They opened new, more distant opportunities to export from the province, particularly for the commercial production of perishable produce such as soft fruits.12
Lord Aberdeen, governor general of Canada from 1893 to 1898, was influential with regard to the introduction of commercial fruit growing to the Okanagan. In 1890 and 1891, he purchased two tracts of land, one of 480 acres (194 hectares) at the Okanagan Mission and the other of 13,000 acres at Coldstream, a few miles southeast of Vernon. Other farmers in the Okanagan switched to fruit growing, and, by 1893, approximately 75,000 trees, mostly apples, had been planted, largely around Vernon and Kelowna.13 In 1901, there were 399,000 apple trees in the entire province of British Columbia, of which around only 106,000 were planted in the Okanagan.14 In the first decade of the twentieth century, the Okanagan experienced a land boom. Large tracts of land became available and orchard development began. In 1904, the Kelowna Land and Orchard Company bought 6,743 acres, installed roads and irrigation, and offered lots at $100 to $200 per acre.15 Other land companies sprang up. In 1906, the Central Okanagan Company purchased 1,665 acres near Rutland for approximately $100,000. In 1908, the South Kelowna Land Company was formed and four years later held 6,000 acres of irrigated land worth around $500,000. Belgian companies invested nearly $1 million in the region.16 The Okanagan industry was developing apace such that, by 1911, of the 1,976,000 apple trees in the province, more than half of the increased number of 1,577,000 had been planted in the region.17 Between 1901 and 1913, the number of trees increased by over fivefold. From 1901 to 1921, the acreage of Okanagan fruit trees increased by 674 percent.18
11 Ibid., 53. 12 Without the rail link to the Okanagan Landing, the route north to the CPR was too far to
permit the transport of perishable fruit but was fine for grain or cattle. See David Dendy, “The Development of the Orchard Industry in the Okanagan Valley, 1890–1914,” in Thirty-Eighth Annual Report of the Okanagan Historical Society (Vernon, BC: Okanagan Historical Society, 1974): 68–73, 68.
13 Ibid., 69.14 Ibid.15 David Dendy, A Fruitful Century: The British Columbia Fruit Growers’ Association 1889–1989
(Kelowna, BC: British Columbia Fruit Growers’ Association, 1990), chap. 2, “Grafting Over 1910–1927,” http://www.bcfga.com/235/A+New+Organization+for+New+Conditions.
16 Dendy, “Development of the Orchard Industry,” 71.17 Dendy, A Fruitful Century. 18 Margaret A. Ormsby, “Fruit Marketing in the Okanagan Valley of British Columbia,”
Agricultural History 9 (1935): 80–97.

99Economic Development
Extensive irrigation projects were ongoing and fruit growing became the prominent Okanagan industry.19 The chief markets for Okanagan fruit were Britain, Australia, Alberta, Manitoba, and Saskatchewan.20 The apple crop of 1912 was the first to be exported beyond British Columbia. By the 1920s, 30 percent was exported.21 Over the period from 1915 to 1925, 46.7 percent was sent to the Prairies.22 Fruit growers were quick to take up the idea that, to get a reasonable return on their crops, it was necessary to centralize mar-keting and distribution. In 1913, Okanagan United Growers Limited was the first non-profit co-operative established for this purpose.23 Apple production continued to grow and, by 1920, the crop was in excess of 1.3 million boxes. The following year, it doubled.24
Wage Historiography
The analysis of historical wage data is not new, but while the topic has been widely studied elsewhere, for instance in the United States and Britain, it has received less attention in Canada and has had little con-sideration at the regional and non-metropolitan regional levels.25 To our knowledge, no systematic study of early twentieth-century Okanagan occupations and wages has been undertaken. Of the work that has been reported elsewhere, Terry Copp has studied working-class wage data in Montreal,26 and Michael Piva has compared 1921 wages in Montreal and Toronto with those in other places 19 By 1961, over 90 percent of fruit trees in British Columbia were in the Okanagan. See Fritz
Dalichow, Agricultural Geography of British Columbia (Vancouver: Versatile Publishing, 1972), 52, 93, 113, cited by David Dendy, “The Worm in the Apple: Contesting the Codling Moth in British Columbia,” in Beyond the City Limits: Rural History in British Columbia, ed. R.W. Sandwell (Vancouver: UBC Press, 1999), 142–56.
20 Province of British Columbia Full Report on the Royal Commission on Agriculture (Victoria: William H. Cullin, printer to the King’s Most Excellent Majesty, 1914), 58. Canadian coastal cities were supplied with Okanagan vegetables.
21 Colin Malcolm Reeves, “The Establishment of the Kelowna Orcharding Area: A Study of Accommodation to Site and Situation” (MA thesis, University of British Columbia, 1973), 107–8, 112. See also Ormsby, “Fruit Marketing,” 83–86.
22 Ormsby, “Fruit Marketing,” 83–86.23 Kelowna Shippers Union, https://www.memorybc.ca/kelowna-shippers-union.24 David Dendy, “A Cent a Pound or on the Ground: Okanagan Fruit Growers and Marketing,
1920–1935” (MA thesis, University of British Columbia, 1981), available from https://royalbc-museum.bc.ca/exhibits/living-landscapes/thomp-ok/acent/chapter/dendyc2.html#Chapter2.
25 Michael J. Piva, “Urban Working-Class Incomes and Real Incomes in 1921: A Comparative Analysis,” Histoire Sociale/Social History 16 (1983): 143–65.
26 Terry Copp, “The Condition of the Working Class in Montreal, 1897–1920,” in Studies in Canadian Social History, ed. Michael Horn and Ronald Sabourin (Toronto: McClelland and Stewart, 1974), 203; Terry Copp, The Anatomy of Poverty: The Condition of the Working Class in Montreal, 1897–1929 (Toronto: McClelland and Stewart, 1974), 140.
bc studies100
in Canada.27 Using census data for selected occupations, Piva showed that hourly wage rates were higher in the west of the country than they were in the east.28 The data suggest that adult males in Vancouver earned a comparable hourly wage to those in Calgary and Edmonton but more than those in Winnipeg, Hamilton, Toronto, Montreal, Quebec, St. John, and Halifax. However, if the wage data are not taken at face value as a simple hourly rate but are adjusted to account for actual weeks worked, and average earnings per week calculated, a different picture emerges. These data show that adult males in Vancouver earned more than men in St. John and Halifax, a similar amount to those in Quebec, and a markedly lower amount than those in some other cities.29 This dis-tinction between annual and weekly wages is important. We follow Piva’s lead and consider both annual and weekly wage rates for the Okanagan. Our interest here is not to generate an index of real wages. We cannot do so with precision because there is insufficient hard data to enable the local cost of a typical Okanagan family budget to be calculated. To gain an indication of the cost of basic goods, however, we utilize data taken from the Labour Gazette, which from 1915 onwards published monthly estimates of the family budget – that is, “the typical weekly expenditures on staple foods, fuel, lighting and rentals for a family of five whose annual income between 1910 and 1914 was $800.”30 The 1921 Labour Gazette recorded average prices in sixty Canadian cities, including Vancouver. We compare these Vancouver data with Okanagan commodity prices abstracted from a contemporary newspaper, the Penticton Herald. Our data provide a simple snapshot and comparison of local commodity costs but do not provide precise real wage data.
The Sources
Okanagan orcharding developed out of a speculative land market driven by local entrepreneurs who bought the underdeveloped land with the aid of finance, particularly from Britain. The real estate was subsequently irrigated, divided into small lots, and sold.31 Promotional pamphlets –
27 Michael Piva, The Condition of the Working Class in Toronto, 1900–21 (Ottawa: Ottawa University Press, 1979), 49–59; Piva, “Urban Working-Class Incomes.”
28 The occupations were boilermakers, iron moulders, machinists, sheet metal workers, and blacksmiths. See Piva, “Urban Working-Class Incomes,” 147–48.
29 Ibid., 149–50.30 The Labour Gazette, quoted by Eleanor A. Bartlett, “Real Wages and the Standard of Living
in Vancouver, 1901–29,” BC Studies 51 (Autumn 1981): 20.31 David Demeritt, “Farming and Rural Life,” in The Resettlement of British Columbia. Essays on
Colonialism and Geographical Change, ed. Cole Harris (Vancouver: UBC Press, 1997), 219–49,
101Economic Development
containing information on the crops to be grown, farm size, start-up costs, and potential profits – were issued to attract buyers. We draw upon these documents, notably those published by the Kelowna Board of Trade in 1912 and by Central Okanagan Lands Limited, to gain an understanding of the nature and possibilities of fruit farming in British Columbia in and around Kelowna.32 These documents are treated with caution because the publishers had a clear vested interest in promoting local agriculture in the best light. As such, they are used here only as a guide and not as a definitive, quantitative assessment of farming. The occupation and wage data are taken from the censuses of 1881, 1901, 1911, and 1921.33 The censuses of 1911 and 1921 are used in detail to provide snapshots in time of those people who worked on their own account and those who had gainful and thus wage-earning occupations. For the latter, the censuses report annual wages and the number of weeks worked in the year.34 The start date for this more detailed analysis is 1911 because the census of that year is the first to permit a reasonable comparison between urban and rural settlements. Prior to that time, the Okanagan was at the very early stages of emergence and was almost entirely rural.35 Although Kelowna was established in 1901, its population was only 261. Vernon, although incorporated by that time, was also essentially rural, with a population of 802.36 Kelowna was incorporated in 1905 and Penticton, population unknown in 1901, was incorporated in
232–35. See also Koroscil, British Garden of Eden.32 Kelowna British Columbia: The Orchard City of the Okanagan (Vancouver: Kelowna Board
of Trade, 1912); Fruit Farming at Kelowna: The Orchard City of British Columbia (Kelowna: Central Okanagan Lands Limited, n.d.). Glorious Kootenay (Nelson) and Agriculture in British Columbia (Government of British Columbia), both documents cited by J.T. Bealby, in Fruit Ranching in British Columbia (London: Adam and Charles Black, 1909), 28–30. See also Ernest Heaton and J. Beverley Robinson, eds., Heaton’s Annual: The Commercial Handbook of Canada and Boards of Trade Register, Seventh Year, 1911 (Toronto: Heaton’s Agency, 1911), 297–98.
33 The 1911 Census of Canada, British Columbia, Yale and Cariboo, www.ancestry.ca; the 1921 Census of Canada, British Columbia, Yale, www.ancestry.ca.
34 The 1911 census records wages paid in 1910; the 1921 census records the wages paid for the year starting 1 June 1920.
35 Up to 1941, a Canadian settlement that was incorporated was defined as a city. We have previously argued that this definition is too simple and have adopted the classification of an urban centre as any place with a population of at least one thousand people and the presence of key occupations that are found only, or largely, in cities. See Sugden and Sugden, “Economic Development.”
36 Brett McGillivray, Geography of British Columbia: People and Landscapes in Transition (Vancouver: UBC Press, 2000), 217; The Canada Year Book 1932 (Ottawa: F.A. Ackland, 1932), 108.
bc studies102
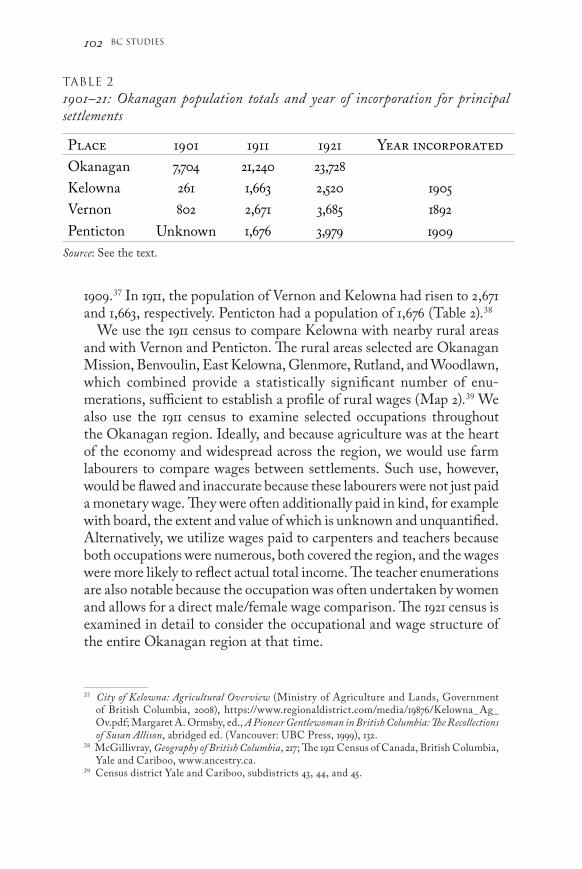
1909.37 In 1911, the population of Vernon and Kelowna had risen to 2,671 and 1,663, respectively. Penticton had a population of 1,676 (Table 2).38 We use the 1911 census to compare Kelowna with nearby rural areas and with Vernon and Penticton. The rural areas selected are Okanagan Mission, Benvoulin, East Kelowna, Glenmore, Rutland, and Woodlawn, which combined provide a statistically significant number of enu-merations, sufficient to establish a profile of rural wages (Map 2).39 We also use the 1911 census to examine selected occupations throughout the Okanagan region. Ideally, and because agriculture was at the heart of the economy and widespread across the region, we would use farm labourers to compare wages between settlements. Such use, however, would be flawed and inaccurate because these labourers were not just paid a monetary wage. They were often additionally paid in kind, for example with board, the extent and value of which is unknown and unquantified. Alternatively, we utilize wages paid to carpenters and teachers because both occupations were numerous, both covered the region, and the wages were more likely to reflect actual total income. The teacher enumerations are also notable because the occupation was often undertaken by women and allows for a direct male/female wage comparison. The 1921 census is examined in detail to consider the occupational and wage structure of the entire Okanagan region at that time.
37 City of Kelowna: Agricultural Overview (Ministry of Agriculture and Lands, Government of British Columbia, 2008), https://www.regionaldistrict.com/media/19876/Kelowna_Ag_Ov.pdf; Margaret A. Ormsby, ed., A Pioneer Gentlewoman in British Columbia: The Recollections of Susan Allison, abridged ed. (Vancouver: UBC Press, 1999), 132.
38 McGillivray, Geography of British Columbia, 217; The 1911 Census of Canada, British Columbia, Yale and Cariboo, www.ancestry.ca.
39 Census district Yale and Cariboo, subdistricts 43, 44, and 45.
Table 2
1901–21: Okanagan population totals and year of incorporation for principal settlements
Place 1901 1911 1921 Year incorporatedOkanagan 7,704 21,240 23,728
Kelowna 261 1,663 2,520 1905
Vernon 802 2,671 3,685 1892
Penticton Unknown 1,676 3,979 1909
Source: See the text.

103Economic Development
It is important to note that the two censuses are problematic, par-ticularly in their recording of the occupations of both First Nations peoples and of married women. First Nations rejected colonial rule, and government records of their occupations are treated with scepticism. The Indian Reserve in the Okanagan Agency was enumerated by the local Indian agent, who recorded 455 males and 397 females in 1921.40 First Nations people were given an Anglo-Saxon name. For those men whose occupation is provided, all worked in the primary sector. A small number were employed in the sawmills, but the large majority were farmers, often owners. The absence of other occupations is problematic. As such the credibility and accuracy of the First Nations enumerations are questionable and are not the subject of this work. Kris Inwood and Richard Reid have reviewed and discussed the issues concerning female employment recorded in nineteenth-century Canadian censuses.41 They note that “women whose principal social identity was not connected to work were unlikely to report a work-connoting occupation, even if their work was essential to family survival and even if they were earning wages.”42 We voice similar concerns with our work using early twentieth-century censuses. These censuses required the enumerators to record the chief or principal occupation or means of living for every person aged ten years and over. The 1921 census book of instructions necessitated that “in the case of a woman doing housework in her own home, without salary or wages, and having no other employment, the entry … should be ‘none.’”43 Only gainful, wage-earning occupations were to be included. This census of the Okanagan contains 4,280 enu-merations for married women, of whom just 1 percent had a recorded occupation. We think it inconceivable that, although unwaged, a larger number of housewives did not contribute to the household other than through homemaking, and that farmer’s wives and daughters did not make an economic contribution to the operation of the farm.
40 Includes sixteen people not belonging to the agency, 1921 Census, British Columbia, Yale, district 25, subdistrict 54, Okanagan Agency, Indian Reserve, www.ancestry.ca.
41 Kris Inwood and Richard Reid, “Gender and Occupational Identity in a Canadian Census,” Historical Methods: A Journal of Quantitative and Interdisciplinary History 34 (2001): 57–70.
42 Ibid., 58.43 Sixth Census of Canada, 1921, vol. 4, Occupations (Ottawa: F.A. Acland, 1929), x.

bc studies104
Okanagan Fruit Farming, 1911–21
Before we discuss wages, and because a significant number of men worked on their own account, earning an income but unwaged, it is useful to place fruit farming in context by considering the cost of land, the types of crops grown, and the expected returns. For instance, in 1912 the Kelowna Board of Trade reported that one-quarter of a sixty-thousand-acre parcel of land stretching twelve to fifteen miles east from Kelowna, away from the Okanagan Lake, was cultivated and under irrigation, the latter essential for commercial fruit farming since the Okanagan is semi-arid and liable to drought.44 According to the board, the cost of land was dependent upon its state of development, ranging from $50 to $150 per acre for underdeveloped land, to $200 to $400 per acre for land cleared and under irrigation, to $600 to $1,500 per acre for a fruit-bearing orchard.45 From first planting, it was estimated that it took four to six years before an orchard bore commercial quantities of fruit. Significant capital was required at the outset and it was reckoned that “a good start can scarcely be made with less than $2,000.”46 J.T. Bealby, quoting a promotional pamphlet issued for Nelson in the Kootenays, puts the start-up costs between $2,000 and $2,500 but believes that these figures were incomplete and fell short.47 He takes support from a BC government publication report that suggested that $2,489 was required just to plant a twenty-acre apple orchard, but a total outlay of $4,838 was necessary before the trees began to yield fruit.48 Regardless of the statistical accuracy of these numbers, they all point to a fruit grower requiring significant money, either as capital or as access to credit. The Board of Trade noted that an apple orchard of ten acres contained approximately 484 trees, with an average crop per tree of ten forty-pound boxes, which sold at $1 per box. Ten acres, therefore, would be expected to produce, on average, $4,840. Operating costs were $200 per acre, such that profit on ten acres was $2,840. A more fully developed orchard, ten years or older, provided a bigger return, dependent upon the variety grown. A promotional pamphlet issued by Central Okanagan Lands Limited claimed that a seven-year-old apple tree yielded $800 per acre.
44 Kelowna British Columbia: The Orchard City of the Okanagan (Vancouver: Kelowna Board of Trade, 1912). See also Eric Leinberger’s map of the irrigated Okanagan in 1913 shown in Demeritt, “Farming and Rural Life,” 235.
45 Kelowna British Columbia. See also Heaton and Robinson, Heaton’s Annual, 298.46 Kelowna British Columbia.47 Bealby, Fruit Ranching, 28–29.48 Ibid., 30.

105Economic Development
Exceptionally, a fourteen-year-old tree of a certain varietal generated $2,000 per acre.49
Occupations and wages in 1911
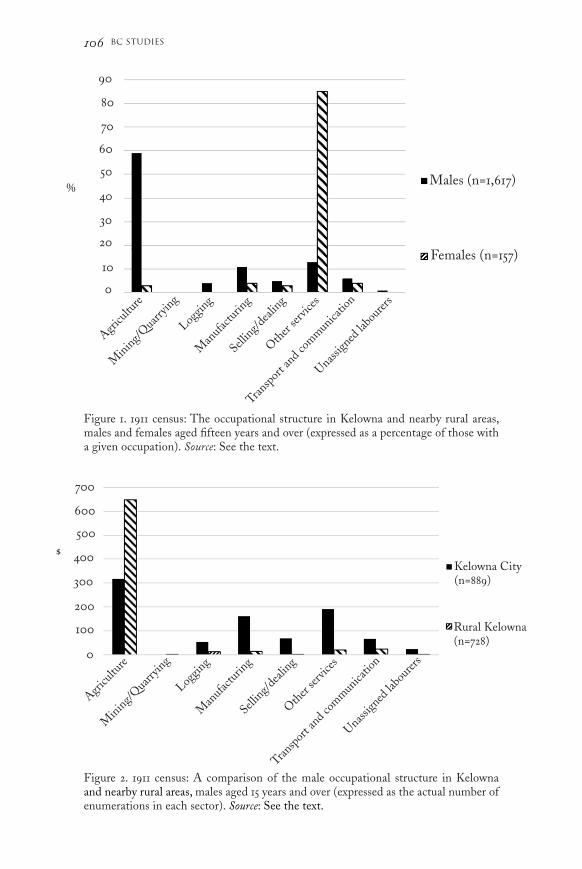
The 1911 census of Kelowna and the neighbouring area contains 2,468 enumerations of males and females aged fifteen years and over.50 Approximately two-thirds of these enumerations were of men, portraying a male-predominant society. Ninety-five percent of these males had a gainful occupation. Of the 775 females, 60 percent were married, of whom only four, 1 percent of the total, were recorded with an occupation outside the home. Of the 315 single women or widows, 133 had a given occupation and twenty had a private income. Over one-half of the males worked in agriculture, whereas over four-fifths of females worked in services (Figure 1). Two hundred and sixty-eight farmers and fruit growers worked on their own account, and therefore all were unwaged. Of these enumerations, two were females. Two hundred and twenty males were farm labourers, such that the ratio of agricultural labourer-to-farm owner was less than one, the size of the workforce consistent with the operation of a small farm.51 A comparison of the numbers of adult male enumerations in each occupational sector in 1911 Kelowna with those in the surrounding rural areas is shown in Figure 2. Approximately two-thirds of the men who worked in agriculture lived outside Kelowna, indicative of farming spreading away from the city. The rise in Kelowna in manufacturing (including building, retail, and other services) shows that the city was urbanizing, developing the necessary structure to support the growing fruit industry. The first decade of the twentieth century was a boom time for the Okanagan. In British Columbia, between 1901 and 1905 the amount of land used for cultivating fruit grew from 7,430 to 29,000 acres, almost all of which was planted in the Okanagan.52 The Okanagan region is
49 Fruit Farming at Kelowna: The Orchard City of British Columbia ( Kelowna: Central Okanagan Lands Limited, n.d.), 6, 13. The Central Okanagan Lands Company owned six thousand acres of irrigated fruit land within six miles of Kelowna in 1911. The pamphlet is not dated but is known to have been issued in the first or second decades of the twentieth century. See Heaton and Robinson, Heaton’s Annual, 298.
50 British Columbia, district of Yale and Cariboo, subdistricts 43–45, www.ancestry.ca.51 The census, taken in early June, did not enumerate itinerant workers – for example, those who
picked the harvest. Also, the descriptor “farm” is used here generically to include all farmers, fruit growers, and orchardists.
52 Dendy, Fruitful Century.
bc studies106
Figure 1. 1911 census: The occupational structure in Kelowna and nearby rural areas, males and females aged fifteen years and over (expressed as a percentage of those with a given occupation). Source: See the text.
Figure 2. 1911 census: A comparison of the male occupational structure in Kelowna and nearby rural areas, males aged 15 years and over (expressed as the actual number of enumerations in each sector). Source: See the text.
Males (n=1,617)
Females (n=157)
Kelowna City (n=889)
Rural Kelowna (n=728)
%
80
0
70
60
50
40
30
20
10
$
0
700
600
500
400
300
200
100
Agricu
lture
Mini
ng/Q
uarry
ing
Loggin
g
Man
ufactu
ring
Selling
/dea
ling
Other
servic
es
Transp
ort a
nd co
mmunica
tion
Unassi
gned
labo
urers
90
Agricu
lture
Mini
ng/Q
uarry
ing
Loggin
g
Man
ufactu
ring
Selling
/dea
ling
Other
servic
es
Transp
ort a
nd co
mmunica
tion
Unassi
gned
labo
urers
107Economic Development
semi-arid, and commercial orcharding is possible only with irrigation.53 Prior to the early twentieth century, Okanagan farmers trapped water according to their own need, but large-scale improvements, beyond the investment capacity of an individual, were required to permit the devel-opment of larger-scale orcharding. In the first decade of the twentieth century, several businesses whose purpose was to improve the land around Kelowna were formed.54 By 1911, the census enumerates as many waged land development labourers as it does farm labourers, indicative of the amount of improvement work ongoing.55 Just over one-half of these men were employed by Belgo Construction Fruitlands Company. A land boom is also shown by the rise in the number of real estate agents in Kelowna. None was enumerated in 1901, but in 1911 there were seven.
53 Kenneth Wayne Wilson, “Irrigating the Okanagan, 1860–1920” (MA thesis, University of British Columbia, 1989).
54 These businesses included the Kelowna Land and Orchard Company (incorporated 1904), the Central Okanagan Land and Orchard Company (incorporated 1906), the South Kelowna Land Company (incorporated 1908), and the Belgo Construction Fruitlands Company (incorporated 1909). See Wilson, “Irrigating the Okanagan,” 31–36.
55 The 1911 census refers to the men engaged in this work as irrigation labourers. This term, however, may be insufficient as an occupational descriptor. The companies involved often had their own orchards for which labour was hired to do clearing, cultivation, and irrigation work. Hence, we refer to these men as land development labourers.
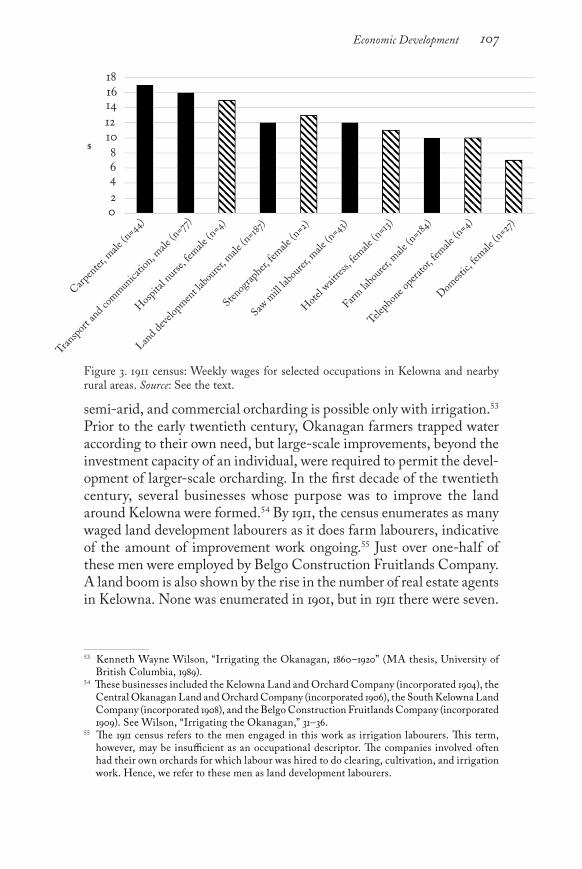
Figure 3. 1911 census: Weekly wages for selected occupations in Kelowna and nearby rural areas. Source: See the text.
Rural Kelowna (n=728)
$
141210864
0
1816
2
Carpen
ter, m
ale (n
=44)
Transp
ort a
nd co
mmunica
tion,
male (n
=77)
Hos
pital
nurse
, female
(n=4
)
Land d
evelo
pmen
t labo
urer, m
ale (n
=187)
Stenog
rapher,
female
(n=2
)
Saw m
ill lab
ourer
, male
(n=4
3)
Hote
l wait
ress, f
emale
(n=13
)
Domest
ic, fe
male (n
=27)
Farm la
boure
r, male
(n=18
4)
Teleph
one o
perat
or, fe
male (n
=4)

bc studies108
The average weekly wage paid in selected occupations in the Kelowna and immediate surrounding areas is shown in Figure 3. Care must be taken with these data because some sample sizes are small and statistical comparison is not necessarily valid. The data show that, taking account of the number of weeks worked, the average annual wage of a farm labourer was $391, around one-seventh of the income expected for the farm owner, but data are perhaps misleading because they take no account of the provision of board or lodging, both of which were highly probable.56 Approximately two-fifths of the farm labourers were of either Chinese or Japanese origin, with an average weekly wage of $8.80, significantly less than that for farm labourers of European origin who, on average, received $10.60 (p=0.0001). The Kelowna Board of Trade reckoned that builders earned between thirty-five and forty-five cents per hour in 1912. This estimation could be slightly optimistic: the census shows that the average wage of a carpenter in and around Kelowna was thirty-five cents per hour, at the low end of the range. By way of comparison, a farm labourer earned nineteen cents per hour. To put these wages into perspective and to provide an indication of purchasing power, the Board of Trade also estimated that the price paid for butter was thirty-five to forty-five cents per pound, and for a dozen fowl $9. From January to March 1911, one pound of creamery butter in Vancouver cost thirty-five cents and a dozen packed eggs thirty-five to forty cents.57 At these prices, a carpenter in and around Kelowna worked one hour to buy one pound of butter or one dozen eggs, and twenty-six hours to purchase twelve chickens. The census records 319 enumerations for carpenters in the Okanagan, of whom fifty-eight worked on their own account, income unknown. A further forty carpenters were waged but their income was not provided in the census. The average wages of the remaining 221 carpenters are shown in Table 3. The average annual wage paid to Kelowna car-penters was statistically similar to that paid to those in Vernon and the rural Okanagan but significantly greater than that paid in Penticton (p=0.03). Similarly, Vernon carpenters were paid more in the year than were those in Penticton (p=0.02). These data, however, disguise the actual wage because Kelowna carpenters worked for more weeks in the year than did those elsewhere. If the number of weeks worked is taken into consideration, and the average weekly wage calculated, then carpenters in Kelowna were paid significantly less than were those in
56 Kelowna Board of Trade, 1912.57 Labour Gazette XXI: 792, 886, 1012.

109Economic Development
either Vernon (p=0.0001) or Penticton (p=0.05). Also, the weekly wage paid in each of the three cities was not statistically different from that paid in rural districts. The average annual wage of a Kelowna carpenter was $810, markedly less than a carpenter in Vancouver and Victoria, where they were paid $915 and $985, respectively, at this time. The 1911 census contains fifty-two enumerations for Okanagan schoolteachers, of whom forty taught in a public city or high school, and one taught in a private school. The type of school in which the remaining eleven teachers worked is unknown. Thirty-three teachers were female and nineteen were male. On average, they worked forty-two weeks in the year, but women earned only $664 per annum whereas men earned $884 (p=0.0002). There was no significant difference in wages, male and female, in the three cities and elsewhere. The wages of public, city, and high school teachers were controlled by the provincial government. The Report of the Superintendent of Education, 1910–11, records the name and monthly wage of all public school teachers in British Columbia. In the Okanagan, there are fifty-three enumerations, thirteen more than those captured in the census.58 It is not clear whether the discrepancy between the two sets of numbers is caused by the census under-reporting or whether it is simply a reflection of timing. The census was taken during the first week of June and is a snapshot of residency at that time, whereas the report covers the school year ending 30 June 1911. Teachers may have come and gone and moved over the year. Nonetheless, of the fifty-three enumerations in the super-intendent’s report, there are twenty men, thirty-one single women, and two married women. The average monthly wage of male teachers was
58 Report of the Superintendent of Education, 1910–11, 2. Geo. 5 (Victoria: Minister of Education, 1911), A xci, A cii, A cviii, A cx, A cxvi, A cxvii, and A xcviii.
Table 3
1911: Okanagan carpenters, average wages
Place Number Wage p.a. ($)
Weeks worked
Weekly wage ($)
Kelowna 33 810 46.5 17
Vernon 60 848 40 21
Penticton 40 687 36 19
Rural Okanagan 88 747 39 20
Source: See the text.

bc studies110
$91, the average for women was $68. These differences in wages may be related to age. For instance, the census indicates that the average age of female teachers was twenty-four years, and that for male teachers was thirty-six years. They may also be related to the level of qualification, the certification that each held, but there is no way of confirming that from these data. Other than farm labouring, Japanese immigrants made a significant contribution to Okanagan agriculture at this time. For instance, the first cannery in Kelowna, opened around 1908, was supplied by tomato growers, particular Japanese farmers who rented land for that purpose.59 Frank William Fraser, manager of Kelowna Canning Company, giving evidence to the Provincial Labour Commission, 1912–14, reported that there were fifty to sixty Japanese tomato growers, working in partnership with local farmers. Their arrangement was such that the farmer prepared the land, supplied the horses, and brought the produce to factory, and the Japanese planted and tended to the crop, each taking half of the profits.60 John Logan Logie, a Summerland fruit grower, employed three Japanese men for nine months of the year, from the beginning of March until the end of November, whom he paid $60 per month and, in-kind, a house to live in, a garden, and a wood. Over the winter, they worked cutting wood for Logie and others, returning to the farm the following March.61 Catherine Kyle has studied land tenure in her analysis of Okanagan market gardeners between the 1910s and 1950s.62 Kyle utilizes an extended area of the region, particularly to the north, and notes extensive land ownership by both Japanese and Chinese in the second decade of the twentieth century.
Occupations and wages in 1921
We now turn attention to the analysis of the Okanagan census of 1921. The census records 15,839 enumerations, of which 9,150 were males and 6,689 females aged fifteen years and over. Whereas only 7 percent of the males either had no given occupation or their census entry was ineligible, 80 percent of the females had no given occupation. Of the females, 4,280 were married but, and as with the 1911 census, only 1 percent of those 59 Leopold Hayes, “Trials and Tribulations in the Okanagan Fruit and Vegetable Canning
Industry,” Twenty-Fifth Annual Report of the Okanagan Historical Society (Vernon, BC: Okanagan Historical Society, 1961): 51–60, 52–53.
60 BCA, GR-684, Labour Commission 1912–14, box 2, file 5, vol. 5, 13.61 Hayes, “Trials and Tribulations,” 55–56.62 Catherine Jane Kyle, “Lost Landscapes of the Market Gardeners” (PhD diss., University of
British Columbia, 2017), 132–34.

111Economic Development
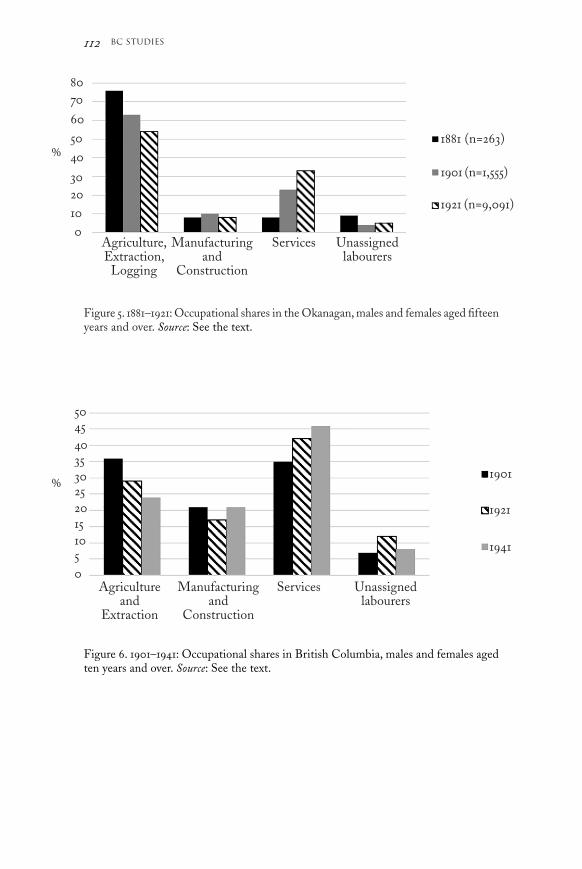
were recorded with an occupation. The occupational shares of males and females in gainful employment are shown in Figure 4. Approximately 50 percent of the males worked in agriculture, whereas over 70 percent of the females were employed in the service sector. There are 714 enu-merations for males working in manufacturing, 45 percent of whom were employed in the building trades. Others were employed in a range of occupations such as blacksmiths, engineers/mechanics, butchers, bakers, and tailors. There was no other significant manufacturing industry. It is interesting to note that the occupational share of agriculture declined between 1881 and 1921 to be replaced by the service sector (Figure 5).63 Petty’s Law, the scholarly orthodoxy of modern economic growth, states that as the agricultural sector declines, the share of the labour force in manufacturing grows, followed later by the rise in the service sector.64 This view is challenged by a major study of nineteen countries by the Cambridge Group for the History of Population and Social Structure, University of Cambridge.65 Their work indicates that only
63 The 1881 census, LAC, http://www.bac-lac.gc.ca/eng/census/1881/Pages/about-census.aspx; the 1901 census, British Columbia, Yale and Cariboo, www.ancestry.ca; LAC, https://www.bac-lac.gc.ca/eng/census/1901/Pages/1901.aspx; the 1921 census, British Columbia, Yale, www.ancestry.com.
64 W. Petty, “Political Arithmetic” (1690), cited by Harold Perkin, The Origins of Modern English Society, 2nd ed. (London: Routledge, 2005), 101.
65 Leigh Shaw-Taylor and Osamu Saito, The International Network for the Comparative History of Occupational Structure (INCHOS), Cambridge Group for the History of Population and
Figure 4. 1921 census: The occupational structure of the Okanagan, males and females aged fifteen years and over. Note: Five percent of both males and females were students. Source: See the text.
%
60
50
40
30
20
10
0
80
70
Agricu
lture
Mini
ng/Q
uarry
ing
Loggin
g
Man
ufactu
ring
Selling
/dea
ling
Other
servic
es
Transp
ort
Unassi
gned
labo
urers
Males (n=8,095)
Females (n=961)
bc studies112
Figure 5. 1881–1921: Occupational shares in the Okanagan, males and females aged fifteen years and over. Source: See the text.
Figure 6. 1901–1941: Occupational shares in British Columbia, males and females aged ten years and over. Source: See the text.
%
1881 (n=263)
1901 (n=1,555)
1921 (n=9,091)
%
60
50
40
3020
10
0
8070
Unassigned labourers
Manufacturingand
Construction
ServicesAgriculture, Extraction,
Logging
Unassigned labourers
Manufacturingand
Construction
ServicesAgriculture and
Extraction
1901
1921
1941
4550
40
30
20
10
0
15
35
25
5
113Economic Development
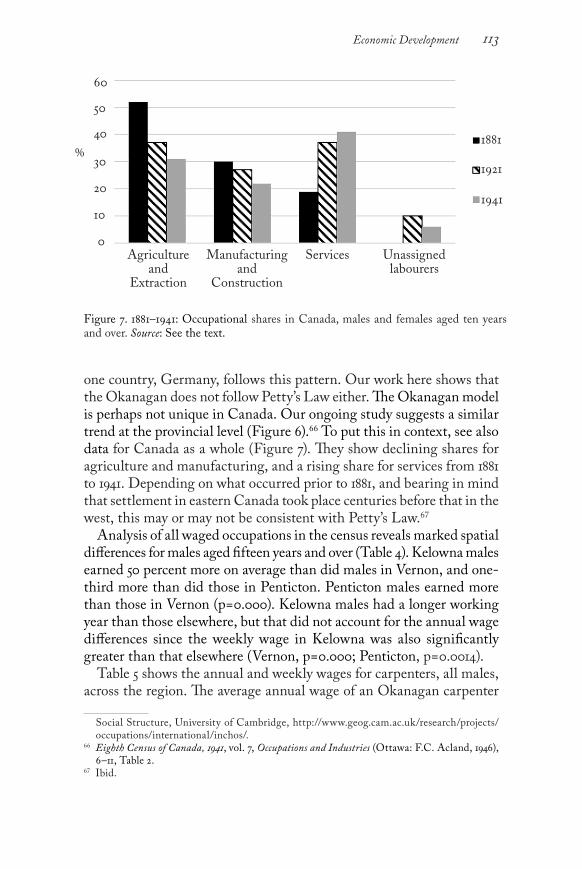
one country, Germany, follows this pattern. Our work here shows that the Okanagan does not follow Petty’s Law either. The Okanagan model is perhaps not unique in Canada. Our ongoing study suggests a similar trend at the provincial level (Figure 6).66 To put this in context, see also data for Canada as a whole (Figure 7). They show declining shares for agriculture and manufacturing, and a rising share for services from 1881 to 1941. Depending on what occurred prior to 1881, and bearing in mind that settlement in eastern Canada took place centuries before that in the west, this may or may not be consistent with Petty’s Law.67
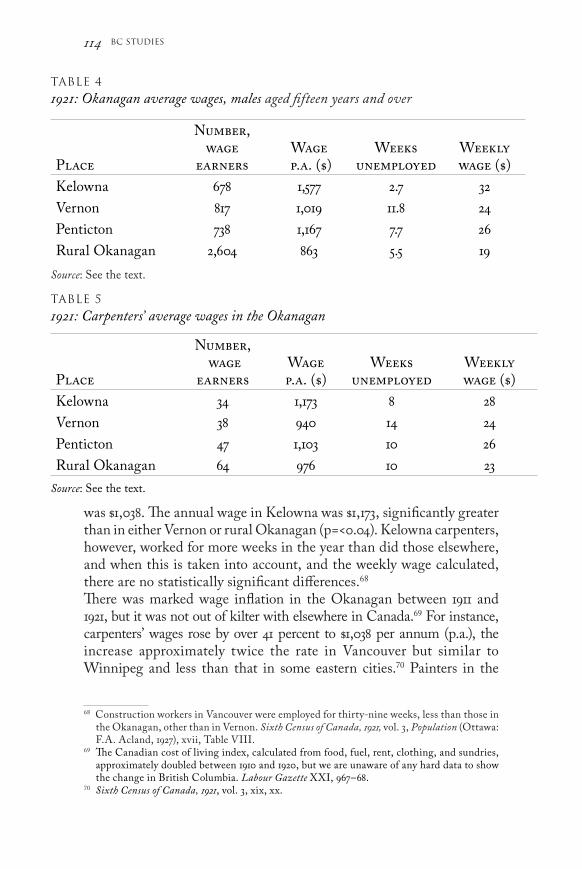
Analysis of all waged occupations in the census reveals marked spatial differences for males aged fifteen years and over (Table 4). Kelowna males earned 50 percent more on average than did males in Vernon, and one-third more than did those in Penticton. Penticton males earned more than those in Vernon (p=0.000). Kelowna males had a longer working year than those elsewhere, but that did not account for the annual wage differences since the weekly wage in Kelowna was also significantly greater than that elsewhere (Vernon, p=0.000; Penticton, p=0.0014). Table 5 shows the annual and weekly wages for carpenters, all males, across the region. The average annual wage of an Okanagan carpenter
Social Structure, University of Cambridge, http://www.geog.cam.ac.uk/research/projects/occupations/international/inchos/.
66 Eighth Census of Canada, 1941, vol. 7, Occupations and Industries (Ottawa: F.C. Acland, 1946), 6–11, Table 2.
67 Ibid.
Figure 7. 1881–1941: Occupational shares in Canada, males and females aged ten years and over. Source: See the text.
%
60
50
40
30
20
10
0
1881
1921
1941
Unassigned labourers
Manufacturingand
Construction
ServicesAgriculture and
Extraction
bc studies114
was $1,038. The annual wage in Kelowna was $1,173, significantly greater than in either Vernon or rural Okanagan (p=<0.04). Kelowna carpenters, however, worked for more weeks in the year than did those elsewhere, and when this is taken into account, and the weekly wage calculated, there are no statistically significant differences.68 There was marked wage inflation in the Okanagan between 1911 and 1921, but it was not out of kilter with elsewhere in Canada.69 For instance, carpenters’ wages rose by over 41 percent to $1,038 per annum (p.a.), the increase approximately twice the rate in Vancouver but similar to Winnipeg and less than that in some eastern cities.70 Painters in the
68 Construction workers in Vancouver were employed for thirty-nine weeks, less than those in the Okanagan, other than in Vernon. Sixth Census of Canada, 1921, vol. 3, Population (Ottawa: F.A. Acland, 1927), xvii, Table VIII.
69 The Canadian cost of living index, calculated from food, fuel, rent, clothing, and sundries, approximately doubled between 1910 and 1920, but we are unaware of any hard data to show the change in British Columbia. Labour Gazette XXI, 967–68.
70 Sixth Census of Canada, 1921, vol. 3, xix, xx.
Table 4
1921: Okanagan average wages, males aged fifteen years and over
Place
Number, wage
earnersWage
p.a. ($)Weeks
unemployedWeekly wage ($)
Kelowna 678 1,577 2.7 32
Vernon 817 1,019 11.8 24
Penticton 738 1,167 7.7 26
Rural Okanagan 2,604 863 5.5 19
Source: See the text.
Table 5
1921: Carpenters’ average wages in the Okanagan
Number, wage
earnersWage p.a. ($)
Weeks unemployed
Weekly wage ($)Place
Kelowna 34 1,173 8 28
Vernon 38 940 14 24
Penticton 47 1,103 10 26
Rural Okanagan 64 976 10 23
Source: See the text.

115Economic Development
Table 4
1921: Okanagan average wages, males aged fifteen years and over
Place
Number, wage
earnersWage
p.a. ($)Weeks
unemployedWeekly wage ($)
Kelowna 678 1,577 2.7 32
Vernon 817 1,019 11.8 24
Penticton 738 1,167 7.7 26
Rural Okanagan 2,604 863 5.5 19
Source: See the text.
Table 5
1921: Carpenters’ average wages in the Okanagan
Number, wage
earnersWage p.a. ($)
Weeks unemployed
Weekly wage ($)Place
Kelowna 34 1,173 8 28
Vernon 38 940 14 24
Penticton 47 1,103 10 26
Rural Okanagan 64 976 10 23
Source: See the text.
Table 6
1921: Okanagan male average weekly wages and the annual number of weeks worked in selected occupations
Occupation NumberWeeks
employedWeekly wage ($)
Railway workers 232 47 33
Electrician/electrical engineer 52 46 29
Schoolteacher 33 50 27
Motor mechanic 48 46 26
Carpenter 221 41 25
Clerk 197 48 24
Fruit packer 46 41 22
Labourer, odd job 101 36 16
Labourer, sawmill 101 45 16
Labourer, irrigation 92 37 14
Labourer, farm 965 44 14
Source: See the text.
Figure 8. 1921 census: Wages paid to Penticton male railway workers and carpenters. Note: The thick black line shows the average wage of a Penticton carpenter. Source: See the text.
$
4,000
0
3,500
3,000
2,500
2,000
1,500
1,000
500
Railway employee wage, by enumeration
151 8 22 29 36 43 50 57 64 71 78 85 92 9910
6 117 124 131 152145138

bc studies116
Okanagan and Vancouver earned $1,161 and $1,098, respectively.71 Penticton trainmen were paid $1,819 on average; in Vancouver, they earned $1,831. Teachers wages were controlled by the government and they also showed a marked rise. The average wage paid to female public schoolteachers in Kelowna in 1911 was $972 p.a. In 1921, it was $1,265 p.a., a rise of 30 percent.72
A comparison of male weekly wages in selected occupations is shown in Table 6. The railways offered a wide range of job opportunities, such as locomotive engineer, fireman, conductor, brakeman, dispatcher, clerk, and cashier. Engineers, firemen, and conductors were among the highest paid. Only 2 percent of the adult male Okanagan male labour force worked on the railways, but the number is misleading because the industry was localized, restricted to only those places with a rail link. The railway had the most significant impact in Penticton, the headquarters of the Kettle Valley Railway, situated on the line that, in 1914, connected Vancouver to the Kootenays, west of the Okanagan.73 Two-thirds of Okanagan railway employees lived in Penticton, and 21 percent of the 717 waged Penticton males were dependent upon the railway for work. The average wage paid to these railway men was $33 per week. The average weekly wage for the other Penticton adult males was only $24 (p=0.0001). The range of wages paid to railway men is shown in Figure 8 and compared to the average annual wage of a Penticton carpenter (n=47). Annual railway wages were boosted in that they were for a greater number of working weeks in the year. Penticton railway men worked for forty-eight weeks per year on average, whereas a Penticton carpenter worked for only forty-two weeks.74 The average Okanagan male weekly wage was $22 (n=4,828). Waged females were paid much less: $13 per week (n=745). Some jobs were pre-dominantly worked by women; for instance, 90 percent of Okanagan stenographers were female. These women were paid $17 on average (n=64). A male stenographer received $20 per week (n=6). Telephone operators were exclusively female, and they earned $14 per week. Nurses,
71 Ibid.72 Report of the Superintendent of Education 1910–11: Fiftieth Annual Report of the Public Schools of
the Province of British Columbia 1920–21 (Victoria: William H. Cullin, printer to the King’s Most Excellent Majesty, 1921), F 18.
73 Maurice Williams, Myra’s Men: Building the Kettle Valley Railway, Myra Canyon to Penticton (Kelowna: Myra Canyon Trestle Restoration Society, 2008), 1914. See also http://www.bcad-venture.com/adventure/explore/kootenays/trails/kettle.htm; Ian Pooley, “When the Titans Met: Railway Rivalry in the Okanagan and Kelowna’s Rise as Fruit Shipping Centre,” BC Studies 176 (2012–13): 55–92.
74 It is known also that low unemployment in British Columbia was an issue in the first half of 1921. Trade unions reported that it was higher in some trades (e.g., carpenters) than it was in others (e.g., on the railways). See Labour Gazette XXI: 1398–403.

117Economic Development
also all female, earned $10 per week (n=44). Female teachers, all types and across all schools (n=111), earned $22, less than male teachers, $27 (n=27, p=0.0007). Teacher’s wages were perhaps partly driven by the level of qualification. Male teachers were more likely to hold academic and first class certification, and higher salary, than were women, who frequently held second and third class certificates.75
Federal government data, calculated from average prices in sixty cities, indicate that British Columbia was the most expensive of all Canadian provinces. The estimates show that the weekly cost of staple foods in November 1921 for a family in British Columbia was $12.28, whereas in neighbouring Alberta it was $10.81, and in Ontario $10.97.76 Although there are no government data to enable the construction of an Okanagan cost of living index, an indication of local prices can be obtained from newspapers. Advertisements in the Penticton Herald, for
75 Unlike the 1910–11 report, that of 1920–21 records the level of each teacher’s certification. See Fiftieth Annual Report of the Public Schools of the Province of British Columbia 1920–21.
76 Labour Gazette XXI: 1512–20.
Table 7
1921: Price of commodities in Penticton and Vancouver
CommodityPenticton,
cents per lb*Vancouver,
cents per lb*
Creamery butter 40–45 49.3
Potatoes 4 1.7
Rice 12.5 5–8.3
Onions 2.5 6.2
Bacon 45–55 53.1–58.4
Cheese 40 33.3
Eggs 55 59.2–75.2
Flour 6 5.1
Sugar 9.5–11 8.1–8.8
Tea 49–55 50.6–55.2
Coffee 49 47.7–48.4
Total, cheapest basket 312.5 319.3
* Prices are cents per pound except eggs, which are per dozen.Sources: 1921 Penticton Herald; Labour Gazette XXI.
bc studies118
example, give the prices of a small number of commodities to permit comparison with the government data for Vancouver (Table 7).77 We do not suggest that the range of goods in Table 7 represents a subsistence basket, nor do they take into account other factors such as rent, but they are a useful comparator of cost of goods across the region and suggest that commodities in the Okanagan were similarly priced to those in Vancouver. The average cost of staple foods to a BC family, November 1919 to November 1921, was $14.75.78 Assuming a fifty-two-week working year, this weekly cost equates to $767 per annum.79 The average wage of an Okanagan adult male was $1,036. There is a very clear suggestion that the average standard of living in the Okanagan was well above subsistence level and was comparable with that in Vancouver. The 1921 census provides a good indication of the contribution made to the Okanagan economy by males of Chinese and Japanese origin. Over 95 percent of these men worked in agriculture, in particular, or as cooks or sawmill labourers. Of the 376 enumerations of Chinese males working in agriculture, only around one-half were waged, mostly as labourers. Of the others, 114 had their own farm or ranch, either solely or in partnership with another. Twelve Chinese males rented their farm and a further thirteen were described as farm operators. Chinese and Japanese men continued to make a significant contribution to the local economy.
Discussion and Conclusions
This article draws heavily upon evidence recorded in the early censuses. The problems associated with these sources, the under-reporting of both First Nations and of married women’s work, have been noted. To reiterate: our objective is to understand wage differentials by occupation, by gender, and by place; to investigate spatial variances; and to position those within the context of wages paid elsewhere, notably in Vancouver, and the cost of basic commodities. We consider four questions: (1) How was Okanagan orcharding organized? (2) How did differing occupational structures and wage profiles reflect the local community and its economy? (3) Can any differences in wages across urban centres be attributed to
77 Ibid. These are 1921 editions of the Penticton Herald published on 13 January, 22 June, 27 July, 3 September, 14 September, 28 September, and 5 November.
78 Labour Gazette XXI: 1520.79 The 1921 census indicates that the median working year for 4,767 waged Okanagan males was
fifty-two weeks.
119Economic Development
changing local circumstances? (4) How did Okanagan wages compare with those elsewhere in British Columbia? With regard to the first question, consider that, in their study of Southwest Michigan agriculture, Alan P. Rudy and colleagues describe three distinct temporal phases that took place over an eighty-eight-year time period: industry development 1852–98, extensive cultivation 1899–1919, and marketing concerns 1920–40.80 Okanagan fruit orcharding grew so rapidly that the first two phases of development overlapped. Moreover, the logistical issues associated with individual farmers needing to sell their produce in distant markets was such that the need for a concerted marketing effort became apparent very quickly. The orchards developed at a time when most work was performed manually by the farmer, his family, and perhaps hired waged labour, some of which was seasonal, particularly during harvest.81 Tractors and other machinery were not in common use until the 1930s and thereafter.82 There were few economies of scale in fruit production at this time. Fordism, the application of technology and capital to maximize production, was a phenomenon that occurred after the Second World War.83 Demeritt dismisses the use of “grand historical phases like pre-capitalist/capitalist and Fordism/post-Fordism” to better understand BC agriculture.84 Alternatively, rather than trying to explain agriculture by reference to the political economy and capitalist production, he prefers a discursive examination of the manner in which agriculture was conceived and practised. We adopt a similar approach in this work, using empirical data and the views expressed by contemporary commentators to understand Okanagan orcharding. Orcharding was promoted as a vision of idyllic rural life.85 The development of the Okanagan orchard industry was fed by boosterism, initiated by wealthy landowners whose practices undoubtedly fuelled
80 Alan P. Rudy, Craig K. Harris, Brian J. Thomas, Michelle R. Worosz, Siena S.K. Kaplan, and Evann C. O’Donnell, “The Political Ecology of Southwest Michigan Agriculture,” Agrarian Landscapes in Transition: Comparisons of Long-Term Ecological and Cultural Change, ed. Charles R. Redman and David R. Foster (Oxford: Oxford University Press, 2008), 152–205.
81 The census data were collected in the first week of June and therefore before the apple harvest. Regardless, the enumerators were instructed not to record itinerant workers. There would have likely been many, but they are not captured in this work.
82 Demeritt, “Farming and Rural Life,” 234.83 Rudy et al., “The Political Ecology of Southwest Michigan Agriculture,” 186.84 David Demeritt, “Visions of Agriculture in British Columbia,” BC Studies 108 (Winter 1995–96):
29–59, 30–31.85 Ibid., 34–36.
bc studies120
economic growth.86 Companies were formed to develop sites.87 Limited liability companies bought large tracts of land and, with the support of government and entrepreneurs, they used newspapers, magazines, testimonial letters, and other sources to actively attract emigrants into the Okanagan.88 Many came from Britain and, to a lesser extent, from elsewhere in Europe. Others came from the Prairies and eastern Canada, having left Europe earlier in the 1880s and 1890s.89 Most emigration was by necessity, and emigrants were endowed with capital, or access to credit, without which land could not be purchased and their business started.90 A vision of respectability was promulgated with regard to some aspects of agriculture, particularly fruit growing.91 The promised arcadian lifestyle, however, was hard to maintain.92 The 1914 British Columbia Royal Commission on Agriculture reported that misrepresentations by real estate agents regarding essential conditions, such as climate, soil type, land-clearing, irrigation, and earning-capacity, was affecting the value of land.93 Many settlers had no orcharding or horticultural experience.94 Moreover, orcharding took time. Even if the land was cleared and irrigated, new trees needed to be planted, but these did not bear com-mercial quantities of fruit for up to six years, depending upon the density of trees and the expertise of the farmer.95 Of the 1,370,513 apple trees planted in the Okanagan by 1913, 70 percent were under five years old and, thus, bearing little or no commercial quantities of fruit.96 The delay to harvest could be offset by planting small fruit and root crops in the orchards between the rows, but many emigrants lacked fruit-growing experience or expertise, and unsuitable fruit varieties were sometimes
86 Cornelius J. Jaenen, Promoters, Planters and Pioneers: The Course and Context of Belgian Settlement in Western Canada (Calgary: University of Calgary Press, 2011), 177, 194.
87 Albeit not always successfully because cattle ranchers, the existing land owners, were reluctant to sell plots for subdivision. See Dendy, Fruitful Century.
88 Koroscil, British Garden of Eden, 103; Ormsby, “Fruit Marketing,” 81–82; Demeritt, “Visions of Agriculture,” 34–36; Province of British Columbia Full Report on the Royal Commission on Agriculture, 12.
89 Koroscil, British Garden of Eden, 77, 102–3.90 Ibid., 5.91 Demeritt, “Visions of Agriculture,” 34–35.92 Ibid., 3593 Province of British Columbia Full Report on the Royal Commission on Agriculture, 1594 Reeves, “Establishment of the Kelowna Orcharding Area,” 48; Demeritt, “Farming and Rural
Life,” 231–34.95 John Edward Swales, Commercial Apple Growing in British Columbia (Victoria: Ministry of
Agriculture, 1978), 8.96 Province of British Columbia Full Report on the Royal Commission on Agriculture, 358.

121Economic Development
grown on poor soil.97 Fruit growers “faced years of back-breaking work to develop viable farms.”98 Orchardists needed to learn their trade and did so mostly by trial and error.99 They required money, or access to credit, to tidy over this non-productive, early period. The work was not easy, and orchards were small. The British Columbia Department of Agriculture statistics of 1913 reported that 60 percent of orchards in the Okanagan Valley averaged nine acres and under.100 In 1978, the Ministry of Agri-culture estimated that twenty-five acres was the minimum orchard size for a commercially viable enterprise.101 Care obviously must be taken to compare farming productivity in the early years of the twentieth century, when all work was undertaken by hand, with that in 1978 when machinery and modern technology were available, but it is interesting to note that British Columbia Department of Agriculture statistics of 1913 stated that 60 percent of orchards in the Okanagan Valley averaged nine acres and under.102 By government standards, farms of this size were perhaps not viable. One grower, who had bought land from Lord Aberdeen’s estate, sold up and returned to Britain in 1911, reporting that “it was impossible not to be struck with the obvious, shall I say, lack of riches everywhere. I met man after man, some of whom had been fifteen or twenty years in the country, but never one of them had done much more than keep his head above water.”103 By 1913, the land boom of the first decade of the twentieth century was over and large tracts of irrigated land were left unsold.104 Anthony Casorso purchased a sixteen-acre fruit and vegetable farm in 1918, owning the property for thirty years, growing mainly tomatoes and onions, all work undertaken by horse and hand labour, and working from four o’clock in the morning until ten o’clock at night in the busy season. For many years, produce was scrapped because the market was poor.105
97 Kyle, “Lost Landscapes,” 5.98 Demeritt, “Visions of Agriculture,” 38.99 Demeritt, “Farming and Rural Life,” 232–33.100 Agricultural Statistics, 1913 (Victoria: BC Department of Agriculture, bull. 59, 1914), 60, cited
by Demeritt, “Visions of Agriculture,” 35.101 The minimum requirement of twenty-five acres is taken from a 1978 Ministry of Agriculture
publication. See Swales, Commercial Apple Growing, 8; Agricultural Statistics, 1913, 60, cited by Demeritt, “Visions of Agriculture,” 35.
102 Swales, Commercial Apple Growing, 8. Agricultural Statistics, 1913, 60, cited by Demeritt, “Visions of Agriculture,” 35.
103 Dendy, “Development of the Orchard Industry,” 72.104 Ibid.105 Casorso’s wife helped to plant and harvest the crop, one of the few contemporary references
to a married woman helping on the family farm. See Margaret Greening, “Anthony Casorso, Pioneer Kelowna Rancher,” Thirty-Second Annual Report of the Okanagan Historical Society (Vernon, BC: Okanagan Historical Society, 1968), 42–52, 50.
bc studies122
Fruit growers were exposed to the vagaries of the crop and the weather, and returns in some years were better than others. For instance, G.F. Robinson reported that Okanagan fruit prices were good between 1918 and 1921, but in 1922 the business hit a downturn and many growers did not have the money to pay the packing houses. Robinson picked seven hundred boxes of apples for which he received $103. In 1923, his total returns were $150. The following year, the two hundred newly planted trees were killed by the cold weather. By 1926, Robinson “managed to raise $65.00 for new trees. These I planted and took every care of them but only to run short of irrigation water.”106 From this evidence, the promise offered by the promotional pamphlets was likely unfulfilled for many settlers. Indeed, the Labour Commission, 1912–14, was informed that Kelowna fruit growers with small holdings made little money in a poor year and struggled without outside help.107 The commission was told, by the same witness, that a fruit farm “was a sort of hobby for retired officers or people with medium income.”108
Turning now to the questions about wages, in 1911 two-thirds of the 1,624 enumerations of gainfully occupied males aged fifteen years and over in Kelowna and the surrounding rural areas were waged. The average annual wage of these men was $578. Fifty-four percent of these men earned less than that amount. Two hundred and sixty-eight farmers and fruit growers worked on their own account, approximately one-half of the total number of men with their own business. These farmers employed 220 male labourers, the latter at an average annual wage of $391, without lodging. These data are in line with those reported by the Kelowna Canning Company, which, in 1908, paid white farm labourers $40 per month plus board.109 It is difficult to envisage how this income provided much more than subsistence living, and there is some evidence, albeit slight, to indicate that some farm workers supplemented their income by working as loggers in winter.110 As the Okanagan economy developed, the population increased, but the agricultural share of the labour force declined very quickly, to be replaced by the service sector, in non-compliance with Petty’s Law. By
106 G.F. Robinson, “An Okanagan Fruit Grower Looks Back,” Thirty-Eighth Annual Report of the Okanagan Historical Society (Vernon, BC: Okanagan Historical Society, 1974), 61–69, 62.
107 BCA (1912–14), 42–43.108 Ibid., 48.109 Ibid., 14–15.110 Japanese farm workers in Summerland. See BCA (1912–14), 55–56. Farm workers in Grinrod,
situated approximately forty-six kilometres north of Vernon. See Rita Van Solkema, “Grinrod,” Thirty-Second Annual Report of the Okanagan Historical Society (Vernon, BC: Okanagan Historical Society, 1968), 146–49, 148.
123Economic Development
1921, the economy had evolved from simple rural farming. The region urbanized, and the three cities of Kelowna, Vernon, and Penticton had begun to develop. Electricity, automobiles, and railways were introduced. Wages had risen markedly from the levels in 1911, but were not out of line with those elsewhere in British Columbia. Vernon, Kelowna, and Penticton urbanized, and a clear distinction between rural and city occupations and wages materialized. For instance, carpenters in Kelowna and Vernon in 1911 were paid more per annum than were those in rural Okanagan. Kelowna carpenters, however, because they worked for more weeks in the year than did those in Vernon and Penticton, were paid at a lower weekly rate. By now, teachers’ wages were at a consistent level across the region. Nearly two-thirds of the latter were female, mainly single women, and were paid less than were men. In 1921, Kelowna men on average earned significantly more per annum and per week than did men in Vernon, Penticton, and in the rural Okanagan. There were more and higher-paid jobs in the city than there were elsewhere, and the Kelowna wage economy appears to have been flourishing. A railway link to Kelowna did not open until 1925, but several years earlier a contemporary newspaper noted that rail companies were aware of the economic potential. For instance, in 1912 the Kelowna Courier and Okanagan Orchardist reported that the Canadian Northern Railway company was proposing a link to Kamloops, which the Kettle Valley Railway countered by suggesting an alternative link to Vernon.111 The introduction of the railway into Penticton in 1914 had significant economic impact upon the city. Within seven years, railways accounted for 21 percent of the male Penticton labour force. High wages were paid, on average $33 per week. For other Penticton males, the average weekly pay was only $24. The difference raises the question of how the dominance of the railway affected the economic growth of the city beyond 1921. This will be the subject of further work, depending upon access in the coming years to the wage data recorded in the 1931 census, but there is evidence to suggest that, by that time, fruit farming in Kelowna and Vernon had left Penticton far behind. For instance, in 1932 there were nearly three times as many acres of orcharding in Kelowna and its surrounding district than there were in and around Penticton.112
There are insufficient data to allow estimation of the actual cost of living in the Okanagan, but government estimates of the cost of basic
111 Kelowna Courier and Okanagan Orchardist, 4 January 1912, cited by Pooley, “When the Titans Met,” 62–63.
112 Country Life, July 1932, cited by Pooley, “When the Titans Met,” 87.

bc studies124
commodities, and information abstracted from a Penticton newspaper, suggest that the Okanagan standard of living was comparable with that elsewhere in British Columbia. Moreover, government data indicate that a minimum of $767 per annum was required to feed a Canadian family. The average wage of an Okanagan adult male was $1,036, significantly above the subsistence level. There is much work to be done to further investigate the economy of the Okanagan. In addition to investigating wage patterns between 1921 and 1931, we are gathering occupational data from the censuses through to the end of the twentieth century. These data will not only enable the economic development of the Okanagan to be better understood but also place it within the context of British Columbia, the other provinces, and Canada as a whole. The Okanagan does not follow Petty’s Law – nor does British Columbia, nor perhaps Canada. Further work is required to better understand, in context with other countries, how and why the manufacturing sector was skipped as the region moved directly to the service sector.