economic impact of agriculture and agribusiness in dade county
TRANSCRIPT
Economic Impact of Agriculture andAgribusiness in Dade County, Florida
Submitted to theDade County Farm Bureau
in fulfillment ofsponsored Program Agreement
96093-C
byRobert L. Degner
Susan D. MossW. David Mulkey
August 31, 1997
the Florida Agricultural Market Research Centera part of the
Food and Resource Economics DepartmentInstitute of Food and Agricultural Sciences
University of Florida, Gainesville, FL 32611-0240
i
PREFACE
This study was conducted at the request of numerous individuals in Dade County
representing agricultural and business interests and local government. It was conducted with the
financial support of the Dade County Farm Bureau.
The conclusions and opinions expressed in this report are those of the authors and do not
necessarily represent those of the grantors.
ii
ABSTRACT
This study evaluates the importance of agricultural production and related activities to
Dade County's economy. Data for analyses were based on published and unpublished data and
interviews with growers, shippers, extension personnel and others familiar with Dade County
agriculture. Input-output analysis was used to determine the economic impact of agricultural
subsectors, i.e., fruit, vegetable and nursery subsectors, on the Dade County economy and
economic interrelationships with other sectors of the county's economy. Input-output analysis
showed sales of agricultural products contributed $834 million to Dade County output and almost
$200 million to the county's income. The nursery industry contributed the most in terms of
dollars, followed by the vegetable industry and then the fruit industry. Descriptions of selected
commodities produced in the county and a historical view of agriculture in the county are also
reported.
Keywords: Agriculture, Economic Impact, Input-Output Analysis, Fruits, Vegetables,
Ornamental Horticulture.
iii
ACKNOWLEDGMENTS
This study would have been impossible without the cooperation of the many organizations
and individuals interested in the future of agriculture in Dade County. We are grateful to the
Dade County Farm Bureau for their financial support and to Tom Kirby, Executive Director,
Dade County Farm Bureau, for handling administrative details associated with the project. We
are also grateful to the Dade County chapter of the Florida Nurserymen & Growers Association
for their endorsement of the nursery survey.
Technical assistance was also provided by many organizations and individuals. Special
thanks go to the Florida Agricultural Statistics Service, the Florida Department of Agriculture and
Consumer Services, to members of the Florida Nurserymen Growers Association for providing
data, the Florida Lime and Avocado Administrative Committees, The Florida Tomato Committee,
Tropical Fruit Growers of South Florida, Inc., J. R. Brooks & Son, Inc. and Couture-Allen, Inc.
Technical support was also given by Dr. Carlos Balerdi and Mr. De Hull, horticultural
specialists with the Florida Agricultural Extension Service in Dade County. Dr. Jonathan Crane
of the IFAS Tropical Research and Education Center in Homestead, also provided invaluable
assistance. We also appreciate the cooperation of the many agricultural producers, packers, and
shippers who took time to provide data essential to the study. We also extend our appreciation
to Juan Carranza, Malarie Harkey, Stephanie Mack and Romiro Vasquez for their help with data
collection. We also thank Vivian Thompson for typing much of the manuscript.

iv
TABLE OF CONTENTS
PREFACE . . . . . . . . . . . . . . . . . . . . . . . . . . . . . . . . . . . . . . . . . . . . . . . . . . . . . . . . . . . . . . i
ABSTRACT . . . . . . . . . . . . . . . . . . . . . . . . . . . . . . . . . . . . . . . . . . . . . . . . . . . . . . . . . . . . ii
ACKNOWLEDGMENTS . . . . . . . . . . . . . . . . . . . . . . . . . . . . . . . . . . . . . . . . . . . . . . . . . iii
TABLE OF CONTENTS . . . . . . . . . . . . . . . . . . . . . . . . . . . . . . . . . . . . . . . . . . . . . . . . . iv
LIST OF TABLES . . . . . . . . . . . . . . . . . . . . . . . . . . . . . . . . . . . . . . . . . . . . . . . . . . . . . viii
LIST OF FIGURES . . . . . . . . . . . . . . . . . . . . . . . . . . . . . . . . . . . . . . . . . . . . . . . . . . . . . . . x
EXECUTIVE SUMMARY . . . . . . . . . . . . . . . . . . . . . . . . . . . . . . . . . . . . . . . . . . . . . . . . xi
INTRODUCTION . . . . . . . . . . . . . . . . . . . . . . . . . . . . . . . . . . . . . . . . . . . . . . . . . . . . . . . 1
OBJECTIVES . . . . . . . . . . . . . . . . . . . . . . . . . . . . . . . . . . . . . . . . . . . . . . . . . . . . . . . . . . . 1
PROCEDURES . . . . . . . . . . . . . . . . . . . . . . . . . . . . . . . . . . . . . . . . . . . . . . . . . . . . . . . . . . 2
ECONOMIC IMPACT OF AGRICULTURE UPON DADE COUNTY'S ECONOMY
. . . . . . . . . . . . . . . . . . . . . . . . . . . . . . . . . . . . . . . . . . . . . . . . . . . . . . . . . . . . . . . . 3
Overview of Input/Output Analysis . . . . . . . . . . . . . . . . . . . . . . . . . . . . . . . . . . . . . 3
Results of Economic Impact Analysis . . . . . . . . . . . . . . . . . . . . . . . . . . . . . . . . . . . 11
Output Impact . . . . . . . . . . . . . . . . . . . . . . . . . . . . . . . . . . . . . . . . . . . . . . 11
Earnings Impact . . . . . . . . . . . . . . . . . . . . . . . . . . . . . . . . . . . . . . . . . . . . . 11
Employment Impacts . . . . . . . . . . . . . . . . . . . . . . . . . . . . . . . . . . . . . . . . . 12
v
Economic Interrelationships . . . . . . . . . . . . . . . . . . . . . . . . . . . . . . . . . . . . 13
Summary of Economic Impact Analysis & Comparison to 1990 Study . . . . . . . . . . 19
DESCRIPTIVE OVERVIEW OF AGRICULTURE IN DADE COUNTY . . . . . . . . . . . . 23
Physical Characteristics . . . . . . . . . . . . . . . . . . . . . . . . . . . . . . . . . . . . . . . . . . . . . 23
Land Area and Population . . . . . . . . . . . . . . . . . . . . . . . . . . . . . . . . . . . . . 23
Soils . . . . . . . . . . . . . . . . . . . . . . . . . . . . . . . . . . . . . . . . . . . . . . . . . . . . . . . . . . . . 23
Climate . . . . . . . . . . . . . . . . . . . . . . . . . . . . . . . . . . . . . . . . . . . . . . . . . . . . . . . . . 24
Irrigation . . . . . . . . . . . . . . . . . . . . . . . . . . . . . . . . . . . . . . . . . . . . . . . . . . 25
Natural disasters . . . . . . . . . . . . . . . . . . . . . . . . . . . . . . . . . . . . . . . . . . . . . 25
Hurricanes . . . . . . . . . . . . . . . . . . . . . . . . . . . . . . . . . . . . . . . . . . . 25
Freezes . . . . . . . . . . . . . . . . . . . . . . . . . . . . . . . . . . . . . . . . . . . . . . 26
Historical View of Dade County Agriculture . . . . . . . . . . . . . . . . . . . . . . . . . . . . . 27
Acreage in Farms . . . . . . . . . . . . . . . . . . . . . . . . . . . . . . . . . . . . . . . . . . . . 27
Value of Production . . . . . . . . . . . . . . . . . . . . . . . . . . . . . . . . . . . . . . . . . . 30
Geographic Shifts in Production Areas . . . . . . . . . . . . . . . . . . . . . . . . . . . . 32
Production of Selected Agricultural Commodities . . . . . . . . . . . . . . . . . . . . . . . . . 33
Commercial Ornamental Horticulture . . . . . . . . . . . . . . . . . . . . . . . . . . . . . . . . . . . 34
Types of nursery operations . . . . . . . . . . . . . . . . . . . . . . . . . . . . . . . . . . . . 34
Survey analyses . . . . . . . . . . . . . . . . . . . . . . . . . . . . . . . . . . . . . . . . . . . . . 35
Gross sales per acre . . . . . . . . . . . . . . . . . . . . . . . . . . . . . . . . . . . . . . . . . . 40
Traditional Vegetables . . . . . . . . . . . . . . . . . . . . . . . . . . . . . . . . . . . . . . . . . . . . . . 40
Snap beans . . . . . . . . . . . . . . . . . . . . . . . . . . . . . . . . . . . . . . . . . . . . . . . . . 42
Potatoes . . . . . . . . . . . . . . . . . . . . . . . . . . . . . . . . . . . . . . . . . . . . . . . . . . . 45
Squash . . . . . . . . . . . . . . . . . . . . . . . . . . . . . . . . . . . . . . . . . . . . . . . . . . . . 45
Sweet corn . . . . . . . . . . . . . . . . . . . . . . . . . . . . . . . . . . . . . . . . . . . . . . . . . 45
Seed corn, sorghum and soybeans . . . . . . . . . . . . . . . . . . . . . . . . . . . . . . . . 46
Bell peppers . . . . . . . . . . . . . . . . . . . . . . . . . . . . . . . . . . . . . . . . . . . . . . . . 50
Strawberries . . . . . . . . . . . . . . . . . . . . . . . . . . . . . . . . . . . . . . . . . . . . . . . . 50
vi
Eggplant . . . . . . . . . . . . . . . . . . . . . . . . . . . . . . . . . . . . . . . . . . . . . . . . . . . 50
Cucumbers (Fresh market) . . . . . . . . . . . . . . . . . . . . . . . . . . . . . . . . . . . . . 50
Other Traditional Vegetables . . . . . . . . . . . . . . . . . . . . . . . . . . . . . . . . . . . 52
Tropical Vegetables . . . . . . . . . . . . . . . . . . . . . . . . . . . . . . . . . . . . . . . . . . . . . . . . 52
Boniato . . . . . . . . . . . . . . . . . . . . . . . . . . . . . . . . . . . . . . . . . . . . . . . . . . . 52
Malanga . . . . . . . . . . . . . . . . . . . . . . . . . . . . . . . . . . . . . . . . . . . . . . . . . . . 53
Calabaza . . . . . . . . . . . . . . . . . . . . . . . . . . . . . . . . . . . . . . . . . . . . . . . . . . . 53
Cassava . . . . . . . . . . . . . . . . . . . . . . . . . . . . . . . . . . . . . . . . . . . . . . . . . . . 56
Other specialty vegetables . . . . . . . . . . . . . . . . . . . . . . . . . . . . . . . . . . . . . . 56
Thai and Chinese eggplant . . . . . . . . . . . . . . . . . . . . . . . . . . . . . . . . . . . . . 57
Tindora . . . . . . . . . . . . . . . . . . . . . . . . . . . . . . . . . . . . . . . . . . . . . . . . . . . 57
Bitter melon . . . . . . . . . . . . . . . . . . . . . . . . . . . . . . . . . . . . . . . . . . . . . . . . 57
Long beans . . . . . . . . . . . . . . . . . . . . . . . . . . . . . . . . . . . . . . . . . . . . . . . . . 58
Other specialty vegetable crops . . . . . . . . . . . . . . . . . . . . . . . . . . . . . . . . . . 58
Tropical Fruit . . . . . . . . . . . . . . . . . . . . . . . . . . . . . . . . . . . . . . . . . . . . . . . . . . . . . 58
Avocados . . . . . . . . . . . . . . . . . . . . . . . . . . . . . . . . . . . . . . . . . . . . . . . . . . 59
Persian (Tahiti) Limes . . . . . . . . . . . . . . . . . . . . . . . . . . . . . . . . . . . . . . . . . 61
Mangos . . . . . . . . . . . . . . . . . . . . . . . . . . . . . . . . . . . . . . . . . . . . . . . . . . . 61
Carambola . . . . . . . . . . . . . . . . . . . . . . . . . . . . . . . . . . . . . . . . . . . . . . . . . 65
Mamey Sapote . . . . . . . . . . . . . . . . . . . . . . . . . . . . . . . . . . . . . . . . . . . . . . 66
Longan . . . . . . . . . . . . . . . . . . . . . . . . . . . . . . . . . . . . . . . . . . . . . . . . . . . . 68
Guava . . . . . . . . . . . . . . . . . . . . . . . . . . . . . . . . . . . . . . . . . . . . . . . . . . . . . 68
Plantain and banana . . . . . . . . . . . . . . . . . . . . . . . . . . . . . . . . . . . . . . . . . . 69
Papaya . . . . . . . . . . . . . . . . . . . . . . . . . . . . . . . . . . . . . . . . . . . . . . . . . . . . 69
Lychee . . . . . . . . . . . . . . . . . . . . . . . . . . . . . . . . . . . . . . . . . . . . . . . . . . . . 70
Passion fruit . . . . . . . . . . . . . . . . . . . . . . . . . . . . . . . . . . . . . . . . . . . . . . . . 70
Pummelo . . . . . . . . . . . . . . . . . . . . . . . . . . . . . . . . . . . . . . . . . . . . . . . . . . 71
Kumquat . . . . . . . . . . . . . . . . . . . . . . . . . . . . . . . . . . . . . . . . . . . . . . . . . . 71
Atemoya . . . . . . . . . . . . . . . . . . . . . . . . . . . . . . . . . . . . . . . . . . . . . . . . . . . 71
vii
Sugar apple . . . . . . . . . . . . . . . . . . . . . . . . . . . . . . . . . . . . . . . . . . . . . . . . 72
Miscellaneous Tropical Fruit . . . . . . . . . . . . . . . . . . . . . . . . . . . . . . . . . . . . 72
REFERENCES . . . . . . . . . . . . . . . . . . . . . . . . . . . . . . . . . . . . . . . . . . . . . . . . . . . . . . . . . 73
viii
LIST OF TABLES
Table 1. Multipliers used to estimate the economic impact of Dade County's agricultural
sector . . . . . . . . . . . . . . . . . . . . . . . . . . . . . . . . . . . . . . . . . . . . . . . . . . . . . . 5
Table 2. Total value of production by agricultural subsector, Dade County, 1995-96. . . . . 10
Table 3. Subsector contribution and economic impacts of agriculture on Dade County, 1996.
. . . . . . . . . . . . . . . . . . . . . . . . . . . . . . . . . . . . . . . . . . . . . . . . . . . . . . . . . 10
Table 4. Agricultural sector's impact on output by industry, Dade County, 1996. . . . . . . . 15
Table 5. Agricultural sector's impact on earnings by industry, Dade County, 1996. . . . . . . 17
Table 6. A summary of agriculture's impact on Dade County's economy by agricultural
sector, 1988-89 and 1995-96. . . . . . . . . . . . . . . . . . . . . . . . . . . . . . . . . . . . 20
Table 7. F.O.B. sales by major agricultural subsector, Dade County, 1988-89 and 1995-96
seasons. . . . . . . . . . . . . . . . . . . . . . . . . . . . . . . . . . . . . . . . . . . . . . . . . . . . . . . . . . 22
Table 8. Number of farms categorized by acreage, value and size, for Dade County and the State
of Florida. . . . . . . . . . . . . . . . . . . . . . . . . . . . . . . . . . . . . . . . . . . . . . . . . . . . . . . . 28
Table 9. Farms and agricultural land use in Dade County and the State of Florida. . . . . . . 29
Table 10. Total land in orchards (groves) for fruits and nuts, Dade County and the State of
Florida. . . . . . . . . . . . . . . . . . . . . . . . . . . . . . . . . . . . . . . . . . . . . . . . . . . . . . . . . . 31
Table 11. Acreage and gross sales by agricultural production subsector, Dade County, 1974,
1978, 1982, 1987 and 1992. . . . . . . . . . . . . . . . . . . . . . . . . . . . . . . . . . . . . . . . . . . 32
Table 12. Estimated value of traditional vegetables sold outside of and within Dade County,
1995-96. . . . . . . . . . . . . . . . . . . . . . . . . . . . . . . . . . . . . . . . . . . . . . . . . . . . . . . . . 41
Table 13. Tomato acreage, Dade County and the State of Florida, 1980-81 to 1995-96.
. . . . . . . . . . . . . . . . . . . . . . . . . . . . . . . . . . . . . . . . . . . . . . . . . . . . . . . . . 43
Table 14. Tomato prices, production and total sales, Dade County, 1982-83 through 1995-96.
. . . . . . . . . . . . . . . . . . . . . . . . . . . . . . . . . . . . . . . . . . . . . . . . . . . . . . . . . 44
Table 15. Bush and pole bean acreage, Dade County and Florida, 1976-77 to 1993-94.
. . . . . . . . . . . . . . . . . . . . . . . . . . . . . . . . . . . . . . . . . . . . . . . . . . . . . . . . . 47
Table 16. Harvested acres of potatoes, Dade County and Florida 1976-77 to 1995-96 . . . 48
ix
Table 17. Harvested acres of squash, Dade County and the State of Florida, 1972-73 to
1995-96. . . . . . . . . . . . . . . . . . . . . . . . . . . . . . . . . . . . . . . . . . . . . . . . . . . . 49
Table 18. Published acreage estimates of selected traditional vegetables, Dade County, 1979-80
to 1995-96. . . . . . . . . . . . . . . . . . . . . . . . . . . . . . . . . . . . . . . . . . . . . . . . . . . . . . . 51
Table 19. Estimated value of tropical vegetables sold outside of and within Dade County,
1995-96. . . . . . . . . . . . . . . . . . . . . . . . . . . . . . . . . . . . . . . . . . . . . . . . . . . . 54
Table 20. Acreage for selected tropical vegetables, Dade County. . . . . . . . . . . . . . . . . . . . 55
Table 21. Dade County tropical fruit acreage, 1990 and 1996. . . . . . . . . . . . . . . . . . . . . . 62
Table 22. Dade County acreages of avocados, Persian limes and mangos, 1976-1996.
. . . . . . . . . . . . . . . . . . . . . . . . . . . . . . . . . . . . . . . . . . . . . . . . . . . . . . . . . 63
Table 23. Estimated value of tropical fruits sold within and outside of Dade County, 1995-96.
. . . . . . . . . . . . . . . . . . . . . . . . . . . . . . . . . . . . . . . . . . . . . . . . . . . . . . . . . 64
Table 24. Acreage of selected tropical fruits in Dade County 1982-83 to 1995-96. . . . . . . 67
x
LIST OF FIGURES
Figure 1. A comparison of values of traditional vegetable production, 1988-89 and 1995-96.
. . . . . . . . . . . . . . . . . . . . . . . . . . . . . . . . . . . . . . . . . . . . . . . . . . . . . . . . . . 7
Figure 2. A comparison of the values of tropical vegetable production, 1988-89 and 1995-96.
. . . . . . . . . . . . . . . . . . . . . . . . . . . . . . . . . . . . . . . . . . . . . . . . . . . . . . . . . . 7
Figure 3. A comparison of the value of tropical fruit production, 1988-89 and 1995-96.
. . . . . . . . . . . . . . . . . . . . . . . . . . . . . . . . . . . . . . . . . . . . . . . . . . . . . . . . . . 8
Figure 4. A comparison of nursery crop production, 1988-89 and 1995-96.
. . . . . . . . . . . . . . . . . . . . . . . . . . . . . . . . . . . . . . . . . . . . . . . . . . . . . . . . . . 8
Figure 5. Total value of production by agricultural subsector, Dade County, 1995-96, million
. . . . . . . . . . . . . . . . . . . . . . . . . . . . . . . . . . . . . . . . . . . . . . . . . . . . . . . . . . 9
Figure 6. Major nursery production systems and acreages. . . . . . . . . . . . . . . . . . . . . . . . . 37
Figure 7. Production system specialization. . . . . . . . . . . . . . . . . . . . . . . . . . . . . . . . . . . . . 37
Figure 8. Percentages of wholesale and retail nursery sales. . . . . . . . . . . . . . . . . . . . . . . . . 38
Figure 9. Percentages of gross sales comprised of plants and related services . . . . . . . . . . 38
Figure 10. Percentages of sales of various types of nursery crops grown in Dade County.
. . . . . . . . . . . . . . . . . . . . . . . . . . . . . . . . . . . . . . . . . . . . . . . . . . . . . . . . . 39
Figure 11. Percentages of gross sales inside and outside Dade County. . . . . . . . . . . . . . . . 39
Figure 12. Dade County acreage of avocados, Persian limes and mangos, 1976-1996.
. . . . . . . . . . . . . . . . . . . . . . . . . . . . . . . . . . . . . . . . . . . . . . . . . . . . . . . . . 60
xi
EXECUTIVE SUMMARY
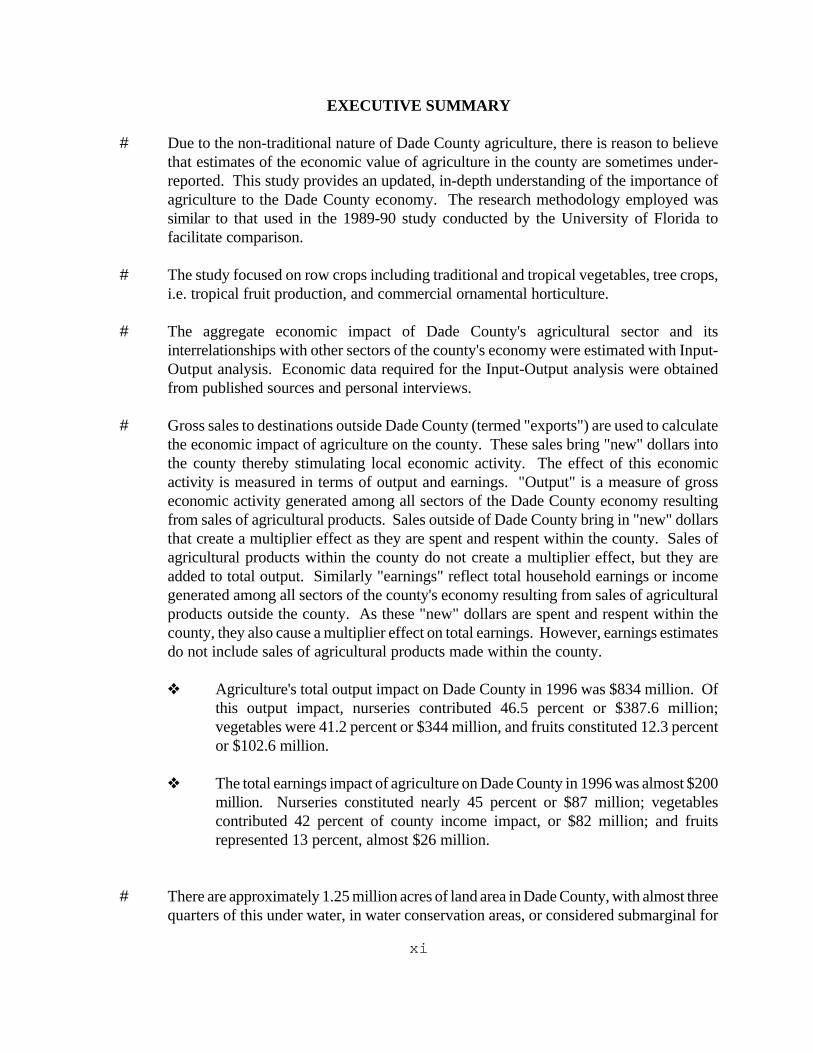
# Due to the non-traditional nature of Dade County agriculture, there is reason to believethat estimates of the economic value of agriculture in the county are sometimes under-reported. This study provides an updated, in-depth understanding of the importance ofagriculture to the Dade County economy. The research methodology employed wassimilar to that used in the 1989-90 study conducted by the University of Florida tofacilitate comparison.
# The study focused on row crops including traditional and tropical vegetables, tree crops,i.e. tropical fruit production, and commercial ornamental horticulture.
# The aggregate economic impact of Dade County's agricultural sector and itsinterrelationships with other sectors of the county's economy were estimated with Input-Output analysis. Economic data required for the Input-Output analysis were obtainedfrom published sources and personal interviews.
# Gross sales to destinations outside Dade County (termed "exports") are used to calculatethe economic impact of agriculture on the county. These sales bring "new" dollars intothe county thereby stimulating local economic activity. The effect of this economicactivity is measured in terms of output and earnings. "Output" is a measure of grosseconomic activity generated among all sectors of the Dade County economy resultingfrom sales of agricultural products. Sales outside of Dade County bring in "new" dollarsthat create a multiplier effect as they are spent and respent within the county. Sales ofagricultural products within the county do not create a multiplier effect, but they areadded to total output. Similarly "earnings" reflect total household earnings or incomegenerated among all sectors of the county's economy resulting from sales of agriculturalproducts outside the county. As these "new" dollars are spent and respent within thecounty, they also cause a multiplier effect on total earnings. However, earnings estimatesdo not include sales of agricultural products made within the county.
˜ Agriculture's total output impact on Dade County in 1996 was $834 million. Ofthis output impact, nurseries contributed 46.5 percent or $387.6 million;vegetables were 41.2 percent or $344 million, and fruits constituted 12.3 percentor $102.6 million.
˜ The total earnings impact of agriculture on Dade County in 1996 was almost $200million. Nurseries constituted nearly 45 percent or $87 million; vegetablescontributed 42 percent of county income impact, or $82 million; and fruitsrepresented 13 percent, almost $26 million.
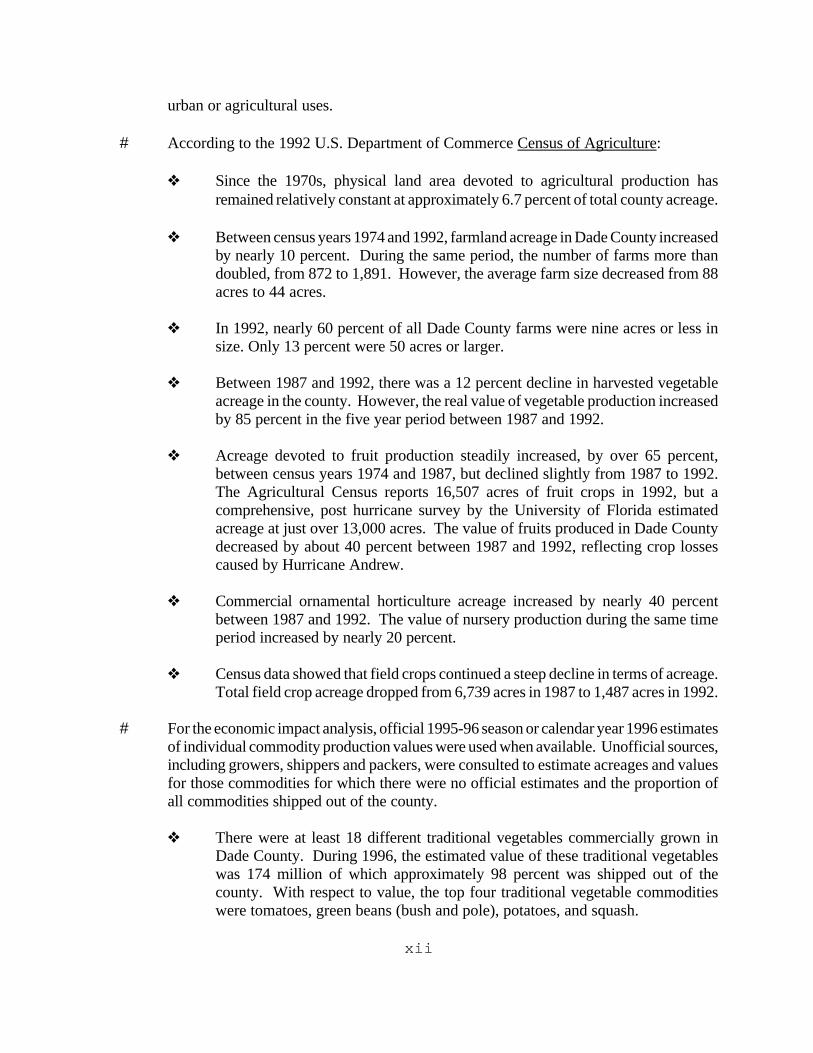
# There are approximately 1.25 million acres of land area in Dade County, with almost threequarters of this under water, in water conservation areas, or considered submarginal for
xii
urban or agricultural uses.
# According to the 1992 U.S. Department of Commerce Census of Agriculture:
˜ Since the 1970s, physical land area devoted to agricultural production hasremained relatively constant at approximately 6.7 percent of total county acreage.
˜ Between census years 1974 and 1992, farmland acreage in Dade County increasedby nearly 10 percent. During the same period, the number of farms more thandoubled, from 872 to 1,891. However, the average farm size decreased from 88acres to 44 acres.
˜ In 1992, nearly 60 percent of all Dade County farms were nine acres or less insize. Only 13 percent were 50 acres or larger.
˜ Between 1987 and 1992, there was a 12 percent decline in harvested vegetableacreage in the county. However, the real value of vegetable production increasedby 85 percent in the five year period between 1987 and 1992.
˜ Acreage devoted to fruit production steadily increased, by over 65 percent,between census years 1974 and 1987, but declined slightly from 1987 to 1992.The Agricultural Census reports 16,507 acres of fruit crops in 1992, but acomprehensive, post hurricane survey by the University of Florida estimatedacreage at just over 13,000 acres. The value of fruits produced in Dade Countydecreased by about 40 percent between 1987 and 1992, reflecting crop lossescaused by Hurricane Andrew.
˜ Commercial ornamental horticulture acreage increased by nearly 40 percentbetween 1987 and 1992. The value of nursery production during the same timeperiod increased by nearly 20 percent.
˜ Census data showed that field crops continued a steep decline in terms of acreage.Total field crop acreage dropped from 6,739 acres in 1987 to 1,487 acres in 1992.
# For the economic impact analysis, official 1995-96 season or calendar year 1996 estimatesof individual commodity production values were used when available. Unofficial sources,including growers, shippers and packers, were consulted to estimate acreages and valuesfor those commodities for which there were no official estimates and the proportion ofall commodities shipped out of the county.
˜ There were at least 18 different traditional vegetables commercially grown inDade County. During 1996, the estimated value of these traditional vegetableswas 174 million of which approximately 98 percent was shipped out of thecounty. With respect to value, the top four traditional vegetable commoditieswere tomatoes, green beans (bush and pole), potatoes, and squash.
xiii
˜ The value of traditional vegetable crops declined by about 35 percent between the1988-89 and 1995-96 seasons, reflecting lower acreages and perhaps lowerprices. This decline is likely due to increased competition from Mexico and otheroff-shore sources of winter vegetables.
˜ More than a dozen tropical and specialty vegetables, as well as a variety of herbsand spices are grown. The estimated value of tropical vegetables, herbs and spicessold during 1996 was about $25 million, down from $26 million in 1988-89.About 90 percent of sales are made outside Dade County. Malanga, boniato, andcalabaza constituted most of the tropical vegetable production, but significantquantities of Asian vegetables and spices were produced as well.
˜ Of approximately 19 commercially grown tropical fruits, the highest value cropsare carambola, avocados and limes. Tropical fruit sales for 1995-96 wereestimated at $56 million, down from $74 million in 1988-89. Most of the declineis due to acreage losses caused by Hurricane Andrew, reduced yields of grovesseverely damaged by the storm and to low yields of immature groves planted afterthe hurricane. Approximately 90 percent of all tropical fruits are shipped out ofthe county.
˜ A survey of nurseries in Dade County showed dramatic growth of the industryfrom 1989 to 1996. Acreage increased by 42 percent, from about 6,100 to 8,668acres.
˜ The value of nursery sales per acre across all production systems increased byover 9 percent, from about $28,000 to $30,650.
˜ Nursery sales in 1996 totaled $265.6 million, up from $171 million in 1988-89,a 55 percent increase. About 74 percent of sales, $196.6 million, are madeoutside of Dade County.
1
INTRODUCTION
Despite the fact that Dade County is the most populous urban center in Florida, it is also
a major producer of agricultural products. According to the most recent official agricultural
census, Dade County ranked second in the state in terms of the size of its agricultural industry
with products valued at $357 million in 1992. Even though this figure is impressive, there is
reason to believe that published estimates significantly underreport the economic value of
agriculture in Dade County due to the non-traditional nature of Dade County agriculture. As a
result, estimates of agricultural activity that attempt to quantify the economic importance of
agriculturally related activities in the county (e.g. input supply, transportation, marketing, etc.)
may be significantly underestimated as well.
OBJECTIVES
This study was undertaken to provide a more complete understanding of agriculture and
agribusiness and their economic importance to Dade County. Information obtained may be used
by policy makers and industry officials to consider a broad range of policies affecting the interests
of agricultural producers, agribusiness firms, and citizens of the county.
Specific objectives were to: (1) identify the major elements of agricultural production and
agribusiness, (2) assemble available published and unpublished data for the major agricultural and
agribusiness elements, (3) identify potential sources of primary economic data to supplement
secondary data as necessary, (4) determine the aggregate economic impact of the agricultural
sector and estimate economic interrelationships with other sectors of the county's economy, and
(5) prepare descriptive profiles and specific estimates of economic impacts for individual sectors
as resources permitted.
2
PROCEDURES
The elements of the agricultural and agribusiness industry were identified through personal
interviews of individuals familiar with Dade County agriculture. Field work was conducted in
Dade County in cooperation with the Dade County extension staff and faculty of the University
of Florida's Tropical Research and Education Center (TREC) in Homestead. The major focus
was on row crops (including traditional and tropical vegetables), tree crops, and ornamental
horticulture. Interviews were conducted with members of the agricultural community and
officials of the Cooperative Extension Service, the Florida Department of Agriculture and
Consumer Services, Federal agricultural agencies, trade associations, and other local business and
government sources. Interviews provided leads for obtaining published and unpublished data.
Objectives 2 and 3 were met through personal interviews described above. Published data
were evaluated for accuracy and refined to meet the requirements of input-output analysis. For
example, published estimates of farm values of various crops were adjusted to reflect values at
the shipping point. Data for making such adjustments were obtained from trade associations or
shippers as required.
Objective 4 was largely achieved through the use of macroeconomic analytical techniques,
primarily input-output analysis. This technique allowed economic interrelationships existing
between agriculture and other sectors of the economy to be estimated. Analysis employed an
existing input-output model of the Dade County economy estimated by the U.S. Department of
Commerce (23).
The remainder of this report is organized into two major sections: "Economic Impact of
Agriculture Upon Dade County's Economy" and "An Overview of Agricultural Production in
Dade County." The first and most important section discusses the analysis of the agricultural
sector's impact on Dade County's economy. The second section provides a brief physical
description of the county as it pertains to the agricultural sector, and supporting production and
value data for selected commodities produced in the county.
3
ECONOMIC IMPACT OF AGRICULTURE UPON DADE COUNTY'S ECONOMY
Overview of Input/Output Analysis
The purpose of economic impact analysis is to help planners, analysts, and interested
individuals estimate the total economic effect that a particular sector or industry has upon a
region's economy, and to aid in understanding how a particular sector relates to other sectors of
the local economy. The agricultural sector of Dade County's economy "exports" commodities
to locations outside of the county. These "exports," in turn, affect the county's economy by
stimulating additional local economic activity, as dollars generated from sources outside Dade are
used for purchases within the county.
When Dade's agricultural commodities are sold outside the county, the agricultural
industry directly affects the region's economic activity by bringing new dollars into the county.
These direct effects then produce indirect impacts or effects on the regional economy as dollars
generated by external sales are used for local purchases. For example, farmers spend money for
wage payments in all phases of agricultural production from land preparation, planting and
harvesting to transporting produce to warehouse facilities for storage and subsequent packaging
and processing for export out of the county. Indirect impacts include goods and services
provided by local businesses to the agricultural sector, such as business services, sale of inputs,
and sale of parts and repair services. These indirect effects represent additional economic activity
and result in additional jobs and income for local residents, generated from external sales by the
agricultural industry.
In addition to direct and indirect effects, there are also induced effects or impacts
associated with the production of agricultural commodities. Induced effects represent the
spending activities of employees who earn income in jobs provided by the businesses involved,
either directly or indirectly, in the production of regional (agricultural) exports. This induced
effect is income that is spent by consumers on the local purchase of goods and services.
The total economic impact that agriculture has upon Dade County's economy is the
combined direct, indirect, and induced effects. For example, if for some reason agricultural
"export" sales increase and local production expands, then the increase in sales represents new
direct economic activity and increased local expenditures for labor and other agricultural inputs.
4
This increased activity then triggers a chain of increased local spending by service and input
supply industries as they increase their output and local purchases in order to supply increased
demands of the agricultural sector. This expansion, in turn, leads to increased output and local
purchases by firms supplying the input and service businesses. For example, a local tire business
might experience increased sales (indirect effect) because it supplies the local transport company
that provides freight services for agricultural producers. At the same time, tire sales personnel
spend income for a variety of local goods and services, one example could be purchases of health
services (induced effect). Thus, each dollar in additional sales, when spent locally, triggers a
chain reaction of additional indirect and induced spending activities.
Total economic repercussions associated with an additional dollar of external sales is
referred to as the multiplier effect. The multiplier for a particular industry is the total economic
activity (direct, indirect, and induced) associated with an additional dollar of external sales by the
industry in question. As illustrated earlier, an increase in export sales has repercussions via
additional economic activity within the region. On the other hand, the converse is also true. A
decrease in agricultural export sales will have economic repercussions in the form of decreases
in regional economic activity. The multiplier therefore measures the impact of either an increase
or a decrease in export sales activities.
Additional economic activity is not infinite in its ripple effect through the economy. Some
dollars earned in the direct activity are not spent locally. A part of direct sales dollars are used
for such things as taxes and fees paid to state and federal agencies, payments to landowners who
reside outside the county, and as payment for goods and services which are imported into Dade
County (seed purchased from mid-west companies, externally located computer consultants
servicing equipment, etc). The size of the multiplier associated with increased/decreased regional
export sales varies with the size of the region and with the industry in question. In general, the
larger and more diverse the economy of the region and the more complex the industry in terms
of its linkages to other local industries, the larger the multiplier effect.
The means of estimating the economic impact that the agricultural sector has upon the
county is through use of multipliers based on regional input-output (I-O) models. The foundation
5
of the I-O model is a transactions table structured like a mileage chart on a road map. Each
industry (or sector) in the region is listed as a selling industry in a row and as a purchasing
industry in a column of the table. Entries in the table indicate the distribution of sales and the
pattern of purchases for each sector of the regional economy. For example, agricultural products
and services is treated as one sector, real estate as a sector, wholesale trade as a sector, etc. until
the entire local economy is divided into economic sectors producing similar products.
Households are considered a separate sector which purchases goods and services and sells labor.
In effect, the transactions table provides a picture of interactions between local sectors and allows
the flow of dollars to be traced through the economy. Multipliers are calculated based on the
information generated from the transactions table.
Because they are dollar multiples of the initial dollar spent for the output (sales) of the
industry, total changes in output are referred to as output multipliers. Earnings multipliers for the
agricultural industry in Dade County show the total earnings (direct, indirect, and induced) by
households in Dade County in order for the agricultural sector to deliver a dollar of sales outside
the county (Table 1).
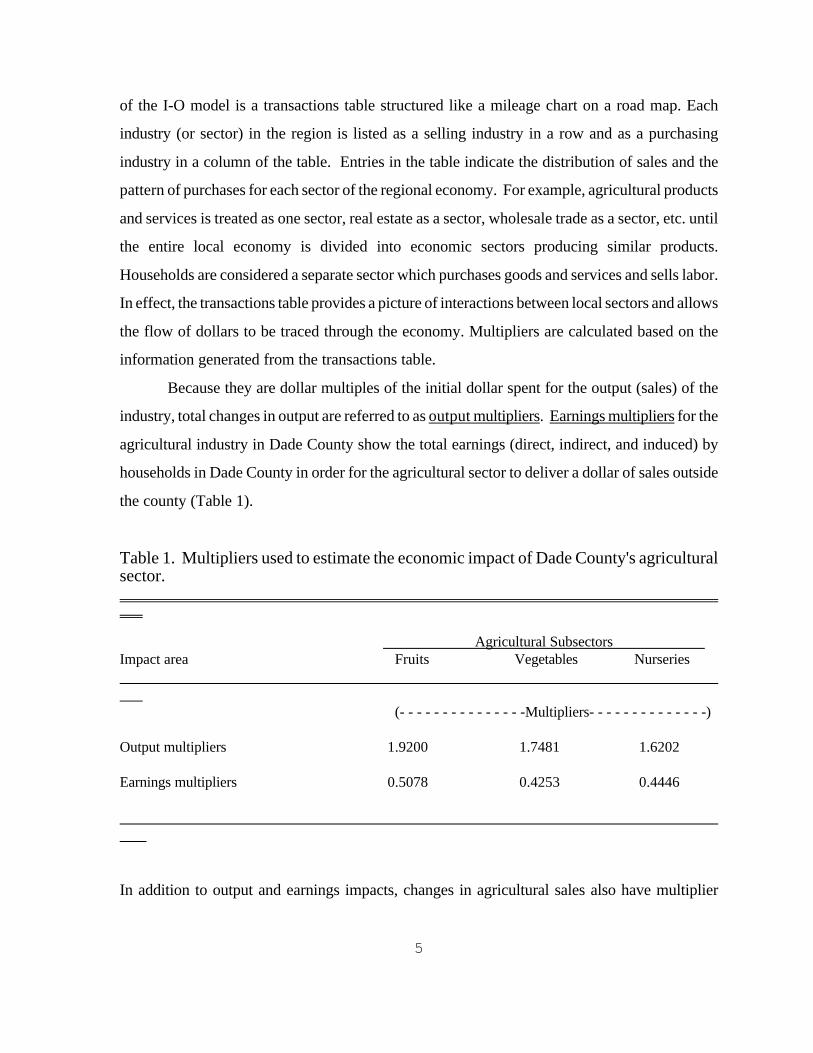
Table 1. Multipliers used to estimate the economic impact of Dade County's agriculturalsector.
Agricultural Subsectors Impact area Fruits Vegetables Nurseries
(- - - - - - - - - - - - - - -Multipliers- - - - - - - - - - - - - -)
Output multipliers 1.9200 1.7481 1.6202
Earnings multipliers 0.5078 0.4253 0.4446
In addition to output and earnings impacts, changes in agricultural sales also have multiplier
6
effects on employment in other sectors of the local economy. However, as will be noted later,
data problems prevent the estimation of employment impacts as a part of this study. For this
study, Dade County's agricultural sector consists of three subsectors: (1) vegetable production,
(2) fruit production, and (3) commercial ornamental horticulture. Multipliers for subsectors of
Dade County's agricultural sector (Table 1) were estimated by the Bureau of Economic Analysis
of the U.S. Department of Commerce using their Regional Input-Output Modeling System (RIMS
II) (23).
In order to estimate the impact that agricultural production had upon Dade County's
economy during the 1995-96 production season, (calendar 1996 for nursery crops) total gross
sales were estimated for each subsector, i.e., vegetables, fruits, and commercial ornamental
horticulture. For the purpose of describing the agricultural industry, vegetable production was
disaggregated to include itemization of traditional vegetable and tropical vegetable production.
However, for the impact analysis, vegetable production is aggregated into one subsector.
Since economic impact analysis estimates an industry's affect upon regional economic
activity when products or commodities are exported from the region (county), it is the dollar
amounts of total gross sales (for each subsector: vegetables, fruits, and commercial ornamental
horticulture) shipped out of Dade County that are used (Table 2, Figures 1-5).
The amount of total gross sales of each subsector that remains in Dade County (dollars
generated from local, in-county sales) is added back into the output impact calculation to show
the total output impact of the sector. That is to say, local sales do not generate new activity or
rather do not bring in new dollars into the county. They do represent local economic activity and
are simply added, without a multiplier effect, back into the estimated output impact calculation
from the I/O model.
7
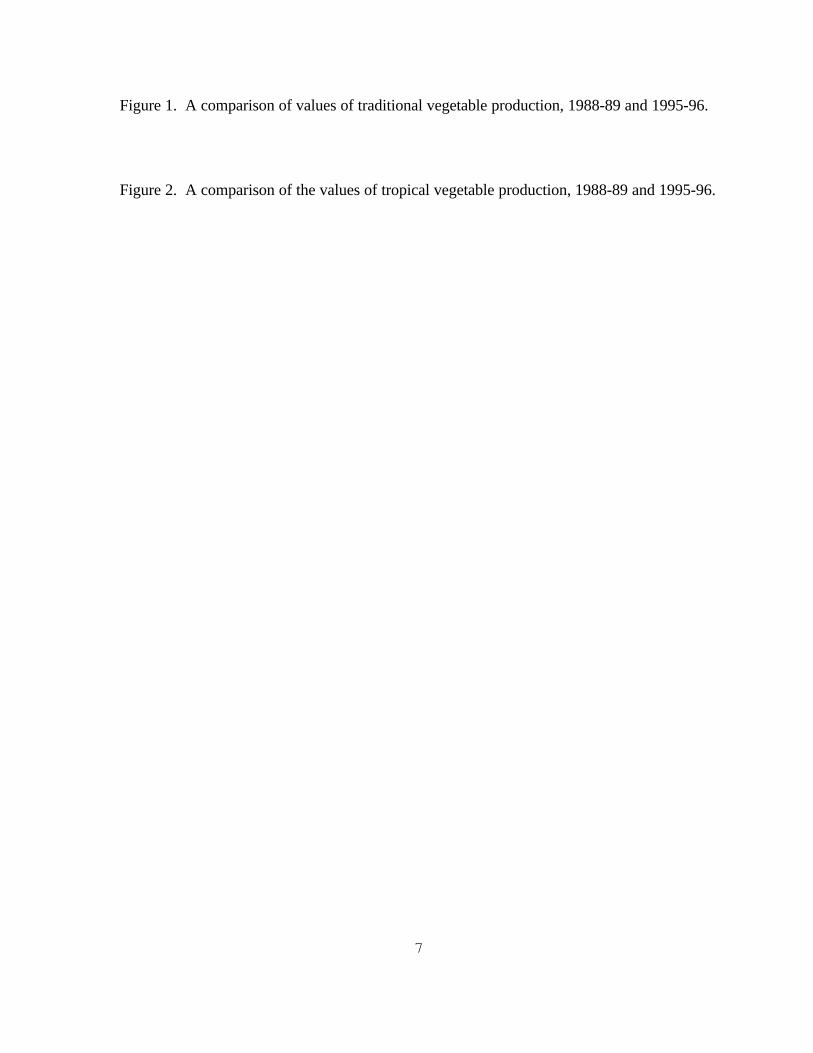
Figure 1. A comparison of values of traditional vegetable production, 1988-89 and 1995-96.
Figure 2. A comparison of the values of tropical vegetable production, 1988-89 and 1995-96.

8
Figure 3. A comparison of the value of tropical fruit production, 1988-89 and 1995-96.
Figure 4. A comparison of nursery crop production, 1988-89 and 1995-96.
9
Figure 5. Total value of production by agricultural subsector, Dade County, 1995-96, million
dollars.
10
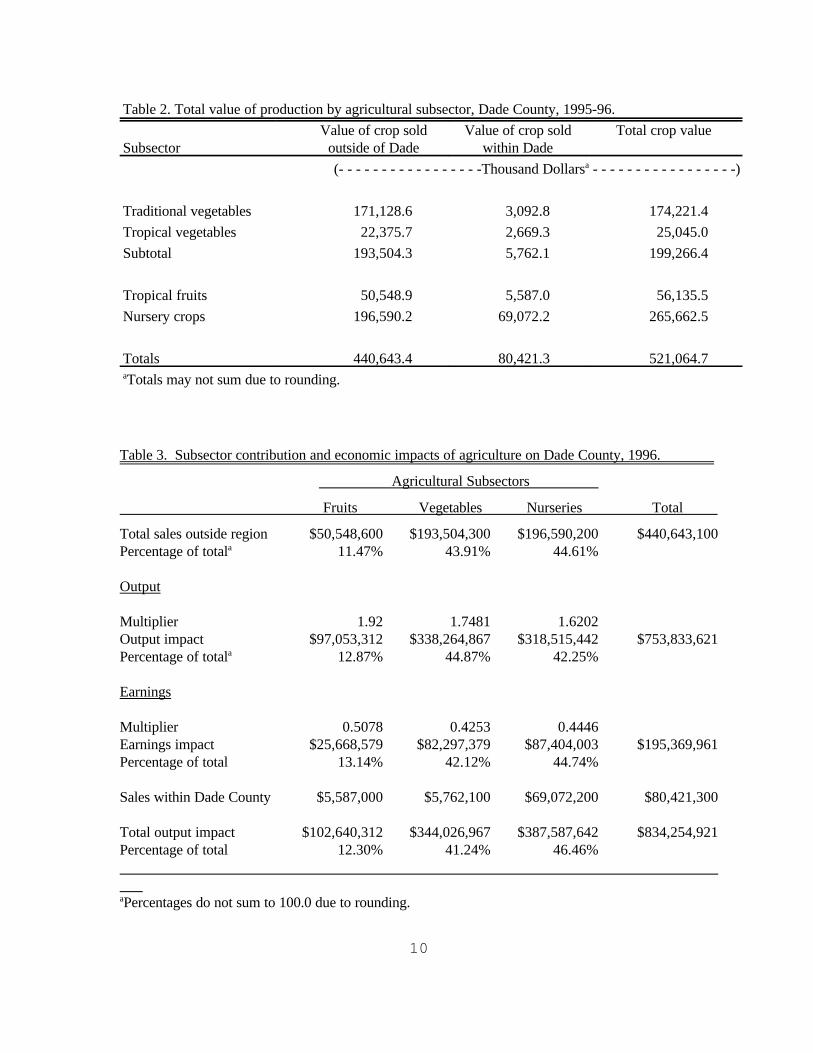
Table 2. Total value of production by agricultural subsector, Dade County, 1995-96.
Subsector Value of crop sold
outside of DadeValue of crop sold
within DadeTotal crop value
(- - - - - - - - - - - - - - - - -Thousand Dollarsa - - - - - - - - - - - - - - - - -)
Traditional vegetables 171,128.6 3,092.8 174,221.4
Tropical vegetables 22,375.7 2,669.3 25,045.0
Subtotal 193,504.3 5,762.1 199,266.4
Tropical fruits 50,548.9 5,587.0 56,135.5
Nursery crops 196,590.2 69,072.2 265,662.5
Totals 440,643.4 80,421.3 521,064.7 aTotals may not sum due to rounding.
Table 3. Subsector contribution and economic impacts of agriculture on Dade County, 1996.
Agricultural Subsectors
Fruits Vegetables Nurseries Total
Total sales outside region $50,548,600 $193,504,300 $196,590,200 $440,643,100Percentage of totala 11.47% 43.91% 44.61%
Output
Multiplier 1.92 1.7481 1.6202Output impact $97,053,312 $338,264,867 $318,515,442 $753,833,621Percentage of totala 12.87% 44.87% 42.25%
Earnings
Multiplier 0.5078 0.4253 0.4446Earnings impact $25,668,579 $82,297,379 $87,404,003 $195,369,961Percentage of total 13.14% 42.12% 44.74%
Sales within Dade County $5,587,000 $5,762,100 $69,072,200 $80,421,300
Total output impact $102,640,312 $344,026,967 $387,587,642 $834,254,921Percentage of total 12.30% 41.24% 46.46% aPercentages do not sum to 100.0 due to rounding.
11
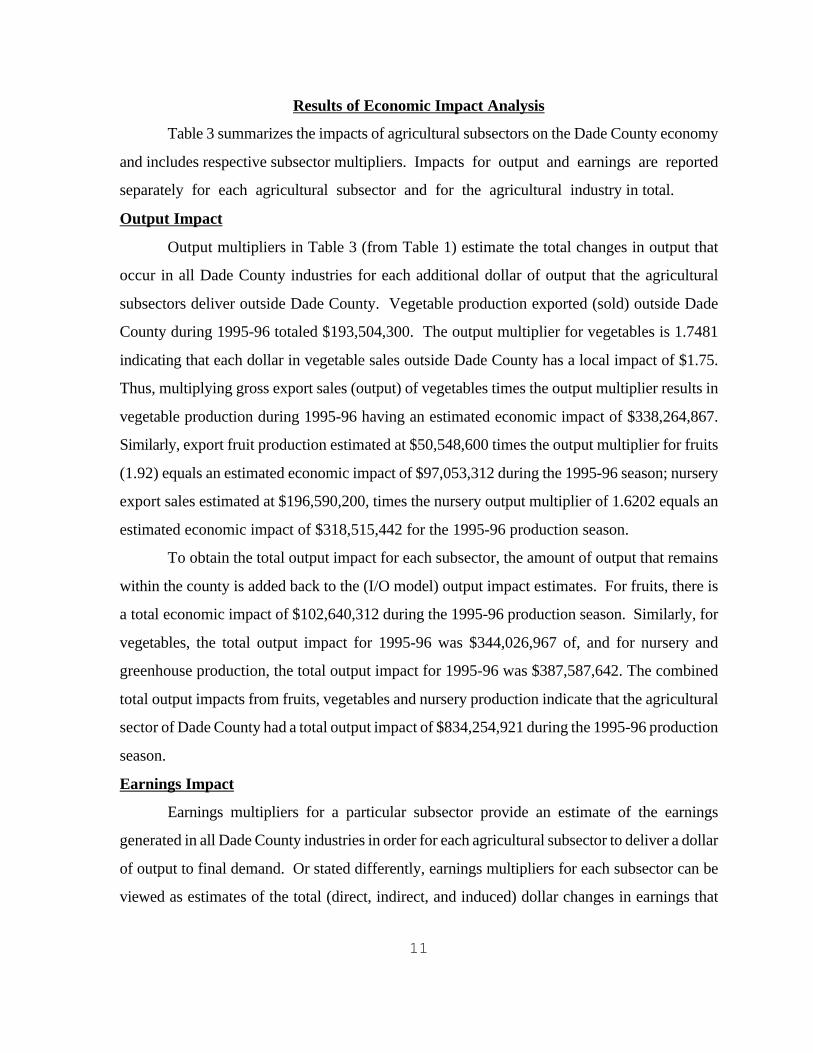
Results of Economic Impact Analysis
Table 3 summarizes the impacts of agricultural subsectors on the Dade County economy
and includes respective subsector multipliers. Impacts for output and earnings are reported
separately for each agricultural subsector and for the agricultural industry in total.
Output Impact
Output multipliers in Table 3 (from Table 1) estimate the total changes in output that
occur in all Dade County industries for each additional dollar of output that the agricultural
subsectors deliver outside Dade County. Vegetable production exported (sold) outside Dade
County during 1995-96 totaled $193,504,300. The output multiplier for vegetables is 1.7481
indicating that each dollar in vegetable sales outside Dade County has a local impact of $1.75.
Thus, multiplying gross export sales (output) of vegetables times the output multiplier results in
vegetable production during 1995-96 having an estimated economic impact of $338,264,867.
Similarly, export fruit production estimated at $50,548,600 times the output multiplier for fruits
(1.92) equals an estimated economic impact of $97,053,312 during the 1995-96 season; nursery
export sales estimated at $196,590,200, times the nursery output multiplier of 1.6202 equals an
estimated economic impact of $318,515,442 for the 1995-96 production season.
To obtain the total output impact for each subsector, the amount of output that remains
within the county is added back to the (I/O model) output impact estimates. For fruits, there is
a total economic impact of $102,640,312 during the 1995-96 production season. Similarly, for
vegetables, the total output impact for 1995-96 was $344,026,967 of, and for nursery and
greenhouse production, the total output impact for 1995-96 was $387,587,642. The combined
total output impacts from fruits, vegetables and nursery production indicate that the agricultural
sector of Dade County had a total output impact of $834,254,921 during the 1995-96 production
season.
Earnings Impact
Earnings multipliers for a particular subsector provide an estimate of the earnings
generated in all Dade County industries in order for each agricultural subsector to deliver a dollar
of output to final demand. Or stated differently, earnings multipliers for each subsector can be
viewed as estimates of the total (direct, indirect, and induced) dollar changes in earnings that
12
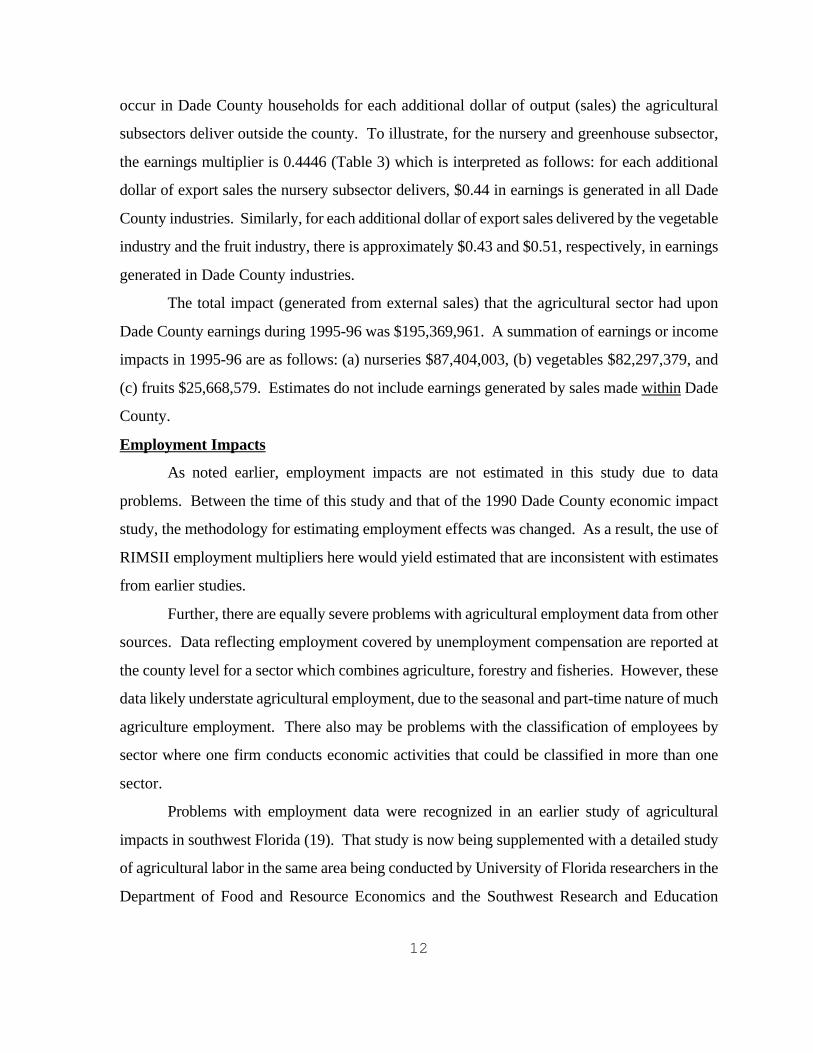
occur in Dade County households for each additional dollar of output (sales) the agricultural
subsectors deliver outside the county. To illustrate, for the nursery and greenhouse subsector,
the earnings multiplier is 0.4446 (Table 3) which is interpreted as follows: for each additional
dollar of export sales the nursery subsector delivers, $0.44 in earnings is generated in all Dade
County industries. Similarly, for each additional dollar of export sales delivered by the vegetable
industry and the fruit industry, there is approximately $0.43 and $0.51, respectively, in earnings
generated in Dade County industries.
The total impact (generated from external sales) that the agricultural sector had upon
Dade County earnings during 1995-96 was $195,369,961. A summation of earnings or income
impacts in 1995-96 are as follows: (a) nurseries $87,404,003, (b) vegetables $82,297,379, and
(c) fruits $25,668,579. Estimates do not include earnings generated by sales made within Dade
County.
Employment Impacts
As noted earlier, employment impacts are not estimated in this study due to data
problems. Between the time of this study and that of the 1990 Dade County economic impact
study, the methodology for estimating employment effects was changed. As a result, the use of
RIMSII employment multipliers here would yield estimated that are inconsistent with estimates
from earlier studies.
Further, there are equally severe problems with agricultural employment data from other
sources. Data reflecting employment covered by unemployment compensation are reported at
the county level for a sector which combines agriculture, forestry and fisheries. However, these
data likely understate agricultural employment, due to the seasonal and part-time nature of much
agriculture employment. There also may be problems with the classification of employees by
sector where one firm conducts economic activities that could be classified in more than one
sector.
Problems with employment data were recognized in an earlier study of agricultural
impacts in southwest Florida (19). That study is now being supplemented with a detailed study
of agricultural labor in the same area being conducted by University of Florida researchers in the
Department of Food and Resource Economics and the Southwest Research and Education
13
Center. Results should provide more insight into the accuracy and comparability of agricultural
data.
Economic Interrelationships
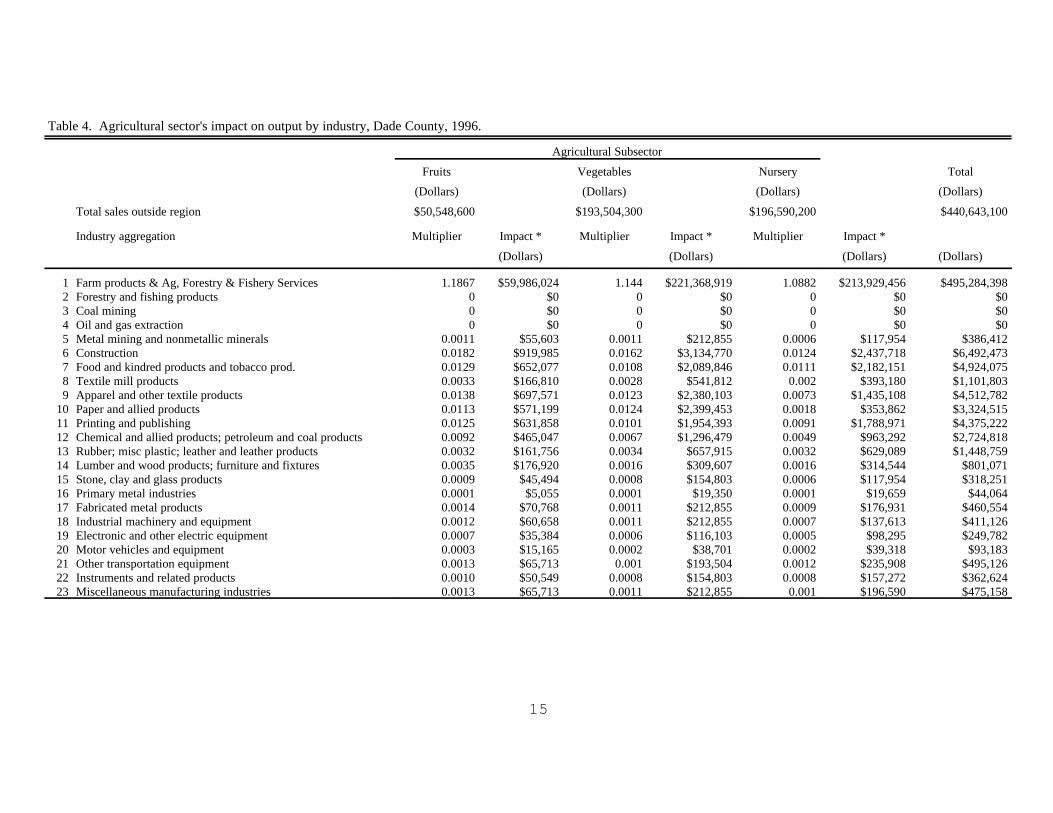
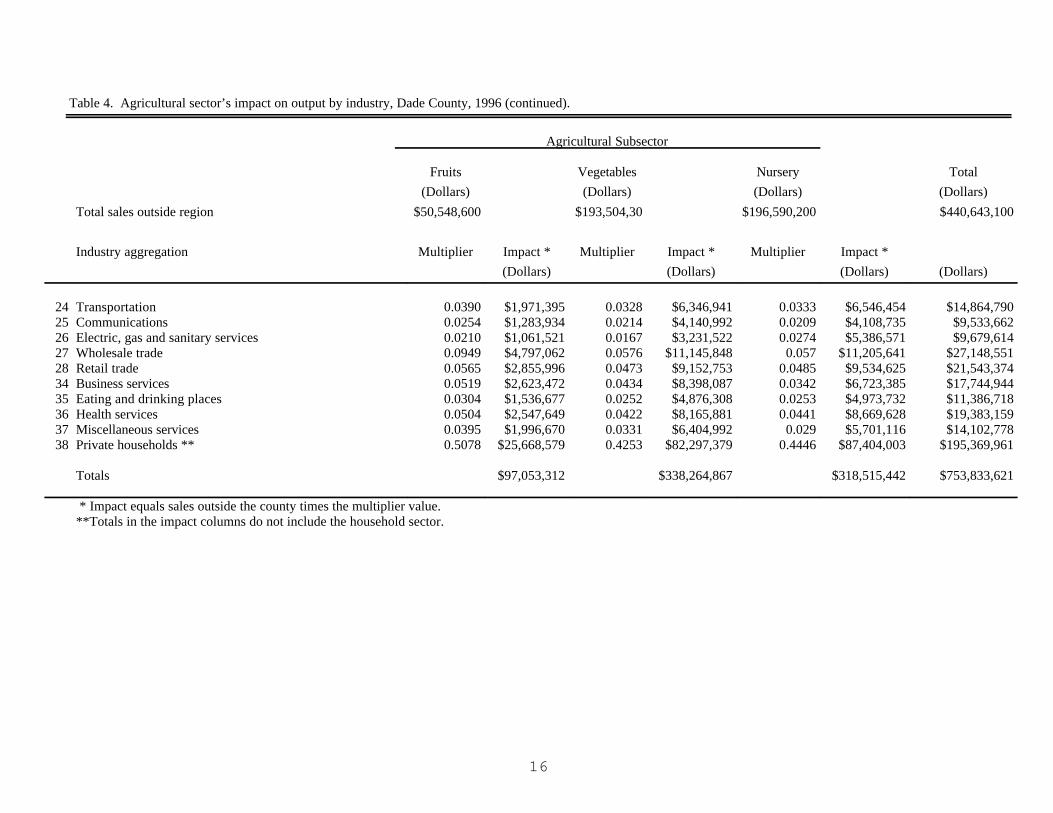
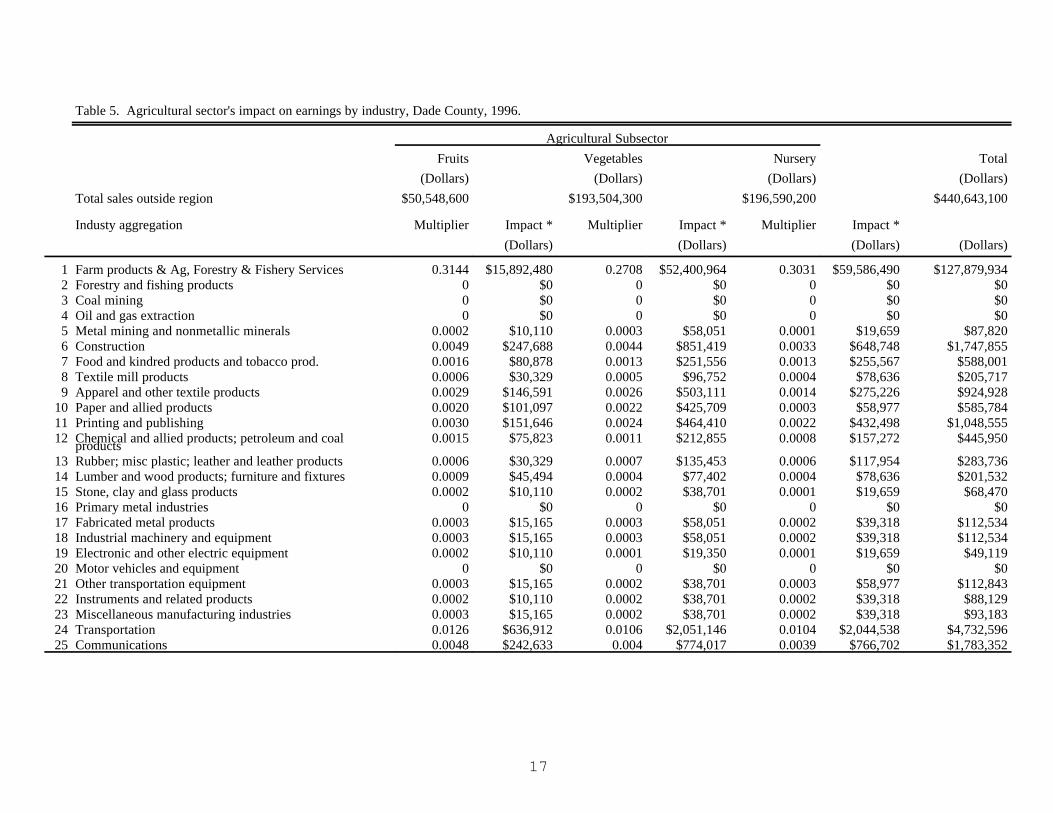
In addition to total impacts noted above, Tables 4-5 illustrate the interrelationships
between the three agricultural subsectors and each of 37 other sectors of the Dade County
economy for output and earnings. Sectors are listed on the left of each table and the three
agricultural subsectors are listed across the top. The final row of each table reflects the total
impacts for each agricultural subsector, and the final column reflects the total agricultural impact
on other sectors of the local economy. Numbers in the tables reflect that part of the total
agricultural impact which occurs in the sector listed for a particular row. Each table (Tables 4-5)
shows the disaggregated multiplier value for each agricultural sector and dollar impacts for each
sector. Disaggregated impacts are reported only for external sales.
The greatest amount of economic activity generated by agriculture in the county occurs
within the agricultural sector itself. For example, of the $97 million economic impact generated
by fruit production export sales, about $60 million occurs within the agricultural sector. With
respect to interrelationships with other sectors of Dade County's economy, the real estate sector
is the second most important sector affected by agricultural output. For example, of the $1.75
of total economic activity generated by a dollar of export sales from vegetable production
approximately $0.12 of this is economic activity which occurs within the real estate sector. Stated
differently, this indicates that for every dollar of export sales produced by the vegetable industry
in Dade County, approximately $0.12 of economic activity is generated in the real estate sector.
Similarly, for every dollar of export sales from nursery production, approximately $0.09 of
economic activity is generated in the real estate sector and fruit sales generates $0.12 in the real
estate sector. The household sector row of each table sums the impact on Dade County
households of the output and earnings impacts reflected in sectors 1 through 37.
In a manner similar to that for output above, Table 5 desegregates the earnings impact
across 38 sectors of the Dade economy. To illustrate the economic interrelationships with other
sectors of Dade County's economy, for each additional dollar of sales outside the county that fruit
14
production delivers, there is an estimated $0.02 of earnings generated in retail trade industries by
the fruit sector. Similarly, for each dollar of external sales that nurseries deliver, there is an
estimated $0.02 of earnings in the wholesale trade sector. In each case estimates include direct,
indirect, and induced activity.
15
Table 4. Agricultural sector's impact on output by industry, Dade County, 1996.
Agricultural Subsector
Fruits Vegetables Nursery Total
(Dollars) (Dollars) (Dollars) (Dollars)
Total sales outside region $50,548,600 $193,504,300 $196,590,200 $440,643,100
Industry aggregation Multiplier Impact * Multiplier Impact * Multiplier Impact *
(Dollars) (Dollars) (Dollars) (Dollars)
1 Farm products & Ag, Forestry & Fishery Services 1.1867 $59,986,024 1.144 $221,368,919 1.0882 $213,929,456 $495,284,3982 Forestry and fishing products 0 $0 0 $0 0 $0 $03 Coal mining 0 $0 0 $0 0 $0 $04 Oil and gas extraction 0 $0 0 $0 0 $0 $05 Metal mining and nonmetallic minerals 0.0011 $55,603 0.0011 $212,855 0.0006 $117,954 $386,4126 Construction 0.0182 $919,985 0.0162 $3,134,770 0.0124 $2,437,718 $6,492,4737 Food and kindred products and tobacco prod. 0.0129 $652,077 0.0108 $2,089,846 0.0111 $2,182,151 $4,924,0758 Textile mill products 0.0033 $166,810 0.0028 $541,812 0.002 $393,180 $1,101,8039 Apparel and other textile products 0.0138 $697,571 0.0123 $2,380,103 0.0073 $1,435,108 $4,512,782
10 Paper and allied products 0.0113 $571,199 0.0124 $2,399,453 0.0018 $353,862 $3,324,51511 Printing and publishing 0.0125 $631,858 0.0101 $1,954,393 0.0091 $1,788,971 $4,375,22212 Chemical and allied products; petroleum and coal products 0.0092 $465,047 0.0067 $1,296,479 0.0049 $963,292 $2,724,81813 Rubber; misc plastic; leather and leather products 0.0032 $161,756 0.0034 $657,915 0.0032 $629,089 $1,448,75914 Lumber and wood products; furniture and fixtures 0.0035 $176,920 0.0016 $309,607 0.0016 $314,544 $801,07115 Stone, clay and glass products 0.0009 $45,494 0.0008 $154,803 0.0006 $117,954 $318,25116 Primary metal industries 0.0001 $5,055 0.0001 $19,350 0.0001 $19,659 $44,06417 Fabricated metal products 0.0014 $70,768 0.0011 $212,855 0.0009 $176,931 $460,55418 Industrial machinery and equipment 0.0012 $60,658 0.0011 $212,855 0.0007 $137,613 $411,12619 Electronic and other electric equipment 0.0007 $35,384 0.0006 $116,103 0.0005 $98,295 $249,78220 Motor vehicles and equipment 0.0003 $15,165 0.0002 $38,701 0.0002 $39,318 $93,18321 Other transportation equipment 0.0013 $65,713 0.001 $193,504 0.0012 $235,908 $495,12622 Instruments and related products 0.0010 $50,549 0.0008 $154,803 0.0008 $157,272 $362,62423 Miscellaneous manufacturing industries 0.0013 $65,713 0.0011 $212,855 0.001 $196,590 $475,158
16
Table 4. Agricultural sector’s impact on output by industry, Dade County, 1996 (continued).
Agricultural Subsector
Fruits Vegetables Nursery Total
(Dollars) (Dollars) (Dollars) (Dollars)
Total sales outside region $50,548,600 $193,504,30 $196,590,200 $440,643,100
Industry aggregation Multiplier Impact * Multiplier Impact * Multiplier Impact *
(Dollars) (Dollars) (Dollars) (Dollars)
24 Transportation 0.0390 $1,971,395 0.0328 $6,346,941 0.0333 $6,546,454 $14,864,79025 Communications 0.0254 $1,283,934 0.0214 $4,140,992 0.0209 $4,108,735 $9,533,66226 Electric, gas and sanitary services 0.0210 $1,061,521 0.0167 $3,231,522 0.0274 $5,386,571 $9,679,61427 Wholesale trade 0.0949 $4,797,062 0.0576 $11,145,848 0.057 $11,205,641 $27,148,55128 Retail trade 0.0565 $2,855,996 0.0473 $9,152,753 0.0485 $9,534,625 $21,543,37434 Business services 0.0519 $2,623,472 0.0434 $8,398,087 0.0342 $6,723,385 $17,744,94435 Eating and drinking places 0.0304 $1,536,677 0.0252 $4,876,308 0.0253 $4,973,732 $11,386,71836 Health services 0.0504 $2,547,649 0.0422 $8,165,881 0.0441 $8,669,628 $19,383,15937 Miscellaneous services 0.0395 $1,996,670 0.0331 $6,404,992 0.029 $5,701,116 $14,102,77838 Private households ** 0.5078 $25,668,579 0.4253 $82,297,379 0.4446 $87,404,003 $195,369,961
Totals $97,053,312 $338,264,867 $318,515,442 $753,833,621
* Impact equals sales outside the county times the multiplier value.**Totals in the impact columns do not include the household sector.
17
Table 5. Agricultural sector's impact on earnings by industry, Dade County, 1996.
Agricultural Subsector
Fruits Vegetables Nursery Total
(Dollars) (Dollars) (Dollars) (Dollars)
Total sales outside region $50,548,600 $193,504,300 $196,590,200 $440,643,100
Industy aggregation Multiplier Impact * Multiplier Impact * Multiplier Impact *
(Dollars) (Dollars) (Dollars) (Dollars)
1 Farm products & Ag, Forestry & Fishery Services 0.3144 $15,892,480 0.2708 $52,400,964 0.3031 $59,586,490 $127,879,9342 Forestry and fishing products 0 $0 0 $0 0 $0 $03 Coal mining 0 $0 0 $0 0 $0 $04 Oil and gas extraction 0 $0 0 $0 0 $0 $05 Metal mining and nonmetallic minerals 0.0002 $10,110 0.0003 $58,051 0.0001 $19,659 $87,8206 Construction 0.0049 $247,688 0.0044 $851,419 0.0033 $648,748 $1,747,8557 Food and kindred products and tobacco prod. 0.0016 $80,878 0.0013 $251,556 0.0013 $255,567 $588,0018 Textile mill products 0.0006 $30,329 0.0005 $96,752 0.0004 $78,636 $205,7179 Apparel and other textile products 0.0029 $146,591 0.0026 $503,111 0.0014 $275,226 $924,928
10 Paper and allied products 0.0020 $101,097 0.0022 $425,709 0.0003 $58,977 $585,78411 Printing and publishing 0.0030 $151,646 0.0024 $464,410 0.0022 $432,498 $1,048,55512 Chemical and allied products; petroleum and coal
products0.0015 $75,823 0.0011 $212,855 0.0008 $157,272 $445,950
13 Rubber; misc plastic; leather and leather products 0.0006 $30,329 0.0007 $135,453 0.0006 $117,954 $283,73614 Lumber and wood products; furniture and fixtures 0.0009 $45,494 0.0004 $77,402 0.0004 $78,636 $201,53215 Stone, clay and glass products 0.0002 $10,110 0.0002 $38,701 0.0001 $19,659 $68,47016 Primary metal industries 0 $0 0 $0 0 $0 $017 Fabricated metal products 0.0003 $15,165 0.0003 $58,051 0.0002 $39,318 $112,53418 Industrial machinery and equipment 0.0003 $15,165 0.0003 $58,051 0.0002 $39,318 $112,53419 Electronic and other electric equipment 0.0002 $10,110 0.0001 $19,350 0.0001 $19,659 $49,11920 Motor vehicles and equipment 0 $0 0 $0 0 $0 $021 Other transportation equipment 0.0003 $15,165 0.0002 $38,701 0.0003 $58,977 $112,84322 Instruments and related products 0.0002 $10,110 0.0002 $38,701 0.0002 $39,318 $88,12923 Miscellaneous manufacturing industries 0.0003 $15,165 0.0002 $38,701 0.0002 $39,318 $93,18324 Transportation 0.0126 $636,912 0.0106 $2,051,146 0.0104 $2,044,538 $4,732,59625 Communications 0.0048 $242,633 0.004 $774,017 0.0039 $766,702 $1,783,352

18
Table 5. Agricultural sector’s impact on earnings by industry, Dade County, 1996 (continued).
Agricultural Subsector
Fruits Vegetables Nursery Total
(Dollars) (Dollars) (Dollars) (Dollars)
Total sales outside region $50,548,600 $193,504,300 $196,590,200 $440,643,100
Industry aggregation Multiplier Impact * Multiplier Impact * Multiplier Impact *
(Dollars) (Dollars) (Dollars) (Dollars)
26 Electric, gas and sanitary services 0.0032 $161,756 0.0025 $483,761 0.0035 $688,066 $1,333,58227 Wholesale trade 0.0296 $1,496,239 0.018 $3,483,077 0.0178 $3,499,306 $8,478,62228 Retail trade 0.0221 $1,117,124 0.0185 $3,579,830 0.019 $3,735,214 $8,432,16729 Depository & nondepository institutions; securities
brokers0.0126 $636,912 0.0106 $2,051,146 0.0091 $1,788,971 $4,477,029
30 Insurance 0.0095 $480,212 0.0068 $1,315,829 0.0051 $1,002,610 $2,798,65131 Real estate 0.0028 $141,536 0.0029 $561,162 0.0017 $334,203 $1,036,90232 Hotels & lodging; amusements; recreation services 0.0050 $252,743 0.004 $774,017 0.0033 $648,748 $1,675,50833 Personal services 0.0049 $247,688 0.0039 $754,667 0.0032 $629,089 $1,631,44434 Business services 0.0224 $1,132,289 0.0186 $3,599,180 0.0152 $2,988,171 $7,719,64035 Eating and drinking places 0.0089 $449,883 0.0073 $1,412,581 0.0074 $1,454,767 $3,317,23136 Health services 0.0236 $1,192,947 0.0198 $3,831,385 0.0207 $4,069,417 $9,093,74937 Miscellaneous services 0.0108 $545,925 0.0089 $1,722,188 0.0084 $1,651,358 $3,919,47138 Private households ** 0.0009 $45,494 0.0007 $135,453 0.0008 $157,272 $338,219
Totals $25,638,250 $82,161,926 $87,266,390 $195,066,565
* Impact equals sales outside the county times the multiplier value.**Totals in the impact columns do not include the household sector.
19
Summary of Economic Impact Analysis & Comparison to 1990 Study
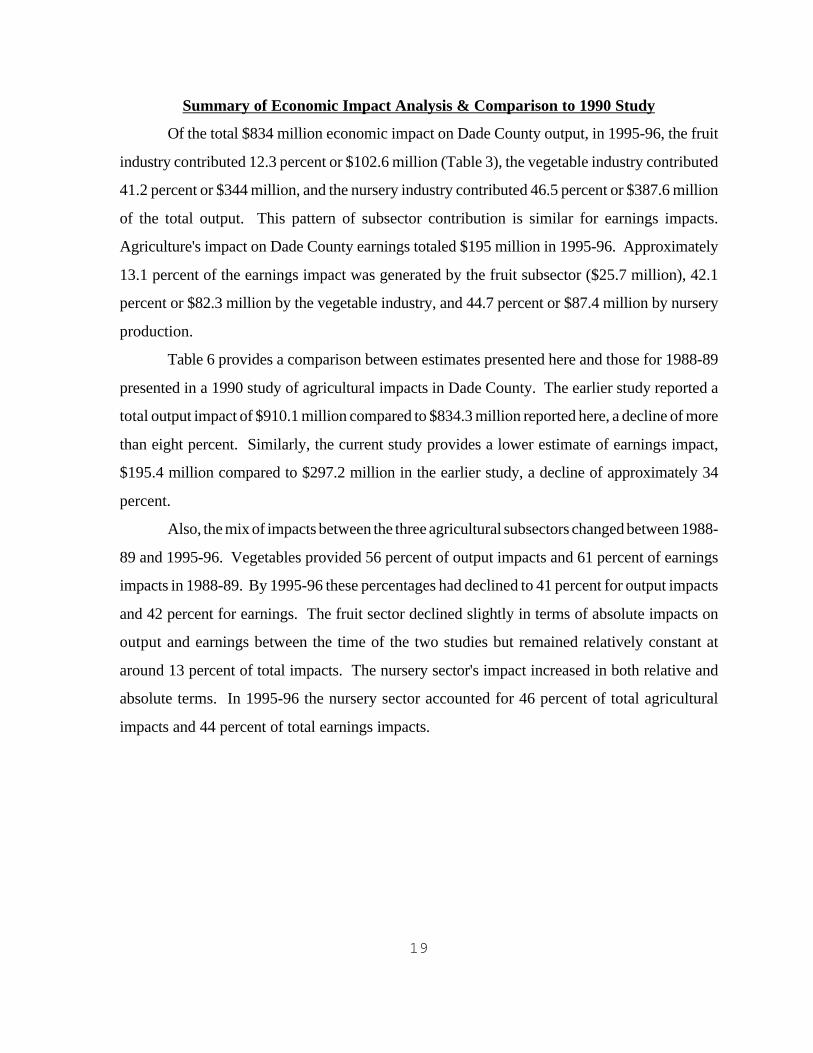
Of the total $834 million economic impact on Dade County output, in 1995-96, the fruit
industry contributed 12.3 percent or $102.6 million (Table 3), the vegetable industry contributed
41.2 percent or $344 million, and the nursery industry contributed 46.5 percent or $387.6 million
of the total output. This pattern of subsector contribution is similar for earnings impacts.
Agriculture's impact on Dade County earnings totaled $195 million in 1995-96. Approximately
13.1 percent of the earnings impact was generated by the fruit subsector ($25.7 million), 42.1
percent or $82.3 million by the vegetable industry, and 44.7 percent or $87.4 million by nursery
production.
Table 6 provides a comparison between estimates presented here and those for 1988-89
presented in a 1990 study of agricultural impacts in Dade County. The earlier study reported a
total output impact of $910.1 million compared to $834.3 million reported here, a decline of more
than eight percent. Similarly, the current study provides a lower estimate of earnings impact,
$195.4 million compared to $297.2 million in the earlier study, a decline of approximately 34
percent.
Also, the mix of impacts between the three agricultural subsectors changed between 1988-
89 and 1995-96. Vegetables provided 56 percent of output impacts and 61 percent of earnings
impacts in 1988-89. By 1995-96 these percentages had declined to 41 percent for output impacts
and 42 percent for earnings. The fruit sector declined slightly in terms of absolute impacts on
output and earnings between the time of the two studies but remained relatively constant at
around 13 percent of total impacts. The nursery sector's impact increased in both relative and
absolute terms. In 1995-96 the nursery sector accounted for 46 percent of total agricultural
impacts and 44 percent of total earnings impacts.

20
Table 6. A summary of agriculture's impact on Dade County's economy by agricultural sector, 1988-89and 1995-96.
Sector Total Output Earnings 1988-89 1995-96 1988-89 1995-96
Million Million Million MillionPercent Dollars Percent Dollars Percent Dollars Percent Dollars
Fruit 14.0 127.5 12.3 102.6 13.3 39.6 13.1 25.7
Vegetable 56.2 511.4 41.2 344.0 61.0 181.2 42.1 82.3
Nursery 29.8 271.2 46.5 387.6 25.7 76.4 44.7 87.4
Totalsa 100.0 910.1 100.0 834.3 100.0 297.2 100.0 195.4
aTotals may not sum to 100 due to rounding.
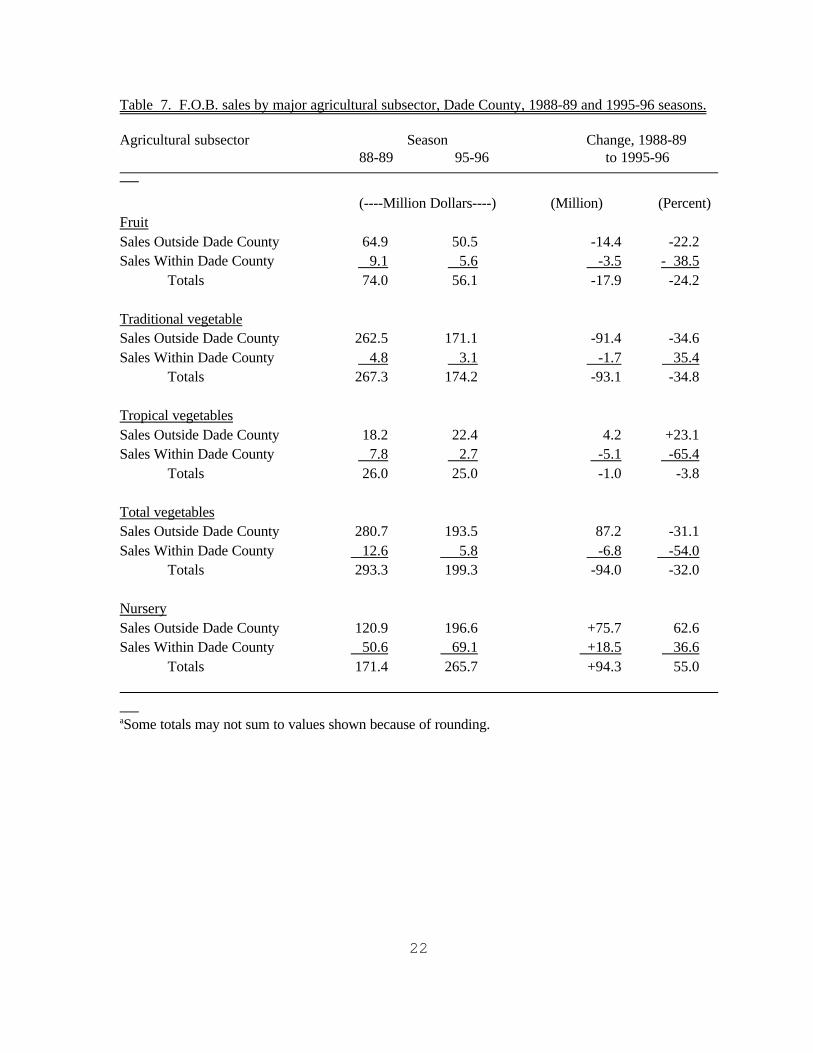
Examination of the F.O.B. sales data for each of the major agricultural subsectors reveals
where major changes have occurred in Dade County's agricultural economy since the 1988-89
economic impact study (Figures 1-4, Table 7). The declines in total economic impact (output)
and earnings impact are directly attributable to drastically reduced value of production in the
vegetable and fruit subsectors. Traditional vegetables showed the largest decline in total value
of production, going from $267.3 million in 1988-89 to $174.2 million in 1995-96, a drop of over
$93 million, or approximately 35 percent (Table 7). The crops showing the greatest declines were
tomatoes ($42.8 million) snap beans ($19.0 million) squash ($10.3 million) and potatoes ($6.2
million) and cukes ($2.8 million). Only sweet corn and eggplant increased in total value of
production, by $1.7 and 0.7 million, respectively. The reason for the lower values of production
vary from crop to crop, but most stem from lower acreage and prices. Although determining the
reasons for lower acreages and prices was outside the scope of this study, these effects are likely
due to increased competition from imports.
21
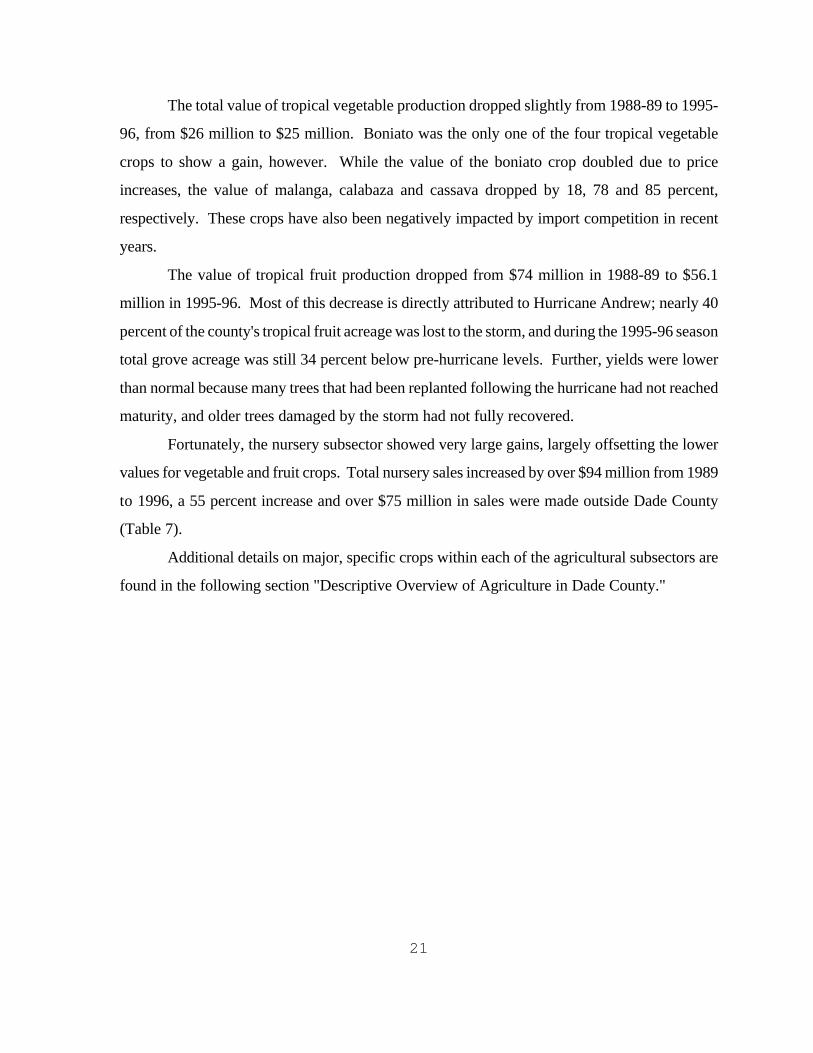
The total value of tropical vegetable production dropped slightly from 1988-89 to 1995-
96, from $26 million to $25 million. Boniato was the only one of the four tropical vegetable
crops to show a gain, however. While the value of the boniato crop doubled due to price
increases, the value of malanga, calabaza and cassava dropped by 18, 78 and 85 percent,
respectively. These crops have also been negatively impacted by import competition in recent
years.
The value of tropical fruit production dropped from $74 million in 1988-89 to $56.1
million in 1995-96. Most of this decrease is directly attributed to Hurricane Andrew; nearly 40
percent of the county's tropical fruit acreage was lost to the storm, and during the 1995-96 season
total grove acreage was still 34 percent below pre-hurricane levels. Further, yields were lower
than normal because many trees that had been replanted following the hurricane had not reached
maturity, and older trees damaged by the storm had not fully recovered.
Fortunately, the nursery subsector showed very large gains, largely offsetting the lower
values for vegetable and fruit crops. Total nursery sales increased by over $94 million from 1989
to 1996, a 55 percent increase and over $75 million in sales were made outside Dade County
(Table 7).
Additional details on major, specific crops within each of the agricultural subsectors are
found in the following section "Descriptive Overview of Agriculture in Dade County."
22
Table 7. F.O.B. sales by major agricultural subsector, Dade County, 1988-89 and 1995-96 seasons.
Agricultural subsector Season Change, 1988-8988-89 95-96 to 1995-96
(----Million Dollars----) (Million) (Percent)FruitSales Outside Dade County 64.9 50.5 -14.4 -22.2Sales Within Dade County 9.1 5.6 -3.5 - 38.5
Totals 74.0 56.1 -17.9 -24.2
Traditional vegetableSales Outside Dade County 262.5 171.1 -91.4 -34.6Sales Within Dade County 4.8 3.1 -1.7 35.4
Totals 267.3 174.2 -93.1 -34.8
Tropical vegetablesSales Outside Dade County 18.2 22.4 4.2 +23.1Sales Within Dade County 7.8 2.7 -5.1 -65.4
Totals 26.0 25.0 -1.0 -3.8
Total vegetables Sales Outside Dade County 280.7 193.5 87.2 -31.1Sales Within Dade County 12.6 5.8 -6.8 -54.0
Totals 293.3 199.3 -94.0 -32.0
NurserySales Outside Dade County 120.9 196.6 +75.7 62.6Sales Within Dade County 50.6 69.1 +18.5 36.6
Totals 171.4 265.7 +94.3 55.0 aSome totals may not sum to values shown because of rounding.
23
DESCRIPTIVE OVERVIEW OF AGRICULTURE IN DADE COUNTY
In order to fully appreciate the environment in which agriculture exists in Dade County,
it is helpful to first look at physical characteristics which contribute to the uniqueness of Dade
County agriculture, and then review agriculture in the county from a historical perspective. The
remainder of this report is devoted to describing Dade County agriculture by looking at its
physical characteristics, its history and selected commodities which are currently produced in the
county.
Physical Characteristics
Land Area and Population
Dade County covers 2,429.6 square miles or over one and one half million acres.
However, about three-fourths of the land area in the county is either covered by water, in water
conservation areas, in national parks, or is submarginal; i.e., unsuitable for urban or agricultural
use (reference). There were approximately 83,700 acres of farm land in the county in 1992, an
increase of about 600 acres over the 1987 Census of Agriculture (22). Nearly 22 percent of Dade
County farmland is foreign-owned (1).
With 4 percent of the state's population, Dade county ranks first in state population,
estimated to be over 2.0 million in 1996 (21). Dade County's populated area is located along the
coastal ridge. With respect to number of persons per square mile, Dade is the fourth most densely
populated county in the state, and Miami is the second most populous city in Florida with
376,000 inhabitants (1).
Soils
There are primarily two soil types on which Dade's fruits, vegetables, and nursery crops
are grown: Miami oolite, a solid rockland soil and Perrine marl, both basically calcium carbonate.
The marl and rockland farming soils are extremely low in organic matter and nutrients. Even with
the use of summer cover crops, organic buildup in these soils is slow and requires good
management year round. Both soil types are alkaline with pH of 7.5 to 8.5. Crops raised on
either type of soil depend on commercial fertilizer applications for nutrients. The consistency of
rockland and marl soils are quite different. The rock soil is hard but very porous and requires
frequent irrigation. On the other hand, flooding can be a problem for the marl land because marl
24
is a dense soil and percolation is slow (18).
Most of Dade's winter vegetables are grown on rock soil. Rock soils are located inland
on elevations ranging from eight to fourteen feet above sea level. Preparation of rock soils for
cultivation is unique and expensive. The rock soils must be broken up with track-type tractors
(D8 or D9 Caterpillars), with specially designed plows to scarify the solid rock into small
particles. Tractor clearing of rockland started in 1920 in the area of Coral Gables. Until that time,
rockland vegetable farming was impractical, but since 1947, vegetable acreage on the rockland
has increased steadily. Prior to 1925, rockland vegetable farming in the South Dade pinelands
was confined to "pot hole" areas in the pines. Farmers confined winter vegetable growing to the
marl areas of the East Glade and the inland finger glades. Some growers followed these practices
through 1935 and even later (3).
Perrine marl land must be contoured and shaped to allow appropriate runoff and drainage
of excess water. Marl land used for cultivation ranges from elevations of one to two feet along
the coastline to elevations up to seven and eight feet near the rock ridge and in the inland glades.
As long as flooding is controlled, almost anything will grow on the marl. Potatoes, other root
crops such as malanga and boniato, and large tree nurseries are currently found on marl lands.
Salt intrusion from hurricane storm surge can severely pollute the East Glade marl
vegetable lands and tree farms. Due to the very slow leachability of marl soil, salt pollution may
prevent land use for several years afterward. During the 1970s, a hurricane dike was built to
deter salt intrusion, hoping to protect farmland and residences located near the coastline. Salt
intrusion may also occur during severe droughts when the fresh water table declines.
Climate
Dade County, Florida is located on the lower east coast of the state at the bottom of a 400
mile long peninsula that is no more than 100 miles wide at its widest point. The Tropic of
Cancer, 23.4 degrees North latitude, is approximately 140 miles south of Homestead. The county
has a subtropical climate, wet and hot in the summer (May to November) and cool and dry
through the winter (December to April). Average temperatures range from 67° F in January,
steadily increasing to an average of 83° F in July and August, then again decreasing to the mid
to low 70s during the fall. For Miami the average annual high temperature is 82.6° F and the
25
average annual low is 68.7° F, with the highest temperature of record (at the Miami International
airport) being 98° F and the lowest temperature of record being 30° F (1). However, in the
farming areas around Homestead, temperatures of 25° F and lower have been reported.
Subfreezing temperatures may occur about every two years with moderate to severe damage to
agricultural commodities. Frosts are recorded almost every winter. Droughts have influenced
production practices and affect the area every few years. There is occasional flooding during the
wet season, which lasts from June through October. The greatest amount of rainfall generally
occurs in September and October. Average annual rainfall is approximately 58 inches (38), with
as much as 100 inches reported in the Homestead area in the early 1970s (18).
Irrigation
Low rainfall during the dry season combined with the porous nature of the rock soils
necessitates the use of irrigation. Irrigation systems, therefore, play an important role in
agricultural production in Dade County. Encased wells for portable overhead high-pressure
volume gun irrigation rigs are used primarily for winter vegetable production. Permanent solid
set sprinkler irrigation is used in the production of fruits and nursery crops. Permanent and
portable solid set sprinklers also provide frost and freeze protection for many crops. Trickle and
drip low-volume irrigation systems are also used by farmers in Dade County. Farmers and
researchers are converting irrigation systems to low-volume systems due to recent droughts,
water restrictions, and increased urban water use.
Natural disasters
Although Dade County enjoys a highly productive sub-tropical growing environment, the
area is also susceptible to a wide range of potentially devastating natural disasters, such as
hurricanes, floods, droughts and freezing temperatures.
Hurricanes.--Hurricanes have had devastating effects on Dade County and on the
agricultural sector in particular. Hurricane Andrew, which struck the Homestead area on August
24, 1992 was the most destructive hurricane to ever hit the U.S. Andrew caused an estimated $25
billion in damage, and effects are still evident in some tropical fruit groves even though five years
have elapsed. Grove crops and ornamental plant nurseries were particularly hard hit by Andrew.
Approximately 57 percent of the lime acreage was destroyed, as was about one-third of the
26
mango and avocado acreage. Many other types of tropical fruit groves were heavily damaged
as well (5). Nurseries also sustained heavy losses of shade houses, greenhouses and plant material.
Andrew was particularly shocking to many south Florida residents, including agricultural
producers, because there had not been any serious hurricane damage in the area since the 1960s.
Until Andrew, the last hurricanes to cause damage were Donna in 1960, Betsy in 1965 and Inez
in 1966. Hurricane Donna was the most damaging of storms to hit in the 1960's. In October,
1994, tropical storm Gordon inflicted considerable damage to Dade County. High winds gusted
to over 50 miles per hour, and excessive rainfall caused extensive flooding. Crop losses for most
traditional winter vegetables and tropical vegetables ranged from 85 to 100 percent. Tree crops
such as limes, carambola, and bananas sustained from 50 to 80 percent losses.
Freezes.--Freezes in Dade County are not unique occurrences. A freeze in 1958 caused
"financial loss to Dade County's agriculture (that) was the greatest of any on record (as of
1958)... The official low temperature for the morning of February 5, 1958, near Homestead was
25 degrees" (4). More recently, freezes occurred during 1960, 1962, 1967, 1977, 1983, 1985,
and 1989. Of these freezes, the 1958, 1977, and 1989 caused the most extensive crop damage.
The "Christmas Freeze of 1989" was an extremely damaging freeze. High winds caused wind
burn and plant desiccation. High winds exacerbated the freeze because most types of irrigation
normally used for freeze protection became ineffective when the winds reached 15 mph and
higher. Long duration of record low temperatures in the Homestead area (25° F ) and frost
occurring for two consecutive nights also contributed to the severity of damage. This freeze was
preceded by temperatures in the upper 70s and some low 80s. Plants had not had any low
temperatures to become "winterized" in preparation for more severe conditions. Therefore, any
one of the factors listed above (wind, duration, record low temperature, and frost) can severely
damage trees and plants, but the combination of all four destroyed a large portion of the winter
vegetables, with nursery and grove damages continuing to appear as late as the summer of 1990
(18).
Historical View of Dade County Agriculture
Many aspects of Dade County agriculture have changed over time. The number of farms,
size of farms, types of farms, value of farm production, and geographic location of farms in the
27
county have all changed.
Acreage in Farms
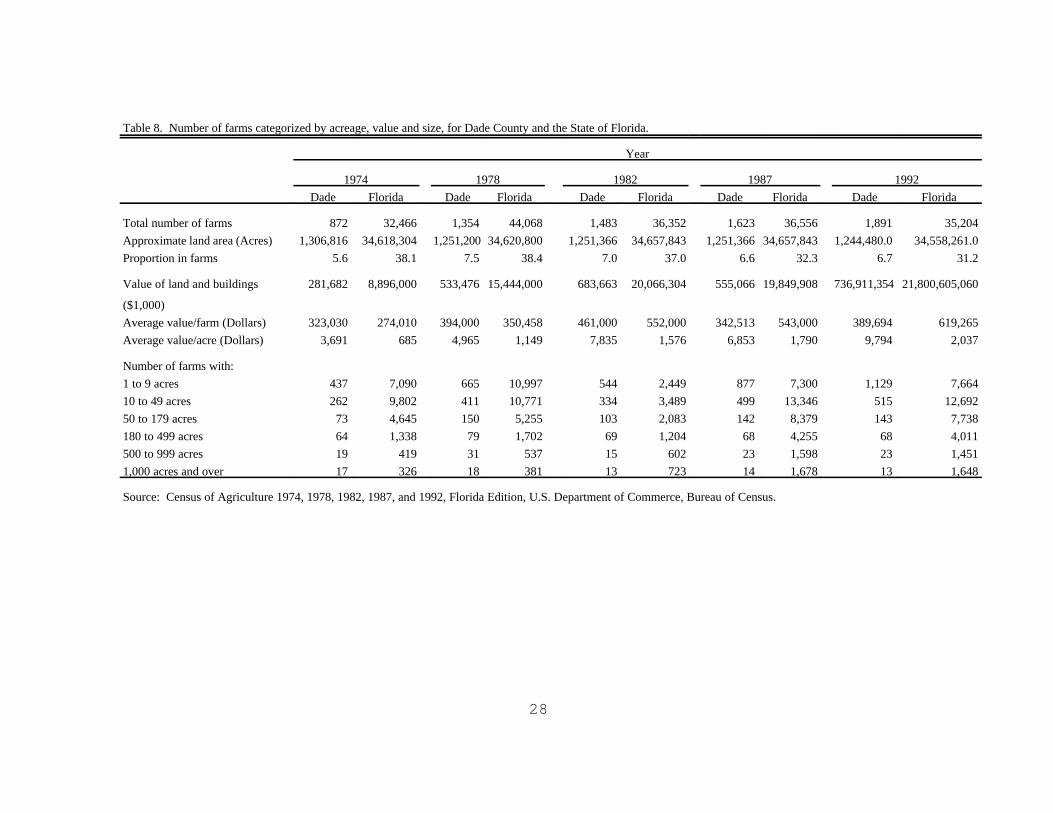
Census of Agriculture data gives some perspective of the changes Dade County
agriculture has undergone in the 1970s and 80s and early 90s. In 1974, there were 872 farms in
Dade County; by 1987, there were reportedly 1,623 and by 1992 there were 1,891 (Table 8).
Thus the number of farms in the county increased by 117 percent between 1974 and 1992. Farms
with less than ten acres almost tripled in number, the largest increase of any size category. In
1974, there were 437 farms that were one to nine acres in size, and by 1992 there were 1,129
farms in this size category. This smallest size category, nine acres or less, had grown to represent
60 percent of all farms in the county by 1992. Eighty-seven percent of Dade farms (1,644 farms)
were of 49 acres or less in size in 1992.
Dade County's average per acre value of land and buildings is nearly five times higher than
the state average (Table 8). This is probably the result of substantially higher per acre land values
for the county.
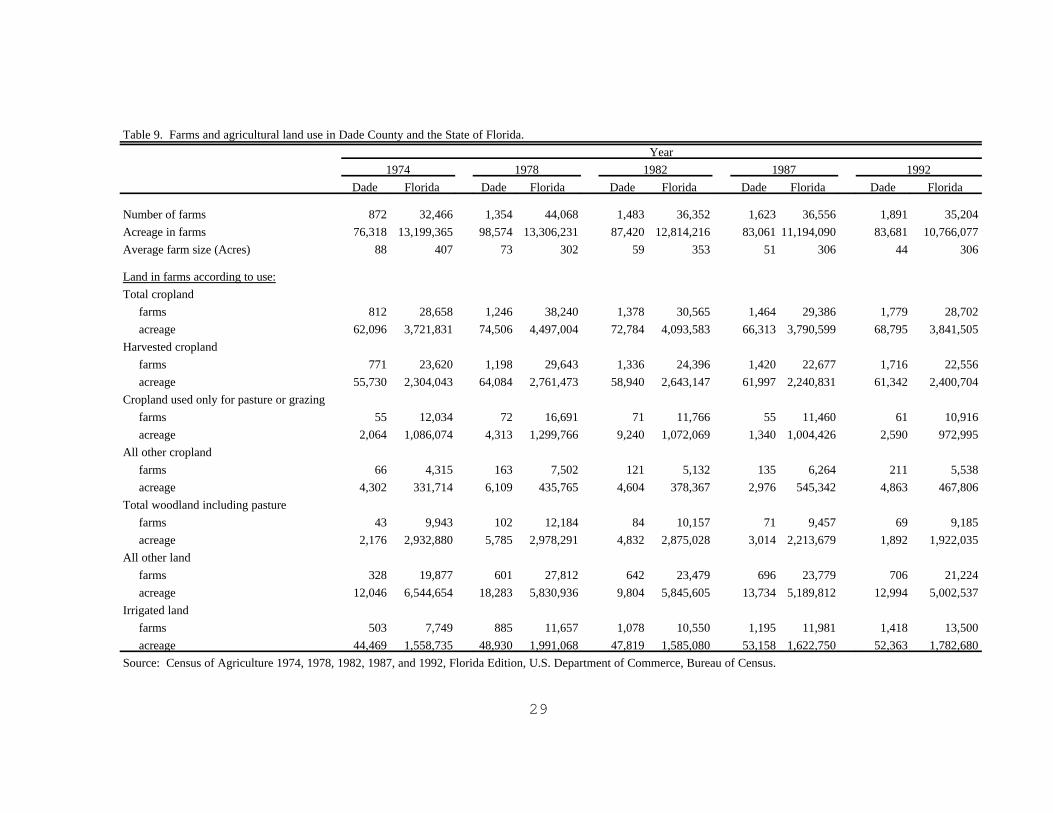
Between 1974 and 1992 there was an 117 percent increase in the number of farms in Dade
County, but there was only a 9.6 percent increase in the amount of farmland acreage (76,318
acres in 1974 up to 83,681 acres reported in 1992). Larger parcels were being subdivided into
smaller units during this time period (Table 9). By 1992, the average farm size was only half as
large as in 1974, declining from 88 to 44 acres. From 1974 to 1992, harvested cropland, "all
other land" (land other than cropland or woodland), and irrigated land all showed substantial
increases in the number of farms but much smaller increases in the amount of acreage. The "all
other land " category captures increases in the number of farms for smaller orchards, groves, and
nurseries. Harvested cropland from 1974 to 1992 increased from 771 farms to 1,716 farms,
representing a 123 percent increase; whereas, the amount of
28
Table 8. Number of farms categorized by acreage, value and size, for Dade County and the State of Florida.
Year
1974 1978 1982 1987 1992
Dade Florida Dade Florida Dade Florida Dade Florida Dade Florida
Total number of farms 872 32,466 1,354 44,068 1,483 36,352 1,623 36,556 1,891 35,204
Approximate land area (Acres) 1,306,816 34,618,304 1,251,200 34,620,800 1,251,366 34,657,843 1,251,366 34,657,843 1,244,480.0 34,558,261.0
Proportion in farms 5.6 38.1 7.5 38.4 7.0 37.0 6.6 32.3 6.7 31.2
Value of land and buildings
($1,000)
281,682 8,896,000 533,476 15,444,000 683,663 20,066,304 555,066 19,849,908 736,911,354 21,800,605,060
Average value/farm (Dollars) 323,030 274,010 394,000 350,458 461,000 552,000 342,513 543,000 389,694 619,265
Average value/acre (Dollars) 3,691 685 4,965 1,149 7,835 1,576 6,853 1,790 9,794 2,037
Number of farms with:
1 to 9 acres 437 7,090 665 10,997 544 2,449 877 7,300 1,129 7,664
10 to 49 acres 262 9,802 411 10,771 334 3,489 499 13,346 515 12,692
50 to 179 acres 73 4,645 150 5,255 103 2,083 142 8,379 143 7,738
180 to 499 acres 64 1,338 79 1,702 69 1,204 68 4,255 68 4,011
500 to 999 acres 19 419 31 537 15 602 23 1,598 23 1,451
1,000 acres and over 17 326 18 381 13 723 14 1,678 13 1,648
Source: Census of Agriculture 1974, 1978, 1982, 1987, and 1992, Florida Edition, U.S. Department of Commerce, Bureau of Census.
29
Table 9. Farms and agricultural land use in Dade County and the State of Florida.
Year
1974 1978 1982 1987 1992
Dade Florida Dade Florida Dade Florida Dade Florida Dade Florida
Number of farms 872 32,466 1,354 44,068 1,483 36,352 1,623 36,556 1,891 35,204
Acreage in farms 76,318 13,199,365 98,574 13,306,231 87,420 12,814,216 83,061 11,194,090 83,681 10,766,077
Average farm size (Acres) 88 407 73 302 59 353 51 306 44 306
Land in farms according to use:
Total cropland
farms 812 28,658 1,246 38,240 1,378 30,565 1,464 29,386 1,779 28,702
acreage 62,096 3,721,831 74,506 4,497,004 72,784 4,093,583 66,313 3,790,599 68,795 3,841,505
Harvested cropland
farms 771 23,620 1,198 29,643 1,336 24,396 1,420 22,677 1,716 22,556
acreage 55,730 2,304,043 64,084 2,761,473 58,940 2,643,147 61,997 2,240,831 61,342 2,400,704
Cropland used only for pasture or grazing
farms 55 12,034 72 16,691 71 11,766 55 11,460 61 10,916
acreage 2,064 1,086,074 4,313 1,299,766 9,240 1,072,069 1,340 1,004,426 2,590 972,995
All other cropland
farms 66 4,315 163 7,502 121 5,132 135 6,264 211 5,538
acreage 4,302 331,714 6,109 435,765 4,604 378,367 2,976 545,342 4,863 467,806
Total woodland including pasture
farms 43 9,943 102 12,184 84 10,157 71 9,457 69 9,185
acreage 2,176 2,932,880 5,785 2,978,291 4,832 2,875,028 3,014 2,213,679 1,892 1,922,035
All other land
farms 328 19,877 601 27,812 642 23,479 696 23,779 706 21,224
acreage 12,046 6,544,654 18,283 5,830,936 9,804 5,845,605 13,734 5,189,812 12,994 5,002,537
Irrigated land
farms 503 7,749 885 11,657 1,078 10,550 1,195 11,981 1,418 13,500
acreage 44,469 1,558,735 48,930 1,991,068 47,819 1,585,080 53,158 1,622,750 52,363 1,782,680
Source: Census of Agriculture 1974, 1978, 1982, 1987, and 1992, Florida Edition, U.S. Department of Commerce, Bureau of Census.
30
harvested cropland acreage over this time period increased by only 10 percent (from 55,730 acres
in 1974 to 61,342 acres in 1992). The number of farms considered "all other land" more than
doubled between 1974 and 1987, from 328 farms to 706 farms, representing a 115 percent
increase. At the same time however, acreage for this "all other land" category increased by only
8 percent, from 12,046 acres in 1974 to 12,994 in 1992. The number of irrigated farms almost
tripled between 1974 and 1992, a 182 percent increase from 503 farms to 1,418 farms. Irrigated
acreage also increased during this time frame by almost 18 percent, from 44,469 acres to 52,363
acres. However, irrigated acreage declined by nearly 800 acres (1.5 percent) from 1987 to 1992.
Over the 1974-92 period, Dade County experienced large percentage increases in
numbers of orchards and grove acreage compared to generally declining numbers statewide
(Table 10). The number of Dade County farms in fruit production in 1974 totaled 448 and
steadily rose to 1,092 by 1987, more than doubling the county's number of groves. However,
after years of sustained increases, grove acreage in Dade County declined slightly (5.4 percent)
from 1987 to 1992. This decline is likely due to Hurricane Andrew.
Value of Production
Census of Agriculture (22) data also provide information on the value of agricultural
production in Dade County. Table 11 and Figure l show published farm gate values for
agricultural production from the census. Dollar values for all years are reported in current (1996)
dollars, constant dollars adjusted for inflation. Gross production values for vegetables and
commercial ornamental horticulture generally show upward trends over the reported census years
1974 through 1987, but the value of fruit crops declined precipitously from 1987 to 1992, from
$35.0 million to $20.6 million. This drop is attributable to the widespread destruction caused by
Hurricane Andrew. The farm value of vegetables rose by 85 percent from 1987 to 1992.
Commercial ornamental horticulture also showed a substantial gain in gross sales; in 1987, gross
sales were $151.5 million to $179.6 million in 1992, an increase of about 19 percent. Since the
1974 census, the value of gross sales of ornamental horticulture production more than
quadrupled. On the negative side, Agricultural Census statistics show a persistent, long-term
decline in field crop production; in 1992 field crop acreage was only 8 percent of what it had been
in 1974, and the Census did not estimate the relatively small value of production (Table 11).
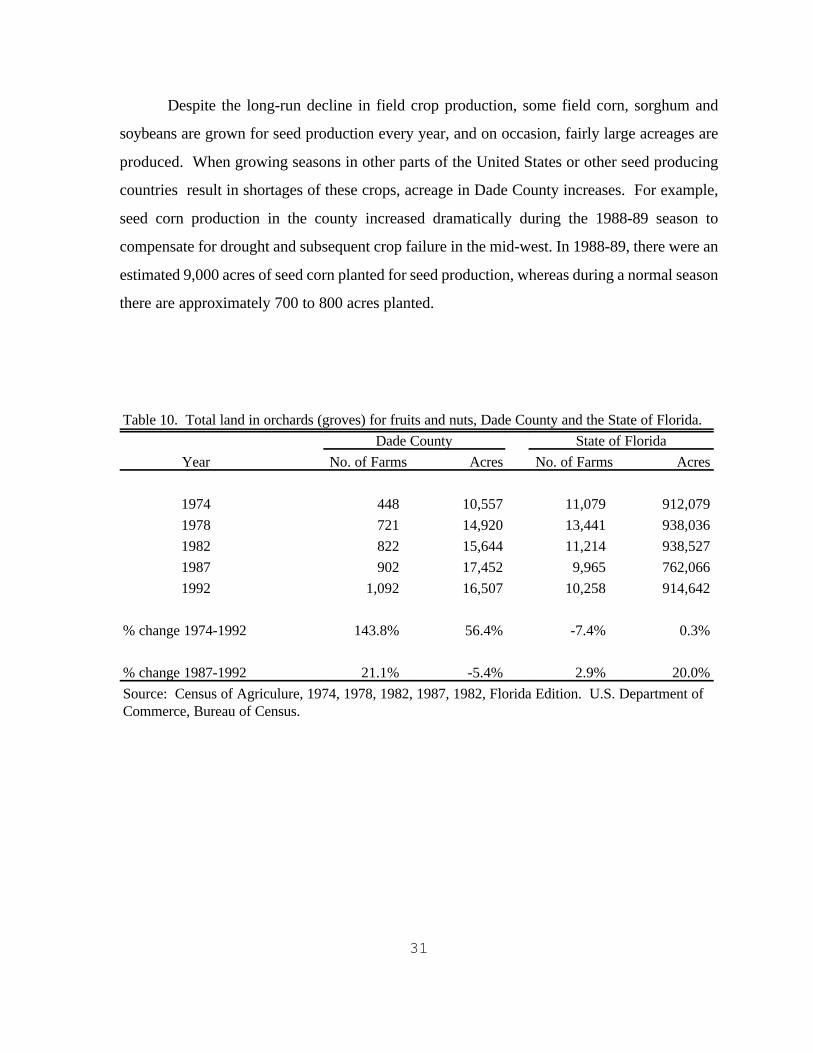
31
Despite the long-run decline in field crop production, some field corn, sorghum and
soybeans are grown for seed production every year, and on occasion, fairly large acreages are
produced. When growing seasons in other parts of the United States or other seed producing
countries result in shortages of these crops, acreage in Dade County increases. For example,
seed corn production in the county increased dramatically during the 1988-89 season to
compensate for drought and subsequent crop failure in the mid-west. In 1988-89, there were an
estimated 9,000 acres of seed corn planted for seed production, whereas during a normal season
there are approximately 700 to 800 acres planted.
Table 10. Total land in orchards (groves) for fruits and nuts, Dade County and the State of Florida.
Dade County State of Florida
Year No. of Farms Acres No. of Farms Acres
1974 448 10,557 11,079 912,079
1978 721 14,920 13,441 938,036
1982 822 15,644 11,214 938,527
1987 902 17,452 9,965 762,066
1992 1,092 16,507 10,258 914,642
% change 1974-1992 143.8% 56.4% -7.4% 0.3%
% change 1987-1992 21.1% -5.4% 2.9% 20.0%
Source: Census of Agriculure, 1974, 1978, 1982, 1987, 1982, Florida Edition. U.S. Department ofCommerce, Bureau of Census.
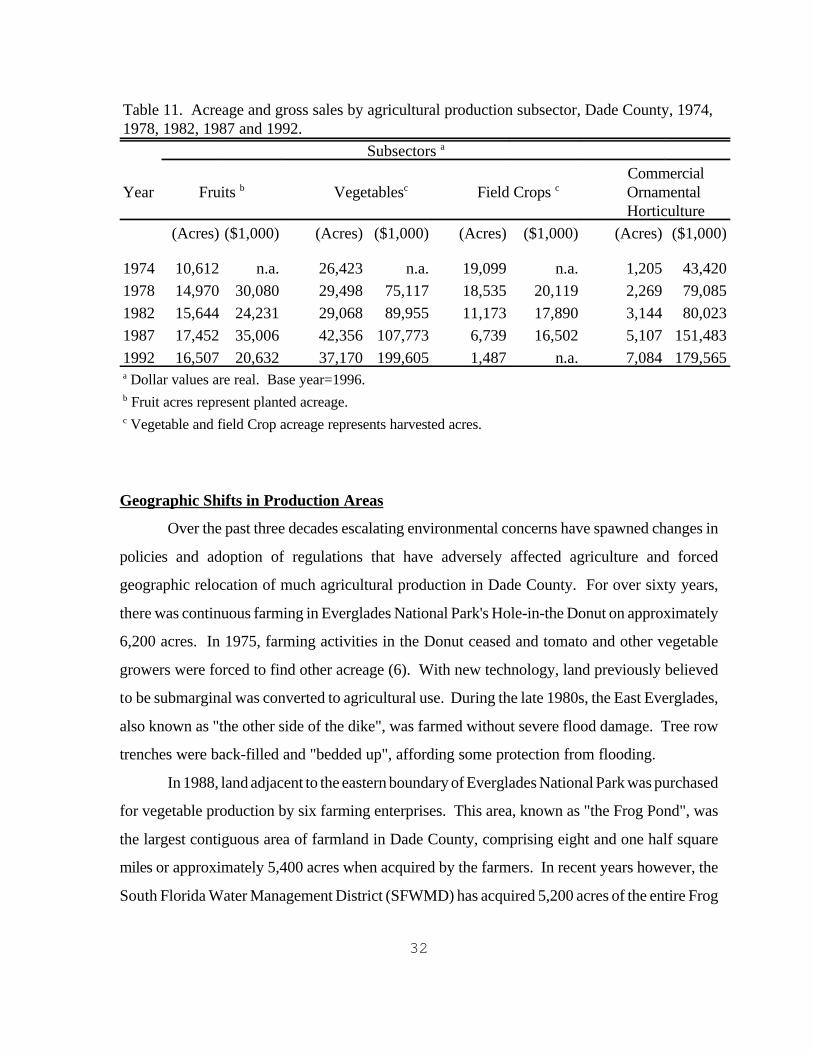
32
Table 11. Acreage and gross sales by agricultural production subsector, Dade County, 1974,1978, 1982, 1987 and 1992.
Subsectors a
Year Fruits b Vegetablesc Field Crops c Commercial Ornamental
Horticulture
(Acres) ($1,000) (Acres) ($1,000) (Acres) ($1,000) (Acres) ($1,000)
1974 10,612 n.a. 26,423 n.a. 19,099 n.a. 1,205 43,420
1978 14,970 30,080 29,498 75,117 18,535 20,119 2,269 79,085
1982 15,644 24,231 29,068 89,955 11,173 17,890 3,144 80,023
1987 17,452 35,006 42,356 107,773 6,739 16,502 5,107 151,483
1992 16,507 20,632 37,170 199,605 1,487 n.a. 7,084 179,565a Dollar values are real. Base year=1996.b Fruit acres represent planted acreage.c Vegetable and field Crop acreage represents harvested acres.
Geographic Shifts in Production Areas
Over the past three decades escalating environmental concerns have spawned changes in
policies and adoption of regulations that have adversely affected agriculture and forced
geographic relocation of much agricultural production in Dade County. For over sixty years,
there was continuous farming in Everglades National Park's Hole-in-the Donut on approximately
6,200 acres. In 1975, farming activities in the Donut ceased and tomato and other vegetable
growers were forced to find other acreage (6). With new technology, land previously believed
to be submarginal was converted to agricultural use. During the late 1980s, the East Everglades,
also known as "the other side of the dike", was farmed without severe flood damage. Tree row
trenches were back-filled and "bedded up", affording some protection from flooding.
In 1988, land adjacent to the eastern boundary of Everglades National Park was purchased
for vegetable production by six farming enterprises. This area, known as "the Frog Pond", was
the largest contiguous area of farmland in Dade County, comprising eight and one half square
miles or approximately 5,400 acres when acquired by the farmers. In recent years however, the
South Florida Water Management District (SFWMD) has acquired 5,200 acres of the entire Frog
33
Pond area as part of the Everglades Restoration Program. According to SFWMD, personnel half
of the Frog Pond acreage has been leased back to private citizens for agricultural purposes. The
SFWMD is also attempting to purchase 5,400 acres of farmland in the Rocky Glades area. To
date the SFWMD has bought 1,723 acres, 922 acres of which has been leased back to agricultural
producers. Thus, approximately 9,600 acres of farmland has been taken out of production in
these three environmentally sensitive areas since 1975, and even more agricultural land will be
taken out of production when SFWMD achieves its land acquisition goal in the Rocky Glades
area.
Production of Selected Agricultural Commodities
Dade County's diversified commercial agricultural industry can be categorized into four
major subsectors: ornamental horticulture, traditional vegetables, tropical vegetables and tropical
fruits. The discussion which follows addresses each of the subsectors, identifying principle
commodities, production trends for selected commodities, and estimates of 1995-96 production
and F.O.B. value of production.
Descriptive discussions of the various agricultural commodities produced in Dade County
which appeared in the Florida Agricultural Market Research Center's 1990 benchmark study,
Economic Impact of Agriculture and Agribusiness in Dade County, Florida are not repeated here
for the sake of brevity. Readers interested in basic attributes of the various crops and general
cultural practices are referred to the original study (18).
It should be noted that the total economic impact of agriculture was essentially based
upon new dollars that are generated by sales of production and embodied services sold outside
of Dade County. Thus, it was necessary to estimate sales of all commodities within and outside
of the county. In addition, the vast agricultural service industry which includes landscaping, lawn
care, tree surgeons, etc, in Dade County was not included in this study because most of these
services are performed within the county and thus do not generate "new" dollars.
Commercial Ornamental Horticulture
The very nature of Dade County’s sub-tropical environment encourages a diverse,
34
complex horticultural industry. The nursery industry in Dade County has grown from 492
nurseries and flower growers in 1957-58 (4) to about 761 nurseries registered with Florida’s
Department of Plant Inspection (DPI) in 1996 (13). Considering that some of these nurseries
have multiple locations, it is currently estimated that there are between 1,000 and 1,200 nursery
sites in Dade County. This represents an increase of about 55 percent in the number of nurseries
in the county in four decades. The number of nurseries is only up about 1.5 percent since 1989
when DPI registered 750 nurseries in the county, but dollar volume of sales has increased by 55
percent.
In addition to plant nurseries, the commercial ornamental horticulture sector also includes
landscape and interiorscape maintenance services, landscape contractors and architects, suppliers
of nursery equipment and materials, a cut flower industry with nearly 100 importers, some of
which are multi-million dollar import-export establishments, and a vast array of businesses such
as golf courses, condominium complexes, cemeteries, parks, etc. that employ various types of
horticultural experts .
Types of nursery operations
There are basically three types of nurseries in Dade County. They are "field",
"container", and "greenhouse". A number of Dade nursery owners having varied acreage
combinations of the three. Field nurseries are always grown on marl soil because it is
prohibitively expensive to harvest trees grown on rockland soils. They generally range in size
from one to two acres to several hundred acres depending on the type of production. Field
nurseries usually have trees in the ground from a minimum of 1.5 years to 4 years and planting
densities between 500 and 1,000 trees per acre depending upon the type of tree.
Field nurseries in Dade County supply trees to malls and various indoor establishments
throughout the U.S. and Canada. Since these trees have been grown in full sun, nurseries must,
depending on the final destination point, transfer the trees to large shade houses for a period of
time appropriate for acclimation. Similarly, shade houses are also used in container nurseries.
Landscape plants destined for South Florida can be grown in full sun; however, for those plants
shipped to other destinations or grown for interiorscape purposes, shade houses are used to
reduce the amount of sunlight under which the plant in grown, thereby adapting plants to a variety
of conditions.
35
In addition to field nurseries and container nurseries, there are also nurseries that specialize in
liners, starter plants grown from tissue culture or seed, and supplied to growers in South Florida
from growers located within the county as well as other parts of the U.S., Europe, the Caribbean,
and Central America. Some larger nursery businesses have their own off-shore operations that
supply liners and smaller plant material to their Dade County operation.
Survey Analyses
It is important to stress that the survey, analyses, and conclusions provided as part of this
study do not include the service sector of the ornamental horticultural industry. This service
sector includes landscape maintenance firms, landscape architects, lawn equipment dealers, and
so forth. Restricted by time, resources, and the industry’s diversity and complexity, this study
only surveyed the Dade County nurseries registered with the Florida Department of Agriculture's
Division of Plant Inspection (DPI), and this survey determined the aggregate economic impact
of plant nurseries. Data on nurseries' production practices, acreages, sales volumes and location
of sales activity (in-county vs. out-of-county) were obtained through a mail survey with an
intensive telephone follow-up effort to interview non-respondents to the mail survey.
The mail survey, requesting nursery information for calendar year 1996, was conducted
during the spring of 1997. DPI provided its most current computer listing of all registered Dade
County nurseries (13). However, services that were provided by the DPI inspected nurseries that
were incidental to their plant production operations are included. The DPI mailing list included
a total of 761 nurseries. As completed questionnaires were returned to FARMC, research
assistant conducted follow-up calls to clarify information if necessary. Non-respondents were
contacted by telephone to obtain data. At least five attempts were made to reach each number
on the DPI list. Searches of Internet phone directories were made to find telephone numbers that
had changed. In total, the survey effort yielded information on 390 DPI listings. Of the 390
cooperating respondents, 314 provided usable economic information, while the remaining 76 were
hobbyists, recently established firms with no sales activities during the 1996 period, or firms that
had gone out of business. Attempts were made to interview the other 371 firms on the DPI list,
but many were unreachable, some telephone numbers were unlisted, and others refused to
cooperate. The 390 cooperating nurseries represent a 51 percent response rate to the survey
effort. The 314 questionnaires providing usable economic data represent a 41 percent usable
response rate for the economic portion of the survey. It is not unusual for agricultural mail
36
surveys of this type to have only a 10 to 15 percent response rate.
Information obtained from the 390 cooperating businesses was used to estimate the
economic activity among the 371 unreachable or uncooperative nurseries. The 371 were
distributed as the 390 across categories of active nurseries, out of business, hobbyists, or recently
started with no 1996 sales activity. All subsequent discussion of the economic data refers to 592
commercial nurseries estimated to be active in Dade County that had sales in 1996. This number
excludes 72 nurseries estimated to be small-scale hobbyists, 88 operations that have been acquired
by or merged with other Dade County nurseries, and 9 recently established nurseries that had no
sales during calendar 1996.
Container acreage was estimated to be about 2,661 (30.7 percent), field acreage was 5,547 (64.0
percent) and greenhouse acreage was 459 (5.3 percent) (Figure 6). According to DPI records,
nursery acreage in Dade County totaled 8,700.3 acres in 1996. This figure was adjusted to
remove non-commercial and startup acreage, resulting in a commercial acreage estimate of 8,667
acres.
With respect to production systems, 31.5 percent specialized solely in container
production, 7.6 percent were solely in field production, and 6.4 percent only used greenhouses
(Figure 7). The remaining 54.5 percent had some combination of container, greenhouse, and/or
field operations. Almost 100 percent of all gross sales were from the wholesale trade (Figure 8),
96.7 percent of gross sales were from plant sales and 3.3 percent from sales of related services
(Figure 9). Foliage sales accounted for 34.4 percent of the total value of production, followed
by woody ornamentals with 29.4 percent. Flowering plants generated 25.9 percent of total value,
followed by fruit and nut trees with 9.0 percent and bedding plants with 1.3 percent (Figure 10).
Seventy-four percent of gross sales were made to buyers outside Dade County (Figure 11).
37
Figure 6. Major nursery production systems and acreages.
Figure 7. Production system specialization.
38
Figure 8. Percentages of wholesale and retail nursery sales.
Figure 9. Percentages of gross sales comprised of plants and related services.
39
Figure 10. Percentages of sales of various types of nursery crops grown in Dade County.
Figure 11. Percentages of gross sales inside and outside Dade County.

40
Gross sales per acre.-Generally, field nurseries show the lowest overall gross income per
acre, then container, and the greatest income per acre from greenhouses. Survey results indicated
that the average gross income over all types of operations was $30,649 per acre. Therefore, it
is estimated that the total value of Dade County’s nursery production was $265.7 million in 1996
(Table 2, Figure 4).
Traditional Vegetables
Dade County is known for its winter vegetable production due to the commodities grown
in winter months, when much of the U.S. vegetable production is dormant. Traditional vegetables
produced in Dade County include tomatoes, potatoes, yellow squash, zucchini, pole beans, bush
beans, sweet corn, seed corn, and soybeans, strawberries, cucumbers, pickles, okra, eggplant,
peppers, cabbage, southern field peas, and turnips. Corn and soybeans grown for seed are
technically agronomic crops, but are included in this section for lack of a more appropriate
classification within the report. This list represents those vegetables grown in Dade County for
which there were published data (11), official but unpublished data (10), data collected from local
growers, or data that could be estimated by using local information on acreage and yield and
using published prices. Therefore, this list is not considered exhaustive; there may be other
vegetables grown in Dade but are not itemized here because production is either very small or is
unreported.
During the 1995-96 season, traditional vegetables grown in Dade County accounted for
approximately one-third of the value of all agricultural production. Traditional vegetables were
estimated to have an aggregate total gross production value of $174.2 million of which 98 percent
or $171.1 million were sales outside the county (Table 12). The distinction made between the
proportions of commodity sales within the county vs. sales outside of Dade County is necessary
for economic impact analysis and is explained in greater detail in the first major section of this
report. Tomatoes, bush beans, potatoes, squash and peppers accounted for about 90 percent of
the total value of traditional vegetable crops in the 1995-96 season.
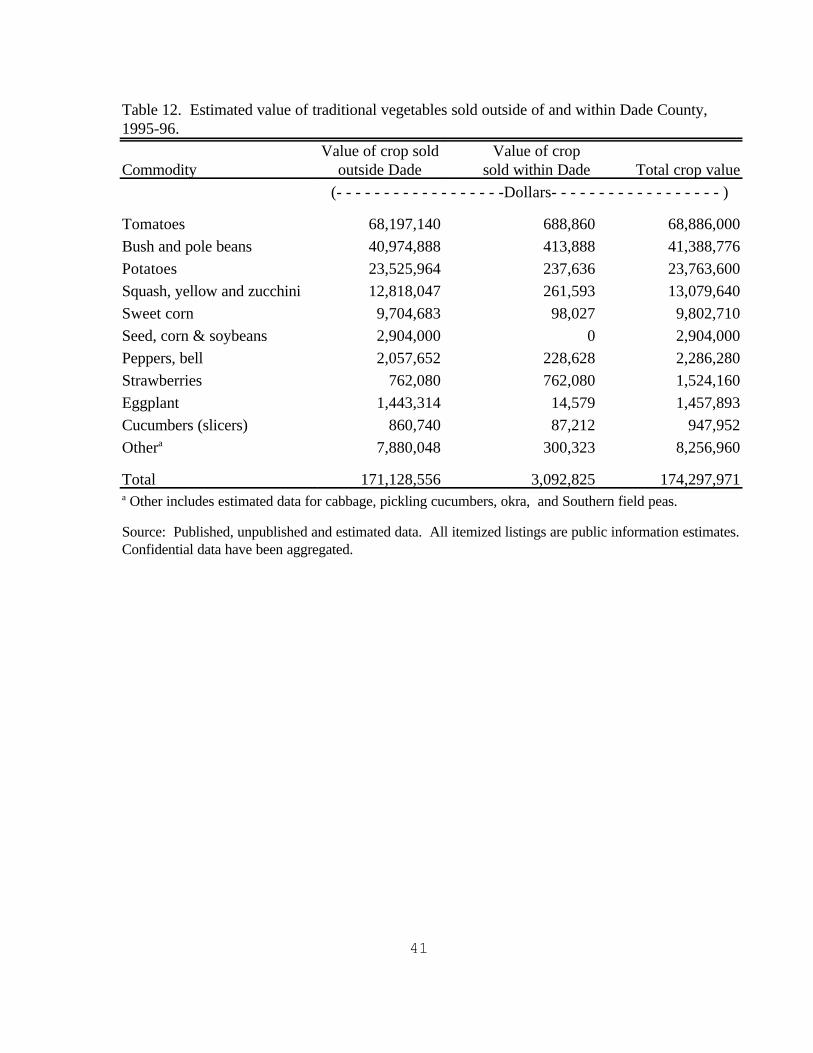
41
Table 12. Estimated value of traditional vegetables sold outside of and within Dade County,1995-96.
CommodityValue of crop sold
outside Dade Value of crop
sold within Dade
Total crop value
(- - - - - - - - - - - - - - - - - -Dollars- - - - - - - - - - - - - - - - - - )
Tomatoes 68,197,140 688,860 68,886,000
Bush and pole beans 40,974,888 413,888 41,388,776
Potatoes 23,525,964 237,636 23,763,600
Squash, yellow and zucchini 12,818,047 261,593 13,079,640
Sweet corn 9,704,683 98,027 9,802,710
Seed, corn & soybeans 2,904,000 0 2,904,000
Peppers, bell 2,057,652 228,628 2,286,280
Strawberries 762,080 762,080 1,524,160
Eggplant 1,443,314 14,579 1,457,893
Cucumbers (slicers) 860,740 87,212 947,952
Othera 7,880,048 300,323 8,256,960
Total 171,128,556 3,092,825 174,297,971a Other includes estimated data for cabbage, pickling cucumbers, okra, and Southern field peas.
Source: Published, unpublished and estimated data. All itemized listings are public information estimates. Confidential data have been aggregated.
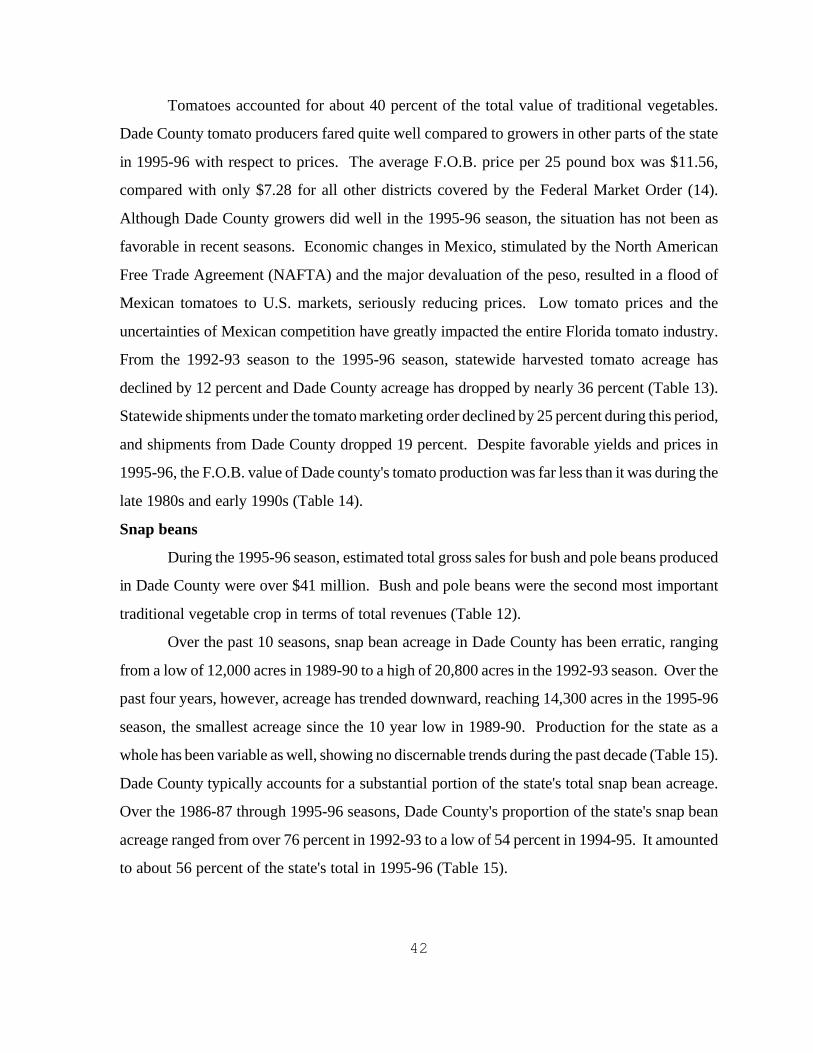
42
Tomatoes accounted for about 40 percent of the total value of traditional vegetables.
Dade County tomato producers fared quite well compared to growers in other parts of the state
in 1995-96 with respect to prices. The average F.O.B. price per 25 pound box was $11.56,
compared with only $7.28 for all other districts covered by the Federal Market Order (14).
Although Dade County growers did well in the 1995-96 season, the situation has not been as
favorable in recent seasons. Economic changes in Mexico, stimulated by the North American
Free Trade Agreement (NAFTA) and the major devaluation of the peso, resulted in a flood of
Mexican tomatoes to U.S. markets, seriously reducing prices. Low tomato prices and the
uncertainties of Mexican competition have greatly impacted the entire Florida tomato industry.
From the 1992-93 season to the 1995-96 season, statewide harvested tomato acreage has
declined by 12 percent and Dade County acreage has dropped by nearly 36 percent (Table 13).
Statewide shipments under the tomato marketing order declined by 25 percent during this period,
and shipments from Dade County dropped 19 percent. Despite favorable yields and prices in
1995-96, the F.O.B. value of Dade county's tomato production was far less than it was during the
late 1980s and early 1990s (Table 14).
Snap beans
During the 1995-96 season, estimated total gross sales for bush and pole beans produced
in Dade County were over $41 million. Bush and pole beans were the second most important
traditional vegetable crop in terms of total revenues (Table 12).
Over the past 10 seasons, snap bean acreage in Dade County has been erratic, ranging
from a low of 12,000 acres in 1989-90 to a high of 20,800 acres in the 1992-93 season. Over the
past four years, however, acreage has trended downward, reaching 14,300 acres in the 1995-96
season, the smallest acreage since the 10 year low in 1989-90. Production for the state as a
whole has been variable as well, showing no discernable trends during the past decade (Table 15).
Dade County typically accounts for a substantial portion of the state's total snap bean acreage.
Over the 1986-87 through 1995-96 seasons, Dade County's proportion of the state's snap bean
acreage ranged from over 76 percent in 1992-93 to a low of 54 percent in 1994-95. It amounted
to about 56 percent of the state's total in 1995-96 (Table 15).
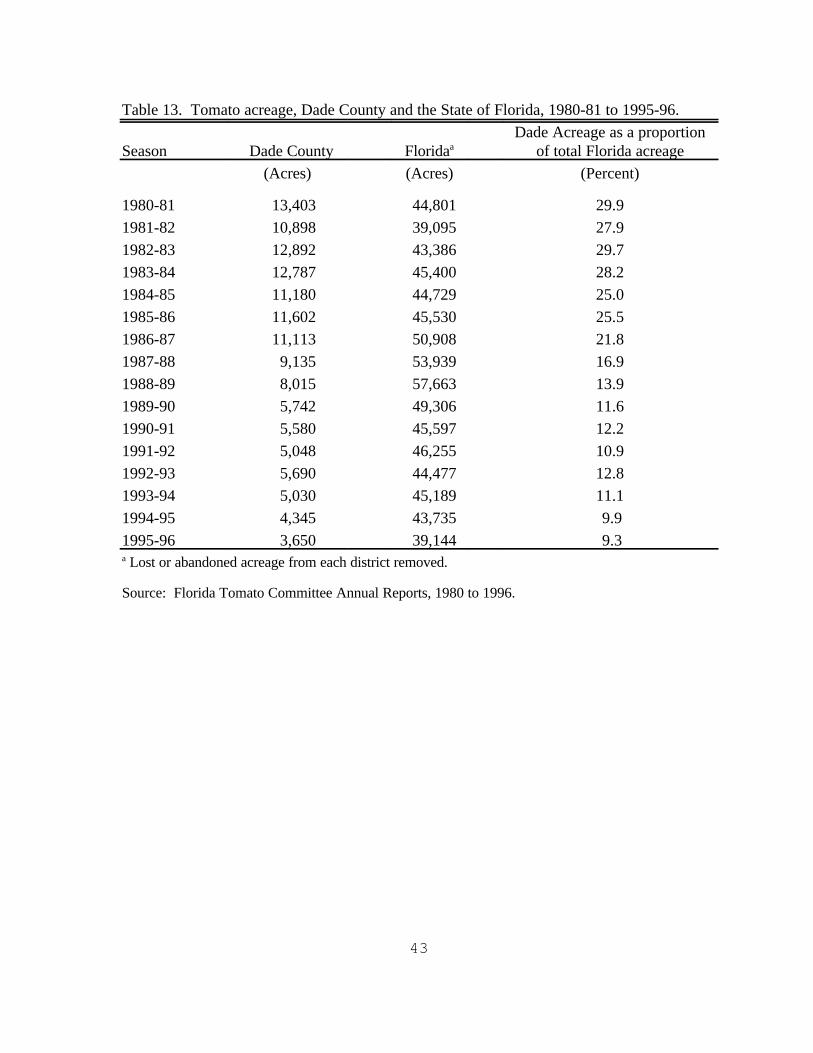
43
Table 13. Tomato acreage, Dade County and the State of Florida, 1980-81 to 1995-96.
Season Dade County FloridaaDade Acreage as a proportion
of total Florida acreage
(Acres) (Acres) (Percent)
1980-81 13,403 44,801 29.9
1981-82 10,898 39,095 27.9
1982-83 12,892 43,386 29.7
1983-84 12,787 45,400 28.2
1984-85 11,180 44,729 25.0
1985-86 11,602 45,530 25.5
1986-87 11,113 50,908 21.8
1987-88 9,135 53,939 16.9
1988-89 8,015 57,663 13.9
1989-90 5,742 49,306 11.6
1990-91 5,580 45,597 12.2
1991-92 5,048 46,255 10.9
1992-93 5,690 44,477 12.8
1993-94 5,030 45,189 11.1
1994-95 4,345 43,735 9.9
1995-96 3,650 39,144 9.3a Lost or abandoned acreage from each district removed.
Source: Florida Tomato Committee Annual Reports, 1980 to 1996.
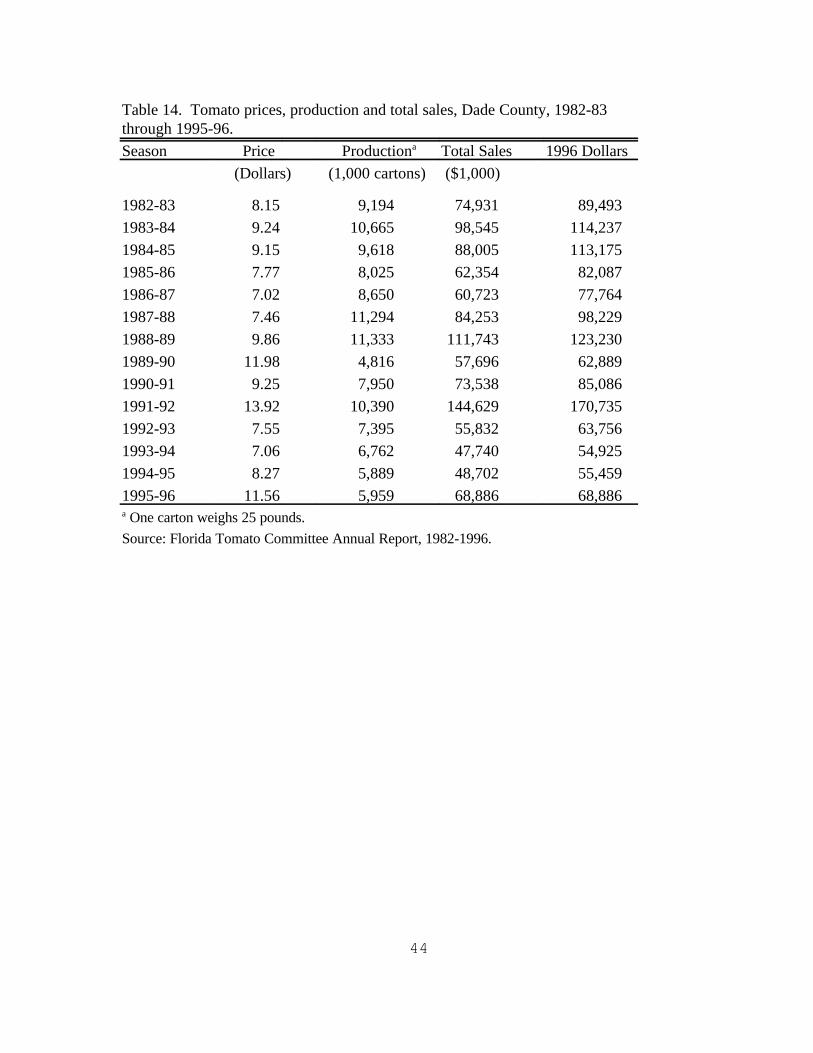
44
Table 14. Tomato prices, production and total sales, Dade County, 1982-83through 1995-96.
Season Price Productiona Total Sales 1996 Dollars
(Dollars) (1,000 cartons) ($1,000)
1982-83 8.15 9,194 74,931 89,493
1983-84 9.24 10,665 98,545 114,237
1984-85 9.15 9,618 88,005 113,175
1985-86 7.77 8,025 62,354 82,087
1986-87 7.02 8,650 60,723 77,764
1987-88 7.46 11,294 84,253 98,229
1988-89 9.86 11,333 111,743 123,230
1989-90 11.98 4,816 57,696 62,889
1990-91 9.25 7,950 73,538 85,086
1991-92 13.92 10,390 144,629 170,735
1992-93 7.55 7,395 55,832 63,756
1993-94 7.06 6,762 47,740 54,925
1994-95 8.27 5,889 48,702 55,459
1995-96 11.56 5,959 68,886 68,886 a One carton weighs 25 pounds.
Source: Florida Tomato Committee Annual Report, 1982-1996.
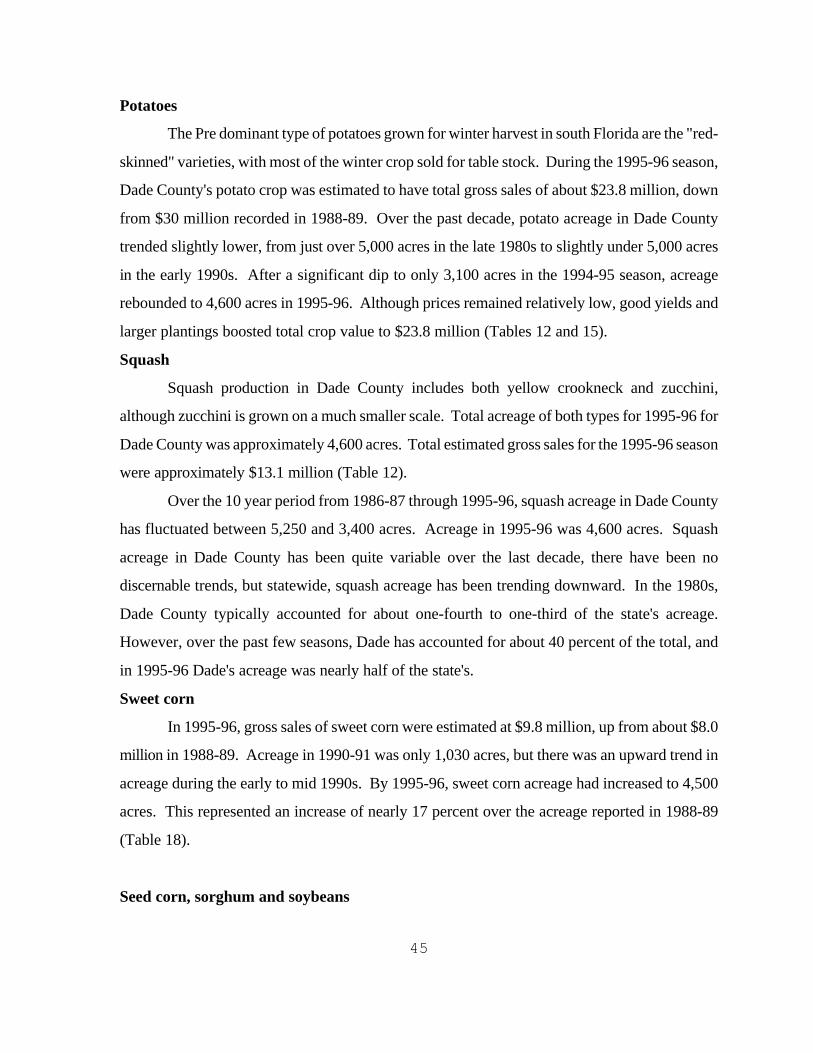
45
Potatoes
The Pre dominant type of potatoes grown for winter harvest in south Florida are the "red-
skinned" varieties, with most of the winter crop sold for table stock. During the 1995-96 season,
Dade County's potato crop was estimated to have total gross sales of about $23.8 million, down
from $30 million recorded in 1988-89. Over the past decade, potato acreage in Dade County
trended slightly lower, from just over 5,000 acres in the late 1980s to slightly under 5,000 acres
in the early 1990s. After a significant dip to only 3,100 acres in the 1994-95 season, acreage
rebounded to 4,600 acres in 1995-96. Although prices remained relatively low, good yields and
larger plantings boosted total crop value to $23.8 million (Tables 12 and 15).
Squash
Squash production in Dade County includes both yellow crookneck and zucchini,
although zucchini is grown on a much smaller scale. Total acreage of both types for 1995-96 for
Dade County was approximately 4,600 acres. Total estimated gross sales for the 1995-96 season
were approximately $13.1 million (Table 12).
Over the 10 year period from 1986-87 through 1995-96, squash acreage in Dade County
has fluctuated between 5,250 and 3,400 acres. Acreage in 1995-96 was 4,600 acres. Squash
acreage in Dade County has been quite variable over the last decade, there have been no
discernable trends, but statewide, squash acreage has been trending downward. In the 1980s,
Dade County typically accounted for about one-fourth to one-third of the state's acreage.
However, over the past few seasons, Dade has accounted for about 40 percent of the total, and
in 1995-96 Dade's acreage was nearly half of the state's.
Sweet corn
In 1995-96, gross sales of sweet corn were estimated at $9.8 million, up from about $8.0
million in 1988-89. Acreage in 1990-91 was only 1,030 acres, but there was an upward trend in
acreage during the early to mid 1990s. By 1995-96, sweet corn acreage had increased to 4,500
acres. This represented an increase of nearly 17 percent over the acreage reported in 1988-89
(Table 18).
Seed corn, sorghum and soybeans
46
Dade County seed production during the 1995-96 crop year was slightly higher than
normal production years, with an estimated combined acreage of 1,320 for corn, sorghum and
soybeans. Seed production acreage in Dade County is extremely variable, depending on growing
conditions in other parts of the U.S. and other countries where seed production occurs. As many
as 50 different companies and research institutions involved in plant breeding and seed production
maintain a presence in Dade County as insurance against unfavorable growing conditions in the
U.S. and abroad. As recently as 1988-89, acreage in Dade County seed corn acreage was 9,000
acres, the result of a severe drought in the mid-west. Most Dade County seed production is used
as foundation stock for breeding purposes rather than for crop production.
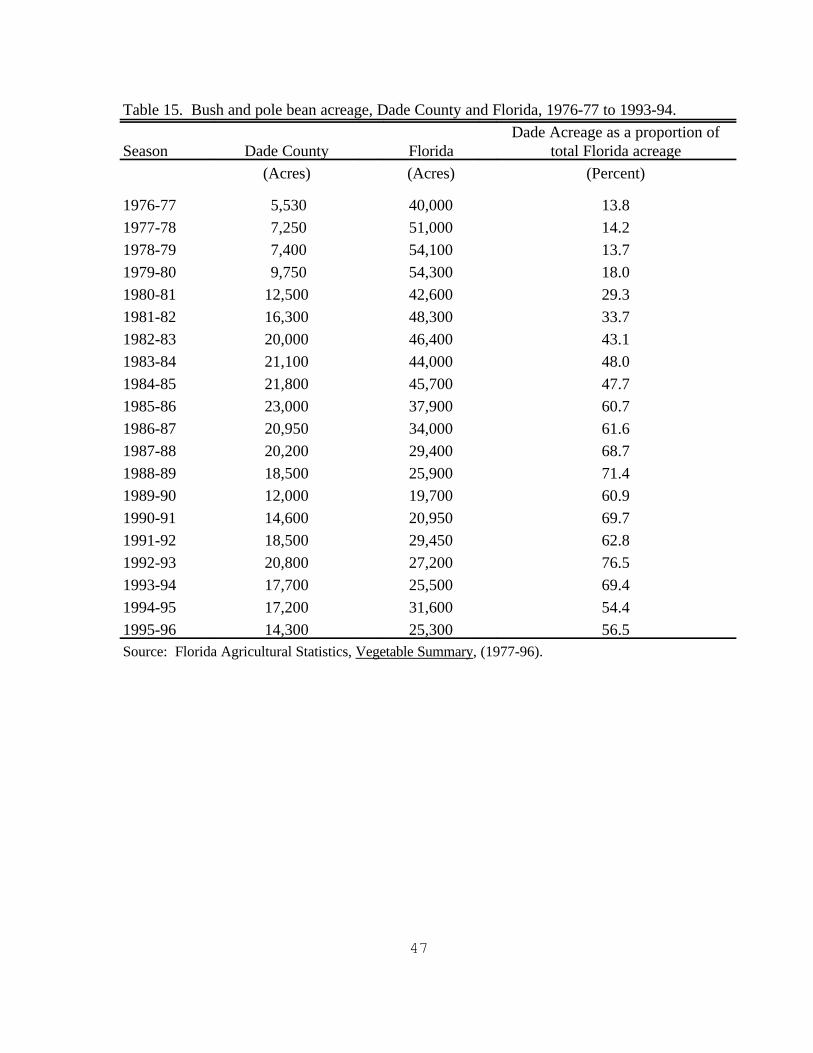
47
Table 15. Bush and pole bean acreage, Dade County and Florida, 1976-77 to 1993-94.
Season Dade County FloridaDade Acreage as a proportion of
total Florida acreage
(Acres) (Acres) (Percent)
1976-77 5,530 40,000 13.8
1977-78 7,250 51,000 14.2
1978-79 7,400 54,100 13.7
1979-80 9,750 54,300 18.0
1980-81 12,500 42,600 29.3
1981-82 16,300 48,300 33.7
1982-83 20,000 46,400 43.1
1983-84 21,100 44,000 48.0
1984-85 21,800 45,700 47.7
1985-86 23,000 37,900 60.7
1986-87 20,950 34,000 61.6
1987-88 20,200 29,400 68.7
1988-89 18,500 25,900 71.4
1989-90 12,000 19,700 60.9
1990-91 14,600 20,950 69.7
1991-92 18,500 29,450 62.8
1992-93 20,800 27,200 76.5
1993-94 17,700 25,500 69.4
1994-95 17,200 31,600 54.4
1995-96 14,300 25,300 56.5Source: Florida Agricultural Statistics, Vegetable Summary, (1977-96).
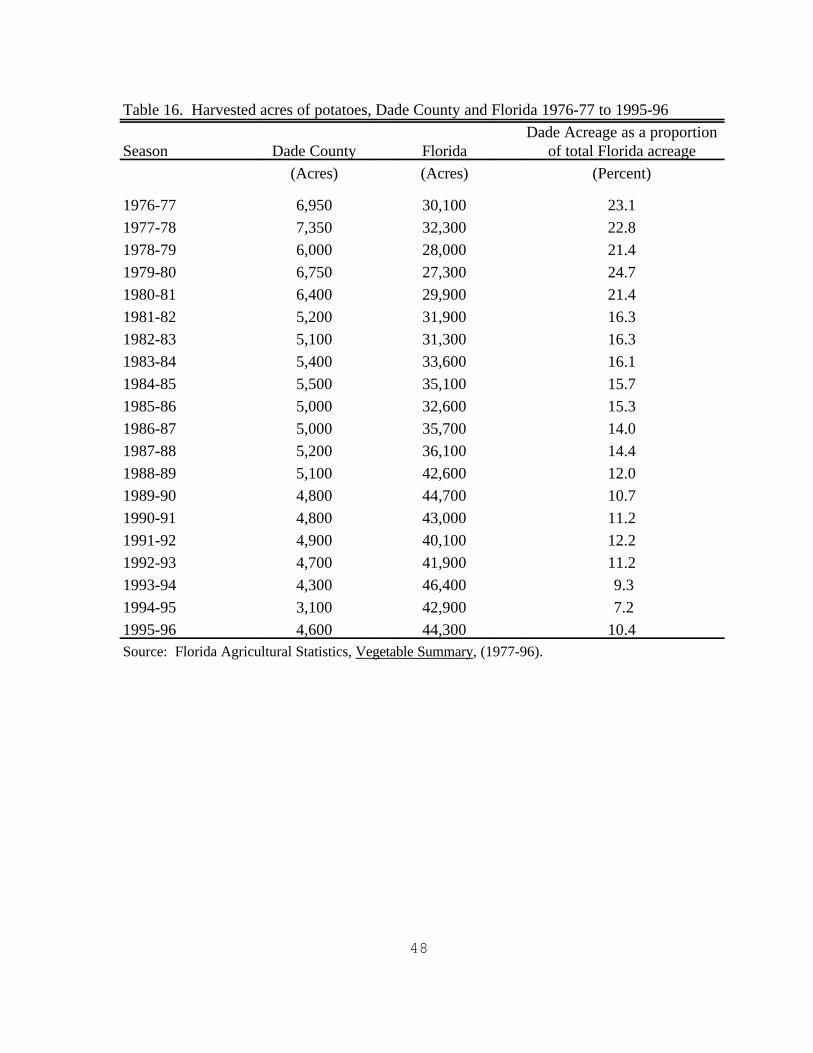
48
Table 16. Harvested acres of potatoes, Dade County and Florida 1976-77 to 1995-96
Season Dade County FloridaDade Acreage as a proportion
of total Florida acreage
(Acres) (Acres) (Percent)
1976-77 6,950 30,100 23.1
1977-78 7,350 32,300 22.8
1978-79 6,000 28,000 21.4
1979-80 6,750 27,300 24.7
1980-81 6,400 29,900 21.4
1981-82 5,200 31,900 16.3
1982-83 5,100 31,300 16.3
1983-84 5,400 33,600 16.1
1984-85 5,500 35,100 15.7
1985-86 5,000 32,600 15.3
1986-87 5,000 35,700 14.0
1987-88 5,200 36,100 14.4
1988-89 5,100 42,600 12.0
1989-90 4,800 44,700 10.7
1990-91 4,800 43,000 11.2
1991-92 4,900 40,100 12.2
1992-93 4,700 41,900 11.2
1993-94 4,300 46,400 9.3
1994-95 3,100 42,900 7.2
1995-96 4,600 44,300 10.4Source: Florida Agricultural Statistics, Vegetable Summary, (1977-96).
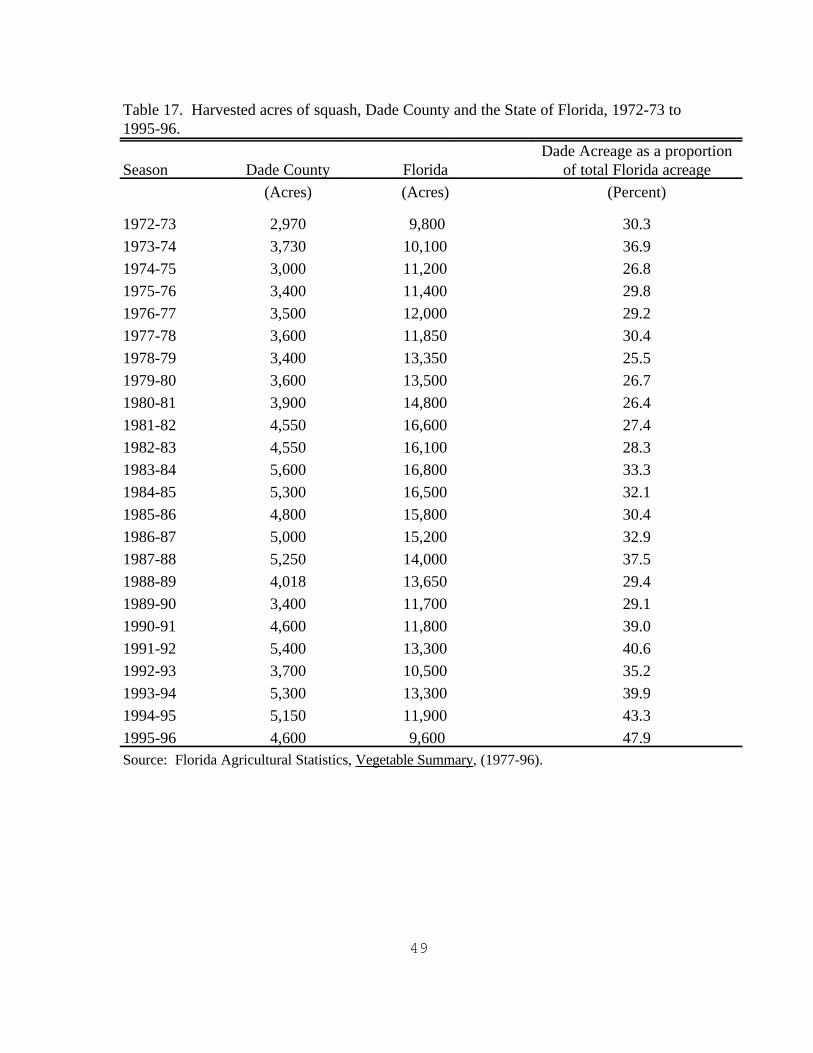
49
Table 17. Harvested acres of squash, Dade County and the State of Florida, 1972-73 to1995-96.
Season Dade County FloridaDade Acreage as a proportion
of total Florida acreage
(Acres) (Acres) (Percent)
1972-73 2,970 9,800 30.3
1973-74 3,730 10,100 36.9
1974-75 3,000 11,200 26.8
1975-76 3,400 11,400 29.8
1976-77 3,500 12,000 29.2
1977-78 3,600 11,850 30.4
1978-79 3,400 13,350 25.5
1979-80 3,600 13,500 26.7
1980-81 3,900 14,800 26.4
1981-82 4,550 16,600 27.4
1982-83 4,550 16,100 28.3
1983-84 5,600 16,800 33.3
1984-85 5,300 16,500 32.1
1985-86 4,800 15,800 30.4
1986-87 5,000 15,200 32.9
1987-88 5,250 14,000 37.5
1988-89 4,018 13,650 29.4
1989-90 3,400 11,700 29.1
1990-91 4,600 11,800 39.0
1991-92 5,400 13,300 40.6
1992-93 3,700 10,500 35.2
1993-94 5,300 13,300 39.9
1994-95 5,150 11,900 43.3
1995-96 4,600 9,600 47.9Source: Florida Agricultural Statistics, Vegetable Summary, (1977-96).
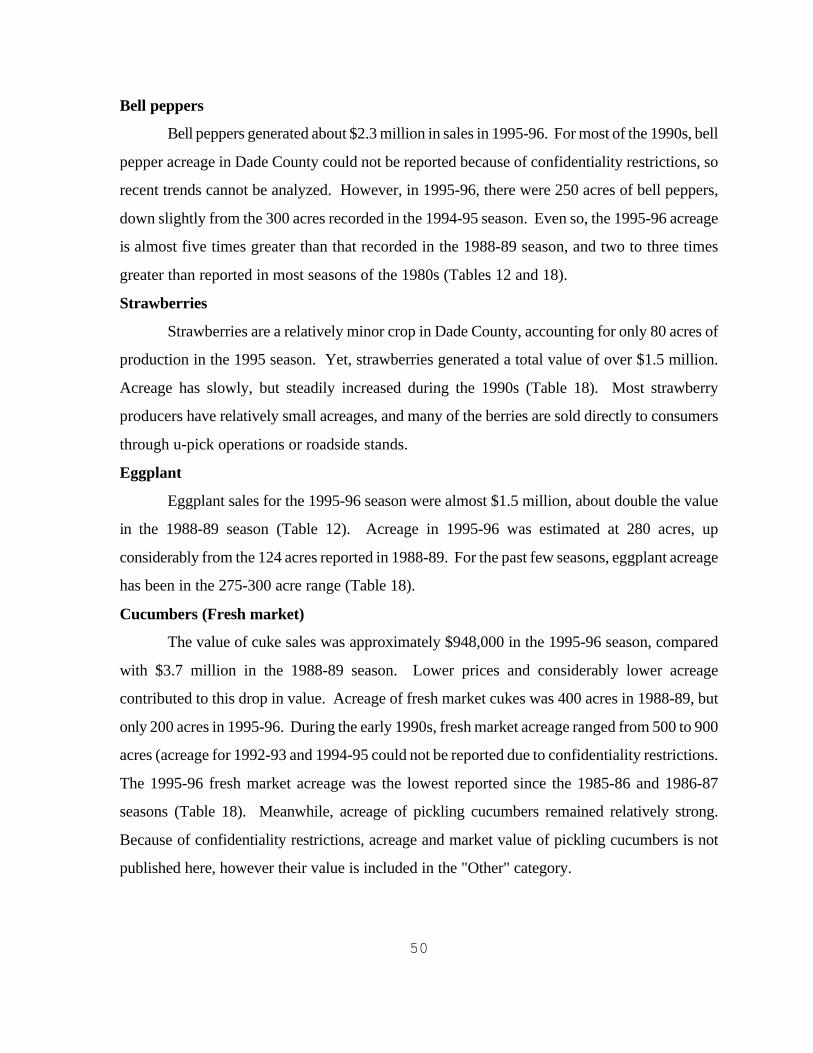
50
Bell peppers
Bell peppers generated about $2.3 million in sales in 1995-96. For most of the 1990s, bell
pepper acreage in Dade County could not be reported because of confidentiality restrictions, so
recent trends cannot be analyzed. However, in 1995-96, there were 250 acres of bell peppers,
down slightly from the 300 acres recorded in the 1994-95 season. Even so, the 1995-96 acreage
is almost five times greater than that recorded in the 1988-89 season, and two to three times
greater than reported in most seasons of the 1980s (Tables 12 and 18).
Strawberries
Strawberries are a relatively minor crop in Dade County, accounting for only 80 acres of
production in the 1995 season. Yet, strawberries generated a total value of over $1.5 million.
Acreage has slowly, but steadily increased during the 1990s (Table 18). Most strawberry
producers have relatively small acreages, and many of the berries are sold directly to consumers
through u-pick operations or roadside stands.
Eggplant
Eggplant sales for the 1995-96 season were almost $1.5 million, about double the value
in the 1988-89 season (Table 12). Acreage in 1995-96 was estimated at 280 acres, up
considerably from the 124 acres reported in 1988-89. For the past few seasons, eggplant acreage
has been in the 275-300 acre range (Table 18).
Cucumbers (Fresh market)
The value of cuke sales was approximately $948,000 in the 1995-96 season, compared
with $3.7 million in the 1988-89 season. Lower prices and considerably lower acreage
contributed to this drop in value. Acreage of fresh market cukes was 400 acres in 1988-89, but
only 200 acres in 1995-96. During the early 1990s, fresh market acreage ranged from 500 to 900
acres (acreage for 1992-93 and 1994-95 could not be reported due to confidentiality restrictions.
The 1995-96 fresh market acreage was the lowest reported since the 1985-86 and 1986-87
seasons (Table 18). Meanwhile, acreage of pickling cucumbers remained relatively strong.
Because of confidentiality restrictions, acreage and market value of pickling cucumbers is not
published here, however their value is included in the "Other" category.
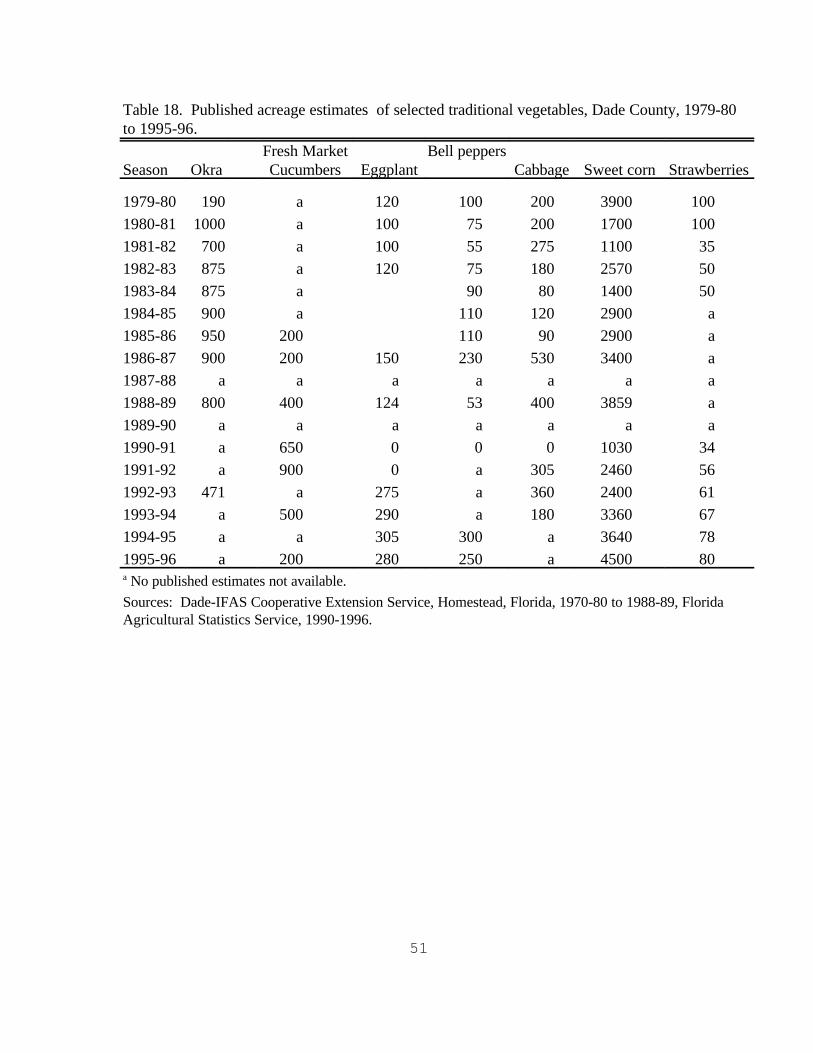
51
Table 18. Published acreage estimates of selected traditional vegetables, Dade County, 1979-80to 1995-96.
Season OkraFresh MarketCucumbers Eggplant
Bell peppersCabbage Sweet corn Strawberries
1979-80 190 a 120 100 200 3900 100
1980-81 1000 a 100 75 200 1700 100
1981-82 700 a 100 55 275 1100 35
1982-83 875 a 120 75 180 2570 50
1983-84 875 a 90 80 1400 50
1984-85 900 a 110 120 2900 a
1985-86 950 200 110 90 2900 a
1986-87 900 200 150 230 530 3400 a
1987-88 a a a a a a a
1988-89 800 400 124 53 400 3859 a
1989-90 a a a a a a a
1990-91 a 650 0 0 0 1030 34
1991-92 a 900 0 a 305 2460 56
1992-93 471 a 275 a 360 2400 61
1993-94 a 500 290 a 180 3360 67
1994-95 a a 305 300 a 3640 78
1995-96 a 200 280 250 a 4500 80a No published estimates not available.
Sources: Dade-IFAS Cooperative Extension Service, Homestead, Florida, 1970-80 to 1988-89, FloridaAgricultural Statistics Service, 1990-1996.
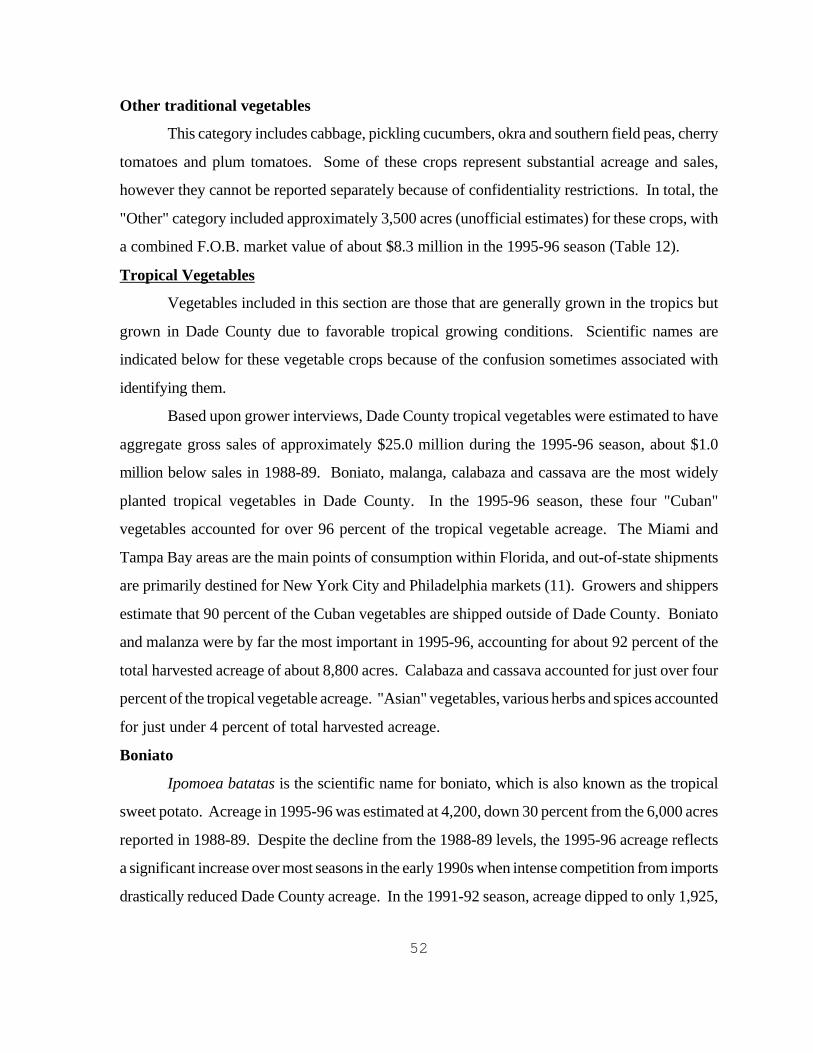
52
Other traditional vegetables
This category includes cabbage, pickling cucumbers, okra and southern field peas, cherry
tomatoes and plum tomatoes. Some of these crops represent substantial acreage and sales,
however they cannot be reported separately because of confidentiality restrictions. In total, the
"Other" category included approximately 3,500 acres (unofficial estimates) for these crops, with
a combined F.O.B. market value of about $8.3 million in the 1995-96 season (Table 12).
Tropical Vegetables
Vegetables included in this section are those that are generally grown in the tropics but
grown in Dade County due to favorable tropical growing conditions. Scientific names are
indicated below for these vegetable crops because of the confusion sometimes associated with
identifying them.
Based upon grower interviews, Dade County tropical vegetables were estimated to have
aggregate gross sales of approximately $25.0 million during the 1995-96 season, about $1.0
million below sales in 1988-89. Boniato, malanga, calabaza and cassava are the most widely
planted tropical vegetables in Dade County. In the 1995-96 season, these four "Cuban"
vegetables accounted for over 96 percent of the tropical vegetable acreage. The Miami and
Tampa Bay areas are the main points of consumption within Florida, and out-of-state shipments
are primarily destined for New York City and Philadelphia markets (11). Growers and shippers
estimate that 90 percent of the Cuban vegetables are shipped outside of Dade County. Boniato
and malanza were by far the most important in 1995-96, accounting for about 92 percent of the
total harvested acreage of about 8,800 acres. Calabaza and cassava accounted for just over four
percent of the tropical vegetable acreage. "Asian" vegetables, various herbs and spices accounted
for just under 4 percent of total harvested acreage.
Boniato
Ipomoea batatas is the scientific name for boniato, which is also known as the tropical
sweet potato. Acreage in 1995-96 was estimated at 4,200, down 30 percent from the 6,000 acres
reported in 1988-89. Despite the decline from the 1988-89 levels, the 1995-96 acreage reflects
a significant increase over most seasons in the early 1990s when intense competition from imports
drastically reduced Dade County acreage. In the 1991-92 season, acreage dipped to only 1,925,
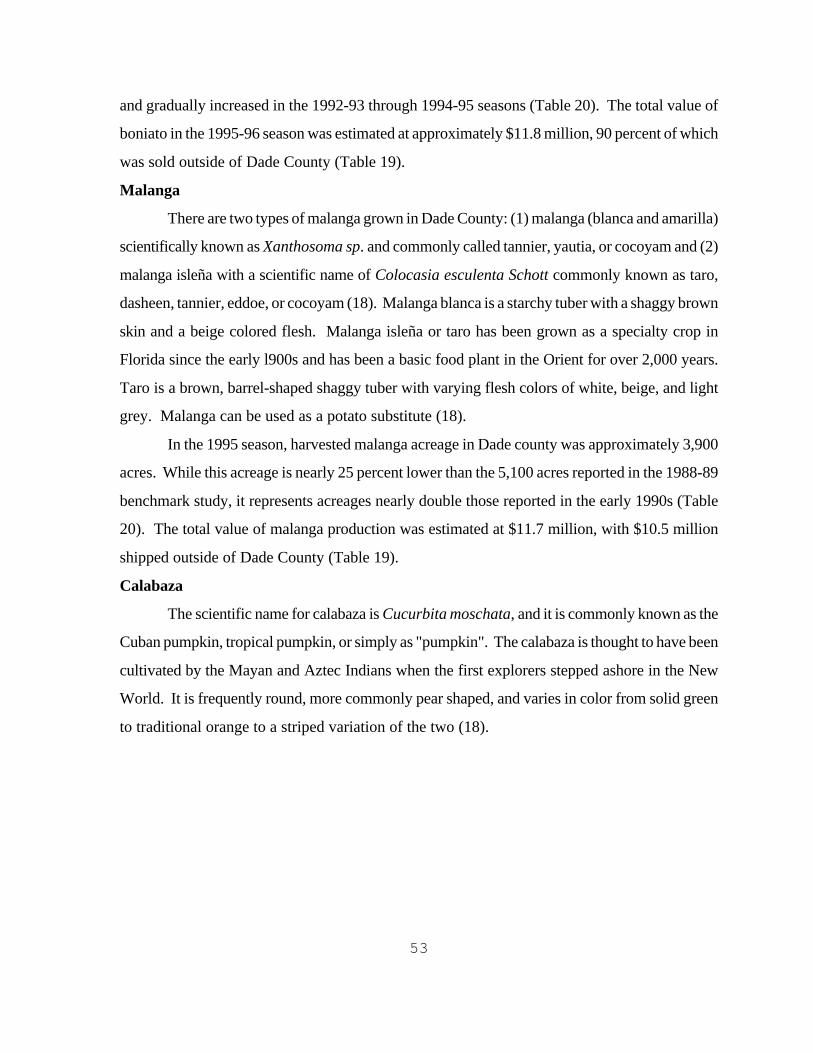
53
and gradually increased in the 1992-93 through 1994-95 seasons (Table 20). The total value of
boniato in the 1995-96 season was estimated at approximately $11.8 million, 90 percent of which
was sold outside of Dade County (Table 19).
Malanga
There are two types of malanga grown in Dade County: (1) malanga (blanca and amarilla)
scientifically known as Xanthosoma sp. and commonly called tannier, yautia, or cocoyam and (2)
malanga isleña with a scientific name of Colocasia esculenta Schott commonly known as taro,
dasheen, tannier, eddoe, or cocoyam (18). Malanga blanca is a starchy tuber with a shaggy brown
skin and a beige colored flesh. Malanga isleña or taro has been grown as a specialty crop in
Florida since the early l900s and has been a basic food plant in the Orient for over 2,000 years.
Taro is a brown, barrel-shaped shaggy tuber with varying flesh colors of white, beige, and light
grey. Malanga can be used as a potato substitute (18).
In the 1995 season, harvested malanga acreage in Dade county was approximately 3,900
acres. While this acreage is nearly 25 percent lower than the 5,100 acres reported in the 1988-89
benchmark study, it represents acreages nearly double those reported in the early 1990s (Table
20). The total value of malanga production was estimated at $11.7 million, with $10.5 million
shipped outside of Dade County (Table 19).
Calabaza
The scientific name for calabaza is Cucurbita moschata, and it is commonly known as the
Cuban pumpkin, tropical pumpkin, or simply as "pumpkin". The calabaza is thought to have been
cultivated by the Mayan and Aztec Indians when the first explorers stepped ashore in the New
World. It is frequently round, more commonly pear shaped, and varies in color from solid green
to traditional orange to a striped variation of the two (18).
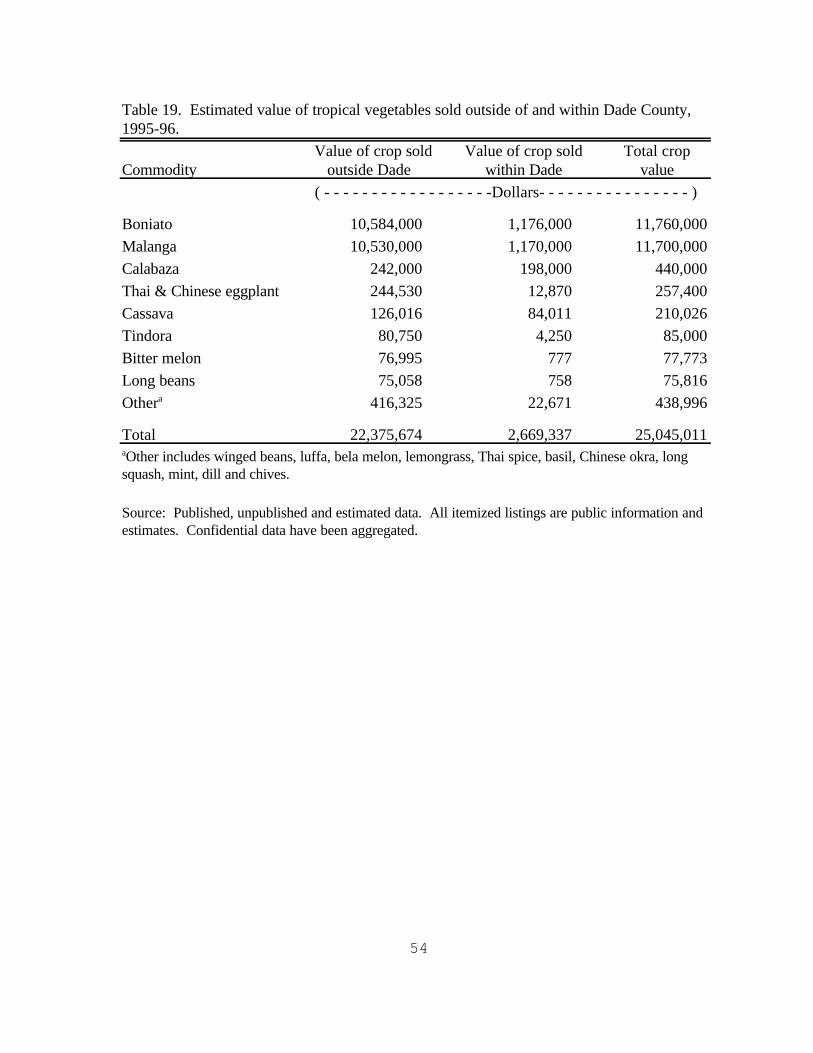
54
Table 19. Estimated value of tropical vegetables sold outside of and within Dade County,1995-96.
Commodity Value of crop sold
outside DadeValue of crop sold
within DadeTotal crop
value
( - - - - - - - - - - - - - - - - - -Dollars- - - - - - - - - - - - - - - - )
Boniato 10,584,000 1,176,000 11,760,000
Malanga 10,530,000 1,170,000 11,700,000
Calabaza 242,000 198,000 440,000
Thai & Chinese eggplant 244,530 12,870 257,400
Cassava 126,016 84,011 210,026
Tindora 80,750 4,250 85,000
Bitter melon 76,995 777 77,773
Long beans 75,058 758 75,816
Othera 416,325 22,671 438,996
Total 22,375,674 2,669,337 25,045,011aOther includes winged beans, luffa, bela melon, lemongrass, Thai spice, basil, Chinese okra, longsquash, mint, dill and chives.
Source: Published, unpublished and estimated data. All itemized listings are public information andestimates. Confidential data have been aggregated.
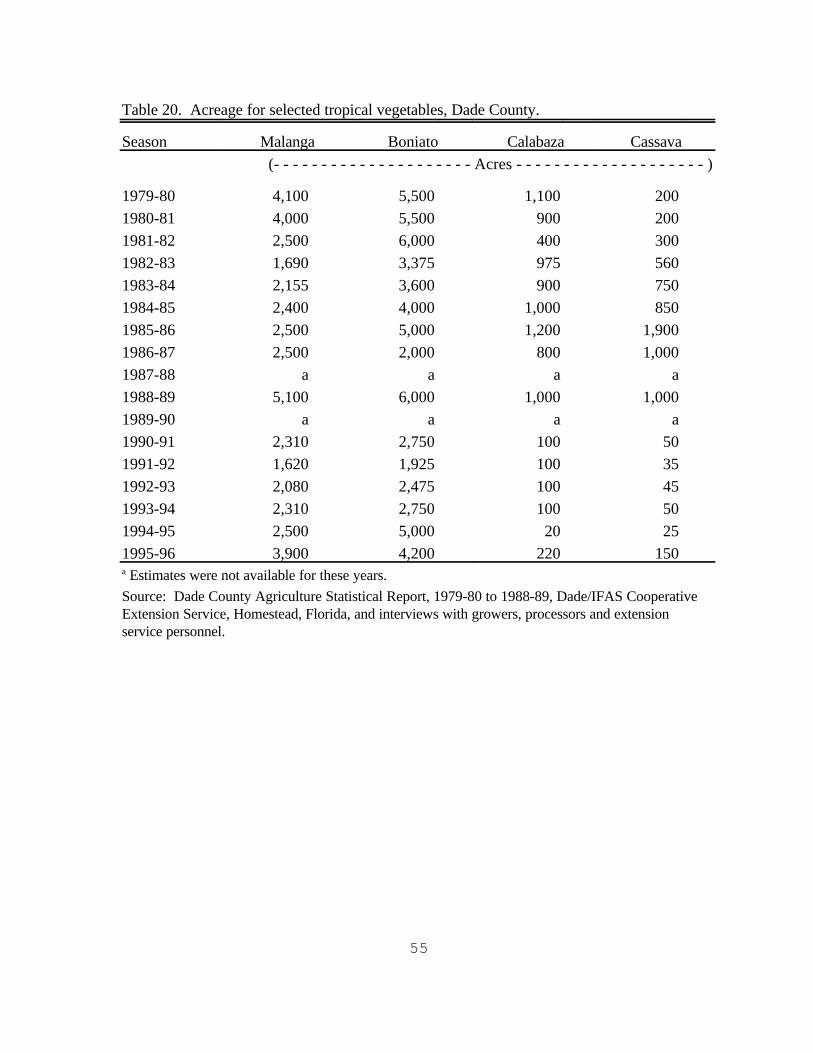
55
Table 20. Acreage for selected tropical vegetables, Dade County.
Season Malanga Boniato Calabaza Cassava
(- - - - - - - - - - - - - - - - - - - - - Acres - - - - - - - - - - - - - - - - - - - - )
1979-80 4,100 5,500 1,100 200
1980-81 4,000 5,500 900 200
1981-82 2,500 6,000 400 300
1982-83 1,690 3,375 975 560
1983-84 2,155 3,600 900 750
1984-85 2,400 4,000 1,000 850
1985-86 2,500 5,000 1,200 1,900
1986-87 2,500 2,000 800 1,000
1987-88 a a a a
1988-89 5,100 6,000 1,000 1,000
1989-90 a a a a
1990-91 2,310 2,750 100 50
1991-92 1,620 1,925 100 35
1992-93 2,080 2,475 100 45
1993-94 2,310 2,750 100 50
1994-95 2,500 5,000 20 25
1995-96 3,900 4,200 220 150a Estimates were not available for these years.
Source: Dade County Agriculture Statistical Report, 1979-80 to 1988-89, Dade/IFAS CooperativeExtension Service, Homestead, Florida, and interviews with growers, processors and extensionservice personnel.
56
Acreage of calabaza in 1995-96 was estimated by growers at 220 acres, down from 1,000
in 1988-89. As with boniato and malanga, calabaza acreage has suffered major reductions
because of import competition. Through most of early 1990s calabaza production was only 100
acres per season (Table 20). Although acreage rebounded in the 1995-96 season, it is too early
to tell if further increases will follow. The calabaza sales were estimated at $440,000 for 1995-
96, compared with $2 million in 1988-89. Slightly over half, 55 percent, was estimated to have
been shipped outside of Dade County (Table 19).
Cassava
Manihot esculanta is the scientific name for cassava or yuca. Cassava is a bark covered
root vegetable with a white flesh and is grown only in tropical climates. Its foliage forms a green
lacy canopy about six feet over its roots. Its high starch content makes it useful as a thickener
and it is also the source of tapioca. The outer bark and underskin of the root must be peeled
before using . In addition to the root, the cassava foliage is consumed as a legume in some Third
World countries where cassava is a food staple (18).
Cassava production in Dade County has followed the same general patterns as boniato,
malanga and calabaza: from peak acreage in the late 1980s, acreage plummeted in the early 1990s
due to import competition. In 1988-89, cassava acreage was estimated at 1,000 and the value
of production was approximately $1.4 million. However, in the 1990-91 season acreage dropped
to 50 acres, and by 1994-95 only 25 acres of cassava were grown in Dade County. In 1995-96,
acreage rebounded to an estimated 150 acres, with a value of about $210,000 (Tables 19 and 20).
Other specialty vegetables
In addition to the four "Cuban" vegetables discussed above, there are at least 16 other
specialty vegetables, herbs and spices grown in Dade County. Of these, only Thai and Chinese
eggplant, tindora, bitter melon and long beans are reported separately because of confidentiality
restrictions. Winged beans, luffa, bela melon, lemongrass, Thai spice, basil, Chinese okra, long
squash, mint, dill and chives are all included in the "other" category to avoid disclosure of
confidential data.
These specialty vegetables are grown on a much smaller scale than the tropical vegetables
57
listed above and are destined primarily for New York and Chicago but some are also shipped to
other major U.S. cities. Grower acreage of any one crop is usually quite small. It is estimated
that 90 to nearly 100 percent of these vegetables are shipped out of Dade County.
Thai and Chinese eggplant.--These eggplant are similar to the varieties normally
available in the supermarket but differ in size and shape. Thai eggplant (Solanum macrocarpon)
is quite small and round while Chinese eggplant (Solanum melongena) is long and cylindrical and
is purplish in coloration. Thai eggplant is purple, white, green, or white with green netting (18).
Acreage of Thai and Chinese eggplant increased from an estimated 44 acres in 1988-89
to 60 acres in 1995-96. The total value of production was approximately $145,000 in 1988-89,
but over $257,000 in 1995-96 (Table 19).
Tindora.--Tindora (Coccinia cordifolia) looks like a tiny cucumber but is grown as a
perennial vine, like grapes. It is planted in February and harvested from May through October.
Yields average about 8,500 pounds per acre. Approximately 95 percent of production is shipped
out of Dade County to major metropolitan areas, particularly New York and Chicago. During
the 1988-89 season tindora gross sales for the county totaled an estimated $59,500. Total sales
increased to about $85,000 in 1995-96, and about 95 percent was shipped out of Dade County
(Table 19). From 1988-89 to 1995-96, acreage increased from about 7 acres to 10.
Bitter melon.--There are several varieties of bitter melon; the one grown in Dade County
(Momordica charantia) is a mild, Indian variety with a smooth exterior. These are shaped like
a long, slightly curved zucchini; some varieties are much more bitter than others. Bitter melon
can be grown on a trellis or can be left to crawl along the ground (18). Yields are generally about
3,000 pounds per acre, but they were slightly lower in 1995-96. There were an estimated 18
harvested acres of bitter melon in the county during 1988-89 and 40 acres in 1995-96. For the
1995-96 season, gross sales of bitter melon for the county were estimated at approximately
$78,000, up from $40,000 in 1988-89 (Table 19).
Long beans. --Long beans, Vigna unguiculata subsp. sesquipedalis, are also referred to
as yardlong beans or asparagus beans. These are similar to black-eyed peas in taste, cuisine
preparation, and appearance except that they grow to be two to three feet in length, hence the
name yardlong beans. There are two types of long beans, pole long beans and bush long beans;
58
the former requires support by trellis or fence (18). About 90 percent of production is shipped
to major out-of-state markets such as New Orleans, New York, and Chicago.
During 1988-89, there were 54 acres of long beans grown in Dade county, but acreage
dropped to about 25 acres in 1995-96. Yields also decreased, from 4,200 pounds per acre to
3,800 pounds while the price remained the same. As a result, the value of production declined
from about $181,000 in 1988-89 to approximately $76,000 in 1995-96 (Table 19).
Other specialty vegetable crops.--The "other" category includes winged beans, luffa,
bela melon, lemongrass, Thai spice, basil, Chinese okra, long squash, mint, dill and chives.
Inclusion in this category does not mean they are inconsequential, because some acreages are
relatively large; they are included here because of confidentiality restrictions.
Total acreage in the other category was estimated at 202 acres in 1995-96, and the value
of production was about $439,000 (Table 19). Approximately 95 percent of the production was
shipped to destinations outside Dade County.
Tropical Fruit
Dade County's climate encourages tropical fruit experimentation and production. As a
result, over 35 different tropical fruits are grown in the county, 20 on a commercial scale. Total
tropical fruit acreage in 1996 was estimated at 13,291 acres, about 6,800 acres less than reported
for the 1990 economic impact study (Table 21). Hurricane Andrew was the major factor
responsible for this drastic acreage loss. Although recent tree censuses have shown steady
increases in acreage of most major tropical fruits the rate of increase has been relatively slow.
Competitive pressures from Mexico, particularly from limes and mangos, have adversely affected
replanting of these crops.
In addition to the very large total losses in fruit crop acreages caused by Hurricane
Andrew, lingering effects of the storm continued to affect productivity of many tree crops during
the 1995-96 season. Many avocado and mango trees were blown over, requiring resetting.
Severe pruning was also required on reset trees and on those with significant damage to major
branches and limbs. These "hat-racked" trees had not regained full productivity by 1995-96. This
reduced productivity resulted in a 25 percent drop in the total value of production compared with
the 1988-89 season, the focus of the previous economic impact study. Total fruit crop sales
59
declined from $74 million in 1988-89 to $56.1 million in 1995-96 (Figure 3).
In terms of acreage, avocados, Persian (Tahiti) limes, mangos, carambola, lychee, papaya,
longan, mamey sapote, specialty banana (including plantain) and guava are the most important,
accounting for 98 percent of total acreage in 1996 (Table 21). Acreage trends and estimates of
the value of production of these and other imported tropical fruit crops appear below.
Avocados
Avocados have been cultivated in tropical America since pre-Columbian times; they
arrived in Florida in 1833 (16). Currently, there are 58 varieties of avocados grown and marketed
commercially in Florida (12). In 1996, Dade County had 6,305 acres of avocados, nearly 90
percent of the state's total (8). Within Dade County, avocados constitute slightly over 47 percent
of the total tropical fruit acreage (Table 21).
Examination of long-term acreage trends for avocados in Dade County shows rapid
expansion in the late 1970s and early 1980s when acreage increased from nearly 7,300 acres in
1976 to nearly 11,000 acres in 1984 (Table 22, Figure 12). After several years of modest
declines, avocado acreage was approximately 9,000 acres in 1990. The tropical fruit census in
March, 1993 showed that avocado acreage had dropped to less than 6,000 in the aftermath of
Hurricane Andrew. The 1996 census confirmed a modest rebound in avocado acreage.
Nevertheless, 1996 avocado acreage was still about 2,700 acres (nearly 30 percent) below that
reported in the 1990 economic impact study (18). Despite the reduced acreage, recovering yields
and reasonably good prices resulted in a total avocado crop value (F.O.B. basis) of about $15.5
million in 1995-96, of which an estimated 95 percent ($15.2 million) was sold outside Dade
County (Table 23).
60
Figure 12. Dade County acreage of avocados, Persian limes and mangos, 1976-1996.
61
Persian (Tahiti) Limes
Persian limes, as differentiated from key limes or Spanish limes, have long been one of the
leading tropical fruit crops in Dade County. Throughout the following discussions "limes" will
refer to Persian (also called "Tahiti") limes. Long term trends for lime production in Dade County
tend to parallel those for avocados. Lime acreage generally increased in the late 1970s and early
1980s, reaching a peak in 1982 with 6,783 acres (Table 22, Figure 11). From 1982 to 1990,
acreage gradually declined by about 700 acres. However, limes were particularly hard hit by
Hurricane Andrew, and the March 1993 tropical fruit census indicated that only 1,668 acres of
limes remained (15). Subsequent acreage estimates show that limes have rebounded to nearly
2,800 acres. Even so, this is 3,279 acres (54 percent) below the 1990 acreage (Table 21).
Despite the lower figure, limes still constitute 21 percent of all tropical fruit crop acreage in Dade
County and just over 88 percent of the state's lime acreage.
During the 1995-96 season, Dade County's lime production was still very limited because
of the effects of Hurricane Andrew. Reduced total acreage and limited production from trees set
after the storm resulted in a total crop that was only about 20 percent as large as that recorded
prior to Andrew. As a result, the total F.O.B. value of lime production in Dade County was only
$4.48 million, of which approximately $4.3 million was shipped to markets outside Dade County
(Table 23).
Mangos
For several decades, mangos have been one of Dade County's most important tropical
fruit crops, consistently ranking third in acreage and value of production behind avocados and
limes. Mangos currently comprise about 11 percent of the tropical fruit acreage in Dade County,
maintaining its relative importance despite the losses caused by Hurricane Andrew (Table 21).
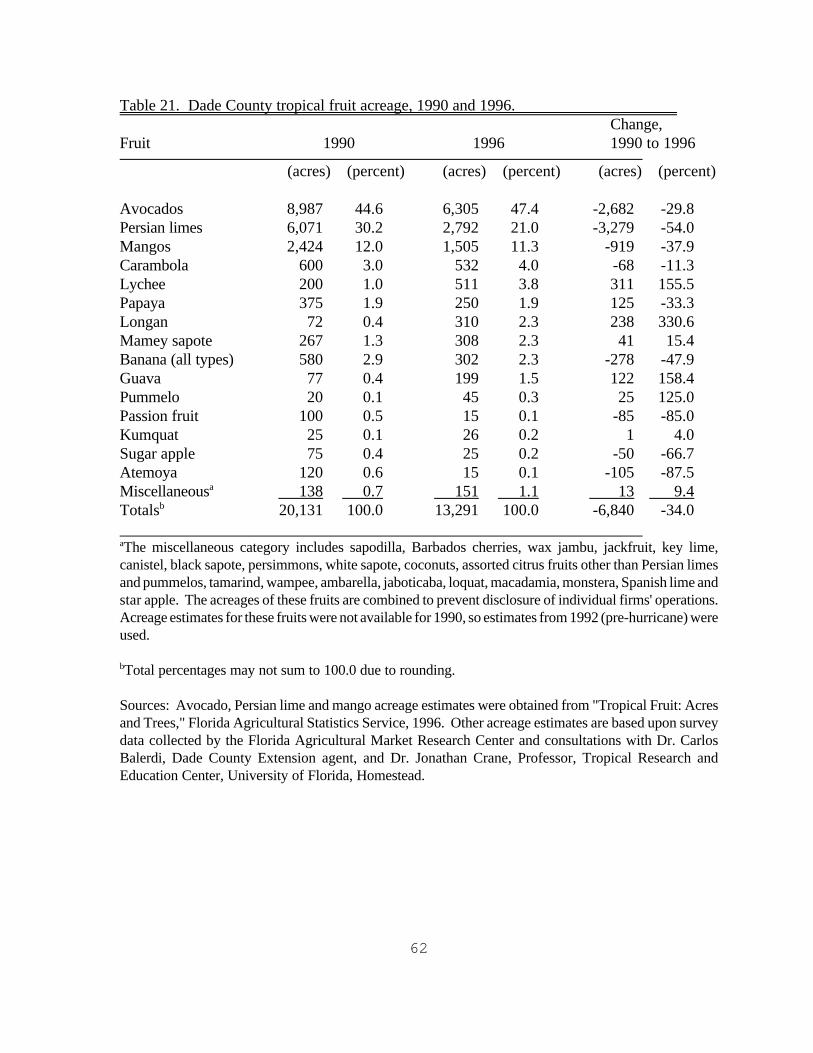
62
Table 21. Dade County tropical fruit acreage, 1990 and 1996. Change,
Fruit 1990 1996 1990 to 1996
(acres) (percent) (acres) (percent) (acres) (percent)
Avocados 8,987 44.6 6,305 47.4 -2,682 -29.8Persian limes 6,071 30.2 2,792 21.0 -3,279 -54.0Mangos 2,424 12.0 1,505 11.3 -919 -37.9Carambola 600 3.0 532 4.0 -68 -11.3Lychee 200 1.0 511 3.8 311 155.5Papaya 375 1.9 250 1.9 125 -33.3Longan 72 0.4 310 2.3 238 330.6Mamey sapote 267 1.3 308 2.3 41 15.4Banana (all types) 580 2.9 302 2.3 -278 -47.9Guava 77 0.4 199 1.5 122 158.4Pummelo 20 0.1 45 0.3 25 125.0Passion fruit 100 0.5 15 0.1 -85 -85.0Kumquat 25 0.1 26 0.2 1 4.0Sugar apple 75 0.4 25 0.2 -50 -66.7Atemoya 120 0.6 15 0.1 -105 -87.5Miscellaneousa 138 0.7 151 1.1 13 9.4Totalsb 20,131 100.0 13,291 100.0 -6,840 -34.0 aThe miscellaneous category includes sapodilla, Barbados cherries, wax jambu, jackfruit, key lime,canistel, black sapote, persimmons, white sapote, coconuts, assorted citrus fruits other than Persian limesand pummelos, tamarind, wampee, ambarella, jaboticaba, loquat, macadamia, monstera, Spanish lime andstar apple. The acreages of these fruits are combined to prevent disclosure of individual firms' operations.Acreage estimates for these fruits were not available for 1990, so estimates from 1992 (pre-hurricane) wereused.
bTotal percentages may not sum to 100.0 due to rounding.
Sources: Avocado, Persian lime and mango acreage estimates were obtained from "Tropical Fruit: Acresand Trees," Florida Agricultural Statistics Service, 1996. Other acreage estimates are based upon surveydata collected by the Florida Agricultural Market Research Center and consultations with Dr. CarlosBalerdi, Dade County Extension agent, and Dr. Jonathan Crane, Professor, Tropical Research andEducation Center, University of Florida, Homestead.
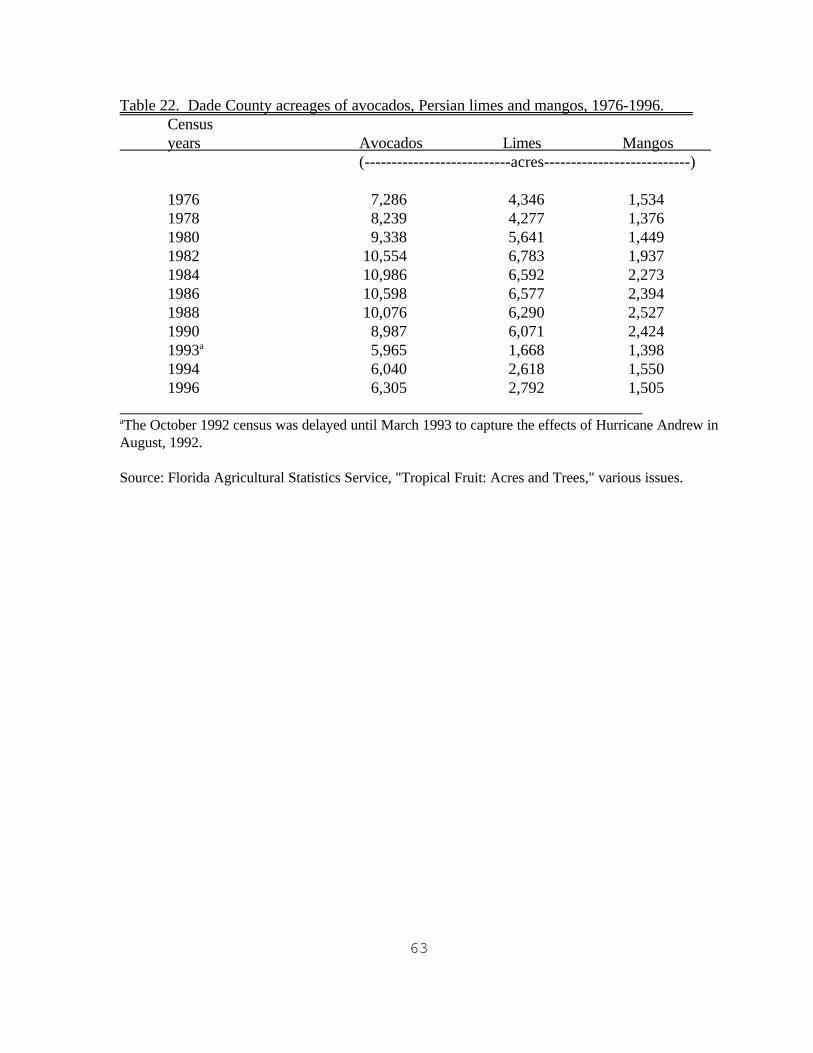
63
Table 22. Dade County acreages of avocados, Persian limes and mangos, 1976-1996. Censusyears Avocados Limes Mangos
(---------------------------acres---------------------------)
1976 7,286 4,346 1,5341978 8,239 4,277 1,3761980 9,338 5,641 1,4491982 10,554 6,783 1,9371984 10,986 6,592 2,2731986 10,598 6,577 2,3941988 10,076 6,290 2,5271990 8,987 6,071 2,4241993a 5,965 1,668 1,3981994 6,040 2,618 1,5501996 6,305 2,792 1,505
aThe October 1992 census was delayed until March 1993 to capture the effects of Hurricane Andrew inAugust, 1992.
Source: Florida Agricultural Statistics Service, "Tropical Fruit: Acres and Trees," various issues.
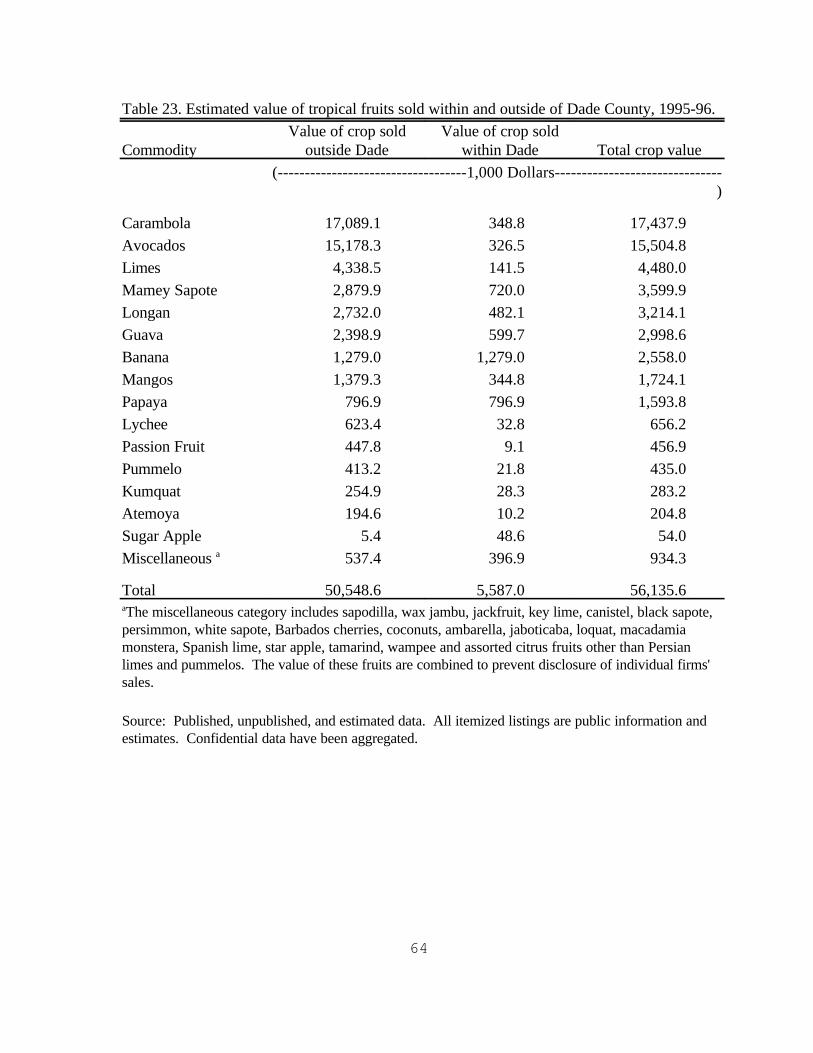
64
Table 23. Estimated value of tropical fruits sold within and outside of Dade County, 1995-96.
CommodityValue of crop sold
outside DadeValue of crop sold
within Dade Total crop value
(-----------------------------------1,000 Dollars-------------------------------)
Carambola 17,089.1 348.8 17,437.9
Avocados 15,178.3 326.5 15,504.8
Limes 4,338.5 141.5 4,480.0
Mamey Sapote 2,879.9 720.0 3,599.9
Longan 2,732.0 482.1 3,214.1
Guava 2,398.9 599.7 2,998.6
Banana 1,279.0 1,279.0 2,558.0
Mangos 1,379.3 344.8 1,724.1
Papaya 796.9 796.9 1,593.8
Lychee 623.4 32.8 656.2
Passion Fruit 447.8 9.1 456.9
Pummelo 413.2 21.8 435.0
Kumquat 254.9 28.3 283.2
Atemoya 194.6 10.2 204.8
Sugar Apple 5.4 48.6 54.0
Miscellaneous a 537.4 396.9 934.3
Total 50,548.6 5,587.0 56,135.6aThe miscellaneous category includes sapodilla, wax jambu, jackfruit, key lime, canistel, black sapote,persimmon, white sapote, Barbados cherries, coconuts, ambarella, jaboticaba, loquat, macadamiamonstera, Spanish lime, star apple, tamarind, wampee and assorted citrus fruits other than Persianlimes and pummelos. The value of these fruits are combined to prevent disclosure of individual firms'sales.
Source: Published, unpublished, and estimated data. All itemized listings are public information andestimates. Confidential data have been aggregated.
65
Acreage trends over the past 20 years have generally followed the same patterns as those
of avocados and limes. Plantings and total acreage steadily increased from the late 1970s through
most of the 1980s, going from 1,376 in 1978 to a maximum of 2,527 acres in 1988 (Table 22,
Figure 11). The tropical tree census of 1990, the last before the hurricane, showed a slight
decline in total acreage. The 1993 census, however, showed a post-hurricane acreage of only
1,398 acres, a loss of more than a thousand acres from 1990. The 1996 tropical fruit inventory
showed a slight increase in acreage to 1,505. However, this acreage was still about 38 percent
below pre-hurricane levels (Tables 21 and 22). Despite the sizeable decrease in mango acreage,
Dade County still accounts for over 82 percent of the state's total mango acreage (8).
Dade County's mango production in 1995 was still for below pre-hurricane levels,
amounting to less than 30 percent of the 1991 crop. Limited production was not only due to
smaller total bearing acreage, but also the result of poor tree recovery from hurricane damage,
bloom problems, and disease (9). Further, low prices prevailed during much of the 1995 season,
and as a consequence, the total F.O.B. value of the Dade County mango crop was only $1.7
million. An estimated 80 percent of total sales, about $1.3 million, were made outside of Dade
County (Table 23).
Carambola
Carambola, also called star fruit, is one of Dade County's most successful tropical fruits
of the 1980s and 1990s. Native to tropical Asia, carambola were first grown in Florida over 100
years ago. However, until the 1970s, the fruit was grown primarily as a dooryard curiosity
because of its tart, sour taste (7, 18). Improved, sweeter varieties developed in the 1970s by
USDA, private breeders, and University of Florida horticulturists at the Tropical Research and
Education Center in Homestead stimulated interest in carambolas as a commercial crop.
Aggressive marketing programs by J. R. Brooks and Sons, Inc. and other shippers helped foster
rapid expansion of carambola production. In the early 1980s, carambola acreage stood at 40
acres, but by the end of the decade, acreage had increased to 600 acres (Table 24). A significant
portion of this acreage was severely damaged or destroyed, but by 1996, Dade County's total
acreage was estimated at 532 acres. This represents about 80 percent of the state's total
carambola plantings.
66
In the 1995-96 season, yields of nearly 40,000 pounds per acre, packouts of about 60
percent and season average F.O.B. prices approaching $1.40 per pound resulted in F.O.B.
revenues of about $17.4 million. Total revenues for carambola were greater than any of the other
tropical fruit crops grown in Dade County (Table 23). An estimated 98 percent of all carambola
shipments go to destinations outside of the county.
Mamey Sapote
Mamey sapote, originating in the Mexican and Central American lowlands, is a football
shaped fruit that can measure up to nine inches in length and usually weighs from one to three
pounds, although it can weigh up to eight pounds. The main mamey sapote crop matures from
May through September in Florida, but fruit can be found any time of the year. Trees may have
flowers, immature fruits, and mature fruits on their branches all at the same time. Depending on
the weather, an individual fruit can require up to two years to mature in Florida (18).
Mamey sapote acreage steadily increased from 200 to 350 acres in the early 1980s, then
dropped to 226 acres in the 1986-87 and 1987-88 seasons. By the 1988-89 season, acreage had
increased to 267 acres (Table 24). By the time Hurricane Andrew hit, mamey sapote acreage had
once again increased to about 300 acres, and in the ensuing seasons, increased ever-so-slightly
to 308 acres. Although the total acreage of mamey sapotes had recovered, many trees still had
not reached their full production potential during the 1995-96 season due to young trees and
older trees that were still recovering from storm damage. As a result, average yields were
estimated at 4,870 pounds per acre. Despite the relatively low yields, favorable prices ($2.40 per
pound, F.O.B.) resulted in a total value of nearly $3.6 million. Approximately 80 percent of
mamey sapote sales went to destinations outside Dade County (Table 23).
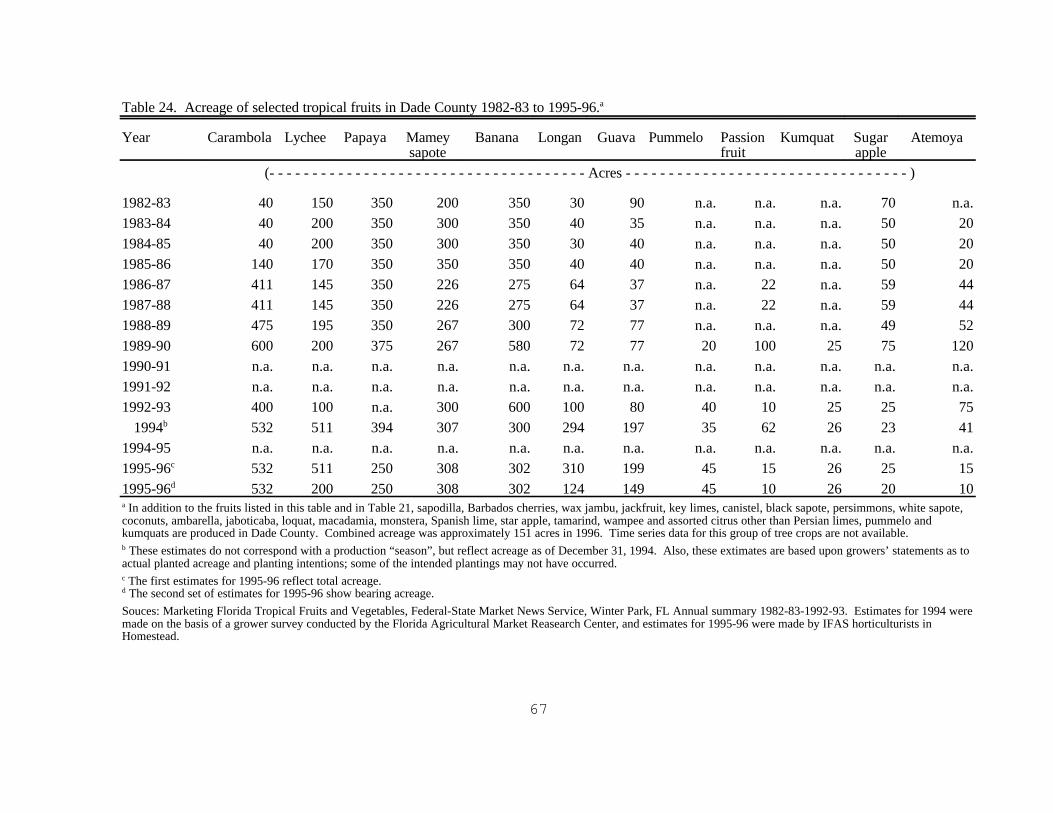
67
Table 24. Acreage of selected tropical fruits in Dade County 1982-83 to 1995-96.a
Year Carambola Lychee Papaya Mameysapote
Banana Longan Guava Pummelo Passionfruit
Kumquat Sugarapple
Atemoya
(- - - - - - - - - - - - - - - - - - - - - - - - - - - - - - - - - - - - - Acres - - - - - - - - - - - - - - - - - - - - - - - - - - - - - - - - - )
1982-83 40 150 350 200 350 30 90 n.a. n.a. n.a. 70 n.a.1983-84 40 200 350 300 350 40 35 n.a. n.a. n.a. 50 201984-85 40 200 350 300 350 30 40 n.a. n.a. n.a. 50 201985-86 140 170 350 350 350 40 40 n.a. n.a. n.a. 50 201986-87 411 145 350 226 275 64 37 n.a. 22 n.a. 59 441987-88 411 145 350 226 275 64 37 n.a. 22 n.a. 59 441988-89 475 195 350 267 300 72 77 n.a. n.a. n.a. 49 521989-90 600 200 375 267 580 72 77 20 100 25 75 1201990-91 n.a. n.a. n.a. n.a. n.a. n.a. n.a. n.a. n.a. n.a. n.a. n.a.1991-92 n.a. n.a. n.a. n.a. n.a. n.a. n.a. n.a. n.a. n.a. n.a. n.a.1992-93 400 100 n.a. 300 600 100 80 40 10 25 25 75
1994b 532 511 394 307 300 294 197 35 62 26 23 411994-95 n.a. n.a. n.a. n.a. n.a. n.a. n.a. n.a. n.a. n.a. n.a. n.a.1995-96c 532 511 250 308 302 310 199 45 15 26 25 151995-96d 532 200 250 308 302 124 149 45 10 26 20 10a In addition to the fruits listed in this table and in Table 21, sapodilla, Barbados cherries, wax jambu, jackfruit, key limes, canistel, black sapote, persimmons, white sapote,coconuts, ambarella, jaboticaba, loquat, macadamia, monstera, Spanish lime, star apple, tamarind, wampee and assorted citrus other than Persian limes, pummelo andkumquats are produced in Dade County. Combined acreage was approximately 151 acres in 1996. Time series data for this group of tree crops are not available.b These estimates do not correspond with a production “season”, but reflect acreage as of December 31, 1994. Also, these extimates are based upon growers’ statements as toactual planted acreage and planting intentions; some of the intended plantings may not have occurred.c The first estimates for 1995-96 reflect total acreage.d The second set of estimates for 1995-96 show bearing acreage.
Souces: Marketing Florida Tropical Fruits and Vegetables, Federal-State Market News Service, Winter Park, FL Annual summary 1982-83-1992-93. Estimates for 1994 weremade on the basis of a grower survey conducted by the Florida Agricultural Market Reasearch Center, and estimates for 1995-96 were made by IFAS horticulturists inHomestead.
68
Longan
The longan, also known as "Dragon's eye", is native of India (20). It is a close relative
to the lychee but the longan fruit has a milder flavor than the lychee. These two crops bear about
a month apart in South Florida. One of the problems of both the longan and lychee is their
tendency towards alternate or erratic seasonal production. However, the longan is a tougher
(withstands slightly lower temperatures) and is a less fussy crop than the lychee (2, 18).
The longan has several additional advantages over the lychee. Unlike the lychee, the
longan, growing in clusters of 3 to 20 or more fruits, can be sold in picked clumps rather than
individually packed fruits. The longan can also remain a saleable item for a longer time because
the naturally brown longan does not suffer from color change (2). In Dade County the longan
is generally harvested from mid July through mid August.
After slowly increasing from about 30 acres in the early 1980s to 72 acres in the late
1980s, longan acreage in Dade County increased rapidly after Hurricane Andrew. By 1995-96,
total longan plantings were estimated at 310 acres, of which 124 were bearing (Table 24) average
yields were estimated at 8,000 pounds per acre, well below anticipated yields for fully mature
groves. Packout was estimated to be 90 percent. F.O.B. prices in the 1995-96 season were very
favorable, averaging about $3.60 per pound. Thus, despite relatively low yields, the total value
of the crop was estimated to be over $3.2 million. Approximately 85 percent of the longan crop
was shipped to destinations outside of Dade County (Table 23).
Guava
Guava is primarily used for jelly-making or other culinary purposes. Native to tropical
America, it is said to have been introduced into Florida from Cuba in 1847. A heavy fruit bearer,
the guava tree ripens its fruit practically all year round, although the bulk of Florida production
occurs during the summer months (17, 18). Throughout most of the 1980s, guava acreage in
Dade County fluctuated from 35 to 40 acres. However, in the late 1980s and early 1990s,
acreage increased to approximately 80 acres. Interest in guava production escalated after the
hurricane, and by the end of 1994 acreage was estimated to be 197 acres.
During the 1995-96 season, total planted acreage approached 200 acres, of which about
69
three-fourths was of bearing age (Table 24). For this season, yields were estimated at 25,000
pounds per acre, packout at 70 percent, and F.O.B. prices at $1.15 per pound, resulting in a total
crop value of nearly $3 million (Table 23).
Plantain and banana
Plantains and bananas grown in Dade County are Musa spp. which are tropical specialty
bananas. Compared to the dessert banana generally found in the supermarket, plantains are much
larger, less sweet, more starchy, and are cooked before eating. Other bananas grown in Dade
County tend to be smaller and thicker than dessert bananas but are sweet tasting (18).
Throughout the early 1980s, banana acreage in Dade County was fairly stable at 350
acres. After dropping down to about 275 to 300 acres in the late 1980s, acreage rebounded to
about 600 acres in the late 1980s and early 1990s. Following the hurricane, growers have
experienced disease problems, and acreage has not regained pre-hurricane levels. As a result,
acreage has remained at about 300 acres and yields have been about 12,000 pounds per acre.
Demand has remained strong, however, and in 1995-96, season average F.O.B. prices were
conservatively estimated at 70 cents per pound. Thus, the total F.O.B. value of banana
production was slightly over $2.5 million in 1995-96, with half of the sales made outside of Dade
County.
Papaya
Papaya acreage in Dade County remained constant at 350 acres throughout most of the
1980s. However, in the 1989-90 season, acreage increased to 375 acres. After Hurricane
Andrew, interest in papayas increased, and by the end of 1994, acreage was estimated to be nearly
400 acres (Table 24). However, total acreage during the 1995-96 production season was
estimated to be down to 250 acres. Average yields during the 1995-96 season were about 25,000
pounds per acre, packout about 85 percent, and the season average F.O.B. price 30 cents per
pound. Thus, the total value of papaya production was estimated at $1.6 million, with half the
sales outside the county (Table 23).
Lychee
The lychee or litchi originated in southern China. It has been introduced widely in the
70
tropical and subtropical world, but has proved to be well-adapted in relatively few places. There
is commercial production in the U.S. (Florida and Hawaii), southern China, Taiwan, India, South
Africa, and Australia. In southern Asia, lychee cultivation dates back at least two thousand years.
While the lychee is believed to have been planted in Florida as early as 1886, it was not until 1916
that the first fruits were produced (2).
The greatest constraint to commercial production of lychee in Florida has been its erratic
flowering and fruiting. However, in recent years, improved cultural practices have helped to
overcome these problems. These advances, coupled with favorable prices, have stimulated
greater plantings in Dade County. Throughout the 1980s, lychee acreage ranged between 145
and 200 acres. Hurricane Andrew reduced lychee acreage to about half of pre-storm levels.
However, significant plantings have been made in the post-hurricane period. Total lychee acreage
in 1995-96 was estimated at 511 acres, of which only 200 were bearing (Table 24). Of the
bearing acreage, about 100 acres were mature, yielding about 8,750 pounds per acre and 100
acres were young trees bearing about 1,000 pounds per acre. With an average packout of 70
percent and extremely favorable prices (estimated at $3.75 per pound), the F.O.B. value of the
Dade County lychee crop was over $650,000 in 1995-96, approximately 95 percent of which was
shipped out of the county (Table 23).
Passion fruit
Passion fruit originated in the American tropics. It is now grown in most tropical and
subtropical parts of the world, but is particularly important commercially in Australia, Hawaii,
South Africa, and Brazil (24). In Dade County, passion fruit acreage increased rapidly in the late
1980s, going from 22 acres in the 1987-88 season to 100 acres in 1989-90. Official acreage
estimates after the hurricane reported only 10 acres of passion fruit (Table 24). In the 1995-96
season, bearing acreage of passion fruit was 10 acres, and yields were estimated at 21,500 pounds
per acre. With a packout rate of 85 percent and a season average F.O.B. price of $2.50 per
pound, the total value of production was nearly $457,000 (Table 23).
Pummelo
Pummelo, also called Chinese grapefruit, represents a small, but growing segment of the
71
tropical fruit industry in Dade County. In the 1989-90 season, there were 20 acres of pummelo,
and by the 1992-93 season there were 40 acres. Although acreage declined slightly as a result
of Hurricane Andrew, by 1995-96 there were an estimated 45 acres in production (Table 24).
Of these, approximately 20 acres are older, mature trees yielding about 25,000 pounds per acre,
and 25 acres are younger, producing about 10,000 pounds per acre. In the 1995-96 season, the
season average F.O.B. price was nearly 60 cents per pound, resulting in a total crop value of
$435,000, of which 95 percent was sold outside of the county (Table 23).
Kumquat
Kumquats originated in China and were introduced into the U.S. in the last century (18).
A specialty citrus item, the tart fruit is frequently included in gift packs, and is in high demand
during major holiday seasons in the fall and winter. Dade County kumquat acreage has been very
stable at about 25 acres over the past few years, before and after the hurricane (Table 24). In the
1995-96 season, yields averaged about 8,300 pounds per acre, and packout was estimated at 95
percent. Estimates of season average prices ranged between $1.25 and $1.50 per pound, resulting
in a total crop value of about $283,000.
Atemoya
The atemoya's scientific name is Annona cherimola x A. squamosa indicating that it is a
cross of the cherimoya and the sugar-apple. Other common names for the atemoya are custard
apple and anon. In Florida, the atemoya is best adapted to frost-free areas (18). Virtually all of
the state's commercial production is in Dade County. Atemoya acreage steadily increased
throughout the 1980s, going from 20 acres in 1982-83 to 120 acres in 1989-90. Following the
hurricane, acreage dropped precipitously, and by the 1995-96 season, there were only 10 acres
in production (Table 24). The estimated yield was 6,400 pounds per acre, and the packout was
about 80 percent. Although the quantity shipped was just over 51,000 pounds, the F.O.B. price
of $4.00 per pound generated nearly $205,000 in sales, of which 95 percent were made outside
of Dade County (Table 23).
Sugar apple
The sugar apple is a type of annona, and it is also called sweetsop. Throughout the 1980s,
72
sugar apple acreage fluctuated from about 50 to 75 acres (Table 24). Since the hurricane,
however, acreage has been estimated to be 25 acres or lower. In the 1995-96 season, bearing
acreage was only 20 acres, and yield 1,000 pounds per acre. Given a packout of 90 percent and
a reported season average F.O.B. price of $3.00 per pound, the total crop value was $54,000.
Because of the fragile nature of the sugar apple, it does not ship very well; it was estimated that
only 10 percent of the crop is shipped out of the county (Table 23).
Miscellaneous Tropical Fruit
Approximately 20 tropical fruits have been combined into the miscellaneous category to
maintain the confidentiality of data obtained from individual firms. Fruits included are sapodilla,
Barbados cherries, wax jambu, jackfruit, key limes, canistel, black sapote, persimmons, white
sapote, coconuts, ambarella, jaboticaba, loquat, macadamia, monstera, Spanish lime, star apple,
tamarind, wampee, assorted citrus such as oranges, tangerines and grapefruit. Acreage of these
fruits ranged from about one acre to about 30 acres; the combined total acreage for the 1995-96
season was 151 acres, up from 138 acres in 1989-90 (Table 21). Yields and prices for these fruits
vary considerably, but most of the "exotics" typically sold for $1.50 to $2.50 per pound F.O.B.
Homestead in the 1995-96 season, although more common types of fruit sold for considerably
less. Overall, the market value of the fruits in the miscellaneous category totaled over $934,000.
Because of limited quantities of some items and heavy local demand, slightly over 40 percent of
the "miscellaneous" sales were made within Dade County (Table 23). According to growers and
professional horticulturists, a number of the fruits in their category have the potential for much
greater economic importance.
73
REFERENCES
1. Bureau of Economic and Business Research, College of Business Administration,University of Florida. 1995 Florida Statistical Abstract, Tables 1.69, 1.75, 9.45. TheUniversity Presses of Florida, Gainesville, Florida, 1995.
2. Cockshutt, Nicholas, editor. "Tropical Fruit World." Fairchild Tropical Garden. Volume1, Numbers 1 & 2, Miami, Florida, March/April 1990.
3. Colburn, Burt and Seymore Goldweber. Preparation of Oolitic Limestone Soil forAgricultural Use. Cooperative Extension Circular #343.
4. Dade County Cooperative Extension. "Agriculture: Economic Importance to DadeCounty." Mimeograph dated November 21, 1958.
5. Degner, Robert L., S. M. Moss and S. K. Mack. "Dade County Agricultural AcreageEstimates, Pre- and Post Hurricane Andrew," Staff Report 95-1, Florida AgriculturalMarket Research Center, Food and Resource Economics Department, Institute of Foodand Agricultural Sciences, University of Florida, Gainesville, Florida, September, 1995.
6. Eco Impact, Inc. The Impact of Evicting Farmers from Everglades National Park's Hole-in-the-Donut. From Executive Summary, Gainesville, Florida, 1975.
7. Fisher, Jim. "Carambola is hot item in tropical fruit area." Florida Grower and Rancher.Volume 83, Number 9, September 1990.
8. Florida Agricultural Statistics Service. "Tropical Fruit: Acres and Trees" December, 1996.Orlando, Florida.
9. Florida Agricultural Statistics Service. "Tropical Fruit: Production and Value." Orlando,Florida, April, 1997.
10. Florida Agricultural Statistics Service. Unpublished data, 1984-1989. Orlando, Florida.
11. Florida Agricultural Statistics Service. Vegetable Summary, various issues through 1995-96. Orlando, Florida.
12. Florida Avocado Administrative Committee. Florida Avocados: Annual Report of theFlorida Avocado Administrative Committee, 1995-96 Season. Homestead, Florida, 1996.
REFERENCES, continued.
13. Florida Department of Agriculture and Consumer Services, Division of Plant Inspection.
74
Unpublished inspection data and mailing lists, Gainesville, Florida, February, 1997.
14. Florida Tomato Committee. Florida Tomato Committee Annual Report. Various issues1980 to 1996, Orlando, Florida.
15. Knight, Jr., R.J. and Julian W. Sauls. "The Passion Fruit." Fruit Crops Fact Sheet. FloridaCooperative Extension Service, FC-60, Gainesville, Florida.
16. Malo, S.E. and C.W. Campbell. "The Avocado." Fruit Crops Fact Sheet. FloridaCooperative Extension Service, FC-3, Gainesville, Florida.
17. Malo, S.E. and C.W. Campbell. "The Guava. Fruit Crops Fact Sheet. FloridaCooperative Extension Service, FC-4, Gainesville, Florida.
18. Moseley, Anne E., et al. Economic Impact of Agriculture and Agribusiness in DadeCounty, Florida. Industry Report 90-4, Florida Agricultural Market Research Center,IFAS, University of Florida, Gainesville, Florida, December, 1990.
19. Mulkey, David, Robert L. Degner, Stephan Gran and Rodney L. Clouser. Agriculture inSouthwest Florida: Overview and Economic Impact, Food & Resource EconomicsDepartment Staff Paper SO 97-3, Institute of Food and Agricultural Sciences, Universityof Florida, Gainesville, Florida. April, 1997.
20. Popenoe, Wilson. Manual of Tropical and Subtropical Fruits. A Facsimile of the 1920Edition, Hafner Press, New York, NY, copyright 1948.
21. Sales and Marketing Management. 1996 Survey of Buying Power. Bill Communications,New York, New York, 1996.
22. U.S. Bureau of Census. Census of Agriculture. Washington, D.C., 1974, 1978, 1982,1987, and 1992.
23. U.S. Department of Commerce, Bureau of Economic Analysis, Regional Multipliers: AUser Handbook for the Regional Input-Output Modeling System (RIMSII), ThirdEdition, March, 1997.
24. World Almanac. The World Almanac & Book of Facts. 1990. An imprint of PharoBooks, New York, NY, 1990, pp. 224-5.