economic impact of copd and cost effective solutions october 2008 economic impact of copd and cost...
TRANSCRIPT

16 October 2008
Economic impact of COPD and cost effective solutions
Report by Access Economics Pty Limited for
The Australian Lung Foundation

Economic impact of COPD
While every effort has been made to ensure the accuracy of this document, the uncertain nature of economic data, forecasting and analysis means that Access Economics Pty Limited is unable to make any warranties in relation to the information contained herein. Access Economics Pty Limited, its employees and agents disclaim liability for any loss or damage which may arise as a consequence of any person relying on the information contained in this document.
CONTENTS
Acknowledgements................................... ...........................................................................v
Glossary of acronyms............................... ..........................................................................vi
Foreword........................................... ..................................................................................vii
Executive summary.................................. .............................................................................i
1. Introduction ....................................... ..........................................................................1
1.1 Structure of this report .........................................................................................................1
1.2 Cross-cutting methodological issues ...................................................................................1
1.2.1 Incidence and prevalence approaches......................................................................1
1.2.2 Classification of costs ................................................................................................2
1.2.3 Calculating parameters..............................................................................................5
2. Prevalence and epidemiology ........................ ............................................................7
2.1 Definition and symptoms......................................................................................................7
2.1.1 Healthy respiratory function vs COPD.......................................................................8
2.1.2 COPD diseases .........................................................................................................9
2.2 Risk factors and diagnosis .................................................................................................10
2.2.1 Risk factors ..............................................................................................................10
2.2.2 Diagnosis .................................................................................................................12
2.3 Morbidity and severity ........................................................................................................12
2.4 Managing COPD and exacerbations .................................................................................14
2.4.1 Confirm diagnosis ....................................................................................................16
2.4.2 Optimise function .....................................................................................................17
2.4.3 Prevent deterioration ...............................................................................................17
2.4.4 Develop support network and self-management plan .............................................18
2.4.5 Manage exacerbations ............................................................................................18
2.5 Mortality and survival rates ................................................................................................19
2.6 Prevalence estimates.........................................................................................................20
2.6.1 Baseline prevalence estimates................................................................................23
2.6.2 Projections of future prevalence ..............................................................................25
3. Health costs....................................... ........................................................................28
3.1 Methodology.......................................................................................................................28
3.2 Health expenditure in 2008 ................................................................................................29
4. Other financial costs.............................. ...................................................................32
4.1 Productivity losses .............................................................................................................32
4.1.1 Employment participation ........................................................................................32
4.1.2 Absenteeism from paid and unpaid work ................................................................33
4.1.3 Presenteeism...........................................................................................................33

4.1.4 Premature death ......................................................................................................34
4.1.5 Lost taxation revenue ..............................................................................................35
4.2 Carer costs.........................................................................................................................36
4.2.1 Methodology ............................................................................................................37
4.2.2 Informal and community care costs.........................................................................37
4.3 Aids and home modifications .............................................................................................37
4.4 Funeral costs......................................................................................................................39
4.5 Deadweight losses from transfers......................................................................................40
4.5.1 Welfare and income support payments ...................................................................40
4.5.2 Deadweight losses...................................................................................................40
4.6 Summary of other financial costs.......................................................................................42
5. Burden of disease .................................. ...................................................................43
5.1 Methodology – valuing life and health ...............................................................................43
5.1.1 Measuring burden: DALYs, YLLs and YLDs ...........................................................43
5.1.2 Willingness to pay and the value of a statistical life year ........................................43
5.2 Burden of disease due to COPD........................................................................................45
5.2.1 Disability weights .....................................................................................................45
5.2.2 Years of life lost due to disability .............................................................................45
5.2.3 Years of life due to premature death .......................................................................46
5.2.4 Total DALYs due to COPD ......................................................................................46
5.2.5 Net value of healthy life lost.....................................................................................47
6. Diagnosis and cost effectiveness ................... .........................................................48
6.1 Diagnosis and early intervention issues ............................................................................48
6.2 Cost effective interventions................................................................................................49
6.2.1 Early diagnosis ........................................................................................................50
6.2.2 Smoking cessation...................................................................................................51
6.2.3 Active participation in disease management programs...........................................51
6.2.4 Oxygen therapy .......................................................................................................53
6.2.5 Lung volume reduction surgery / lung transplantation.............................................55
6.2.6 Completion of well planned pharmacological trials .................................................56
7. Cost summary, comparisons and challenges........... ..............................................58
7.1 Cost summary....................................................................................................................58
7.2 Comparisons ......................................................................................................................60
7.2.1 Prevalence comparisons .........................................................................................60
7.2.2 Cost comparisons ....................................................................................................60
7.3 Policy recommendations and future directions ..................................................................61
References......................................... .................................................................................64

FIGURES
Figure 1-1: Incidence and prevalence approaches to measurement of annual costs 2
Figure 2-1: The healthy lungs 8
Figure 2-2: Inside the lungs 9
Figure 2-3: Chronic bronchitis 9
Figure 2-4: Emphysema 10
Figure 2-5: COPD prevalence by age (% population): Stages II to IV 23
Figure 2-6: Prevalence of COPD, 2008 (persons) 25
Figure 2-7: Projected prevalence of COPD by gender to 2050 (persons)(a) 27
Figure 3-1: COPD, total health expenditure by age and gender, 2008 ($million) 31
Figure 4-1: COPD, costs of premature mortality by age and gender ($ million) 35
Figure 4-2: DWL of taxation 41
Figure 5-1: Loss of wellbeing due to COPD (DALYs), by age and gender, 2008 46
Figure 7-1: Financial costs of COPD, by type of cost (% total) 59
Figure 7-2: Financial costs of COPD, by bearer (% total) 59
TABLES
Table 1-1: Schema for cost classification 5
Table 2-1: Risk factors for COPD (from COPD-X guidelines) 10
Table 2-2: Key indicators for considering a diagnosis of COPD 12
Table 2-3: Functional limitation due to breathlessness (medical research council) 13
Table 2-4: COPD-X summary of guidelines 15
Table 2-5: Relative risk of mortality due to COPD 19
Table 2-6: BOLD prevalence rates by age and gender (%) – GOLD Stages I–IV 21
Table 2-7: BOLD prevalence rates by age and gender (%) – GOLD Stages II–IV 22
Table 2-8: NHS prevalence rates of COPD by age and gender (%) 22
Table 2-9: Baseline prevalence rates of COPD (Stages II to IV) by age and gender (%) 24
Table 2-10: COPD by age and gender, projected prevalence to 2050 26
Table 2-11: COPD Stages II to IV by severity, projected prevalence to 2050 27
Table 3-1: AIHW health system expenditure for COPD, 2008 29
Table 3-2: Total health system expenditure for COPD, 2008 30
Table 3-3: Distribution of health expenditure by who pays 31
Table 4-1: Lost earnings and taxation due to COPD, 2008 36
Table 4-2: COPD, aids and equipment prices, estimated product life and total costs, 2008 39

Table 4-3: Summary of other financial costs of COPD, 2008 42
Table 5-1: Estimated years of healthy life lost due to disability (YLD), 2008 (DALYs) 45
Table 5-2: Years of life lost due to premature death (YLL) due to COPD, 2008 46
Table 5-3: Net cost of lost wellbeing, $million, 2008 47
Table 6-1: Cost effectiveness of early intervention 51
Table 6-2: Smoking cessation evidence 51
Table 6-3: Active participation in disease management programs 52
Table 6-4: Oxygen therapy evidence 53
Table 6-5: Pulmonary rehabilitation 55
Table 6-6: Lung volume reduction surgery / Lung transplantation 56
Table 6-7: Effect of individual pharmacological agents on important outcomes of patients with COPD 56
Table 6-8: Effect of some combined pharmacological agents on important outcomes of patients with COPD 57
Table 7-1: COPD, total costs by type of cost and bearer, Australia, 2008 58
Table 7-2: COPD, prevalence comparisons with other conditions 60
Table 7-3: COPD, total cost comparisons with other conditions 61

ACKNOWLEDGEMENTS
This report was prepared by Access Economics for The Australian Lung Foundation.
Access Economics would like to acknowledge with gratitude the inputs, prior research and comments from the Expert Panel convened for this project:
Heather Allan Director, COPD National Program The Australian Lung Foundation Bryan Clift Co-Chair Australian COPD Patient Taskforce Associate Professor Alan Crockett Director, Primary Care Respiratory Research Unit School of Population Health & Clinical Practice University of Adelaide William Darbishire Chief Executive Officer The Australian Lung Foundation Professor Peter Frith Head, Respiratory Medicine Repatriation General Hospital, Adelaide John Moss Head, Discipline of Public Health University of South Australia, Adelaide Vanessa McDonald Clinical Nurse Consultant & Conjoint Lecturer Department of Respiratory and Sleep Medicine John Hunter Hospital & The University of Newcastle

GLOSSARY OF ACRONYMS
ABS Australian Bureau of Statistics
AIHW Australian Institute of Health and Welfare
AWE average weekly earnings
BEACH Bettering the Evaluation and Care of Health
BOLD Burden of Obstructive Lung Disease
COPD Chronic Obstructive Pulmonary Disease
DALY Disability Adjusted Life Year
DWLs deadweight losses
FEV1 forced expiratory volume in one second
FVC forced vital capacity (the maximum volume of air which can be exhaled at maximum effort after a maximal inspiration)
FEV1/ FVC the ratio of forced expiratory volume in one second to forced vital capacity, written as a percentage (for diagnosis of COPD)
GDP Gross Domestic Product
GOLD Global Initiative for Chronic Obstructive Lung Disease
GP general practitioner
ICD(-10) International Classification of Disease (tenth revision)
NHPA National Health Priority Area
NHS National Health Survey
PaCO2 partial pressure of carbon dioxide in the arterial blood
PaO2 partial pressure of oxygen in the arterial blood
PBS Pharmaceutical Benefits Schedule
RR relative risk
SDAC Survey of Disability Ageing and Carers (ABS)
US United States (of America)
VSL(Y) Value of a Statistical Life (Year)
WTP willingness to pay
YLD Year of healthy life Lost due to Disability
YLL Year of Life Lost due to premature mortality

FOREWORD
The Australian Lung Foundation commissioned Access Economics to produce this national report, Economic impact of COPD and cost effective solutions, to help us gain a better appreciation of the significant costs currently being borne by Australians as a result of Chronic Obstructive Pulmonary Disease (COPD).
In Australia, as in other developed countries worldwide, Chronic Obstructive Pulmonary Disease is under-recognised, under-diagnosed and under-treated.
Chronic Obstructive Pulmonary Disease is both preventable and treatable. As more data on prevalence of COPD is collected, we also know that COPD is highly prevalent. However, only a fraction of those with COPD are aware they have the disease. Most people with COPD do not recognise their symptoms and are therefore not taking the crucial early steps to stem the progress of the disease, improve their quality of life and keep out of hospital.
As this report chronicles, COPD carries with it a tremendous cost to government, the taxpayer and importantly, to those with COPD and their families and carers.
At present just over 2 million Australians are estimated to have COPD, equating to nearly 1 in 5 (18.6%) people aged 40 or over. Of these, 1.2 million people have COPD which is severe enough that symptoms are starting to or have already affected the way people live their daily lives. The other 900,000 people will have a mild form of COPD where symptoms are often ignored or mistaken for ageing or even asthma. Many of these will go on to develop more severe forms of COPD if they do not take appropriate action.
Almost half of all those with COPD are still in the prime of their working lives, and 57% of all people with COPD are women. COPD is more common in any given year than the most common types of cancer, road traffic accidents, ear disease or diabetes. Alarmingly, if nothing is done to change the current trends, in 2050 an estimated 4.5 million Australians will have COPD – with 2.6 million of those having moderate to very severe COPD.
This report not only outlines the costs of COPD, but uses evidence to support recommendations that have been shown to be effective in managing COPD and are cost-effective.
It is the hope of The Australian Lung Foundation that the recommendations and conclusions of this report will mobilise governments, clinicians, the media and, importantly, patients themselves, to support improved awareness of COPD, earlier diagnosis and better access to important management therapies.
Dr Bob Edwards, Chair
The Australian Lung Foundation

Economic impact of COPD
i
EXECUTIVE SUMMARY
Access Economics was commissioned by The Australian Lung Foundation to estimate the economic impact of Chronic Obstructive Pulmonary Disease (COPD) in Australia in 2008.
COPD is a largely preventable and treatable progressive lung disease characterised by a persistent blockage of airflow from the lungs, encompassing chronic bronchitis and emphysema. COPD often complicates other chronic conditions such as diabetes, chronic heart failure and cerebrovascular diseases, resulting in worse prognosis.
The most common symptoms of COPD are breathlessness, excessive sputum production and a persistent cough. Acute exacerbations (flare-ups), usually infective, occur from time to time and may lead to a sharp deterioration in coping ability. The key risk factors for COPD are smoking, genetic deficiency of alpha-1 antitrypsin, environmental exposure to dusts or chemicals/fumes, age, socioeconomic status and a history of severe childhood respiratory infection.
Under-diagnosis is a major issue; although spirometry is the gold standard for diagnosis and clinical practice guidelines are available, the utilisation of these tools in practice is suboptimal. COPD results in substantial morbidity, with reduced quality of life and functionality and the need to adapt activities to help reduce disease impact and disability.
While incurable, evidence shows that proper management of COPD can improve quality of life, increase exercise capacity, and reduce morbidity and mortality in affected individuals (McKenzie et al 2003).
The clinical management of COPD is based on the Global Initiative for Chronic Obstructive Lung Disease (GOLD) methodology adapted to Australia and New Zealand as per McKenzie et al (2003), with five key ‘COPD-X’ components: (1) Confirm diagnosis; (2) Optimise function; (3) Prevent deterioration; (4) Develop support network and self-management plan; and (5) Manage exacerbations.
Prevalence and mortality
The BOLD (Burden of Obstructive Lung Disease) Study’s Australian sub-group forms the basis for the prevalence estimates used in this report for Australians over 40 years of age, and is combined with the Australian National Health Survey (NHS) results to estimate COPD prevalence across Australia. BOLD data were based on post-bronchodilator spirometry testing plus questionnaires about respiratory symptoms, health status, and exposure to COPD risk factors, while the NHS data were self-reported (given there were no BOLD or other epidemiological data for the under-40 group, and for the 40-60 year group NHS rates were not substantially lower than BOLD). Prevalence in the 0-19 year olds reported in the NHS was higher than expected, but this is unlikely to have a major impact on overall findings.
According to the widely accepted GOLD classification, COPD progresses along four stages: from mild (Stage I), to moderate (Stage II), to severe (Stage III), and finally very severe (Stage IV) COPD. Whether GOLD stage I should be regarded as early COPD is debated as lung function falls with age in healthy individuals, and thus overdiagnosis may occur in older age groups (Buist et al 2007). In addition, the economic cost of COPD is modest in Stage I. The impact of the disease in terms of utilisation of health services and impairment of quality of life manifests in larger part from Stage II, and deteriorates thereafter. Notably, the economic impact of COPD is therefore calculated here for Stages II to IV of COPD.

Economic impact of COPD
ii
� For all Stages (I to IV), the BOLD prevalence rate estimates applied to Australian population data for 2008 suggest around 18.6% prevalence in the Australian population aged 40 years or older.
� When only Stages II to IV of COPD are included, the BOLD estimates suggest around 10.2% prevalence in the Australian population aged 40 years.
� Around 876,000 Australians are estimated to have Stage I COPD. If left unrecognised, many of these will go on to develop more severe COPD.
Prevalence rates used for the costings in this report are based on a combination of BOLD Stages II to IV and NHS data. Using this approach, 5.6% of the Australian population overall and 8.2% of the population over 30 have Stages II to IV COPD.
PREVALENCE OF COPD STAGES II TO IV BY AGE AND GENDER (% POPULATION) Age Group Males Females Persons0-4 1.4% 1.2% 1.3%5-9 1.4% 1.2% 1.3%10-14 1.4% 1.2% 1.3%15-19 1.5% 2.0% 1.7%20-24 1.5% 2.0% 1.7%25-29 1.4% 2.0% 1.7%30-34 1.4% 2.0% 1.7%35-39 1.9% 3.4% 2.7%40-44 2.7% 3.4% 3.1%45-49 2.7% 4.9% 3.8%50-54 4.1% 6.8% 5.5%55-59 4.1% 6.8% 5.5%60-64 13.8% 13.8% 13.8%65-69 13.8% 13.8% 13.8%70-74 22.4% 23.8% 23.1%75-79 22.4% 23.8% 23.2%80-84 22.4% 23.8% 23.2%85-89 22.4% 23.8% 23.3%90+ 22.4% 23.8% 23.4%Total 4.8% 6.2% 5.6%
Source: Access Economics estimates based on BOLD and NHS data.
Projections of the number of Australians with Stage II to IV COPD to the year 2050 are in the chart below and show that:
� In 2008, of all people with COPD, 47% are of working age (15-64 years) and 62% are aged 60 or over.
� As the population ages, the prevalence of COPD Stage II to IV is projected to increase from just under 1.2 million Australians in 2008 to 2.6 million by 2 050 – i.e., 5.6% of the population to 7.5%.
� COPD is projected to increase for men from 4.8% to 6.8% and for women from 6.2% to 8.2% .
���� The female share of total COPD is projected to fall slightly from 56.5% to 54.2% over the projection period.
� Of those with Stages II to IV, Stage II is most common (87% of Stage II to IV COPD). or around 334,581 people by 2050.

Economic impact of COPD
iii
PROJECTED PREVALENCE OF COPD BY GENDER, 2008 TO 2050 (NUMBER PERSONS)(A)
0
200,000
400,000
600,000
800,000
1,000,000
1,200,000
1,400,000
1,600,000
2008 2010 2020 2030 2040 2050
Males Females
(a) Note that the ‘kink’ in the chart reflects that the first time interval is two years (2008 to 2010) while the other
intervals represent a decade (2010 to 2020 etc). The chart outlines the projected prevalence of COPD in the total population on the basis of demographic ageing only, not taking into account any changes in age-gender
prevalence rates in the future (ie, assuming the same impacts of smoking in the future as currently).
Source: Access Economics estimates based on BOLD and NHS data.
In Australia, COPD increases a person’s risk of death 3.2 times relative to that of the general population. Using this relative risk and the prevalence data, there are an estimated 16,004 deaths due to COPD in 2008 (one death from COPD every 30 minutes).
Costs
In 2008, the financial cost of COPD was $8.8 billion . Of this:
� $6.8 billion (76.6%) was productivity lost due to lower employment, absenteeism and premature death of Australians with COPD;
� $0.9 billion (9.7%) was direct health system expenditure;
� $0.9 billion (10.0%) was the deadweight losses (DWLs) from transfers including welfare payments and taxation forgone; and
� $0.3 billion (3.6%) was other indirect costs such as aids and home modifications and the bring-forward of funeral costs.
Even though the contribution of carers for Australians with COPD is greatly valued, SDAC data do not identify more care on average than that provided to Australians without COPD of the same age and gender and, as such, the costs of informal care are not included in this report. Changes to the way these data are identified and collected may change this for future reports.
Additionally, the overall loss of wellbeing due to COPD is estimated as 350,102 Disability adjusted life years (DALYs). This equate s to a value of lost wellbeing (due to disability and premature death) of a further $89.4 billion.

Economic impact of COPD
iv
In per capita terms, the financial cost of COPD is $7,446 per person with COPD per year. If the value of lost wellbeing is included, the cost of COPD is $82,925 per person with COPD per year.
COPD, TOTAL COSTS BY TYPE OF COST AND BEARER , AUSTRALIA , 2008
IndividualsFamily/Friends
Federal Government
State and Territory
GovernmentsEmployers
Society/Other
Total
Burden of disease 89,398 0 0 0 0 0 89,398Health system costs 139 10 368 213 0 127 857Productivity costs 4,237 0 2,148 0 373 0 6,758Carer costs 0 0 0 0 0 0 0Other Indirect costs 0 132 62 62 0 62 318Deadweight losses 0 0 0 0 0 886 886Transfers -352 0 352 0 0 0 0Total financial costs 4,024 142 2,929 275 373 1,075 8,819Total costs including burden of disease 93,422 142 2,929 275 373 1,075 98,216
Burden of disease 75,480 0 0 0 0 0 75,480Health system costs 118 8 311 180 0 107 724Productivity costs 3,577 0 1,813 0 315 0 5,706Carer costs 0 0 0 0 0 0 0Other Indirect costs 0 111 52 52 0 52 268Deadweight losses 0 0 0 0 0 748 748Transfers -297 0 297 0 0 0 0Total financial costs 3,398 120 2,473 232 315 907 7,446Total costs including burden of disease 78,877 120 2,473 232 315 907 82,925
Total cost ($ million)
Cost per person with COPD ($)
Note: Even though the contribution of carers for Australians with COPD is greatly valued, SDAC data do not identify more care on average than that provided to Australians without COPD of the same age and gender and, as such, the costs of informal care are not included here. Changes to the way these data are identified and collected may change this for future reports.
The shares by each type of financial cost and by bearer are shown in the charts below.
FINANCIAL COSTS OF COPD, BY TYPE OF COST (LHS) AND BY BEARER (RHS) (% TOTAL) Health
System
Costs
9.7%
Productivity
Costs
76.6%
Other
Indirect
Costs
3.6%
DWL
10.0%
Individuals
45.6%
Family/
Friends
1.6%
Federal
Govt
32.9%
State Govt
3.0%
Employers
4.2%
Society/
Other
12.2%
Individuals with COPD bear 45.6% of the financial costs, and their families and friends bear a further 1.6%. The Federal Government bears just under one third (33.2%) of the financial

Economic impact of COPD
v
costs (mainly through taxation revenues forgone and welfare payments). State governments bear around 3.1% of the costs, while employers bear 4.2% and the rest of society bears the remaining 12.2%. If the burden of disease (lost wellbeing) is included, individuals bear 95.1% of the costs and Federal government bears 3.0%, with family and friends 0.1%, State governments 0.3%, employers 0.4% and others in society 1.1%.
Comparisons and cost effective interventions
Relative to other health disorders:
� COPD is more common in any year than the most common types of cancer, road traffic accidents, heart disease or diabetes;
� In terms of financial and total (ie, including the burden of disease) costs per case, COPD is more costly than cardiovascular disease, osteoporosis, hearing loss or arthritis.
Medical evidence suggests COPD is preventable and treatable and, more importantly, that early diagnosis combined with disease management programs (including removal of risk factors) could reduce the COPD disease burden in Australia. Since COPD is a progressive disease characterised by airflow limitation that is partially reversible, early diagnosis that leads on to initiation of proven management strategies through a range of treatment options offers patients the best chance to reduce the overall impact of COPD and to stem or slow the progression of the disease into the more severe stages. In recent years, progress has been made regarding management strategies and non-pharmacological interventions that have been shown to be cost effective.
The available literature evaluating self management programs in COPD, in some instances run by case managers and, in particular, including pulmonary rehabilitation (notably in Australia the Cecins et al, 2008, study) generally represent cost effective COPD interventions. Pulmonary rehabilitation programs, when based on evidence-based minimum standards, improve patient quality of life and also reduce healthcare system costs from COPD.
Recommendations
The following four key strategies represent key elements of a national approach to more cost effectively manage COPD in Australia.
1. Research
Existing prevalence data on COPD are generally based on self reported surveys which under-report the full extent of COPD.
� There is a need for more research into the prevalence and optimal management strategies for this condition, preferably a nationwide survey with regular follow up, which is based on recognised data collection methods for COPD rather than self reports. This could be conducted as, or in conjunction with, a sizeable longitudinal epidemiological study of COPD in Australia, in order to more fully understand the incidence, prevalence, mortality, comorbidity, trends and other issues relating to Australians with COPD.

Economic impact of COPD
vi
2. Diagnosis and early intervention
There is general agreement in the literature that COPD has long been under-diagnosed both in Australia and across the world. Under-diagnosis is a significant issue because the earlier COPD is diagnosed, the earlier steps can be taken to improve lung health and to prevent further damage to the airway. Early intervention is the key to reducing the progression of the disease into stages that cause significant impacts on quality of life and costs to the health system.
� Under-diagnosis should be addressed with the rollout of a nationwide education and spirometric testing campaign – initially for all current or ex-smokers over the age of 35.
� In order to address what can be complex diagnostic issues, clinician education is needed to increase awareness of the sound guidelines now available to guide the COPD diagnostic process.
� Early intervention strategies should include smoking cessation initiatives, reducing exposures to respiratory irritants, and early participation in management programs, such as pulmonary rehabilitation.
� Other cost effective interventions can also be implemented in a timely fashion based on assessment and evidence outlined in the COPD-X Guidelines (McKenzie et al, 2003).
� The Australian Lung Foundation further recommends an increase in the medical rebate for General Practitioners who conduct spirometry to reflect more accurately the cost of providing the service.
3. Health service delivery issues
In addition to prevention and early diagnosis, cost effective management strategies for COPD that enhance quality of life are currently under-utilised in Australia and need broader acceptance by clinicians and greater accessibility for patients.
� Education and awareness campaigns should be introduced together with the expansion of self management programs to focus on exacerbation management and disease control.
� Access to pulmonary rehabilitation that aims to reduce exacerbations and includes a focus on minimising employment impact should be extended to allow equitable access to all Australians regardless of where they live. This could be achieved through the addition of a Medicare item number to support pulmonary rehabilitation programs when referred by a medical practitioner.
� Comprehensive disease management plans including aggressive medical management should be provided for patients diagnosed at a moderate or severe stage;
� A more equitable system for the provision of Long Term Oxygen Therapy to ensure a similar level of provision for all people with COPD regardless of where they live in Australia. This could be managed by establishing a national registry or secretariat for home oxygen therapy.
� There is a need to address splits between funding jurisdictions that currently can lead to poorly integrated and inefficient care provision and decision making.
4. Employment issues
COPD has a significant employment and productivity impact, both through time away from work and from lower effectiveness while at work. Further, people with COPD have a significantly lower likelihood of attachment to the labour force.

Economic impact of COPD
vii
� Strategies that adequately diagnose and manage COPD in the early stages and that highlight employment continuation strategies have potential to lower the productivity costs associated with the disease.
� Greater workplace information and action is required in relation to exposures to and reduction of occupational risk factors (dust and chemicals that may affect people with COPD).
Access Economics 16 October 2008

Economic impact of COPD
1
1. INTRODUCTION
Access Economics was commissioned by The Australian Lung Foundation to estimate the economic impact of Chronic Obstructive Pulmonary Disease (COPD) in Australia in 2008. COPD is a progressive lung disease characterised by a persistent blockage of airflow from the lungs. It is an under-diagnosed, life-threatening condition that interferes with normal breathing and, while treatable, is not fully reversible (WHO 2008).
1.1 STRUCTURE OF THIS REPORT
The report is structured as follows.
� Chapter 2 estimates the prevalence of COPD in Australia by age, gender and severity in 2008, and provides future projections by decade to the year 2050. A description of COPD is also included, to provide background on symptoms, diagnosis, risk factors, morbidity and mortality and treatments.
� Chapter 3 estimates the direct health system costs of COPD in Australia, disaggregated by cost components (hospital, medical, pharmaceutical, diagnostics, residential aged care, allied health, research, other) for the year 2008.
� Chapter 4 estimates the indirect costs of COPD in Australia, disaggregated by cost components (productivity losses, costs of aids and modifications, and the deadweight losses (DWLs) associated with transfer payments) for the year 2008.
� Chapter 5 estimates the burden of disease of COPD in Australia, measured in terms of disability adjusted life years (DALYs), disaggregated by years of life lost due to premature death (YLL) and healthy years of life lost due to disability (YLD), and converted into a reasonable monetary equivalent.
� Chapter 6 discusses diagnosis issues and presents evidence of the cost effectiveness of early intervention strategies.
� Finally, Chapter 7 summarises the costs by type of cost and by who bears them, compares COPD with other diseases, and draws conclusions from the analysis of diagnostic issues and cost effective interventions to develop a set of recommendations for Commonwealth and State governments, building on strategies recommended in previous evidence-based reviews.
Specific methodologies relevant to each section are presented in each of the chapters. The remainder of this chapter covers methodological issues common across the report.
1.2 CROSS-CUTTING METHODOLOGICAL ISSUES
1.2.1 INCIDENCE AND PREVALENCE APPROACHES
This report utilises the prevalence (annual costs) approach to estimating the costs of COPD, as the data sources generally lend themselves to utilisation of such an approach, and as this avoids the uncertainty surrounding estimates of future treatment costs associated with the alternative incidence (lifetime costs) approach.
Prevalence is the ‘stock’ of a disease population in a given year, while incidence reflects the ‘flow’ into the disease population. For shorter term conditions or when a lifetime costing (cost per incident case) is desired, incidence based costing is an appropriate approach.

Economic impact of COPD
2
COPD is a long term disease and this report is interested in assessing its impact on the Australia economy in one year (2008). For this reason it is most appropriate to use the prevalence based costing approach.
The difference between incidence and prevalence approaches is illustrated in Figure 1-1, which considers three different cases:
� a, whose onset of COPD was in the past and who has incurred the associated costs up to the year in question, with associated lifetime costs of A + A*;
� b, whose onset of COPD was in the past and who has incurred the associated costs in 2008 as well as in the past and future, with associated lifetime costs of B + B* + B**; and
� c, whose onset of COPD occurred in 2008, with lifetime costs of C + C*.
Using an incidence approach, only cases like ‘c’ would be included, with the total cost estimate equivalent to the sum of all the costs in the base year (ΣC) plus the present value of all the future costs (ΣC*).
Using a prevalence approach, costs in 2008 relating to a, b and c would all be included, with total costs equal to Σ(A + B + C). Costs in all other years are excluded.
FIGURE 1-1: INCIDENCE AND PREVALENCE APPROACHES TO MEASUREMENT OF ANNUAL COSTS
2008
A* AB* B B**
C C*
1990 2015
���� Annual prevalence costs in the base year = Σ(A + B + C);
���� Lifetime cost for person c (= Incidence cost) = C + present value of C*
���� Lifetime cost for person b = B + present values of B* and B**
���� Lifetime cost for person a = A + present value of A*
1.2.2 CLASSIFICATION OF COSTS
Conceptual issues relating to the classification of costs include the following.
� Direct and indirect costs : Although literature often distinguishes between direct and indirect costs, the usefulness of this distinction is dubious, as the specific costs included in each category vary between different studies, making comparisons of results somewhat difficult. This report thus distinguishes instead between the health system expenditures, other financial expenditures and the loss of wellbeing (burden of disease).
� Real and transfer costs : Real costs use up real resources, such as capital or labour, or reduce the economy’s overall capacity to produce (or consume) goods and services. Transfer payments involve payments from one economic agent to another that do not use up real resources. For example, if a person loses their job, as well as the real production lost there is also less income taxation, where the latter is a transfer from an individual to the government. This important economic distinction is crucial in avoiding double-counting.

Economic impact of COPD
3
� Economic and non economic costs : Economic costs encompass loss of goods and services that have a price in the market or that could be assigned an approximate price by an informed observer. ‘Non-economic’ costs include the loss of wellbeing of the individual as well as of their family members and carers. This classification is ill-defined, since ‘non-economic’ costs are often ascribed values and the available methodologies are becoming more sophisticated and widely accepted. This report acknowledges that greater controversy and uncertainty still surround the valuation of ‘non-economic’ costs and thus the dollar estimates for the loss of wellbeing are presented separately.
� Prevention and case costs : It is important to distinguish between the costs following from and associated with a condition and costs directed towards preventing that condition. Prevention activities include public awareness and education about COPD and anti-smoking programs, for example.
There are three types of costs associated with COPD and its downstream impacts.
1 Direct financial costs to the Australian health sys tem include the costs of running hospitals and nursing homes (buildings, care, consumables), GP and specialist services reimbursed through Medicare and private funds, the cost of pharmaceuticals (Pharmaceutical Benefits Scheme and private) and of over-the-counter medications, allied health services, research and ‘other’ direct costs (such as health administration).
2 Other financial costs, which comprise the following.
���� Productivity costs include productivity losses of people with COPD such as long term employment impacts, absenteeism and/or premature mortality.
���� Carer costs are the value of care services provided in the community primarily by informal carers and not captured in health system costs.
���� Transfer costs comprise the deadweight loss (DWL) associated with government transfers such as taxation revenue forgone, welfare and disability payments.
���� Other costs include government and non-government expenditure on aids, equipment and modifications that are required to help cope with illness, transport and accommodation costs associated with receiving treatment, programs such as respite and community palliative care and the bring-forward component of funerals.
3 Non-financial costs are also very important—the disability, loss of wellbeing and premature death that result from COPD and its impacts. Although more difficult to measure, these can be analysed in terms of the years of healthy life lost, both quantitatively and qualitatively, known as the burden of disease.
Different costs of diseases are borne by different individuals or sectors of society. Clearly the individual with COPD bears costs, but so do employers, government, friends and family, co-workers, charities, community groups and other members of society.
It is important to understand how the costs are shared in order to make informed decisions regarding interventions.
While the person with COPD will usually be the most severely affected party, other family members and society (more broadly) also face costs as a result of COPD. From the employer’s perspective, depending on the impact of COPD, work loss or absenteeism may

Economic impact of COPD
4
lead to costs such as higher wages (ie, accessing skilled replacement short term labour) or alternatively lost production, idle assets and other non-wage costs. Employers might also face costs such as rehiring, retraining and where exposure was a result of inadequate safety considerations for employees – workers’ compensation claim costs.
While it may be convenient to think of these costs as being purely borne by the employer, in reality they may eventually be passed on to end consumers in the form of higher prices for goods and services. Similarly, for the costs associated with the health system and community services, although the Federal and State/Territory governments meet a large component of this cost, taxpayers (society) are the ultimate source of funds. However, for the purpose of this analysis, a ‘who writes the cheque’ approach is adopted, falling short of delving into second round or longer term dynamic impacts on society as a whole.
Society bears both the resource cost of providing services to people with COPD, and also the ‘deadweight’ losses (or reduced economic efficiency) associated with the need to raise additional taxation to fund the provision of services and income support.
Typically the groups who bear costs and pay or receive transfer payments are:
� people with COPD;
� friends and family (including informal carers);
� employers;
� Federal Government;
� state and local governments; and
� the rest of society (non-government, ie,, not-for-profit organisations, workers’ compensation groups etc).
Classifying costs by type and allocating them by who bears the costs enables a framework for analysis as outlined in Table 1-1.
the household

Economic impact of COPD
5
TABLE 1-1: SCHEMA FOR COST CLASSIFICATION
Conceptual group Subgroups Bearers of Cost Comments
1. Health System Costs
Costs by type of service (and prevalence in 2001)
People with COPD*, governments and society
2. Other Financial Costs
Productivity Costs
Lost productivity from temporary absenteeism
People with COPD, employer and governments#
Lost management productivity Employers and governments#
Long term lower employment rates
People with COPD and governments#
Includes premature retirement
Premature death People with COPD and governments#
Loss of productive capacity
Additional search and hiring replacement Employers Incurred when
prematurely leave job
Carer Costs Lost carer productivity Friends and family, and employers#
Includes both paid and unpaid work
Transfer Costs
Deadweight loss Society Relate to transfers from taxation, welfare etc
Other Costs Various, as able to be measured, but tend to be relatively small
Governments, people with COPD, Friends and family and society,
Aids, modifications, travel, accommodation, respite/ palliative care, funeral costs etc
3. Non-financial (loss of wellbeing)
Burden of disease (YLLs, YLDs, DALYs). People with COPD*
The net value of burden of disease should exclude other costs borne by the individual to avoid double counting
* Friends/family may also bear loss of wellbeing, health costs and lower living standards as a result of COPD; however, care is needed to assess the extent to which these are measurable, additional (to avoid double counting) and not follow-on impacts. For example, a spouse may pay a medical bill and children may share in lower household income when the COPD sufferer’s work hours are reduced – but as this is simply redistribution within family income it is not measured here. Moreover, if a family carer develops depression or a musculoskeletal disorder, it would be necessary to estimate the aetiological fraction attributable to COPD, allowing for other possible contributing factors.
# Where earnings are lost, so is taxation revenue and frequently also there are other transfers, such as welfare payments for disability/sickness/caring etc, so Governments share the burden.
1.2.3 CALCULATING PARAMETERS
There are essentially two ways of estimating each type of cost related to a specific type of disease:
� top-down : providing the total costs of broad based program elements (e.g., health system) and then adding together the broad high level cost parameters; or
� bottom-up : providing estimates of the number of cases in each disease category (‘n’) and then estimating the average cost related to each. The product of each piece is the total cost (eg, the wage rate for lost earnings multiplied by the average number of days off, and the number of people to whom this applies).
It is generally more desirable to use top-down national datasets in order to derive national cost estimates, to ensure that the whole is not greater or less than the sum of the parts. On the other hand, it is often difficult to obtain top-down estimates. In this report, the top-down

Economic impact of COPD
6
approach is applicable to health system and burden of disease costs and the bottom-up approach applies in other cases.
� Data on health system costs and burden of disease are derived from the Australian Institute of Health and Welfare (AIHW), which in turn are based on other data sources, such as the Australian Hospital Statistics and Bettering the Evaluation and Care of Health (BEACH) data for GP costs.
� Data on other financial costs are drawn from a variety of sources – for example, the literature (focussing on Australian literature but sometimes supplemented by international material), data from the Australian Bureau of Statistics (ABS) Survey of Disability, Ageing and Carers (SDAC) and Average Weekly Earnings (AWE), and some additional specific data sources mentioned in the body of this report.

Economic impact of COPD
7
2. PREVALENCE AND EPIDEMIOLOGY
2.1 DEFINITION AND SYMPTOMS
The World Health Organization (WHO, 2008) describes COPD not as a single disease but an umbrella term used to describe chronic lung diseases that cause limitations in lung airflow and progressive damage to lung function. The more familiar terms 'chronic bronchitis' and 'emphysema' are now included within the COPD diagnosis.
The more technical definition of COPD, frequently used in the international literature, was provided by the Global Initiative for Chronic Obstructive Lung Disease (GOLD)1, and has been broadly adopted in the new American Thoracic Society/ European Respiratory Society guidelines, with a focus outlining COPD as preventable and treatable.
For Australia and New Zealand, the GOLD outline has been adopted and then adapted by McKenzie et al (2003), and forms the background to ‘The COPD-X plan: Australian and New-Zealand Guidelines for the management of COPD’. The COPD-X guidelines are broadly in line with the GOLD guidelines.
GOLD (2008) COPD definition
A preventable and treatable disease with some significant extrapulmonary effects that may contribute to the severity in individual patients. Its pulmonary component is characterised by airflow limitation that is not fully reversible. The airflow limitation is usually progressive and associated with an abnormal inflammatory response of the lung to noxious particles or gases.
The chronic airflow limitation characteristic of COPD is caused by a mixture of small airway disease (obstructive bronchiolitis) and parenchymal destruction (emphysema), the relative contributions of which vary from person to person. Airflow limitation is best measured by spirometry, as this is the most widely available, reproducible test of lung function.
Because COPD often develops in long-time smokers in middle age, patients often have a variety of other diseases related to either smoking or ageing. COPD itself also has significant extrapulmonary (systemic) effects that lead to comorbid conditions (Agusti, 2005). Thus, COPD should be managed with careful attention also paid to comorbidities and their effect on the patient’s quality of life. A careful differential diagnosis and comprehensive assessment of severity of comorbid conditions should be performed in every patient with chronic airflow limitation.
The most common symptom of COPD is breathlessness or 'uncomfortable breathing’. Breathlessness in patients initially occurs with exertion and becomes progressively worse over time (AIHW, 2005). Other symptoms are excessive sputum production and a persistent cough, typically worse in the mornings with mucoid sputum; however, COPD is not simply a
1 The GOLD organisation was formed by US National Heart, Lung, and Blood Institute and the World Health Organization. A network of international experts, GOLD National Leaders have initiated investigations of the causes and prevalence of COPD in their countries, and developed innovative approaches for the dissemination and implementation of COPD management guidelines.
Economic impact of COPD
8
‘smoker's cough’, but a life threatening condition that may gradually lead to death if untreated. Other symptoms such as chest tightness, wheezing and airway irritability are also common (McKenzie et al, 2003). Due to the slow pace of disease progression, symptoms may not be recognised until COPD is in the more advanced stages. Patients often attribute breathlessness to ageing or lack of fitness.
Acute exacerbations, usually infective, occur from time to time and may lead to a sharp deterioration in coping ability and lung function. Fatigue, poor appetite and weight loss are more common in advanced disease. COPD often complicates other chronic conditions such as diabetes, chronic heart failure and cerebrovascular diseases, resulting in worse prognosis.
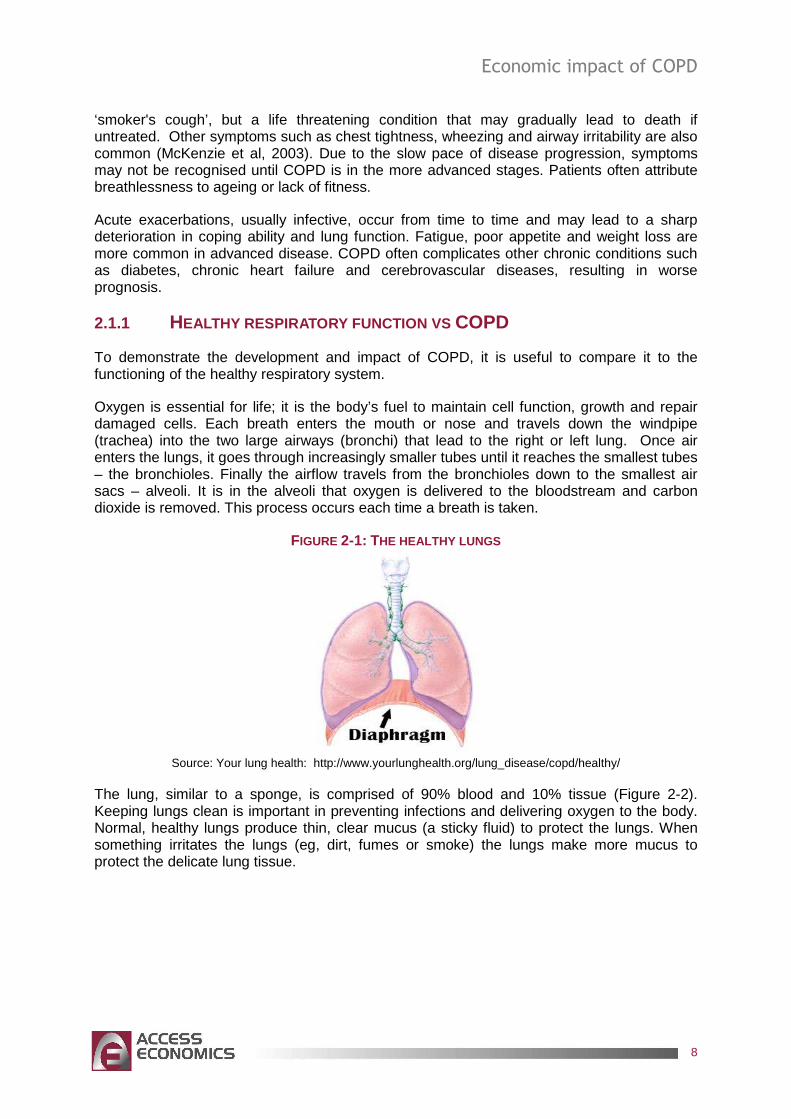
2.1.1 HEALTHY RESPIRATORY FUNCTION VS COPD
To demonstrate the development and impact of COPD, it is useful to compare it to the functioning of the healthy respiratory system.
Oxygen is essential for life; it is the body’s fuel to maintain cell function, growth and repair damaged cells. Each breath enters the mouth or nose and travels down the windpipe (trachea) into the two large airways (bronchi) that lead to the right or left lung. Once air enters the lungs, it goes through increasingly smaller tubes until it reaches the smallest tubes – the bronchioles. Finally the airflow travels from the bronchioles down to the smallest air sacs – alveoli. It is in the alveoli that oxygen is delivered to the bloodstream and carbon dioxide is removed. This process occurs each time a breath is taken.
FIGURE 2-1: THE HEALTHY LUNGS
Source: Your lung health: http://www.yourlunghealth.org/lung_disease/copd/healthy/
The lung, similar to a sponge, is comprised of 90% blood and 10% tissue (Figure 2-2). Keeping lungs clean is important in preventing infections and delivering oxygen to the body. Normal, healthy lungs produce thin, clear mucus (a sticky fluid) to protect the lungs. When something irritates the lungs (eg, dirt, fumes or smoke) the lungs make more mucus to protect the delicate lung tissue.

Economic impact of COPD
9
FIGURE 2-2: INSIDE THE LUNGS
Source: Your lung health: http://www.yourlunghealth.org/lung_disease/copd/healthy/
Tiny hair-like structures, called cilia, beat fast enough to move the mucus up the airways. As the mucus moves up the airways, irritants stick to the mucus and are removed with a cough. Smoking damages the cilia. The damaged cilia cannot efficiently move the mucus and, as a result, mucus builds up in the lungs and thickens. When this occurs the lungs become vulnerable to infections. The airways become swollen and begin to narrow when irritants stay in the lungs for an extended period of time.
Over time irritants that are not removed can destroy the lung's elastic ability, and the lungs become flaccid, making breathing harder. The loss of elasticity decreases the lungs’ ability to exhale and air remains trapped inside of the lungs, leading to hyperinflation of the lungs and making it difficult and uncomfortable to breath
2.1.2 COPD DISEASES
The COPD-X guidelines define:
� chronic bronchitis as daily sputum production for at least three months of two or more consecutive years; and
� emphysema as a pathological diagnosis consisting of alveolar dilation and destruction. The loss of lung elastic tissue may result in airway wall collapse during expiration and may lead to dynamic hyperinflation – increasing the work of breathing.
Chronic bronchitis occurs when repeated lung inflammation damages the lungs, causing scarring of the airways and excessive production of mucus, in turn resulting in the characteristic cough. Chronic bronchitis can exist alone, before, or during emphysema and is sometimes present with asthma.
FIGURE 2-3: CHRONIC BRONCHITIS
Source: Your lung health: http://www.yourlunghealth.org/lung_disease/copd/healthy/.

Economic impact of COPD
10
Emphysema develops when many of the small air sacs or alveoli in the lungs become stretched out and lose their elasticity or the ability to empty trapped air. This damage can cause the alveoli to rupture, and form one large air space instead of many small ones. The destruction of healthy air sacs makes it difficult for the lung to work properly as the surface area of the lung exposed to oxygen is significantly reduced. As a result there are fewer alveoli to deliver oxygen to the bloodstream. The damage is progressive and, as lung tissue does not repair itself, the damage becomes permanent.
FIGURE 2-4: EMPHYSEMA
Source: Your lung health: http://www.yourlunghealth.org/lung_disease/copd/healthy/
2.2 RISK FACTORS AND DIAGNOSIS
2.2.1 RISK FACTORS
The key risk factors reported by McKenzie et al (2003) have been adapted from the GOLD analysis and are outlined in Table 2-1. The most important risk factor for COPD in the developed world is cigarette smoking although, in Australia, environmental factors are also important, showing a direct relationship between air pollution and hospital admissions for COPD (Mannino and Braman, 2007). Genetics and age are other key risk factors.
TABLE 2-1: RISK FACTORS FOR COPD (FROM COPD-X GUIDELINES)
Source: McKenzie et al (2003).

Economic impact of COPD
11
� Smoking is the strongest risk factor for COPD. Research indicates a close relationship between the amount of tobacco smoked and the rate of decline in forced expiratory flow in one second (FEV1) (James et al, 2005). It is estimated that in 1998 (AIHW, 2005a):
���� about 70% of COPD in men and 60% in women was attributable to smoking;
���� about 90% of COPD among smokers (men and women) was attributable to smoking; and
���� about 71% of deaths from COPD (74% for men and 65% for women) were attributable to smoking.
� Genes: The genetic risk factor that is best documented is a severe hereditary deficiency of alpha-1 antitrypsin or AAT. AAT is a substance normally present in the blood and its role is to protect the lungs from damage. Over the course of a lifetime, the delicate tissues of the lungs are exposed daily to a variety of inhaled materials, such as pollutants, germs, dust and cigarette smoke. AAT helps the body fight against the damage caused by these pollutants. The estimated 1 in 2,500 Australians with a deficiency in AAT have too low a level to protect the lungs from the damaging enzymes produced by the body in reaction to the pollutants. As a result, they are at greater risk of developing COPD.
� Environmental agents may contribute to the risk of developing COPD, either independently or in conjunction with tobacco smoking. Occupational exposures include organic and inorganic dusts, chemical agents and fumes (Jaen, 2006). Occupational exposures account for a substantial proportion (ie, from 10-20%) of either symptoms or functional impairment consistent with COPD (Balmes, 2003). There is also evidence that high levels of urban air pollution are harmful to individuals with existing heart or lung disease but the role of outdoor air pollution in causing COPD is unclear (GOLD, 2008).
� Gender: Although research has examined the role of gender in the prevalence, progression and prognosis of COPD (Mannino and Braman, 2007), no clear answers have been found so far. Studies from developed countries show that the prevalence of the disease is now almost equal in men and women, probably reflecting the changing patterns of tobacco smoking.
� Age: COPD is most frequently diagnosed in people aged 40 years or older, although the exposure to risk factors may have occurred much earlier in life.
� A history of severe childhood respiratory infection has been associated with reduced lung function and increased respiratory symptoms in adulthood. However, susceptibility to viral infections may be related to another factor, such as birthweight, that itself is related to COPD.
� Socioeconomic status: There is evidence that the risk of developing COPD is inversely related to socioeconomic status (Mackenzie et al, 2003). Although statistically an independent risk factor, it is not clear whether this reflects exposures to indoor and outdoor air pollutants, poor nutrition, or other factors that are related to low socioeconomic status.
� Under-diagnosis : Between 40% and 80% of people with COPD may elude diagnosis (Tinkelman, 2006). Due to the insidious and slow development of the disease and the existence of complicating factors, COPD is often identified only when people experience exacerbations or become disabled. Under-diagnosis is important as it contributes to a failure to access early intervention and hence limits the potential to ameliorate disease progression (see greater detail in Section 6.1).

Economic impact of COPD
12
2.2.2 DIAGNOSIS
Clinical diagnosis of COPD should be considered in any patient who has breathlessness, chronic cough or sputum production and/or a history of exposure to key risk factors (GOLD, 2007). Australian guidelines (McKenzie et al, 2003) identify that COPD should be considered in all smokers and ex-smokers over the age of 35 years as well as in patients exhibiting symptoms (Table 2-2).
TABLE 2-2: KEY INDICATORS FOR CONSIDERING A DIAGNOSIS OF COPD
Breathlessness that is Progressive, usually worse with exercise, persistent.
Chronic cough May be intermittent and may be unproductive.
Chronic sputum production
Any pattern of chronic sputum production may indicate COPD.
History of exposure to risk factors
Tobacco smoke, occupational dusts, chemicals or smoke.
The sensitivity of physical examination for detecting mild or moderate COPD is poor (Badgett et al, 1993). Wheezing is not an indicator of severity of disease and is often absent in stable but severe COPD. The presence and severity of airflow limitation are impossible to determine by clinical signs (Badgett et al, 1993). Objective measurements such as spirometry are essential to diagnosis (as is blood pressure measurement in hypertension, blood lipids in hyperlipidaemia, body mass in obesity and blood glucose in diabetes).
Spirometry is the most effective method to diagnose and monitor the progress of COPD. The best way to improve the detection of COPD in the population is to increase the use of spirometry in primary care settings (Mannino, 2007). In Australia people aged 35 years or older who currently smoke or have quit smoking should have a spirometry test. The test is painless, can be done in a GP setting or laboratory, is reproducible and can act as a tool to assist people with smoking cessation. The test measures a number of parameters important in the diagnosis of COPD:
� FEV1 – is the maximum volume of air that can be exhaled in one second after a maximal inspiration (‘forced expiratory volume’);
� FVC – forced vital capacity is the maximum volume of air which can be exhaled at maximum effort after a maximal inspiration;
� FEV1/FVC ratio – the ratio of forced expiratory volume at 1 second to forced vital capacity which, written as a percentage, provides the information needed to make the initial diagnosis of COPD.
2.3 MORBIDITY AND SEVERITY
Breathlessness causes changes in quality of life and functionality, with the need to adapt activities to help decrease the impact. Physical activities may take longer to complete. A person with COPD may take frequent rest periods in order to be able to complete an everyday activity, such as vacuuming, mowing a yard or cooking a meal. Daily activities, such as walking up a short flight of stairs, or heading out to the shops may become very difficult as the disease worsens, particularly if left undiagnosed and untreated. Quality of life declines markedly and depression is often a comorbidity diagnosed with COPD patients.

Economic impact of COPD
13
‘COPD is an important cause of disability, and is linked to comorbid diseases, such as depression and cardiovascular disease, which add to the large economic burden associated with this disorder. Comorbidities also add to the complexities of diagnosis.’ Mannino et al (2007)
The COPD-X guidelines incorporate a simple assessment to measure the functional limitations from breathlessness due to COPD in clinical practice (Table 2-3).
TABLE 2-3: FUNCTIONAL LIMITATION DUE TO BREATHLESSNESS (MEDICAL RESEARCH COUNCIL )
Grade Symptom complex
0 ‘I only get breathless with strenuous exercise.’
1 ‘I get short of breath when hurrying on the level or walking up a slight hill.’
2 ‘I walk slower than most people of the same age on the level because of breathlessness or have to stop for breath when walking at my own pace on the level.’
3 ‘I stop for breath after walking about 100 yards or after a few minutes on the level.’
4 ‘I am too breathless to leave the house’ or ‘I am breathless when dressing.’
Source: Modified Medical Research Council Dyspnoea Scale. Mahler and Wells (1988).
The GOLD scale has achieved relatively broad acceptance and incorporates spirometric testing of lung function to diagnose COPD and determine its stage or severity. While it can be argued that this method oversimplifies the complexity of accurately diagnosing COPD, the simplification is arguably necessary to advance understanding of the disease and to assist with earlier diagnosis and treatment. The four stages of COPD are outlined in the box below.
GOLD (2008) outline of the stages of COPD
Stage I: Mild COPD - Characterised by mild airflow limitation (FEV1/FVC < 0.70; FEV1 ≥ 80% predicted). Symptoms of chronic cough and sputum production may be present, but not always. At this stage, the individual is usually unaware that his or her lung function is abnormal.
Stage II: Moderate COPD - Characterised by worsening airflow limitation (FEV1/FVC < 0.70; 50% ≤ FEV1 < 80% predicted), with breathlessness typically developing on exertion and cough and sputum production sometimes also present. This is the stage at which patients typically seek medical attention because of chronic respiratory symptoms or an exacerbation of their disease.
Stage III: Severe COPD - Characterised by further worsening of airflow limitation (FEV1/FVC < 0.70; 30% ≤ FEV1 < 50% predicted), greater breathlessness, reduced exercise capacity, fatigue, and repeated exacerbations that almost always have an impact on patients’ quality of life.
Stage IV: Very Severe COPD - Characterised by severe airflow limitation (FEV1/FVC < 0.70; FEV1 < 30% predicted or FEV1 < 50% predicted plus the presence of chronic respiratory failure). Respiratory failure is defined as an arterial partial pressure of O2 (PaO2) less than 8.0 kPa (60 mm Hg), with or without arterial partial pressure of CO2 (PaCO2) greater than 6.7 kPa (50 mm Hg) while breathing air at sea level. Respiratory failure may also lead to effects on the heart such as cor pulmonale (right heart failure). Patients may have Stage IV: Very Severe COPD even if the FEV1 is > 30% predicted whenever these complications are present. At this stage, quality of life is very appreciably impaired and exacerbations may be life threatening.

Economic impact of COPD
14
GOLD Stage I of COPD represents a mild form of the disease – where there is little impact on the individual and he or she is often unaware they have COPD. Whether GOLD stage I should be regarded as early COPD is debated as lung function falls with age in healthy individuals, and thus overdiagnosis may occur in older age groups (Buist et al 2007). Nevertheless, Stage I is still associated with declining lung function as a result of COPD and is therefore important to recognise and treat. If left unmanaged, many people with Stage I COPD will go on to develop the more serious COPD as the disease progresses to Stage II or higher. At this point there are significant impacts on the individual’s quality of life as well as on the financial costs associated with the disease. It is therefore imperative to diagnose and manage the disease early.
2.4 MANAGING COPD AND EXACERBATIONS
COPD is preventable but not curable. While disease prevention is the ultimate goal, once COPD has been diagnosed, effective management should be aimed at the following goals:
� relieve symptoms;
� prevent disease progression;
� improve exercise tolerance;
� improve health status;
� prevent and treat complications;
� prevent and treat exacerbations; and
� reduce mortality.
The GOLD (2008) report ‘Global Strategy for the Diagnosis, Management, and Prevention of COPD’ outlines strategies for management and prevention of COPD. The clinical management of COPD based on the GOLD methodology has four key components: (1) assess and monitor disease; (2) reduce risk factors; (3) manage stable COPD; (4) manage exacerbations.
McKenzie et al ‘The COPD-X plan: Australian and New Zealand guidelines for the management of COPD’ – presents the COPD-X guidelines for the diagnosis, management and prevention of COPD modelled on the global strategy but adapted specifically for the Australian and New Zealand clinical setting.
The COPD-X guidelines reflect new research and a better understanding of COPD, which is progressing at a rapid rate as the scale of COPD prevalence is better understood. Importantly, the COPD-X guidelines have moved towards placing a stronger emphasis on the role of non-pharmacological interventions and the promotion of self management. The COPD-X action strategy (Table 2-4) outlines key management components to minimise health system costs (where possible) and to maximise quality of life for COPD patients. COPD-X elements are then summarised briefly in the next sections.

Economic impact of COPD
15
TABLE 2-4: COPD-X SUMMARY OF GUIDELINES

Economic impact of COPD
16
Source: COPD-X guidelines.
2.4.1 CONFIRM DIAGNOSIS
Section 2.2.2 on Diagnosis noted that anyone who reports breathlessness, chronic cough or sputum production or who has risk factors for COPD should be considered for clinical diagnosis using spirometry. A post bronchodilator FEV1/FVC<0.70 confirms the presence of airflow limitation that is not fully reversible.
Diagnosis should be accompanied by assessment of the impact of COPD based on the patient’s symptoms, the extent of the lung function abnormality and the presence of complicating factors. The assessment of blood gas tensions should also be considered in patients with an FEV1<50% predicted or clinical signs of respiratory failure or right heart failure.
Lower costs and burden of disease can result if diagnosis is achieved early and optimally assessed and treated, as treatment can significantly reduce exacerbations and health care separations associated with COPD.

Economic impact of COPD
17
2.4.2 OPTIMISE FUNCTION
Given that COPD is a progressive disease, lung function can be expected to worsen even with the best available care. Pharmacotherapy for COPD has been used to control symptoms, but emerging evidence points to them improving quality of life, increasing exercise tolerance, and in some cases slowing speed of decline. Therefore, pharmacotherapy for COPD is used to optimise function and reduce complications.
� Bronchodilator medications are central to the symptomatic management of COPD. They are given on an as-needed basis or on a regular basis to prevent or reduce symptoms and exacerbations.
� The principal bronchodilator treatments are beta2-agonists and anticholinergics, used singly or in combination.
� Regular treatment with long-acting bronchodilators is more effective and convenient than treatment with short-acting bronchodilators
� The addition of regular treatment with inhaled glucocorticosteroids to bronchodilator treatment is appropriate for symptomatic COPD patients with an FEV1 < 50% predicted (Stage III and IV: Severe and Very Severe COPD) and repeated exacerbations.
� Chronic treatment with systemic glucocorticosteroids should be avoided because of an unfavourable benefit-to-risk ratio.
� In COPD patients, influenza vaccines can reduce serious illness. Pneumococcal polysaccharide vaccine is recommended for COPD patients 65 years and older and for COPD patients younger than age 65 with an FEV1 < 40% predicted.
� Pulmonary rehabilitation reduces breathlessness, anxiety and depression; improves exercise capacity and quality of life and has been shown to reduce hospitalisation.
� The long term administration of oxygen (>15 hours per day) to patients with chronic respiratory failure has been shown to increase survival.
2.4.3 PREVENT DETERIORATION
The overall approach to preventing deterioration should be individualised to address symptoms and improve quality of life, through health education to improve skills, ability to cope with illness and health status. A key element in preventing deterioration is management of associated risk factors.
� Decreasing the total personal exposure to tobacco smoke, occupational dusts and chemicals, and indoor and outdoor air pollutants are important goals to prevent the onset and progression of COPD.
� Smoking cessation is the single most effective – and cost effective – intervention in most people to reduce the risk of developing COPD and stop its progression.
� Smoking cessation counselling combined with pharmacotherapy are the most effective methods in assisting people to stop smoking
� Comprehensive tobacco control policies and programs with clear, consistent and repeated non-smoking messages can be valuable.
� Efforts to reduce smoking through public health initiatives should also focus on passive smoking to minimise risks for non-smokers.

Economic impact of COPD
18
� Many occupationally induced respiratory disorders can be reduced or controlled through a variety of strategies aimed at reducing the exposure to inhaled particles and gases.
� Reducing the risk from indoor and outdoor air pollution is feasible and requires a combination of public policy and protective steps taken by individuals.
� All health professionals should be encouraged and enabled to become involved in promoting non-smoking messages and supporting community programs that minimize smoking, as well as monitoring work environments.
2.4.4 DEVELOP SUPPORT NETWORK AND SELF -MANAGEMENT PLAN
A self-management plan developed in conjunction with the patient's GP and specialist can be useful to indicate how to approach and step-up treatment during exacerbations. The plan should include the development of support networks e.g., through education of carers, other support people and family who may aid in managing COPD. Self management or action plans should have progressive monitoring and review to determine if any modification is required to the treatment recommendations and to identify any complications that may develop over time.
2.4.5 MANAGE EXACERBATIONS
Exacerbations are defined as events in the natural course of the disease that are beyond normal day-to-day variations, are acute in onset, and may warrant a change in regular medication in a patient with underlying COPD.
� The most common causes of an exacerbation are infection of the tracheobronchial tree and air pollution, but the cause of about one-third of severe exacerbations cannot be identified.
� Inhaled bronchodilators (particularly inhaled beta2-agonists with or without anticholinergics) and oral glucocorticosteroids are effective treatments for exacerbations of COPD.
� Early treatment with antibiotics where there are clinical signs of airway infection (eg, increased sputum purulence) reduces the severity of the COPD exacerbation and speeds recovery.
� Non-invasive mechanical ventilation in exacerbations improves respiratory acidosis, increases pH, decreases the need for endotracheal intubation, and reduces PaCO2 respiratory rate, severity of breathlessness, the length of hospital stay, and mortality.
� Medications and education to help prevent future exacerbations should be considered as part of follow-up, as exacerbations affect the quality of life and prognosis of patients with COPD.
� Developing self-management or written action plans for responding to worsening symptoms may prevent or reduce severity of exacerbations.
Emergency department visits and hospitalisation (eg, for respiratory failure) are more likely during acute exacerbations, which can be life-threatening. Hospital mortality for such patients is about 10%, reaching 40% one year after discharge, and higher for patients aged over 65 years. In one study of more than 1,000 patients admitted to several hospitals with an acute exacerbation of severe COPD, about 50% were admitted with a respiratory infection, 25% with congestive cardiac failure, and 30% with no known cause for the exacerbation. Exacerbations can also be caused by viral infection and by non-infectious causes, such as

Economic impact of COPD
19
left ventricular failure, pulmonary embolus, and possibly other factors, such as air pollution (McKenzie et al, 2003).
2.5 MORTALITY AND SURVIVAL RATES
According to WHO estimates, 210 million people have COPD worldwide, with one death from COPD every 10 seconds. Total deaths from COPD are projected to increase in the next 20 years, making it the third leading cause of death in the world by 2030 (WHO, 2008), after ‘coronary heart disease’ and ‘stroke and other cerebrovascular diseases’.
COPD is also a major cause of death in Australia, and a major source of comorbidities in reported deaths from other diseases, particularly lung cancer and cardiovascular disease. The risk of dying from an exacerbation of COPD is closely related to the development of respiratory acidosis, the presence of significant comorbidities and the need for ventilatory support.
Frith et al (2004) found that COPD is the third most burdensome disease in Australians and the fourth most common cause of death, causing significant emotional and physical impairment and associated with substantial direct and indirect economic costs. Frith et al (2008) reported that mortality is usually premature by an average of seven years, and that this is generally preceded by many years of morbidity featuring increasing impairment as the disease progresses and increasing frequent exacerbation of symptoms.
For Australia, the relative risk (RR) of mortality attributable to COPD was calculated by comparing the deaths to population ratio of the general population with the deaths to population ratio of people with COPD. Overall, this amounted to a RR of 3.2 for COPD – and was higher for females compared to males – consistent with the epidemiology of the disease (Table 2-5). This RR was then applied to the 2008 prevalence estimates of COPD (see next Section 2.6) to estimate that there are around 16,004 deaths due to COPD in 2008 .
TABLE 2-5: RELATIVE RISK OF MORTALITY DUE TO COPD
Age
All deaths to Population
(A)
COPD deaths to Population
(B)
Relative Risk
(RR=B/A)Male 15-24 0.1% 0.5% 7.1
25-64 0.3% 0.3% 2.265-74 2.1% 1.2% 1.575+ 7.8% 3.1% 1.4
Female 15-24 0.0% 0.5% 18.525-64 0.2% 0.4% 3.565-74 1.2% 1.2% 2.075+ 6.4% 2.8% 1.4
Persons 15-24 0.1% 0.5% 10.225-64 0.2% 0.4% 2.665-74 1.7% 1.2% 1.775+ 7.0% 2.9% 1.4
Total 0.7% 1.5% 3.2 Source: Access Economics estimations, ABS, AIHW.
However, due to under-diagnosis and complications associated with comorbidities (which are allocated to other disease categories), the actual AIHW reported figure of deaths from COPD

Economic impact of COPD
20
is significantly lower than the attributable mortality estimate here. The AIHW reported (Begg et al, 2007) that COPD was the underlying cause of 5,378 deaths in 2003 (4.2% of all deaths). COPD was also listed 7,219 times as an associated cause of death, most commonly in relation to cases where a circulatory disease was listed as the underlying cause of death (AIHW, 2005a). The AIHW estimate higher death rates for males compared to females, reflecting higher prevalence in males and females, and much lower prevalence overall than estimated in this report, since their data are based on self-reported sources rather than epidemiological sources.
� Reflecting declining prevalence rates in males in particular, the death rate linked to COPD fell over the 25 years to 2005. In males, the age-standardised death rate fell every year for the latest 10 years, except in 2002 (during which there was a small rise). In females, the rate appeared to level off after peaking in 1997, with a small fall in 2005.
� The declining COPD related death rate appears to mainly reflect lower smoking rates, particularly among males (AIHW, 2008). Improvements in treatment methods may have also reduced mortality rates.
2.6 PREVALENCE ESTIMATES
The Burden of Obstructive Lung Disease (BOLD) study was an international review of COPD prevalence, its risk factors and burden which also covered Australia. Participants across 12 countries (n=9,425) were recruited with use of population-based sampling and completed post-bronchodilator spirometry testing plus questionnaires about respiratory symptoms, health status, and exposure to COPD risk factors. COPD prevalence estimates were based on the Global Initiative for Chronic Obstructive Lung Disease (GOLD) staging criteria adjusted for the target population.
Prevalence estimates in Australia were derived by combining data from the BOLD population-based prevalence study (Buist et al, 2007) and estimates of COPD from the ABS National Health Survey (NHS).
The Australian part of BOLD involved a survey of 541 adults aged 40 years and older. Buist et al (2007) reported results for COPD by stage (for all stages) and by age and gender (for GOLD Stage II or higher). This was then combined (with the assumption that Stage I was distributed in the same manner across age and gender as the other groups) to produce an overall baseline prevalence estimate based on the BOLD data as shown in Table 2-6. The data show around 18.6% prevalence in the Australian popu lation aged 40 years or older .

Economic impact of COPD
21
TABLE 2-6: BOLD PREVALENCE RATES BY AGE AND GENDER (%) – GOLD STAGES I–IV Age Group Males Females Persons0-4 n/a n/a n/a5-9 n/a n/a n/a10-14 n/a n/a n/a15-19 n/a n/a n/a20-24 n/a n/a n/a25-29 n/a n/a n/a30-34 n/a n/a n/a35-39 n/a n/a n/a40-44 5.6% 6.5% 6.1%45-49 5.6% 8.0% 6.8%50-54 8.4% 11.1% 9.8%55-59 8.4% 11.1% 9.8%60-64 28.4% 22.6% 25.5%65-69 28.4% 22.6% 25.5%70-74 46.2% 39.0% 42.5%75-79 46.2% 39.0% 42.3%80-84 46.2% 39.0% 42.0%85-89 46.2% 39.0% 41.6%90+ 46.2% 39.0% 41.0%Total 18.7% 18.5% 18.6%
Source: BOLD data and Access Economics estimates.
As discussed above in Section 2.3, the GOLD Stage I of COPD represents a mild airflow limitation – where symptoms of chronic cough and sputum production may or may not be present. There is little impact on the individual and he or she is often unaware of the disease. Whether GOLD stage I should be regarded as early COPD is debated as lung function falls with age in healthy individuals, and thus overdiagnosis may occur in older age groups (Buist et al 2007).
� Nevertheless, Stage I is still associated with declining lung function as a result of COPD and is therefore important to recognise and treat. If left unmanaged, many people with Stage I COPD will go on to develop the more serious COPD as the disease progresses to Stage II or higher. At this point there are significant impacts on the individual’s quality of life as well as on the financial costs associated with the disease. It is therefore imperative to diagnose and manage the disease early.
The economic cost of COPD is modest in Stage I. Th e impact of the disease in terms of utilisation of health services and impairment of quality of life manifests in larger part from Stage II, and deteriorates thereafter. A ccess Economics, in consultation with The Australian Lung Foundation, has therefore taken a conservative approach to estimating the costs of COPD, focusing on the more serious Stages II to IV. This is a reasonable course of action given that the bulk of the disease impact and costs represent themselves in people with Stage II or hig her COPD. When only Stages II to IV of COPD are included, the BOLD estimates suggest around 10.2% prevalence in the Australian population aged 40 years or older (Table 2-7 ).

Economic impact of COPD
22
TABLE 2-7: BOLD PREVALENCE RATES BY AGE AND GENDER (%) – GOLD STAGES II–IV Age Group Males Females Persons0-4 n/a n/a n/a5-9 n/a n/a n/a10-14 n/a n/a n/a15-19 n/a n/a n/a20-24 n/a n/a n/a25-29 n/a n/a n/a30-34 n/a n/a n/a35-39 n/a n/a n/a40-44 2.7% 3.4% 3.1%45-49 2.7% 4.9% 3.8%50-54 4.1% 6.8% 5.5%55-59 4.1% 6.8% 5.5%60-64 13.8% 13.8% 13.8%65-69 13.8% 13.8% 13.8%70-74 22.4% 23.8% 23.1%75-79 22.4% 23.8% 23.2%80-84 22.4% 23.8% 23.2%85-89 22.4% 23.8% 23.3%90+ 22.4% 23.8% 23.4%Total 9.1% 11.2% 10.2%
Further, the NHS reported prevalence of COPD by age and gender (broadly defined as people with chronic bronchitis and emphysema) based on self-reported data from survey participants (Table 2-8). NHS prevalence extended to people aged less than 40 years. Prevalence in the 0-19 year olds reported in the NHS was higher than expected, but this is unlikely to have a major impact on overall findings.
TABLE 2-8: NHS PREVALENCE RATES OF COPD BY AGE AND GENDER (%) Age Group Males Females Persons0-4 1.4% 1.2% 1.3%5-9 1.4% 1.2% 1.3%10-14 1.4% 1.2% 1.3%15-19 1.5% 2.0% 1.7%20-24 1.5% 2.0% 1.7%25-29 1.4% 2.0% 1.7%30-34 1.4% 2.0% 1.7%35-39 1.9% 3.4% 2.6%40-44 1.9% 3.4% 2.6%45-49 2.6% 3.0% 2.8%50-54 2.6% 3.0% 2.8%55-59 4.2% 5.3% 4.7%60-64 4.2% 5.3% 4.7%65-69 7.4% 6.7% 7.1%70-74 7.4% 6.7% 7.1%75-79 11.0% 7.2% 8.8%80-84 11.0% 7.2% 8.8%85-89 11.0% 7.2% 8.8%90+ 11.0% 7.2% 8.8%Total 2.8% 3.2% 3.0%
Source: ABS NHS data and Access Economics estimates.

Economic impact of COPD
23
NHS estimates for the under-40 age groups were combined with those of the BOLD study to obtain a picture of COPD prevalence across the whole Australian population. This approach is consistent with the fact that BOLD and NHS prevalence did not vary greatly at ages between 40 and 60 years (BOLD was, as expected, slightly higher due to picking up people who did not self-report, likely due to under-diagnosis). The disparity emerged later on as the BOLD study implemented more accurate spirometry testing methodology to estimate prevalence rather than relying on self-reported data (Figure 2-5).
FIGURE 2-5: COPD PREVALENCE BY AGE (% POPULATION): STAGES II TO IV
0%
5%
10%
15%
20%
25%
BOLD
NHS
Source: BOLD and NHS data and Access Economics estimates.
2.6.1 BASELINE PREVALENCE ESTIMATES
Combining the results of the BOLD Stages II to IV and NHS data allowed an estimation of population prevalence for COPD in Australia in 2008 (Table 2-9). Overall, the prevalence of COPD is higher for females (6.2%) compared to males (4.8%). This is likely to reflect the fact that females who are non-smokers appear to have higher prevalence of COPD compared to male non-smokers. This result is broadly consistent with the findings of Behrendt (2008) who studied the impact of mild and moderate to severe COPD in non-smokers in the United States (US).

Economic impact of COPD
24
TABLE 2-9: BASELINE PREVALENCE RATES OF COPD (STAGES II TO IV) BY AGE AND GENDER (%) Age Group Males Females Persons0-4 1.4% 1.2% 1.3%5-9 1.4% 1.2% 1.3%10-14 1.4% 1.2% 1.3%15-19 1.5% 2.0% 1.7%20-24 1.5% 2.0% 1.7%25-29 1.4% 2.0% 1.7%30-34 1.4% 2.0% 1.7%35-39 1.9% 3.4% 2.7%40-44 2.7% 3.4% 3.1%45-49 2.7% 4.9% 3.8%50-54 4.1% 6.8% 5.5%55-59 4.1% 6.8% 5.5%60-64 13.8% 13.8% 13.8%65-69 13.8% 13.8% 13.8%70-74 22.4% 23.8% 23.1%75-79 22.4% 23.8% 23.2%80-84 22.4% 23.8% 23.2%85-89 22.4% 23.8% 23.3%90+ 22.4% 23.8% 23.4%Total 4.8% 6.2% 5.6%
Source: Access Economics estimates based on BOLD and NHS data.
Figure 2-6 shows the estimated prevalence of COPD for 2008, calculated using the prevalence rates from Table 2-9 and figures for the Australian population for 2008 (from the Access Economics Demographic Model based on ABS demographic data).
� In 2008, around 1.2 million Australians (0.5 million males a nd 0.7 million females) are estimated to have COPD .
���� If mild Stage I COPD was included in the estimates, this number would rise to 2 million people in 2008.
� Of all people with COPD, 47% are of working age (15-64 years).
� COPD is particularly prevalent in older Australians – aged over 60 years – who comprise 62% of people with COPD.
� The prevalence of COPD in the over-30 population is 8.2%.

Economic impact of COPD
25
FIGURE 2-6: PREVALENCE OF COPD, 2008 (PERSONS)
0
10,000
20,000
30,000
40,000
50,000
60,000
70,000
80,000
90,000
0-4 5-9 10-14
15-19
20-24
25-29
30-34
35-39
40-44
45-49
50-54
55-59
60-64
65-69
70-74
75-79
80-84
85-89
90+
Per
sons
Age cohort
Males
Females
Source: Access Economics estimates based on BOLD and NHS data.
2.6.2 PROJECTIONS OF FUTURE PREVALENCE
Table 2-10 outlines the projected prevalence of COPD in the total population on the basis of demographic ageing only, not taking into account any changes in age-gender prevalence rates in the future (ie, assuming the same impacts of smoking in the future as currently).
� The prevalence of COPD is projected to increase as the population ages from around 1.2 million Australians in 2008 to 2.6 million by 2 050 – i.e., 5.6% of the population to 7.5% bearing in mind these estimates only include BOLD Stages II to IV and NHS prevalence data.
���� If the mild BOLD Stage I was also included in the projections, 4.5 million people would be estimated to have COPD by 2050.
� COPD is projected to increase for men from 4.8% to 6.8% (ie, to 1.2 million males in 2050) and for women from 6.2% to 8.2% (1.4 million females) (Figure 2-7).
� The female share of total COPD is projected to fall slightly from 56.5% to 54.2% over the projection period.

Economic impact of COPD
26
TABLE 2-10: COPD BY AGE AND GENDER , PROJECTED PREVALENCE TO 2050
Age cohort 2008 2010 2020 2030 2040 20500-9 19,335 19,618 21,602 23,549 24,924 27,12210-19 21,361 21,599 22,259 24,409 26,679 28,34920-29 22,116 23,140 25,496 26,391 29,051 31,80630-39 25,293 25,511 29,358 32,376 33,689 37,11940-49 41,090 41,766 44,277 51,022 56,121 58,90050-59 55,010 56,859 63,723 67,781 78,310 86,36660-69 134,928 146,011 183,661 207,643 222,764 259,03470+ 195,725 207,995 309,448 435,760 553,831 653,355Total males 514,858 542,499 699,825 868,931 1,025,369 1,1 82,051% of males 4.8% 5.0% 5.4% 6.1% 6.5% 6.8%% of total prevalence 43.5% 43.7% 44.5% 44.9% 45.2% 45.8%
0-9 15,715 15,923 17,559 19,138 20,251 22,033
10-19 22,424 22,755 23,230 25,496 27,933 29,665
20-29 29,560 30,741 33,428 34,451 37,946 41,53330-39 41,849 41,949 46,602 50,756 52,504 57,85340-49 64,066 64,759 67,355 74,907 81,594 84,90250-59 92,194 95,684 106,180 110,464 124,098 134,80560-69 135,479 147,273 190,363 212,167 221,858 250,121
70+ 268,253 280,229 387,645 538,624 677,487 778,093Total females 669,540 699,313 872,360 1,066,003 1,243,67 1 1,399,004% of females 6.2% 6.3% 6.9% 7.6% 8.0% 8.2%% of total prevalence 56.5% 56.3% 55.5% 55.1% 54.8% 54.2%
0-9 35,050 35,541 39,161 42,686 45,175 49,15510-19 43,785 44,355 45,488 49,905 54,612 58,01420-29 51,677 53,880 58,924 60,843 66,996 73,33930-39 67,141 67,460 75,960 83,132 86,193 94,97340-49 105,156 106,525 111,632 125,929 137,716 143,80250-59 147,204 152,543 169,903 178,245 202,408 221,171
60-69 270,407 293,284 374,024 419,810 444,622 509,15570+ 463,978 488,224 697,093 974,385 1,231,317 1,431,448Total persons 1,184,397 1,241,812 1,572,185 1,934,934 2,269,040 2,581,056% of total population 5.6% 5.7% 6.3% 6.9% 7.3% 7.5% Source: Access Economics estimates based on BOLD and NHS data.

Economic impact of COPD
27
FIGURE 2-7: PROJECTED PREVALENCE OF COPD BY GENDER TO 2050 (PERSONS)(A)
0
200,000
400,000
600,000
800,000
1,000,000
1,200,000
1,400,000
1,600,000
2008 2010 2020 2030 2040 2050
Males Females
(a) Note that the ‘kink’ in the chart reflects that the first time interval is two years (2008 to 2010) while the other intervals represent a decade (2010 to 2020 etc).
Source: Access Economics estimates based on BOLD and NHS data.
Projected COPD severity is reported in Table 2-11. Again this only looks at the impact of demographic ageing on the severity of Stage II or higher COPD, and excludes any treatments or interventions that might affect COPD severity.
� Most people have Stage II of the disease (at 87%), however, high levels of COPD (Stage III and IV) still occurred in 13% of the Stage II to IV COPD population or around 334,581 people by 2050.
TABLE 2-11: COPD STAGES II TO IV BY SEVERITY, PROJECTED PREVALENCE TO 2050
2008 2010 2020 2030 2040 2050Stage II 1,030,864 1,080,836 1,368,384 1,684,109 1,974,905 2,246,474Stages III and IV 153,533 160,976 203,802 250,825 294,135 334,581Total persons 1,184,397 1,241,812 1,572,185 1,934,934 2,269,040 2,581,056
Source: Access Economics estimates based on BOLD and NHS data.

Economic impact of COPD
28
3. HEALTH COSTS
This chapter estimates the direct health system costs of COPD in Australia, disaggregated by cost components for the year 2008.
Direct financial costs to the Australian health system comprise the costs of running hospitals and nursing homes (buildings, care, consumables), GP and specialist services reimbursed through Medicare and private funds, the cost of prescribed and over-the-counter pharmaceuticals (Pharmaceutical Benefits Scheme and private), allied health services, research and ‘other’ direct costs (such as health administration).
In this report, top-down estimates of health system expenditure based on AIHW data were used, supplemented by the addition of a COPD-specific drug which was introduced since the AIHW data were calculated.
3.1 METHODOLOGY
The AIHW (2005b) recurrent allocated health expenditure data for 2000-01 of $433 million were used as the initial basis for Access Economics’ estimates for health expenditure on COPD in 2008. In per capita terms, for the estimated 1.1 million people with COPD in 2001 (calculated in the same manner as the 2008 prevalence estimates in the previous chapter) this represented $391.17 per person with COPD each year in 2000-01 dollars.
The AIHW include only 87.5% of total recurrent health expenditure in their estimates of expenditure by disease and injury, referred to as ‘allocated’ health expenditure. This is comprised of health expenditure paid by the federal government (42.9%), paid by the State, Territory and local governments (24.9%), and paid by individuals (17.4%) (AIHW, 2007).
The ‘unallocated’ remainder (12.5%) includes capital expenditures, expenditure on community health (excluding mental health), public health programs (except cancer screening), health administration and health aids and appliances. As a result, allocated health expenditure is factored up by 1/0.875-1 or 14.3% to obtain total health system costs.
The other factors contributing to the extrapolation to 2008 are demographic growth by age and gender groups (increasing prevalence of COPD) based on ABS data, and health cost inflation based on AIHW (2007). Health inflation measures around 3-4% per annum.
Finally, oxygen therapy represents an important component of COPD treatment and health system costs. While AIHW health system costs data supplied does account for some of the costs related to the provision of home oxygen therapy, it is unlikely that this captures the full picture. It is difficult to unbundle the actual costs associated with Long Term Oxygen Therapy (LTOT) because there are different funders involved, including Department of Veterans’ Affairs, Department of Health and Ageing (subsidies for residents of residential aged care facilities) and the different states. The level of subsidy for LTOT varies significantly from state to state, and in some cases, from hospital catchment area to hospital catchment area. The level of subsidy for LTOT for people with COPD depends therefore not just on need, but by where the patient lives.
� It is important to note, however, that work has been done to identify the actual costs of LTOT and to show the significant disparities between states. Figures show that the cost of LTOT ranges from $22 million (Crockett et al, 1996) to $31 million per annum (Serginson et al).

Economic impact of COPD
29
� Of this total cost, between 50-60% is directly attributable to COPD (Jones et al 2007 and MASS Home Oxygen Service Review Report 2005).
In the interests of a conservative approach and to be consistent with existing AIHW data, these additional figures have not been added to the health system costs of COPD.
3.2 HEALTH EXPENDITURE IN 2008
Incorporating health cost inflation over the period from 2001 to 20082 and demographic changes that have occurred over this time, Access Economics estimates that in 2008 the health system expenditure based on the AIHW data associated with COPD is around $750.3 million – or $633.51 per person with COPD.
Table 3-1 outlines the health system expenditure. This includes factoring up health expenditure for the unallocated component of 14.3% (as discussed above).
� Hospital use contributes the largest share of health spending at around $473.1 million or 63% of the total health expenditure.
� Pharmaceuticals make up the next largest share at $147.3 million or 19.6%.
� The remainder ($130.0 million or 17.3%) is made up of out of hospital and other expenditure such as aged care homes, allied health professionals and research.
TABLE 3-1: AIHW HEALTH SYSTEM EXPENDITURE FOR COPD, 2008 Components of health expenditure, 2008
Hospital useOut of
hospital(a) Pharmaceuticals Other(b) Total
Per person with COPD ($) 399.42 58.52 124.36 51.21 633.51 For all people with COPD ($m) 473.1 69.3 147.3 60.6 750.3
Proportion of total 63.0% 9.2% 19.6% 8.1% 100.0%(a) Includes general practitioners, imaging, pathology, etc.(b) Includes aged care homes, allied health professionals, research.
Source: Access Economics based on AIHW data.
In addition, there has been a significant change in the treatment of COPD since 2003 – which post-dates the latest available 2000-01 AIHW recurrent health expenditure data by disease. A new drug (Tiotropium Bromide – ‘Spiriva’) was introduced specifically for the treatment of COPD. Given the cost and importance of this new drug (it is now widely used in Australia via the PBS) we have separately estimated these costs and added them to the Pharmaceuticals health costs from the AIHW data.
� According to the latest PBS data available from Medicare Australia, there were 1,399,706 PBS and RPBS items processed in 2007-08 for Tiotropium bromide monohydrate (item number 8626B).3
� The cost of Spiriva was around $76.46 ($31.30 of which was funded by the government, with a final price to consumers of $31.30) – according to the latest available PBS data.4
2 The most recent health cost inflation release is 2005-06. Consequently, 2006-07 and 2007-08 estimates were based on the ten-year average from 1995-95 to 2005-06. 3 Source Medicare Australia data (accessed 11 august 2008): https://www.medicareaustralia.gov.au/cgi-bin/broker.exe?_PROGRAM=sas.pbs_item_standard_report.sas&_SERVICE=default&itemlst=%2708626B%27&ITEMCNT=1&_DEBUG=0&LIST=8626B&VAR=SERVICES&RPT_FMT=1&start_dt=200707&end_dt=200806. 4 Source PBS data (accessed 11 august 2008): http://www.pbs.gov.au/html/healthpro/search/results?term=spiriva&scope=PBS+STATIC&form-type=simple.

Economic impact of COPD
30
���� In practice, the price paid by consumers will be lower on average than this, since many people have access to concessional scheme pricing and the PBS Safety Net. However, this only affects the distribution of pharmaceutical costs by who bears them, not the total real costs. Furthermore, it is more conservative to over-estimate the consumer component since it is the government component that is associated with higher deadweight losses (see Section 4.5). Hence these splits between consumers and government are used in the estimates here.
Multiplying the PBS items processed with the cost of Spiriva gives a cost of $107.0 million per annum in 2008 – or $83.44 per person with COPD.
���� Adding these costs to Table 3-1 results in higher total health costs of $857.3 million – or $723.87 per person with COPD (T able 3-2). These updated health system costs have been used for this analysi s.
TABLE 3-2: TOTAL HEALTH SYSTEM EXPENDITURE FOR COPD, 2008
Components of health expenditure, 2008
Hospital useOut of
hospital(a) Pharmaceuticals Other(b) Total
Per person with COPD ($) 399.42 58.52 214.72 51.21 723.87 For all people with COPD ($m) 473.1 69.3 254.3 60.6 857.3
Proportion of total 55.2% 8.1% 29.7% 7.1% 100.0%(a) Includes general practitioners, imaging, pathology, etc.(b) Includes aged care homes, allied health professionals, research.
Source: Access Economics based on AIHW and PBS data.
� As a result of the inclusion of Spiriva, pharmaceutical costs now rise to $254.3 million or 29.7% of total health system expenditure.
Figure 3-1 shows total health system expenditure by age and gender.
� Around 57% of total health spending ($484.7 million) is for females and 44% ($372.7 million) is for males. This reflects the higher prevalence of COPD in women.
� Also consistent with the prevalence profile of COPD, health system expenditure is concentrated in older age cohorts – particularly those aged 60 years and older – where 62% of COPD health system expenditure occurs.

Economic impact of COPD
31
FIGURE 3-1: COPD, TOTAL HEALTH EXPENDITURE BY AGE AND GENDER , 2008 ($MILLION)
0
20,000,000
40,000,000
60,000,000
80,000,000
100,000,000
120,000,000
0-4 5-9 10-14
15-19
20-24
25-29
30-34
35-39
40-44
45-49
50-54
55-59
60-64
65-69
70-74
75-79
80-84
85-89
90+
Females
Males
Source: Access Economics based on AIHW and PBS data.
Health system costs of COPD (Table 3-4) are largely borne by the Federal government ($367.8 million) and state, territory and local governments ($213.5 million). Individuals contribute $139.2 million, while society and family/friends make up the remaining $136.8 million.
TABLE 3-3: DISTRIBUTION OF HEALTH EXPENDITURE BY WHO PAYS
Health Costs $m %Individuals $139.2 16.2%Family/Friends $9.9 1.2%Federal Government $367.8 42.9%State Government $213.5 24.9%Society/Other $126.9 14.8%Total $857.3 100.0% Source: Access Economics based on AIHW and PBS data.
Note: ‘State’ includes territory and local government also.

Economic impact of COPD
32
4. OTHER FINANCIAL COSTS
This chapter estimates the other financial costs of COPD in Australia, disaggregated by cost components (productivity losses, informal care costs and the deadweight losses (DWLs) associated with transfer payments) for the year 2008.
Data on other financial costs are drawn from a variety of sources, including the ABS National Health Survey (NHS), the ABS Survey of Disability Ageing and Carers (SDAC), ABS data on Average Weekly Earnings (AWE) and other sources detailed in each section below.
4.1 PRODUCTIVITY LOSSES
Productivity losses are the cost of production that is lost when people with COPD are unable to work because of the condition. They may work less than they otherwise would (either being employed less, being absent more often or being less productive while at work) or they may die prematurely. Access Economics adopts a human capital approach to measurement of productivity losses in developed countries.
� Data for productivity costs were obtained from the ABS NHS, which provides estimates of employment participation and of absenteeism from work attributable to COPD – which was broadly defined as bronchitis and/or emphysema that has lasted or was expected to last 6 months or more.
4.1.1 EMPLOYMENT PARTICIPATION
COPD can affect a person’s ability to work. If employment rates are lower for people with COPD, this loss in productivity represents a real cost to the economy. The employment (or participation) rate is calculated by dividing the total number of employed persons by the number of people in each age-gender group. This participation rate calculation can be done for people with COPD and then compared with the participation rate for the entire population. The difference (or excess) between the two groups can then be attributed to COPD, after age-gender standardising. The NHS employment data were only provided for the entire 15-64 age-group, with no gender split, so the prevalence of COPD was used to age and gender standardise.
The NHS data indicated that people with COPD aged 15-64 had a participation rate of 58.6%. This is much lower than the raw participation rate of 74.3% for the general population of the same age. Once age-gender standardised, the difference between these two results (15.7%) fell to 13.9%, which can be attributed to COPD in the absence of other confounding factors between the two groups. Compared to the participation rate for the general population, this represents a 13.9%/74.3%=18.7% lower employment rate for people with COPD. This result was then combined with Average Weekly Earnings (AWE) and employment rates for each respective age-gender group to calculate the lost earnings due to reduced employment.
The annual cost of lost earnings due to reduced employment from COPD i s estimated as $3.7 billion in 2008.
This result is consistent with the epidemiology of COPD – in that it can be a debilitating condition significantly reducing the ability to even participate in employment.

Economic impact of COPD
33
4.1.2 ABSENTEEISM FROM PAID AND UNPAID WORK
Even after people with COPD gain employment, the condition can adversely affect work performance through absence from work. Such absenteeism is measured by looking at the number of work days missed by people with COPD over a 12 month period.
� Data for absenteeism were again sourced from the NHS, which indicated that there were 205,100 people with COPD who took 122,900 days away from work due to their own illness in the 2 weeks prior to when the NHS was conducted. This results in around 14.4 days away from work per person with COPD per year, assuming a 48 week working year.5
� In the general population – or people who did not have COPD - there were around 2.8 million people who took around 9.6 million days away from work in the 2 weeks prior to when the NHS was conducted. This results in around 7.0 days away from work per person per year, assuming a 48 week working year.6
The excess or difference of these two results (7.4 days per person per year) was attributed to COPD.
The same number of days is estimated to be lost, for those who do not work, from their household productivity, which is valued at 30% of the average wage rate.
Based on these parameters and the AWE for each age-gender group, Access Economics estimates that in 2008, the total cost of absenteeism and lost home production due to COPD is $0.9 billion . This includes around $0.66 billion due to absenteeism for people in paid work and around $0.28 billion in lost household productivity for those in unpaid work.
This result is again consistent with the nature of COPD. Even after people with COPD manage to obtain work; it can be difficult for them to function effectively given breathing difficulties and exacerbations, leading to absence from work as a result of the condition.
4.1.3 PRESENTEEISM
COPD can also affect a person’s ability to work effectively while at work, for the same reasons as for contributing to absenteeism (breathlessness, coughing, exacerbations). Presenteeism can be estimated by multiplying the number of days worked with COPD by the percentage reduction in effectiveness on days worked with COPD.
However, data for presenteeism were not available from the NHS. As a result, US survey data were used and triangulated against available relativities from Australia. This is reasonable given the broad similarities between the US and Australian populations in relation to working with COPD.
� Wang et al (2003) studied associations between chronic conditions including COPD and work performance (absenteeism, presenteeism) across a broad cross-section of 2,350 employees in four US industries – reservation agents, customer service representatives, executives, and railroad engineers. Conditions and work performance
5 Ie, (122,900/205,100)*24=14.4 6 Ie, (2,825,500/9,641,500)*24=7.0

Economic impact of COPD
34
were assessed with the World Health Organization’s Health and Work Performance Questionnaire.
���� Excess presenteeism was estimated using a series of questions that required respondents to rate their performance while at work in both absolute and relative terms (ie, compared with other workers in the same occupation).
���� The aggregate score across all reports was converted to a metric with a theoretical range between 0 and 100 and treated as a ratio scale for the purposes of calculating the performance of each respondent in relation to the perceived performance of other workers in the same occupation.
���� The additive inverse of this ratio was used as a raw measure of relative presenteeism (ie, the percentage decrement in work performance of the respondent compared with the average worker in the same occupation).
���� Relative presenteeism was multiplied by hours actually worked to create a summary hour-equivalent measure of presenteeism that can be interpreted as the excess number of hours the respondent worked in comparison to the number of hours the average worker would have had to work to complete the same amount of overall work.
� Wang et al (2003) found that COPD had a significant absenteeism effect (19.4 annual excess absenteeism days) and an even more significant presenteeism effect (27.5 annual excess presenteeism days).
� The presenteeism effect can then be calculated by dividing the 27.5 days by the 240 work days per year7 to estimate an 11.5% reduction in productivity while at work.
���� However, Wang et al (2003) reported fairly high standard errors associated with their results (15.6 for COPD presenteeism around the estimate of 27.5 days on average). As a result, the 11.5% presenteeism effect is constrained by relativities with Australian data. NHS reports 7.4 excess absenteeism days for COPD whereas Wang et al (2003) report 19.4 excess absenteeism days – or 2.64 times greater. Factoring down the 11.5% presenteeism effect by 2.64 gives a 4.3% presenteeism effect estimated in Australia . This factored down result is used in this analysis.
This is still a sizeable excess presenteeism effect. Using this 4.3% reduction in productivity while at work and the AWE for each age-gender group, the lost work effectiveness can then be calculated.
Access Economics estimates that in 2008, the total cost of ‘presenteeism’ (lower productivity while at work) due to COPD is $ 0.7 billion .
4.1.4 PREMATURE DEATH
From the calculations in Section 2.5, there are an estimated 16,004 deaths due to COPD in 2008 (6,689 males and 9,314 females). Based on this case mortality risk, and incorporating employment rates and estimates of average lifetime earnings for different age-gender groups, the present value of lost earnings due to mortality among those who would otherwise have been employed is shown in Figure 4-1.
7 Assuming a 48 week work year and a 5 day work week.

Economic impact of COPD
35
The estimated annual cost due to lost productivity from premature death due to COPD is $1.4 billion in 2008 .
FIGURE 4-1: COPD, COSTS OF PREMATURE MORTALITY BY AGE AND GENDER ($ MILLION)
0
20
40
60
80
100
120
140
160
180
200
15-19 20-24 25-29 30-34 35-39 40-44 45-49 50-54 55-59 60-64 65-69 70-74
Males
Females
Source: Access Economics.
Premature death also leads to additional search and hiring costs for replacement workers. These are estimated as the number of people with COPD who die prematurely (by age and gender) multiplied by their chance of being employed multiplied by the search and hiring cost brought forward three years (the search and hiring cost is estimated as 26 weeks at AWE and the three year bring forward reflects average staff turnover rates in Australia).
In 2008, additional search and hiring costs are est imated at $2.4 million for people with COPD , based on the present value of bringing forward three years of average cost of staff turnover (26 weeks at AWE).
4.1.5 LOST TAXATION REVENUE
Reduced earnings due to reduced workforce participation, absenteeism and premature death also have an effect on taxation revenue collected by the Government. As well as forgone income (personal) taxation, there will also be a fall in indirect (consumption) tax, as those with lower incomes spend less on the consumption of goods and services.
Personal income tax forgone is a product of the average personal income tax rate (21.2%) and the forgone income. With COPD and lower income, there will be less consumption of goods and services, with the indirect taxation rate estimated as 12.0%. These average taxation rates are derived for 2008 from the Access Economics macroeconomic model.

Economic impact of COPD
36
Around $2.1 billion in lost potential tax revenue i s estimated to be incurred in 2008 , due to the reduced productivity of people with COPD.
Lost taxation revenue is considered a transfer payment, rather than an economic cost per se. However, raising additional taxation revenues does impose real efficiency costs on the Australian economy, known as deadweight losses (DWLs) . Administration of the taxation system costs around 1.25% of revenue raised (derived from total amounts spent and revenue raised in 2000-01, relative to Commonwealth department running costs). Even larger DWLs arise from the distortionary impact of taxes on workers’ work and consumption choices. These distortionary impacts are estimated to be 27.5% of each tax dollar collected (Lattimore, 1997 and used in Productivity Commission, 2003:6.15-6.16, with rationale). Altogether the DWL is 28.75% of the value of the taxation forgone (Section 4.5).
Access Economics estimates that around $618 million in deadweight loss is incurred in 2008 , due to the additional taxation required to replace that forgone due to lost productivity of people with COPD (Table 4-1).
TABLE 4-1: LOST EARNINGS AND TAXATION DUE TO COPD, 2008
Average personal income tax rate* 21.2%
Potential personal income tax lost $1.37 billion
Average indirect tax rate* 12.0%
Potential indirect tax lost $775 million
Total potential tax revenue lost $2.15 billion
Deadweight loss from additional taxation $618 milli on
* Source: Access Economics macroeconomic model (2008).
Welfare payments made to people who are no longer working must, in a budget-neutral setting, also be funded by additional taxation. The DWLs associated with welfare transfers are calculated in Section 4.5, where the nature of DWLs is explained in more detail.
4.2 CARER COSTS
Carers are people who provide informal care to others in need of assistance or support. Most informal carers are family or friends of the person receiving care. Carers may take time off work to accompany people with COPD to medical appointments, stay with them in hospital, or care for them at home. Carers may also take time off work to undertake many of the unpaid tasks that the person with COPD would do if they did not have COPD and were able to do these tasks.
Informal care is distinguished from services provided by people employed in the health and community sectors (formal care) because the care is generally provided free of charge to the recipient and is not regulated by the government.
While informal care is provided free of charge, it is not free in an economic sense, as time spent caring is time that cannot be directed to other activities such as paid work, unpaid work (such as housework or yard work) or leisure. As such, informal care is a use of economic resources.

Economic impact of COPD
37
4.2.1 METHODOLOGY
There are three potential methodologies that can be used to place a dollar value on the informal care provided.
� Opportunity cost is the value of lost wages forgone by the carer.
� Replacement valuation is the cost of buying a similar amount of services from the formal care sector.
� Self-valuation is what carers themselves feel they should be paid.
Access Economics has adopted the opportunity cost method in this report as it provides the most accurate estimate of carer costs and sufficient demographic data on providers of care for people with COPD are available.
4.2.2 INFORMAL AND COMMUNITY CARE COSTS
Informal care costs are the value of the care provided by informal friends or family carers. This report analyses the available epidemiological data (from Australia and overseas) together with SDAC data (ABS, 2003), to gain estimates of the total number of hours of care provided to people with COPD in 2008, and the average unit cost of that care.
SDAC data sourced specifically for this report identified around 9,100 primary informal carers who cared for people with COPD as their main condition.
However, it is important to avoid double counting the people with COPD who would have received care anyway. As such it is necessary to identify the ‘excess’ amount of care provided to people with COPD by calculating the usage rates of informal care for people with COPD (0.8% of people with COPD have a primary carer, where COPD is the main condition) and comparing them to informal care usage rates for the general Australian population (2.4% of the general population have a primary carer, with very little difference in the age-gender distribution of the respective populations). In summary, SDAC data show that the use of carers for COPD is actually lower by age and gender than for the general population. The result may be determined by the relatively large number of Australians with Stage I and II disease.
Hence, it was concluded that no additional costs (a ttributable to COPD) were identified due to the use of informal carers.
� This is not to say that there are no additional costs imposed on people who care for people with COPD even where they would still have cared for them in the absence of the COPD. In particular, the burden on carers when the disease progresses to stages III and IV can be significant.
� What this result means is that, even though the contribution of carers for Australians with COPD is greatly valued, SDAC data would suggest that there is no more care on average than that provided to Australians without COPD of the same age and gender.
� Further research into the burden carried by those who care for people with COPD is required.
4.3 AIDS AND HOME MODIFICATIONS
Aids and home modifications are those not captured in formal health sector or disability services costs that include equipment and technology in order to assist with daily living.

Economic impact of COPD
38
Estimates of aids and modifications costs are based on data from the ABS SDAC for people with COPD as their main condition. These data are then compared to utilisation rates of aids and modifications for the rest of the SDAC survey population to estimate the ‘excess’ aids and modifications used by people with COPD, relative to people without COPD.
Results from SDAC show that of those who reported COPD as their main condition:
� 29.9% used at least one type of self care aid compared to 22.8% without;
� 26.2% used some type of communication aid compared to 22.8% without;
� 49.3% used mobility aids compared to 34.9% without; and
� 82.4% made modifications to their home compared to 53.3% without.
Cost estimates for various products are based on prices provided by the Independent Living Centre NSW, the Victorian Aids and Equipment Program and previous studies undertaken by Access Economics, inflated to 2008 prices. While some equipment and modifications require large outlays but are depreciated over a number of years, other devices need to be replaced more regularly. It was assumed that devices in heavy use (eating, dressing, continence aids and batteries) need to be replaced after one to two years – with an average cost of $339 per annum for people with COPD who used these, while most other devices (most mobility aids such as canes, crutches, walking sticks and frames) – have a lifespan of three years (average expenditure on these by people with COPD who used them was $247 per annum). Home modifications tend to be one-off investments (costing around $8,875 on average for people with COPD who modified their homes), so their lifespan was assumed to be 20 years (Table 4-2) ie, an annual cost of $444 per annum.
Overall, the cost for aids and equipment for people with COP D was estimated at around $247 million in 2008 – or $209 on average across all people with COPD.
As it is not known how much of this cost is subsidised by governments, paid for by the person with COPD or their family and friends, or paid for through community programs, the amount is allocated in four equal portions to the Australian Government, state and territory governments, family/friends and society/other.

Economic impact of COPD
39
TABLE 4-2: COPD, AIDS AND EQUIPMENT PRICES , ESTIMATED PRODUCT LIFE AND TOTAL COSTS , 2008
Device Minimum Price ($)
Product life (years)
Average unit cost
($ per annum)
Number of devices
used
Total cost ($ per annum)
Self Care Self care aids (incl eating, showering or bathing, toileting, managing incontinence,
dressing)1,2,3
$610 1.8 $339 83,836 28,405,956
Total Self Care $339 83,836 $ 28,405,956 Mobility aids Moblity aids (incl canes, walking
stick, crutches, walking frame, wheelchair or scooter, specially
modified car or car aid)1,2,4
$741 3 $247 171,242 $42,314,565
Total Mobility Aids $247 171,242 $42,314,565Home modifications
Home modifications (incl structural changes, ramps, bath modifications, doors widened,
handrails, etc)5
$8,875 20 $444 344,299 $ 152,781,163
Total Home modifications $444 344,299 $152,781,163Communication aids
Communication aids (electronic, non-electronic and other hearing and
communication aids)3
$2,958 5 $592 40,545 $23,988,794
Total Communication aids $533 40,545 $23,988,794People using aids & equipment
$346 714,501 $ 247,490,478
People not using aids & equipment
469,897 $ -
People with COPD 1,184,397 $ 247,490,478
Sources: ABS (2003);1 Victorian Aids and Equipment Program; 2 Independent Living Centre NSW; 3 Access Economics (2006a); 4
average of mobility aids; 5 Access Economics (2006b). Inflated to 2008 by CPI. Note: People may use multiple devices.
4.4 FUNERAL COSTS
The ‘additional’ cost of funerals borne by family and friends of people with COPD is based on the additional likelihood of death associated with COPD (Section 2.5) in the period that the person experiences it. However, some patients (particularly older patients) would have died during this time anyway. Eventually everyone must die and thus incur funeral expenses – so the true cost is the cost brought forward (adjusted for the likelihood of dying anyway in a given year). The Bureau of Transport and Road Economics (2000) calculated a weighted average cost of a funeral across all states and territories, to estimate an Australian total average cost of $3,200 per person for 1996, or $4,380 per person who died in 2008 .
The bring forward of funeral costs associated with premature death for people with COPD is estimated at around $70.1 million in 2008.

Economic impact of COPD
40
4.5 DEADWEIGHT LOSSES FROM TRANSFERS
4.5.1 WELFARE AND INCOME SUPPORT PAYMENTS
Transfer payments represent a shift of resources from one economic entity to another. The act of taxation and redistribution creates distortions and inefficiencies in the economy, so transfers also involve real net costs to the economy.
Data regarding the number of people on income support payments were sourced from Centrelink Australia, specifically for this report. The COPD-related Centrelink disease categories are chronic respiratory disease, bronchitis, and emphysema. The total of these three categories was used to estimate transfer payments for COPD. The most commonly received Centrelink work related benefit was the Disability Support Pension (DSP), which Access Economics estimates was received by 26,743 people due to their COPD in May 2008. There were also an estimated 1,617 people with COPD receiving NewStart Allowance and around 120 people receiving Sickness Allowance, due to their COPD.
The value of these payments in 2008 is estimated to be around $399.9 million8. However, some of these people would have ordinarily received welfare payments which must be netted out to estimate the additional welfare payments due to COPD, using a Melbourne University study (Tseng and Wilkins, 2002) about the ‘reliance’ of the general population (aged 15-64 years) on income support of around 12%. Factoring down the $399.9 million by this 12% gives a cost of welfare reliance on DSP, NewStart Allowance and Sickness Allowance due to COPD of around $351.8 million per annum in 2 008.
4.5.2 DEADWEIGHT LOSSES
The welfare payments calculated immediately above are, like taxation revenue losses, not themselves economic costs but rather a financial transfer from taxpayers to the income support recipients. The real resource cost of these transfer payments is only the associated DWL.
DWLs refer to the costs of administering welfare pensions and raising additional taxation revenues. Although invalid and sickness benefits and forgone taxation are transfers, not real costs (so should not be included in the estimation of total costs), it is still worthwhile estimating them as that helps us understand how the total costs of COPD are shared between the taxpayer, the individual and other financiers.
There are two sources of lost tax revenue that result from the lower earnings – the potential income tax forgone and the potential indirect (consumption) tax forgone. The latter is lost because, as income falls, so does consumption of goods and services. The average personal income tax rate used is 21.2% and the average indirect taxation rate used is 12.0%, based on parameters for 2008 from the Access Economics macroeconomic model.
Transfer payments (Government payments/services and taxes) are not a net cost to society as they represent a shift of consumption power from one group of individuals to another in society. If the act of taxation did not create distortions and inefficiencies in the economy, then transfers could be made without a net cost to society. However, through these distortions, taxation does impose a DWL on the economy.
8 Based on a payment of $546.80 per fortnight for DSP and $437.10 for NewStart Allowance and Sickness Allowance.

Economic impact of COPD
41
DWL is the loss of consumer and producer surplus, as a result of the imposition of a distortion to the equilibrium (society preferred) level of output and prices. Taxes alter the price and quantity of goods sold compared to what they would be if the market were not distorted, and thus lead to some diminution in the value of trade between buyers and sellers that would otherwise be enjoyed (Figure 4-2).
FIGURE 4-2: DWL OF TAXATION
Price ($)
Output
Supply
Demand
Price plus Tax
Price
Taxation Revenue
Actual Quantity Supplied
Potential Quantity Supplied
Deadweight Loss (cost of raising taxation revenue)
The rate of DWL used in this report is 27.5 cents per $1 of tax revenue raised plus 1.25 cents per $1 of tax revenue raised for Australian Taxation Office administration, based on Productivity Commission (2003) in turn derived from Lattimore (1997), ie, 28.75% overall. The total extra tax dollars required to be collected include:
� the taxation revenue lost as a result of COPD and its impacts – $618 million;
� the value of government services provided (including the Government-funded component of health system costs, with $167 million of DWL); and
� the additional induced social welfare payments required to be paid (with $101 million of DWL).
Thus the DWL for people with COPD in 2008 is estima ted at around $886 million.

Economic impact of COPD
42
4.6 SUMMARY OF OTHER FINANCIAL COSTS
In total, the non-health related financial costs of COPD are estimated to be $7.96 billion in 2008 .
TABLE 4-3: SUMMARY OF OTHER FINANCIAL COSTS OF COPD, 2008 $ million
Productivity costs 6,757.8 Employment impacts 3,692.8
Absenteeism 942.6
Presenteeism 698.9
Premature death 1,421.0
Search and hiring costs 2.4
Carer costs n.a.Aids and modifications 247.5 Funeral costs 70.1 DWL 885.8
Total other financial costs 7,961.2

Economic impact of COPD
43
5. BURDEN OF DISEASE
This chapter estimates the burden of disease of COPD in Australia, measured in terms of disability adjusted life years (DALYs), disaggregated by years of life lost due to premature death (YLL) and healthy years of life lost due to disability (YLD), and converted into a reasonable monetary equivalent.
� The disability, loss of wellbeing and premature death that result from COPD are more difficult to measure, but have been analysed in this chapter terms of the years of healthy life lost, both quantitatively and qualitatively, known as the ‘burden of disease’, with an imputed value of a statistical life year (VSLY) so as to compare these costs with financial costs of COPD.
5.1 METHODOLOGY – VALUING LIFE AND HEALTH
5.1.1 MEASURING BURDEN : DALYS, YLLS AND YLDS
In the last decade, a non-financial approach to valuing human life has been derived, where loss of wellbeing and premature mortality – called the ‘burden of disease and injury’ – are measured in terms of Disability Adjusted Life Years, or DALYs. This approach was developed by the World Health Organization (WHO), the World Bank and Harvard University for a study that provided a comprehensive assessment of mortality and disability from diseases, injuries and risk factors in 1990, projected to 2020 (Murray and Lopez, 1996). Methods and data sources are detailed further in Murray et al (2001) and the WHO continues to revisit the estimates for later years.
A DALY of 0 represents a year of perfect health, while a DALY of 1 represents death. Other health states are attributed values between 0 and 1 as assessed by experts on the basis of literature and other evidence of the quality of life in relative health states. For example, the disability weight of 0.18 for a broken wrist can be interpreted as losing 18% of a person’s quality of life relative to perfect health, because of the inflicted injury. Total DALYs lost from a condition are the sum of the mortality and morbidity components – the Year(s) of Life Lost due to premature death (YLLs) and the Year(s) of healthy life Lost due to Disability (YLDs).
The DALY approach has been successful in avoiding the subjectivity of individual valuation and is capable of overcoming the problem of comparability between individuals and between nations, although some nations have subsequently adopted variations in weighting systems, for example age-weighting for older people. This report treats the value of a life year as equal throughout the lifespan.
As these approaches are not financial, they are not directly comparable with most other cost and benefit measures. In public policy making, it is often desirable to apply a monetary conversion to ascertain the cost of an injury, disease or fatality or the value of a preventive health intervention, for example, in cost benefit analysis. Such financial conversions tend to utilise ‘willingness to pay’ or risk-based labour market studies as described in the next section.
5.1.2 WILLINGNESS TO PAY AND THE VALUE OF A STATISTICAL LI FE YEAR
The burden of disease as measured in DALYs can be converted into a dollar figure using an estimate of the Value of a ‘Statistical’ Life (VSL). As the name suggests, the VSL is an estimate of the value society places on an anonymous life. Since Schelling’s (1968)

Economic impact of COPD
44
discussion of the economics of life saving, the economic literature has focused on willingness to pay (WTP) – or, conversely, willingness to accept (WTA) – measures of mortality and morbidity, in order to develop estimates of the VSL.
Estimates may be derived from observing people’s choices in situations where they rank or trade off various states of wellbeing (loss or gain) either against each other or for dollar amounts eg, stated choice models of people’s WTP for interventions that enhance health or WTA poorer health outcomes or the risk of such states. Alternatively, risk studies use evidence of market trade-offs between risk and money, including numerous labour market and other studies (such as installing smoke detectors, wearing seatbelts or bike helmets and so on).
The extensive literature in this field mostly uses econometric analysis to value mortality risk and the ‘hedonic wage’ by estimating compensating differentials for on-the-job risk exposure in labour markets; in other words, determining what dollar amount would be accepted by an individual to induce him/her to increase the probability of death or morbidity by a particular percentage. Viscusi and Aldy (2002), in a summary of mortality studies, found the VSL ranged between US$4 million and US$9 million with a median of US$7 million (in year 2000 US dollars), similar but marginally higher than the VSL derived from studies of US product and housing markets. They also reviewed a parallel literature on the implicit value of the risk of non-fatal injuries.
Weaknesses in the WTP approach, as with human capital approaches to valuing life and wellbeing, are that there can be substantial variation between individuals. Extraneous influences in labour markets such as imperfect information, income/wealth or power asymmetries can cause difficulty in correctly perceiving the risk or in negotiating an acceptably higher wage in wage-risk trade off studies, for example.
As DALYs are enumerated in years of life rather than in whole lives it is necessary to calculate the Value of a ‘Statistical’ Life Year (VSLY) based on the VSL. This is done using the formula:9
VSLY = VSL / Σi=0,…,n-1(1+r) i
Where: n = years of remaining life, and r = discount rate
Clearly there is a need to know n (the years of remaining life), and to determine an appropriate value for r (the discount rate). There is a substantial body of literature, which often provides conflicting advice, on the appropriate mechanism by which costs should be discounted over time, properly taking into account risks, inflation, positive time preference and expected productivity gains. In reviewing the literature, Access Economics (2008) found the most common rate used to discount healthy life was 3%, perhaps the most eminent sources being Nordhaus, 2002 (Yale); Murphy and Topel, 2005 (University of Chicago); Cutler and Richardson, 1998 (Harvard); WHO, 2002; Aldy and Viscusi, 2006). This report
9 The formula is derived from the definition:
VSL = ΣVSLYi/(1+r)^i where i=0,1,2….n where VSLY is assumed to be constant (ie, no variation with age).

Economic impact of COPD
45
assumes a discount rate for future streams of health in Australia of 3%. Further it is assumed that on average people have 40 years of life remaining.10
According to the discussion above and analysis done by Access Economics (2008), a suggested ballpark average VSL is $6.0 million in 2006 Australian dollars with sensitivity analysis recommended at $3.7 million and $8.1 million.
� This equates to an average VSLY in 2006 of $252,014 ($155,409 to $340,219), using a discount rate of 3% over an estimated 40 years remaining life expectancy.
� Inflating the 2006 VSLY value to 2008 dollars by multiplying it by two years of inflation (2.9% in each year, from the Access Economics Macroeconomic model) results in a base case of $266,843 with lower and upper bounds of $164,553 and $360,238.
5.2 BURDEN OF DISEASE DUE TO COPD
5.2.1 DISABILITY WEIGHTS
One of the main costs of COPD is the loss of wellbeing and quality of life that it entails. This can be estimated by initially allocating a disability weight to COPD.
The disability weights used in this study are based originally on those available from the AIHW (Mathers et al, 1999 and Begg et al, 2007).
� Mathers et al (1999) published disability weights for mild to moderate COPD of 0.170, and severe COPD of 0.530 – based on a study by Stouthard et al (1997), which measured the disability weights for 53 diseases of public health importance in the Netherlands.
� The AIHW then updated these estimates in Begg et al (2007) by deriving a composite average disability weight of COPD for males (0.168) and females (0.159) using the Stouthard et al (1997) weights for mild to moderate and severe COPD and the proportionate distribution by level of severity of breathlessness from the Busselton Study (Knuiman et al, 1999).
These updated disability weights for males and females were used by Access Economics in this report.
5.2.2 YEARS OF LIFE LOST DUE TO DISABILITY
Based on the disability weights outlined above and the total number of people experiencing COPD, the YLD for COPD has been calculated by gender (Table 5-1), for the year 2008.
In total, YLD for COPD was an estimated 192,953 DALYs in 2008.
TABLE 5-1: ESTIMATED YEARS OF HEALTHY LIFE LOST DUE TO DISABILITY (YLD), 2008 (DALYS) Estimated disability
weightPrevalence YLD
Males 0.168 514,858 86,496 Females 0.159 669,540 106,457
10 This assumption relates to the average years of life remaining for people included in VSL studies, not the years of life remaining for people with COPD.

Economic impact of COPD
46
5.2.3 YEARS OF LIFE DUE TO PREMATURE DEATH
Based on the relative risk of mortality due to COPD outlined above in Section 2.7, there are an estimated 16,004 deaths due to COPD in 2008 (6,689 males and 9,315 females). YLLs have been estimated from the age-gender distribution of deaths by the corresponding YLLs for the age of death in the Standard Life Expectancy Table (West Level 26) with a discount rate of 3.0% and no age weighting.
In total, YLL for COPD was an estimated 157,149 DALYs in 2008 (Table 5-2).
TABLE 5-2: YEARS OF LIFE LOST DUE TO PREMATURE DEATH (YLL) DUE TO COPD, 2008
15-29 30-39 40-49 50-59 60-69 70-79 80+ TotalMales 4,656 918 2,023 4,942 17,958 18,375 13,267 62,141 Females 6,676 1,709 4,773 12,540 24,208 22,187 22,914 95,008 Persons 11,332 2,627 6,797 17,482 42,167 40,563 36,181 157,149
5.2.4 TOTAL DALYS DUE TO COPD
The overall loss of wellbeing due to COPD is estimated as 350,102 DALYs.
Figure 5-1 illustrates the YLD and YLL components by age and gender. The greatest impact of COPD is in middle age to old age, reflecting the physiology of COPD and higher YLD due to the large number of Australians with COPD in this cohort.
FIGURE 5-1: LOSS OF WELLBEING DUE TO COPD (DALYS), BY AGE AND GENDER , 2008
0
10,000
20,000
30,000
40,000
50,000
60,000
0-4
5-9
10-1
4
15-1
9
20-2
4
25-2
9
30-3
4
35-3
9
40-4
4
45-4
9
50-5
4
55-5
9
60-6
4
65-6
9
70-7
4
75-7
9
80-8
4
85-8
9
90+
DA
LYs
Age Groups
Female YLL
Male YLL
Female YLD
Male YLD

Economic impact of COPD
47
Multiplying the number of DALYs by the VSLY ($266,843) provides an estimate of the gross dollar value of the loss of wellbeing due to COPD.
The estimated gross cost of lost wellbeing from COP D is $93.4 billion in 2008. This reflects the prevalence of COPD in th e community and its relatively high disability weights.
5.2.5 NET VALUE OF HEALTHY LIFE LOST
Bearing in mind that the wage-risk studies underlying the calculation of the VSL take into account all known personal impacts – suffering and premature death, lost wages/income, out-of-pocket personal health costs and so on – the estimate of $93.4 billion should be treated as a ‘gross’ figure. However, costs specific to COPD that are unlikely to have entered into the thinking of people in the source wage/risk studies should not be netted out (eg, publicly financed health spending, care provided voluntarily). The results after netting out are presented in Table 5-3.
TABLE 5-3: NET COST OF LOST WELLBEING , $MILLION , 2008
Gross cost of wellbeing 93,422 Less production losses net of tax 4,237 Less health costs borne out-of-pocket 139 Plus transfers to people with CP 352 Net cost of lost wellbeing 89,398
Substituting the lower and higher estimates of the VSLY ($164,553 and $360,238 respectively), the net value of healthy life lost ranges from $53.6 billion to $122.1 billion.
The net cost of lost wellbeing due to COPD is estim ated to be $89.4 billion ($53.6 to $122.1 billion) in 2008.
Economic impact of COPD
48
6. DIAGNOSIS AND COST EFFECTIVENESS
This chapter discusses diagnosis issues and presents evidence of the cost effectiveness of early intervention strategies.
6.1 DIAGNOSIS AND EARLY INTERVENTION ISSUES
COPD is highly prevalent, under-diagnosed, undertreated and under-perceived (Celli, 2008).
There is general agreement in the literature that COPD has long been under-diagnosed both in Australia and across the world (Ramsey and Sullivan, 2004; GOLD, 2007; Mannino and Braman, 2007; McKenzie et al, 2003; Bednarek et al, 2008).
Diagnosis of the early stages of COPD can be problematic, not necessarily because of difficulty in identifying the symptoms but because symptoms are commonplace and develop gradually. They are therefore often ignored by patients and sometimes by clinicians until the disease has progressed to a more severe stage.
In addition, under-diagnosis may in part reflect that COPD is not well understood by the public and is regarded with nihilism by many clinicians (Matheson et al, 2006). Moreover, there may be perceptions in the medical community that COPD is unattractive and unrewarding to treat, that it is self-inflicted, and that there are no effective remedies (McKenzie et al, 2003).
A more contemporary understanding of COPD is that the condition is highly prevalent and will be an increasing cause of morbidity and mortality worldwide. COPD is now viewed as preventable and treatable. COPD is not solely a pulmonary disease but one with important measurable systemic consequences (it is often reported along with other diseases as a complicating factor). Ref Fabbri LM, Luppi F, Beghé B, KF Rabe. Complex chronic comorbidities of COPD. Eur Respir J 2008; 2008;31:204-212. COPD patients need to be comprehensively evaluated to allow an individualised program to be prepared using the latest intervention strategies (Celli, 2008).
COPD diagnosis is also often complicated by the existence of comorbidities. Since COPD often develops in long term smokers in middle age, at onset people may have a variety of other diseases related to either smoking or ageing (GOLD, 2007; Soriano et al, 2005). This can add complexity to diagnosis particularly in the early stages of the disease. COPD in the early stages is typically confused or mistaken either with ageing, benign smokers cough or asthma (Matheson et al, 2006).
Spirometric testing and guidelines such as the COPD-X guidelines are thus important for the diagnosis of COPD (White, 2004). Australian clinicians need access to accurate spirometric testing facilities to assist with early diagnosis along with other diagnosis methods such as medical history, physical examination and pulmonary function testing (Marton et al, 2005).
Additionally, due to the existence of COPD primarily in ex-smokers, COPD is often under-diagnosed in patients who have not been exposed to key risk factors like smoking. Behrendt (2005) presents evidence from the US that COPD in non-smokers, particularly in older age cohorts – 70 to 80 years of age – was over 20%. In another study from Poland, Bednarek et al (2008) found that COPD also has a high prevalence in patients with no history of smoking and that prevalence was also higher in patients from lower income backgrounds.

Economic impact of COPD
49
Effective early intervention also can present challenges. Agusti (2005) reports that COPD has significant extrapulmonary (systemic) effects. Well recognised systemic effects of COPD include:
� weight loss;
� nutritional abnormalities; and
� skeletal muscle dysfunction.
Other less well known effects are:
� increased risk of cardiovascular disease; and
� systemic inflammation
� several neurological and skeletal defects.
These systemic effects add to the respiratory morbidity produced by the underlying COPD condition. Understanding that COPD is more than a lung disease and that it can have significant effects on distant organs outside of the lungs opens up new clinical challenges for disease management. A wide range of extra pulmonary tissues and organ systems can be impacted so clinical management needs to address these effects in order to ensure that there is improvement in health status and prognosis (Agusti, 2005).
Another challenge is that the primary care (GP) setting in Australia may not be well equipped to diagnose and intervene early in treatment of COPD – with the need for consultation time to take a patient history regarding exposure to risks, test lung function, assess spirometric results, rule out differential diagnoses, prescribe and reinforce self management or action plans and simultaneously assess and manage comorbidities.
In summary, medical evidence suggests COPD is preventable and treatable and, more importantly, that early diagnosis combined with disease management programs (including removal of risk factors) could reduce the COPD disease burden in Australia. Since COPD is a progressive disease characterised by airflow limitation that is partially reversible, early diagnosis that leads on to initiation of proven management strategies through a range of treatment options offers patients the best chance to reduce the overall impact of COPD and to stem or slow the progression of the disease into the more severe stages. In recent years, progress has been made regarding management strategies and non-pharmacological interventions that have been shown to be cost effective. The next section turns to the evidence for cost effectiveness.
6.2 COST EFFECTIVE INTERVENTIONS
The economic cost of COPD can be reduced through the adoption of cost effective prevention, early diagnosis and optimal management strategies. Frith et al (2008) found that such strategies for COPD are under-utilised in Australia.
Mittmann et al (2007) found that the economic impact of COPD (in particular healthcare costs) associated with moderate and severe exacerbations was considerable, and reducing the likelihood of exacerbations and time required in hospital greatly reduces the burden on the health care system.
As knowledge of COPD has improved, the capacity to treat the disease has increased significantly (Celli, 2008). In Australia, anti-smoking campaigns have seen a cost effective

Economic impact of COPD
50
decline in prevalence, the use of long term oxygen therapy has improved survival rates and pharmacological treatment programs are able to improve lung function and alter the rate of decline in exercise capacity, breathlessness, quality of life and even survival (Celli, 2008). Pulmonary rehabilitation has been found to be a cost effective management strategy that can reduce health service utilisation (Cecins, 2008; Golmohammadi et al, 2004). Non-invasive ventilation is a highly cost effective treatment that both reduces total costs and improves mortality in hospital (Plant et al, 2003). Lung volume reduction surgery for emphysema, and endobronchial lung volume reduction provide an alternative to lung transplantation for patients with severe COPD (Celli, 2008).
Given the significant advances in research and effective treatment strategies for COPD in recent years, the number of options suggests a proactive and positive approach to COPD is justified. The COPD-X guidelines outline comprehensive evidence based diagnosis and management strategies for Australian clinicians and COPD patients. However, given an estimated total financial cost of $9.4 billion in 2008 and the likelihood that ageing will see this cost increase over time, new policy emphasis may further minimise the loss of wellbeing and limit health system and other costs.
There is a growing stock of literature and research around COPD and cost effective intervention strategies, some international and others tested in Australia. Research has identified that the rational use of single or multiple therapeutic methods in combination, based on individual needs, has an impact on exacerbations and hospitalisations (Celli, 2008). Since COPD is treatable and preventable, losses to society can be minimised if such cost effective interventions are appropriately administered.
Major evidence based cost effective therapeutic methods for treating COPD include:
� early diagnosis;
� smoking cessation;
� active participation in disease management;
� oxygen therapy (for patients with low blood oxygen levels) and pulmonary rehabilitation;
� lung volume reduction surgery (for selected emphysema patients)/lung transplants;
� completion of planned pharmacological trials; and
� combination pharmacological therapy.
If applied in the Australian clinical setting, these interventions could significantly improve quality of life and minimise the costs directly related to COPD in the Australian community and health care system, as outlined in the following sections.
6.2.1 EARLY DIAGNOSIS
As COPD is a highly prevalent progressive condition, the early diagnosis of COPD provides the best opportunity to slow the progression of the disease principally through smoking cessation, but also by aggressive medical management (Ramsey and Sullivan, 2004). Early diagnosis is the key to avoiding serious breathlessness that impacts on productivity and wellbeing. If a patient is not diagnosed until the latter stages of COPD are apparent, medical management becomes more costly and complicated. Examination of adult patients in the primary care setting found large numbers of newly detected patients with COPD symptoms who needed treatment (Bednarek et al, 2008). Figure 2-5 compared self reported findings from the NHS to the BOLD prevalence data and indicated that under diagnosis is clearly an

Economic impact of COPD
51
issue in Australia. While early diagnosis can be problematic, education, access to spirometry and a sound understanding of the other diagnostic tools available to Australian clinicians can minimise under diagnosis and late diagnosis. Table 6-1 presents studies emphasising the cost effectiveness of early diagnosis and intervention.
TABLE 6-1: COST EFFECTIVENESS OF EARLY INTERVENTION
Study Intervention Results Ramsey and Sullivan 2004
Early diagnosis Best chance of minimising costs on health service providers and society. Better understanding of early signs and symptoms required to slow disease progression.
Frith et al 2008 Early diagnosis The potential for reducing the burden of COPD depends on prevention and early diagnosis.
Voelkel 2000 Raising public awareness and early intervention
Early identification of COPD improves patient wellbeing and the ability to improve longitudinal care outcomes.
6.2.2 SMOKING CESSATION
Smoking is the main cause of COPD, so smoking cessation is the most important component of therapy for patients who still smoke (Celli et al, 2004). Exposure to cigarette smoke and occupational hazards is a major cause of COPD; cigarette smoking is estimated to account for more than 75% of all COPD cases (Pbert, 2006). The most cost effective method of dealing with any disease is prevention – in this case, reducing the incidence of smoking and exposure to occupational hazards likely to be the most cost effective of COPD interventions (Table 6-2).
TABLE 6-2: SMOKING CESSATION EVIDENCE
Study Intervention Results Hurley et al 2008 Australian national tobacco
campaign. 32,682 COPD cases avoided. Cost effective.
Hoogendoorn et al 2008
Pharmacotherapy – varenicline (tested using BENESCO model)
Cost effective compared with nortriptyline and unaided cessation. Cost saving compared with bupropion.
Pbert 2006 Smoking cessation in COPD patients using nicotine sublingual tablets and behavioural support
Significant improvement in FEV1 and a stabilisation of lung function.
Celli et al 2004 Interventions for COPD patients – quit smoking
Smoking cessation is the most important component of therapy for patients who still smoke
The Australian national tobacco campaign is an example of a key cost effective intervention strategy that yielded significant positive results for a relatively minor outlay (Hurley et al, 2008). In addition, there are also many new pharmacological interventions available for smoking that may be cost effective in the Australian setting and more likely to achieve the desired results (Hoogendoorn et al, 2008; Pbert, 2006).
Smoking cessation is the only treatment that has been found to unequivocally reduce the rate of lung function decline in patients with COPD, with the rate of FEV1 loss slowing and potentially returning to the rate of decline of similarly aged individuals who have never smoked soon after cessation (Pbert, 2006).
6.2.3 ACTIVE PARTICIPATION IN DISEASE MANAGEMENT PROGRAMS
Once COPD is diagnosed, patients should be encouraged to actively participate in disease management. This concept of ‘collaborative management’ may improve self-reliance and esteem. All patients should be encouraged to lead a healthy lifestyle and exercise regularly.

Economic impact of COPD
52
Preventive care is extremely important at this time, and all patients should receive immunisations including pneumococcal vaccine and yearly influenza vaccinations (Celli et al, 2004). Evidence of cost effectiveness is summarised in Table 6-3.
TABLE 6-3: ACTIVE PARTICIPATION IN DISEASE MANAGEMENT PROGRAMS
Study Intervention Results
Bourbeau et al 2006 In addition to usual care, patients received education on COPD self management with ongoing supervision
COPD has positive economic benefits and is cost saving
Matheson et al 2006 COPD management in a community based cohort
Most subjects were undertreated. Diagnosis monitoring and referral systems should be improved and preventive activities such as flu vaccination and smoking cessation should be intensified.
Rea et al 2004 Compared the effect of a disease management program with conventional care on hospital admissions and quality of life
Chronic disease management programs can reduce hospital admissions and hospital days
Gallefoss et al 2002 Cost-benefit and cost effectiveness analysis of self management
Moving to self care reduced need for rescue medication and resulted in savings. Patient education also improved patient outcomes and reduced costs.
Smith et al 2002 Coordinated care (includes care coordinator, care guidelines, service coordinator and care mentor)
Coordinated care did not affect hospitalisation but was associated with an improvement in quality of life.
Nicholson et al 2001 Compared integrated home-based care with traditional inpatient care
Care at home can substitute for usual hospital care for some patients, and release resources
Sala et al 2001 Supported discharge of COPD patients – including oxygen therapy, bronchodilators, antibiotics, and steroids
Supported discharge shortens hospital stay in patients hospitalised due to an exacerbation of COPD
Sala et al (2001), in a Spanish study, found that the use of a supported discharge program for COPD patients following an exacerbation allowed for a significant reduction in the length of hospital stays and reduced the utilisation of hospital resources. Patients can be safely discharged from hospital during the course of the disease so long as adequate home supervision is provided.
Rea et al (2004) in New Zealand found that a chronic disease management program reduced days in hospital for patients with COPD. Mean hospital bed days per patient were reduced from 2.8 to 1.1 in the intervention group, while the conventional care group of patients recorded an increase from 3.5 to 4.0. The disease management program incorporated a variety of interventions including pulmonary rehabilitation, patient participation and information sharing among health care providers.
Bourbeau et al (2006) in Canada found that disease management with self management education provided by a case manager was of benefit to COPD patients and also provided positive economic benefits. The study included 96 people assigned to self management and 95 to usual care. During the one year following the self management program, hospital admissions were significantly lower in the self management group, as were hospital days per patient. With case loads of 30 ($2,053), 50 ($1,326) and 70 ($1,016), the costs of self

Economic impact of COPD
53
management in 2004 Canadian dollars compared favourably to the usual care group with costs estimated to be lower by $1,496, $2,148, and $2,428 respectively.
6.2.4 OXYGEN THERAPY
Oxygen therapy is an important component of managing COPD which focuses on improving function in daily activities and preventing complications without necessarily altering lung function. The results of the Nocturnal Oxygen Therapy Trial (1980) and the British Medical Research Council (1981) study showed that supplemental oxygen improves survival in patients with hypoxemia (a deficiency in the concentration of dissolved oxygen in arterial blood). Other beneficial effects of long term oxygen use include reductions in polycythemia (the over production of red blood cells related to chronically low oxygen gas levels), pulmonary artery pressures, breathlessness, hypoxemia during sleep and reduced nocturnal arrhythmias.
The use of oxygen therapy has been shown to improve neuropsychiatric testing results improving assessment of impairments to cognitive performance (Wilson et al, 1985). Oxygen use can also increase exercise tolerance. Oxygen supplementation to patients who desaturate (i.e., do not have enough oxygen in the bloodstream) during exercise also improves exercise performance – exercise can reduce the severity of exacerbations and the length of hospital stays following exacerbations. Despite the evidence supporting LTOT for some patients, subsidy for this treatment varies significantly from state to state, and in some cases, from hospital catchment to hospital catchment area. Access to support, therefore, is inequitable and depends not just on need but on where the patient lives.
Evidence of cost effectiveness is summarised in Table 6-4.
TABLE 6-4: OXYGEN THERAPY EVIDENCE
Study Intervention Results
Croxton and Bailey 2006
Long term oxygen treatment Long term oxygen treatment prolongs life in patients with COPD and has proven impact on public health.
Nocturnal Oxygen Therapy Trial Group 1980
Patients with hypoxemic COPD randomly allocated to either continuous oxygen (O2) therapy or 12-hour nocturnal O2 therapy and followed for 12 months
Overall mortality in the nocturnal O2 therapy group was 1.94 times that in the continuous O2 therapy group (P = 0.01).
British Medical Research Council Working Party 1981
Randomised oxygen therapy (treated) compared to no oxygen therapy (controls).
Supplemental oxygen improves survival in patients with hypoxemic COPD.
Celli 2008 Supplemental oxygen therapy The beneficial effects of oxygen provide evidence that the disease can be successfully modified.
Reisfield and Wilson 2004
Use of oxygen concentrator Oxygen concentrator the most cost effective of the various oxygen delivery systems from an institutional standpoint.
O’Neill et al 2005 Short burst oxygen therapy - replacing canisters with concentrators.
An oxygen assessment service could determine the most appropriate prescription and the most cost effective method of delivery.
Cullen 2006 Long term oxygen therapy Adherence to 15 hours a day of oxygen therapy is necessary to achieve clinical outcomes.

Economic impact of COPD
54
Associate Professor Alan Crockett estimated the cost of Home Oxygen Use Therapy in Australia based on the prevalence figures used in this report for Stage III and IV COPD. Research suggests that approximately 10% of this group are likely to be undergoing Long Term Oxygen Therapy, at a cost of around $22.5 million per annum. These estimates are based on research published in Crockett et al (1986, 1991, 1992, 1996, 2001) and McDonald et al (2005).
6.2.4.1 PULMONARY REHABILITATION
Pulmonary rehabilitation is an essential component of the comprehensive management of patients with symptomatic COPD (Celli, 2008). Patients with moderate to moderately severe COPD are likely to be the best candidates for treatment. Successful participation in pulmonary rehabilitation programs can prevent the disabling effects of end-stage respiratory failure, and as outlined by Cecins et al (2008), and are cost effective in the Australian context. Pulmonary rehabilitation can change outcomes that predict survival (Celli, 2008).
Cecins et al (2008) presents evidence from recent research undertaken in Australia that treatment of COPD is likely to be most cost effective if diagnosed early. Importantly, this research shows that participation in a pulmonary rehabilitation program:
� reduces health care utilisation for people with COPD in particular, hospitalisations due to COPD (one of the greatest cost elements11); and
� improves functional exercise capacity – keeping in mind that this is a core reason for lower quality of life due to COPD.
The results of this study therefore present an important step forward in the available treatments for Australian patients. The study also found that savings incurred from the reduction in hospitalisations far outweighed the costs of providing the program.
Pulmonary rehabilitation: A cost effective interven tion trialled in WA
The Cecins et al (2008) study in Western Australia reported on an 8 week outpatient program (n=256, of which 73% completed the pulmonary rehabilitation program) for pulmonary rehabilitation, comparing the number of hospital admissions and bed-days due to COPD before and following completion of the pulmonary rehabilitation program.
The results recorded a 46% reduction in the number of patients admitted to hospital with a COPD exacerbation (71 to 38) and a 62% reduction in total bed days (1131 to 432).
The study concluded that pulmonary rehabilitation provided in an Australian teaching hospital was associated with a reduction in COPD hospitalisations, and that the resultant savings outweighed the costs of providing the program.
In 2003 dollars, for 256 patients, the total costs of the program were estimated at $93,440 (or $292 per patient). The reduction in hospitalisations in the 12 months following the program resulted in estimated savings of $397,032, with a benefit-cost ratio of around 4.25 in the following 12 months (in current dollar terms).
11 This is consistent with the evidence from the AIHW presented in Table 3-1, where hospitalisation costs accounted for around 63% of health system costs associated with COPD.

Economic impact of COPD
55
Pulmonary rehabilitation programs have also been explored by The Australian Lung Foundation in The COPD-X guidelines, where reduced health care costs for those who participate in pulmonary rehabilitation compared to those who do not are cited as a compelling argument for increasing use of pulmonary rehabilitation in Australian and New Zealand treatment programs (McKenzie et al, 2003).
TABLE 6-5: PULMONARY REHABILITATION
Study Intervention Results
Clini and Romagnoli 2005
Inpatient pulmonary rehabilitation Pulmonary rehabilitation demonstrates short and long term clinical efficacy and has been shown to be cost effective in COPD patients independent of disease stage.
Cecins et al 2008 Pulmonary rehabilitation Appropriate patients are likely to benefit from referral to pulmonary rehabilitation. Pulmonary rehabilitation provided in an Australian teaching hospital was associated with a reduction in COPD hospitalisation, and the resultant savings outweighed the costs of providing the program.
Griffiths et al 2001 Pulmonary rehabilitation This outpatient pulmonary rehabilitation program produces cost effective per QALY ratios within bounds considered to be cost effective and is likely to result in financial benefits to the health service.
Katsura et al 2003 Pulmonary rehabilitation Pulmonary rehabilitation is an effective treatment in terms of improving breathlessness, exercise capacity and health related quality of life in elderly patients and the benefits are almost comparable for young-elderly and old-elderly patients.
In summary, the literature available on self management programs, in some instances run by case managers and, in particular, including pulmonary rehabilitation (notably in Australia the Cecins et al, 2008, study) generally represent cost effective COPD interventions that may improve patient quality of life and also reduce healthcare system costs from COPD. The challenge now is to provide equitable access to pulmonary rehabilitation and self management programs to reduce the economic burden of COPD, for example by providing a Medicare rebate for such programs.
6.2.5 LUNG VOLUME REDUCTION SURGERY / LUNG TRANSPLANTATION
Emphysema is sometimes treated with lung volume reduction surgery, an alternative to lung transplantation for selected patients. Reduction surgery is generally cost effective when compared to lung transplant surgery although, compared to other medical interventions, it may only be cost effective for certain patients. Lung volume reduction surgery improves FEV1 by close to 10%, with larger improvements in exercise tolerance, breathlessness and health-related quality of life (Celli 2008).
There are also new techniques being reported that are capable of achieving lung volume reduction without the surgical risk. Bronchoscopic placement of one-way valves or biological substances capable of inducing closure of emphysematous areas may add to the range of treatments available for patients with advanced COPD (Celli, 2008).
In patients with diffuse severe emphysema, lung transplantation results in normalisation of pulmonary function, and improvement in exercise capacity and quality of life, but its effect on survival remains controversial (Celli, 2008).
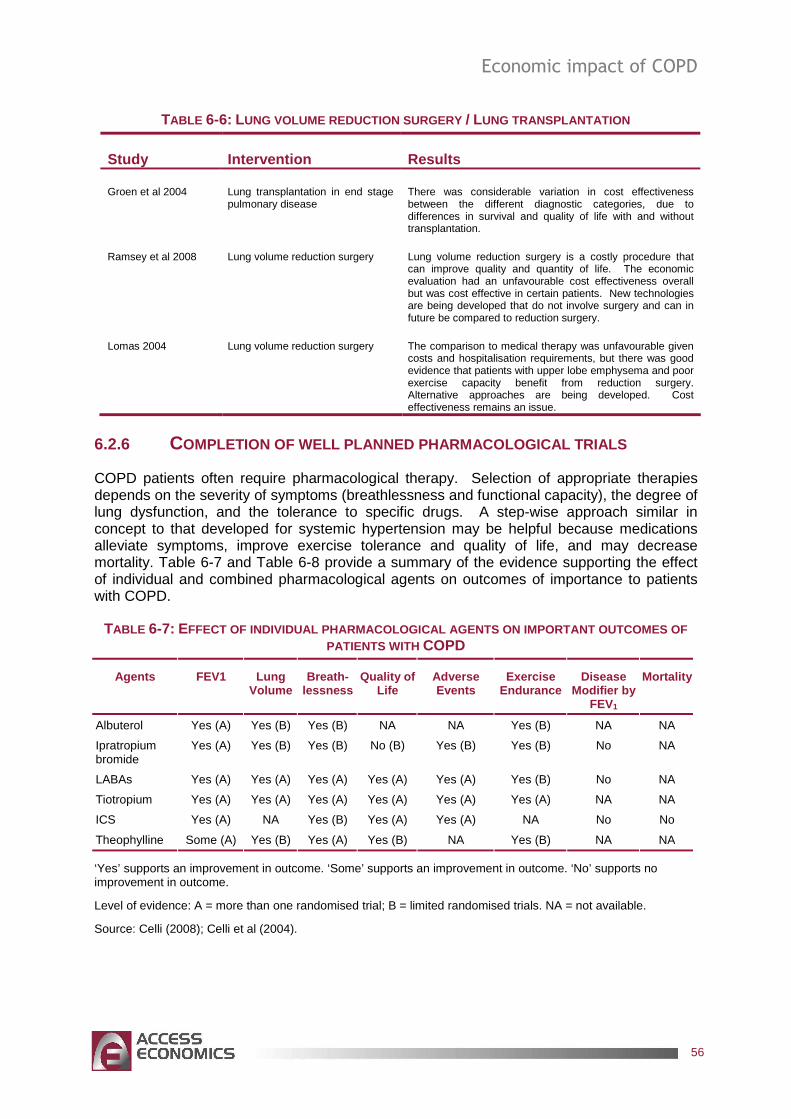
Economic impact of COPD
56
TABLE 6-6: LUNG VOLUME REDUCTION SURGERY / LUNG TRANSPLANTATION
Study Intervention Results
Groen et al 2004 Lung transplantation in end stage pulmonary disease
There was considerable variation in cost effectiveness between the different diagnostic categories, due to differences in survival and quality of life with and without transplantation.
Ramsey et al 2008 Lung volume reduction surgery Lung volume reduction surgery is a costly procedure that can improve quality and quantity of life. The economic evaluation had an unfavourable cost effectiveness overall but was cost effective in certain patients. New technologies are being developed that do not involve surgery and can in future be compared to reduction surgery.
Lomas 2004 Lung volume reduction surgery The comparison to medical therapy was unfavourable given costs and hospitalisation requirements, but there was good evidence that patients with upper lobe emphysema and poor exercise capacity benefit from reduction surgery. Alternative approaches are being developed. Cost effectiveness remains an issue.
6.2.6 COMPLETION OF WELL PLANNED PHARMACOLOGICAL TRIALS
COPD patients often require pharmacological therapy. Selection of appropriate therapies depends on the severity of symptoms (breathlessness and functional capacity), the degree of lung dysfunction, and the tolerance to specific drugs. A step-wise approach similar in concept to that developed for systemic hypertension may be helpful because medications alleviate symptoms, improve exercise tolerance and quality of life, and may decrease mortality. Table 6-7 and Table 6-8 provide a summary of the evidence supporting the effect of individual and combined pharmacological agents on outcomes of importance to patients with COPD.
TABLE 6-7: EFFECT OF INDIVIDUAL PHARMACOLOGICAL AGENTS ON IMPOR TANT OUTCOMES OF PATIENTS WITH COPD
Agents FEV1 Lung Volume
Breath-lessness
Quality of Life
Adverse Events
Exercise Endurance
Disease Modifier by
FEV1
Mortality
Albuterol Yes (A) Yes (B) Yes (B) NA NA Yes (B) NA NA
Ipratropium bromide
Yes (A) Yes (B) Yes (B) No (B) Yes (B) Yes (B) No NA
LABAs Yes (A) Yes (A) Yes (A) Yes (A) Yes (A) Yes (B) No NA
Tiotropium Yes (A) Yes (A) Yes (A) Yes (A) Yes (A) Yes (A) NA NA
ICS Yes (A) NA Yes (B) Yes (A) Yes (A) NA No No
Theophylline Some (A) Yes (B) Yes (A) Yes (B) NA Yes (B) NA NA
‘Yes’ supports an improvement in outcome. ‘Some’ supports an improvement in outcome. ‘No’ supports no improvement in outcome.
Level of evidence: A = more than one randomised trial; B = limited randomised trials. NA = not available.
Source: Celli (2008); Celli et al (2004).

Economic impact of COPD
57
TABLE 6-8: EFFECT OF SOME COMBINED PHARMACOLOGICAL AGENTS ON IM PORTANT OUTCOMES OF PATIENTS WITH COPD
Agents FEV 1 Lung Volume
Breath-lessness
Quality of Life
Adverse Events
Exercise Endurance
Disease Modifier by
FEV1
Mortality
Salmeterol plus theophylline
Yes (B) NA Yes (B) Yes (B) NA NA NA NA
Formoterol plus tiotropium
Yes (A) NA Yes (B) Yes (B) NA NA NA NA
Salmeterol plus fluticasone
Yes (A) Yes (B) Yes (A) Yes (A) Yes (A) Yes (B) Yes Some
Formoterol plus budesonide
Yes (A) NA Yes (A) Yes (A) Yes (A) NA NA NA
Tiotropium plus salmeterol plus fluticasone
Yes (A) NA Yes (B) Yes (A) Yes (A) NA NA NA
See Table 6-7 for expansion of abbreviations and definition of terms.
Source: Celli (2008).
Most studies that have explored the value of combination therapy have shown significant improvements over single agents alone, and it may be time to think of combination therapy as first-line therapy (Celli, 2008).
� A recent trial comprising over 400 patients with symptomatic COPD compared the effectiveness of therapy using tiotropium in all patients combined with placebo in group 1, with salmeterol in group 2, and with the combination of salmeterol and fluticasone in the third group.
���� Although the primary outcome, the exacerbation rate, was similar among the groups, the number of hospitalisations, health-related quality of life, and lung function was significantly better in the group receiving tiotropium plus salmeterol and fluticasone compared with tiotropium plus placebo and tiotropium plus salmeterol (Celli, 2008).
Research trials support the concept that intense and aggressive therapy does modify the course of COPD. Understanding the disease-modification effect of the currently available medications is important to ensure that combination therapy yields the best results in a cost effective manner.

Economic impact of COPD
58
7. COST SUMMARY, COMPARISONS AND CHALLENGES
Finally, this chapter summarises the costs by type of cost and by who bears them, as well as drawing conclusions from the analysis of diagnostic issues and cost effective interventions to develop a set of recommendations for Commonwealth and State governments, building on strategies recommended in previous evidence-based reviews.
7.1 COST SUMMARY
In 2008, the financial cost of COPD was $8.8 billion (Table 7-1). Of this:
� $6.8 billion (76.6%) was productivity lost due to lower employment, absenteeism and premature death of Australians with COPD;
� $0.9 billion (9.7%) was direct health system expenditure;
� $0.9 billion (10.0%) was the DWL from transfers including welfare payments and taxation forgone; and
� $0.3 billion (3.6%) was other indirect costs such as aids and home modifications and the bring-forward of funeral costs.
Additionally, the value of the lost wellbeing (disability and pre mature death) was a further $89.4 billion .
� In per capita terms, this amounts to a financial cost of $7,446 per person with COPD per year. Including the value of lost wellbeing, the cost is estimated as $82,925 per person per year (Table 7-1).
TABLE 7-1: COPD, TOTAL COSTS BY TYPE OF COST AND BEARER , AUSTRALIA , 2008
IndividualsFamily/Friends
Federal Government
State and Territory
GovernmentsEmployers
Society/Other
Total
Burden of disease 89,398 0 0 0 0 0 89,398Health system costs 139 10 368 213 0 127 857Productivity costs 4,237 0 2,148 0 373 0 6,758Carer costs 0 0 0 0 0 0 0Other Indirect costs 0 132 62 62 0 62 318Deadweight losses 0 0 0 0 0 886 886Transfers -352 0 352 0 0 0 0Total financial costs 4,024 142 2,929 275 373 1,075 8,819Total costs including burden of disease 93,422 142 2,929 275 373 1,075 98,216
Burden of disease 75,480 0 0 0 0 0 75,480Health system costs 118 8 311 180 0 107 724Productivity costs 3,577 0 1,813 0 315 0 5,706Carer costs 0 0 0 0 0 0 0Other Indirect costs 0 111 52 52 0 52 268Deadweight losses 0 0 0 0 0 748 748Transfers -297 0 297 0 0 0 0Total financial costs 3,398 120 2,473 232 315 907 7,446Total costs including burden of disease 78,877 120 2,473 232 315 907 82,925
Total cost ($ million)
Cost per person with COPD ($)
The shares by each type of financial cost are illustrated in Figure 7-1, while the financial cost shares by bearer are shown in Figure 7-2.

Economic impact of COPD
59
FIGURE 7-1: FINANCIAL COSTS OF COPD, BY TYPE OF COST (% TOTAL)
Health System Costs
9.7%
Productivity Costs
76.6%
Other Indirect Costs
3.6%
DWL
10.0%
FIGURE 7-2: FINANCIAL COSTS OF COPD, BY BEARER (% TOTAL)
Individuals
45.6%
Family/Friends
1.6%
Federal Government
33.2%
State Government
3.1%
Employers
4.2%
Society/Other
12.2%
Individuals with COPD bear 45.6% of the financial costs, and their families and friends bear a further 1.6%. Federal government bears just under one third (33.2%) of the financial costs (mainly through taxation revenues forgone and welfare payments). State governments bear around 3.1% of the costs, while employers bear 4.2% and the rest of society bears the remaining 12.2%.
If the burden of disease (lost wellbeing) is included, individuals bear 95.1% of the costs and Federal government bears 3.0%, with family and friends 0.1%, State governments 0.3%, employers 0.4% and others in society 1.1%.

Economic impact of COPD
60
7.2 COMPARISONS
This section compares COPD with National Health Priority Areas (NHPAs) and other conditions. The NHPAs are cancer, cardiovascular disease, musculoskeletal diseases, mental disorders, diabetes, asthma and injuries.
7.2.1 PREVALENCE COMPARISONS
COPD is high in prevalence, affecting around 1,184,397 people in Australia (5.6% of the population) in 2008 in its Stage II or higher form. COPD is more common in any year than the most common types of cancer, road traffic accidents, heart disease or diabetes (Table 7-2).
TABLE 7-2: COPD, PREVALENCE COMPARISONS WITH OTHER CONDITIONS
Number of Australians
Prostate cancer* 11,899b
Breast cancer* 12,359b
Bowel cancer* 13,552b
Stroke* 19,627b
Road traffic accidents* 25,381b
Type I diabetes* 97,440a
Dementia 167,378a
Coronary heart disease* 309,726a
Type II diabetes* 1,073,459a
COPD 1,184,397 Asthma* 1,356,620a
Arthritis* 3,848,304c a Begg et al (2007) for the year 2003. b As (c), but incident cases. c Access Economics (2007b) for the year 2007.* NHPAs.
7.2.2 COST COMPARISONS
Cost comparisons are undertaken in terms of costs per capita, since otherwise prevalence dominates the profile. Table 7-3 compares costs for 15 conditions studied by Access Economics in recent years, ranked from highest to lowest in terms of financial cost per annum per person. The table shows COPD to be a relatively costly disease on a case basis at $7,446 per person per annum in financial costs and $82,925 per person per annum in total costs (i.e., including the dollar value of the burden of disease).
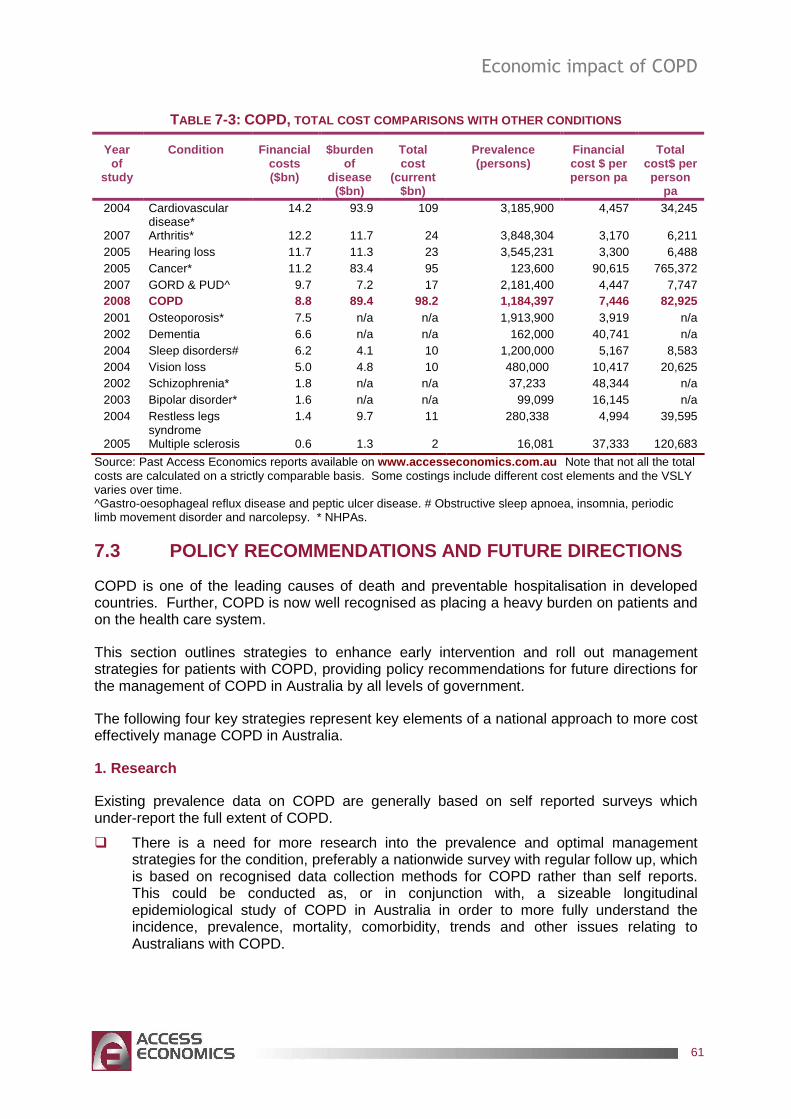
Economic impact of COPD
61
TABLE 7-3: COPD, TOTAL COST COMPARISONS WITH OTHER CONDITIONS
Year of
study
Condition Financial costs ($bn)
$burden of
disease ($bn)
Total cost
(current $bn)
Prevalence (persons)
Financial cost $ per person pa
Total cost$ per person
pa 2004 Cardiovascular
disease* 14.2 93.9 109 3,185,900 4,457 34,245
2007 Arthritis* 12.2 11.7 24 3,848,304 3,170 6,211 2005 Hearing loss 11.7 11.3 23 3,545,231 3,300 6,488 2005 Cancer* 11.2 83.4 95 123,600 90,615 765,372 2007 GORD & PUD^ 9.7 7.2 17 2,181,400 4,447 7,747 2008 COPD 8.8 89.4 98.2 1,184,397 7,446 82,925 2001 Osteoporosis* 7.5 n/a n/a 1,913,900 3,919 n/a 2002 Dementia 6.6 n/a n/a 162,000 40,741 n/a 2004 Sleep disorders# 6.2 4.1 10 1,200,000 5,167 8,583 2004 Vision loss 5.0 4.8 10 480,000 10,417 20,625 2002 Schizophrenia* 1.8 n/a n/a 37,233 48,344 n/a 2003 Bipolar disorder* 1.6 n/a n/a 99,099 16,145 n/a 2004 Restless legs
syndrome 1.4 9.7 11 280,338 4,994 39,595
2005 Multiple sclerosis 0.6 1.3 2 16,081 37,333 120,683
Source: Past Access Economics reports available on www.accesseconomics.com.au Note that not all the total costs are calculated on a strictly comparable basis. Some costings include different cost elements and the VSLY varies over time. ^Gastro-oesophageal reflux disease and peptic ulcer disease. # Obstructive sleep apnoea, insomnia, periodic limb movement disorder and narcolepsy. * NHPAs.
7.3 POLICY RECOMMENDATIONS AND FUTURE DIRECTIONS
COPD is one of the leading causes of death and preventable hospitalisation in developed countries. Further, COPD is now well recognised as placing a heavy burden on patients and on the health care system.
This section outlines strategies to enhance early intervention and roll out management strategies for patients with COPD, providing policy recommendations for future directions for the management of COPD in Australia by all levels of government.
The following four key strategies represent key elements of a national approach to more cost effectively manage COPD in Australia.
1. Research
Existing prevalence data on COPD are generally based on self reported surveys which under-report the full extent of COPD.
� There is a need for more research into the prevalence and optimal management strategies for the condition, preferably a nationwide survey with regular follow up, which is based on recognised data collection methods for COPD rather than self reports. This could be conducted as, or in conjunction with, a sizeable longitudinal epidemiological study of COPD in Australia in order to more fully understand the incidence, prevalence, mortality, comorbidity, trends and other issues relating to Australians with COPD.

Economic impact of COPD
62
2. Diagnosis and early intervention
There is general agreement in the literature that COPD has long been under-diagnosed both in Australia and across the world. Under-diagnosis is a significant issue because the earlier COPD is diagnosed, the earlier steps can be taken to improve lung health and to prevent further damage to the airway. Early intervention is the key to reducing the progression of the disease into stages that involve a significant impact on quality of life and costs to the health system.
� Under-diagnosis should be addressed with the rollout of a nationwide education and spirometric testing campaign – initially for all current or ex-smokers over the age of 35.
� In order to address what can be complex diagnostic issues, clinician education is needed to increase awareness of the sound guidelines now available to guide the COPD diagnostic process.
� Early intervention strategies should include smoking cessation initiatives, reducing exposures to respiratory irritants, and early participation in management programs.
� Other cost effective interventions can also be implemented in a timely fashion based on assessment and evidence outlined in the COPD-X guidelines (McKenzie et al, 2003).
3. Health service delivery issues
In addition to prevention and early diagnosis, cost effective management strategies for COPD that enhance quality of life are currently under-utilised in Australia and need broader acceptance by clinicians and greater accessibility for patients.
� Education and awareness campaigns should be introduced together with the expansion of self management programs to focus on exacerbation management and disease control.
� Access to pulmonary rehabilitation that aims to reduce exacerbations and includes a focus on minimising employment impact should be extended to allow equitable access to all Australians regardless of where they live. This could be achieved through the addition of a Medicare item number to support pulmonary rehabilitation programs when referred by a medical practitioner.
� Comprehensive disease management plans including aggressive medical management should be provided for patients diagnosed at a moderate or severe stage;
� A more equitable system for the provision of Long Term Oxygen Therapy (LTOT) to ensure a similar level of provision for all people with COPD regardless of where they live in Australia. This could be managed by establishing a national registry or secretariat for LTOT. International precedents for this exist, including Denmark (Ringbaek J et al 2001) and in England and Wales (see Donaldson et al 2007). Also see Strom et al 1988, 1993 and Pepin et al 1996 – for other European experiences with national registers.
� There is a need to address splits between funding jurisdictions that currently can lead to poorly integrated and inefficient care provision and decision making.
4. Employment issues
COPD has a significant employment and productivity impact both through time away from work and from lower effectiveness while at work. Further, people with COPD have a significantly lower likelihood of attachment to the labour force.

Economic impact of COPD
63
� Strategies that adequately diagnose and manage COPD in the early stages and that highlight employment continuation strategies have potential to lower the productivity costs associated with the disease.
� Greater workplace information and action is required in relation to exposures to and reduction of occupational risk factors (dust and chemicals that may affect people with COPD).

Economic impact of COPD
64
REFERENCES
Access Economics (2003) Exceptional Returns: The Value of Investing in Health R&D in Australia, Report for the Australian Society of Medical Research, September, Canberra.
Access Economics (2005) Acting positively: strategic implications of the economic costs of multiple sclerosis in Australia, Report for Multiple Sclerosis Australia, Winter, Canberra.
Access Economics (2006a) Listen Hear! The economic impact and cost of hearing loss in Australia, Report for CRC HEAR and the Victorian Deaf Society (Vicdeaf), May, Canberra.
Access Economics (2006b) The economic costs of obesity, Report for Diabetes Australia, October, Canberra.
Access Economics (2007b) Painful realities: the economic impact of arthritis in Australia in 2007, Report for Arthritis Australia, July, Canberra.
Access Economics (2007c) Gut instincts: the economic impact of GORD and PUD, Report for The Gut Foundation, May, Canberra.
Access Economics (2008) The Health of Nations: The Value of a Statistical Life. Report for the Office of the Australian Safety and Compensation Council (OASCC), January, Canberra.
Agusti AG (2005) ‘Systemic effects of chronic obstructive pulmonary disease.’ Proceedings from the American Thoracic Society 2(4):367-70.
Aldy JE, Viscusi WK (2006) Age variations in workers' value of statistical life, NBER Working Paper 10199, NBER, Cambridge, MA.
Australian Bureau of Statistics (2005) National Health Survey: Summary of Results 2004-05, Cat No 4364.0, Canberra.
Australian Bureau of Statistics (2003) Survey of Disability, Ageing and Carers, Cat No 4430.0.
Australian Institute of Health and Welfare (2005a) Chronic respiratory diseases in Australia: their prevalence, consequences and prevention AIHW Cat No PHE 63, Canberra.
Australian Institute of Health and Welfare (2005b) Health system expenditure on disease and injury in Australia, 2000-01, AIHW, 2nd edition, Cat No HWE 28, April, Canberra.
Badgett RG, Tanaka DJ, Hunt DK, Jelley MJ, Feinberg LE, Steiner JF, et al (2003) ‘Can moderate chronic obstructive pulmonary disease be diagnosed by historical and physical findings alone?’ The American journal of medicine 94(2):188-96.
Balmes J, Becklake M, Blanc P, Henneberger P, Kreiss K, Mapp C et al (2003) ‘American Thoracic Society Statement: Occupational contribution to the burden of airway disease’. Am J Respir Crit Care Med 167(5):787-97.

Economic impact of COPD
65
Bednarek M, Maciejewski J, Wozniak M, Kuca P, Zielinski J (2008) ‘Prevalence, severity and underdiagnosis of COPD in the primary care setting’, Thorax 63:402-407.
Begg S, Vos T, Barker B, Stevenson C, Stanley L, Lopez AD (2007) The burden of disease and injury in Australia 2003, AIHW PHE 82, April, Canberra.
Behrendt CE (2005) ‘Mild and Moderate-to-Severe COPD in Nonsmokers: Distinct Demographic Profiles’ Chest 128(3):1239-1243.
Bourbeau J, Collet J-P, Schwartzman K, Ducret T, Nault D, Bradley C (2006) Economic benefits of self-management education in COPD, American Journal of Chest Physicians, 130:1704-1711.
British Medical Research Council Working Party (1981) ‘Long-term domiciliary oxygen therapy in chronic hypoxic cor pulmonale complicating bronchitis and emphysema’. Lancet 1:681-685
Buist AS, McBurnie MA, Vollmer WM, Gillespie S, Burney P, Mannino DM, Menezes AMB, Sullivan SD, Lee TA, Weiss KB, Jensen RL, Marks GB, Gulsvik A, Nizankowska-Mogilnicka E, on behalf of the BOLD Collaborative Research Group (2007) ‘International variation in the prevalence of COPD (The BOLD Study): a population-based prevalence study’ Lancet 370:741–50.
Bureau of Transport and Regional Economics (2002) Rail accident costs in Australia, Bureau of Transport and Regional Economics, Report 108, Canberra.
Bureau of Transport Economics (2000) Road Crash Costs in Australia, Bureau of Transport Economics, Report 102, Canberra.
Cecins N, Geelhoed E, Jenkins SC (2008) ‘Reduction in hospitalisation following pulmonary rehabilitation in patients with COPD’ Australian Health Review, 32(3):415-422.
Celli BR (2008) ‘Update on the Management of COPD’ Chest 133(6):1-15.
Celli BR, MacNee W (2004) ‘Standards for the diagnosis and treatment of COPD’, Eur Respir J 23:932-946.
Clini EM, Romagnoli M (2005) ‘Inpatient pulmonary rehabilitation: does it make sense?’ Chronic Respiratory Disease Journal 2:43-46.
Crockett AJ, Alpers JH, Chalmers JP (1986) ‘Cost centre management: how it helped reduce home oxygen costs.’ Aust Health Rev. 9(1):38-42.
Crockett AJ, Alpers JH, Moss JR (1991) ‘Home oxygen therapy: an audit of survival.’ Aust NZ J Med 21(2):217-21.
Crockett A, Moss J, Alpers J (1992) ‘The continuing impact of home oxygen therapy for respiratory patients on a hospital budget.’ Aust Health Rev. 15(3):259-68.
Crockett AJ, Moss JR, Cranston JM, Alpers JH (1996) ‘Home oxygen therapy in Australia.’ Monaldi Arch Chest Dis. 51(5):444-5.

Economic impact of COPD
66
Crockett AJ, Cranston JM, Moss JR, Alpers JH (2001) ‘Survival on long-term oxygen therapy in chronic airflow limitation: from evidence to outcomes in the routine clinical setting.’ Intern Med J. 31(8):448-54.
Croxton TL, Bailey WC (2006) ‘Long-term oxygen treatment in chronic obstructive pulmonary disease: Recommendations for future research – An NHLBI (National Heart Lung and Blood Institute: Bethesda Maryland) workshop report.’ Am J Respir Care Med 174:373-378.
Cullen DL (2006) ‘Long term oxygen therapy adherence and COPD: what we don’t know’ Chronic Respiratory Disease Journal 3:217-222.
Cutler DM, Richardson E (1998) ‘The Value of Health: 1970-1990’ American Economic Review, 88: 97-100.
Donaldson GC, Edmonds G, Balfour-Lynn I, Calverley P, Garrod R, Morgan M, Wedzicha J (2007) Development of the British Thoracic Society Home Oxygen Database and prevalence of home oxygen use in England and Wales, Thorax; 62 (Supplement 3): A64-A149.
Duck A (2006) ‘Cost-effectiveness and efficacy in long-term oxygen therapy.’ Nursing Times Feb 14-20, 102(7):46-50
Frith PA, Cafarella PA, Duffy JM (2008) ‘Chronic obstructive pulmonary disease (COPD) is a major personal and public health burden in Australia’ Australia and New Zealand Journal of Public Health 32(2):139-141.
Frith PA, Esterman A, Crockett A (2004) ‘Chronic Obstructive Pulmonary Disease (COPD) in Australia: An under-recognised and under-treated burden’ COPD Prevalence and Treatment in Australia - The Australian Lung Foundation. 1:2-67.
Gallefoss F, Bakke PS (2002) ‘Cost-benefit and cost-effectiveness analysis of self-management in patients with COPD – a 1-year follow-up randomized, controlled trial’, Respiratory Medicine, 96:424-431.
GOLD (2008) ‘Global Strategy for the Diagnosis, Management, and Prevention of Chronic Obstructive Pulmonary Disease’, Executive Summary 2007 update released February.
Golmohammadi K, Jacobs P, Sin DD (2004) ‘Economic evaluation of a community-based pulmonary Rehabilitation program for chronic obstructive pulmonary disease’ Lung 182:187-196.
Griffiths TL, Phillips CJ, Davies S, Burr ML, Campbell IA (2001) ‘Cost effectiveness of an outpatient multidisciplinary pulmonary rehabilitation programme’ Thorax 56:779-784.
Groen H, van der Bij W, Koeter GH, TenVergert EM, (2004) ‘Cost-Effectiveness of Lung Transplantation in relation to Type of End-Stage Pulmonary Disease’ American Journal of Transplantation 4:1155-1162.
Hurley SF, Matthews JP, (2008) ‘Cost-effectiveness of Australian National Tabacco Campaign’ Tob. Control published online 21Aug 2008.

Economic impact of COPD
67
Hoogendoorn M, Weising P, Rutten-van Molken PMH, (2008) ‘Cost –effectiveness of varenicline compared to bupropion, NRT, and nortriptyline for smoking cessation in the Netherlands’ Current medical research and opinions 24(1):51-61
Jaén A, Zock JP, Kogevinas M, Ferrer A, Marín A (2006) ‘Occupation, smoking, and chronic obstructive respiratory disorders: a cross sectional study in an industrial area of Catalonia, Spain’ Environmental Health: A Global Access Science Source 5:2.
James AL, Palmer LJ, Kicic E, Maxwell PS, Lagan SE, Ryan GF, Musk AW (2005) ‘Decline in Lung Function in the Busselton Health Study: The Effects of Asthma and Cigarette Smoking’ American Journal of Respiratory and Critical Care Medicine 171:109-114.
Jones A, Woods-Baker R & Walters E H (2007) Domiciliary oxygen therapy services in Tasmania: prescription, usage and impact of a specialist clinic. Medical Journal of Australia. 186; p 632-4 and MASS Home Oxygen Service Review Report (2005).
Katsura H, Kanemaru A, Yamada K, Motegi T, Wakabayashi R, Kida K (2003) ‘Long-term effectiveness of an inpatient pulmonary rehabilitation program for elderly COPD patients: comparison between young-elderly and old-elderly groups.’ Respirology 9(2):230-236.
Knuiman MW, James AL, Divitini ML, Ryan G, Bartholomew HC, Musk AW (1999) ‘Lung function, respiratory symptoms, and mortality: results from the Busselton Health Study.’ Annals of Epidemiology. 9:297–306.
Lattimore R (1997) Research and Development Fiscal Incentives in Australia: Impacts and Policy Lessons, OECD Conference on Policy Evaluation in Innovation, 26-27 June, Paris, 81:574-7.
Lomas DA (2004) ‘Lung volume reduction surgery: where are we now’ Chron Respir Dis 1:2-4.
Mahler D, Wells C (1988) ‘Evaluation of clinical methods for rating dyspnea’ Chest 93:580-6.
Mannino DM (2007) ‘Defining chronic obstructive pulmonary disease… and the elephant in the room’. Eur Respir J 30:189–190.
Mannino DM, Braman S (2007) ‘The Epidemiology and Economics of Chronic Obstructive Pulmonary Disease’ Proceedings of the American Thoracic Society 4:502-506.
Mathers C, Vos T, Stevenson C (1999) The burden of disease and injury in Australia, AIHW Cat No PHE17, Canberra.
Marton JP, Boulanger L, Friedman M, Dixon D, Wilson J, Menzin J (2005) ‘Assessing the costs of chronic obstructive pulmonary disease: The state medicaid perspective’ Respiratory Medicine 100: 996-1105.
Matheson MC, Abeysena C, Raven JM, Skoric B, Johns DP, Abramson MJ, Walters EH, (2006) ‘How have we been managing chronic obstructive pulmonary disease in Australia?’ Internal Medicine Journal 36:92-99.
McDonald CF, Crockett AJ, Young IH (2005) Adult domiciliary oxygen therapy. Position statement of the Thoracic Society of Australia and New Zealand. Med J Aust. 182(12):621-6.

Economic impact of COPD
68
McKenzie DK, Abramson M, Crockett AJ, Glasgow N, Jenkins S, McDonald C, Wood-Baker R, Frith PA (2003) ‘The COPD-X Plan: Australian and New Zealand Guidelines for the management of Chronic Obstructive Pulmonary Disease 2003’ Med J Aust 178(6 Suppl):S1-S40.
Miller P, Mulvey C, Norris K (1997) ‘Compensating Differentials for Risk of Death in Australia’ Economic Record, 73: 363–372.
Mittmann N, Kuramoto L, Seung SJ, Haddon JM, Bradley-Kennedy C, FitzGerald JM (2007) ‘The cost of moderate and severe COPD exacerbations to the Canadian healthcare system’ Respiratory Medicine 102:413-421.
Murphy KM, Topel R (1999) The Economic Value of Medical Research, University of Chicago Business School.
Murphy KM, Topel RH (2005) The Value of Health and Longevity, NBER Working Paper No 11405.
Murray C, Lopez A (1996) The Global Burden of Disease: a comprehensive assessment of mortality and disability from diseases, injuries and risk factors in 1990 and projected to 2020, Volume 1, Global Burden of Disease and Injury Series, Harvard: Harvard School of Public Health.
Murray C, Lopez A, Mathers C, Stein C (2001) The Global Burden of Disease 2000 Project: aims, methods & data sources, Discussion Policy Paper No 36, World Health Organization, November.
Nicholson C, Bowler S, Jackson C, Schollay D, Tweeddale M, O’Rourke P (2001) ‘Cost comparison of hospital and home-based treatment models for acute chronic obstructive pulmonary disease’, Australian Health Review, 24(4):181-187.
Nocturnal Oxygen Therapy Trial Group (1980) ‘Continuous or nocturnal oxygen therapy in hypoxemic chronic obstructive lung disease’, Ann Intern Med 93. 391-398.
Nordhaus WD (2002) The Health of Nations: The Contribution of Improved Health to Living Standards, NBER Working Paper No.8818.
O’Neill B, Bradley JM, McKevitt AM, Heaney L, Riley M, MacMahon J (2005) ‘Short burst oxygen therapy in COPD: A patient Survey.’ International Journal Clinical Practice 59:751-753.
Pbert L (2006) ‘Nurse-Conducted Smoking Cessation in Patients with COPD, Using Nicotine Sublingual Tablets and Behavioral Support’ Chest 130:314-316.
Pépin JL, Barjhoux CE, Deschaux C, Brambilla C (1996) Long-term oxygen therapy at home. Compliance with medical prescription and effective use of therapy. ANTADIR Working Group on Oxygen Therapy. Association Nationale de Traitement à Domicile des Insuffisants Respiratories Chest, 1996 May;109(5):1144-50.
Plant PK, Owen JL, Parrott S, Elliott MW (2003) ‘Cost effectiveness of ward based non-invasive ventilation for acute exacerbations of Chronic obstructive pulmonary disease: economic analysis of randomised controlled trial’ BMJ 326:956.

Economic impact of COPD
69
Productivity Commission (2003) ‘Evaluation of the Pharmaceutical Industry Investment Program’ Research Report, AusInfo, Canberra.
Ramsey SD, Sullivan SD (2004) ‘Chronic Obstructive Pulmonary Disease: Is there a case for early intervention?’ American Journal of Medicine, 117(12a):3S-10S.
Ramsey SD, Sullivan SD, Kaplan RM (2008) ‘Cost effectiveness of lung volume reduction surgery’ Proc AM Thorac Soc 5:406-411.
Rea H, McAuley S, Stewart A, Lamont C, Roseman P, Didsbury P (2004) ‘A chronic disease management programme can reduce days in hospital for patients with chronic obstructive pulmonary disease’ Internal Medicine Journal 34:608-614.
Reisfield GM, Wilson GR (2004) ‘The cost of Breathing: An economic analysis of the patient cost of home oxygen therapy’ American journal of hospice and palliative medicine 21(5):348-352.
Ringbaek J, Lange P, Viskum K (2001) Geographic Variation in Long-term Oxygen Therapy in Denmark: Factors Related to Adherence to Guidelines for Long-term Oxygen Therapy, Chest; 119(6): 1711-16.
Sala E, Alegre L, Carrera M, Ibars M, Orriols FJ, Blanco ML, Carceles F, Bertran S, Mata F, Font I, Agusti AGN (2001) ‘Supported discharge shortens hospital stay in patients hospitalised because of an exacerbation of COPD’ Eur Respir J 17:1138-1142.
Schelling (1968) ‘The life you save may be your own’ in SB Chase (ed) Problems in public expenditure and analysis, Brookings Institution, Washington DC, 127-162.
Serginson JG, Yang IA, Armstrong JG, Cooper DM, Matthiesson A, Morrison SC, Gair J, Cooper B, Zimmerman PV, Variability in the rate of prescription and cost of Domiciliary Oxygen Therapy in Australia, submitted for publication.
Smith BJ, McElroy HJ, Ruffin RE, Frith PA, Heard AR, Battersby MW, Esterman AJ, Fante PD, McDonald PJ (2002) ‘The effectiveness of coordinated care for people with chronic respiratory disease’, Medical Journal of Australia, 177(1):481-485.
Soriano JB, Visick GT, Muellerova H, Payvandi N, Hansell AL (2005) ‘Patterns of comorbidities in newly diagnosed COPD and asthma in primary care. Chest 128(4):2099-107.
Stouthard MEA, Essink-Bot ML, Bonsel GJ, Barendregt JJ, Kramer PGN, van de Water HPA, Gunning-Schepers LJ, van der Maas PJ (1997) Disability weights for diseases in the Netherlands, Department of Public Health, Rotterdam.
Strom K, Boe J (1988) A national register for long-term oxygen therapy in chronic hypoxia: preliminary results, European Respiratory Journal,(1):952-8.
Strom K, Boe J, Boman G, Midgren B, Ropsenhall L (1993) Long-term domiciliary oxygen therapy. Experiences acquired from the Swedish oxygen register, Monaldi Arch Chest Dis, 48:473-8.
Tinkelman DG, Price DB, Nordyke RJ, Halbert R (2006) ‘Misdiagnosis of COPD and asthma in primary care patients 40 years of age and over’ J Asthma 43:75-80.

Economic impact of COPD
70
Tseng Y, Wilkins R (2002) 'Reliance on Income Support in Australia: Prevalence and Persistence' Melbourne Institute Working Paper, No 06/2002.
Viscusi WK (1993) ‘The Value of Risks to Life and Health’ Journal of Economic Literature 31:1912-1946.
Viscusi WK, Aldy JE (2002) ‘The value of a statistical life: a critical review of market estimates throughout the world’ Discussion Paper No 392, Harvard Law School, Cambridge MA. November www.law.harvard.edu/programs /olin_center/.
Voelkel NF (2000) ‘Raising awareness of COPD in primary care’ Chest 117: 372-375.
Wang PS, Beck A, Berglund P, Leutzinger JA, Pronk N, Richling D, Schenk TW, Simon G, Stang P, Ustun BT, Kessler RC (2003) ‘Chronic Medical Conditions and Work Performance in the Health and Work Performance Questionnaire Calibration Surveys’, Journal of Occupational and Environmental Medicine, 45(12).
White P (2004) ‘Spirometry and peak expiratory flow in the primary care management of COPD’, Primary Care Respiratory Journal 13: 5-8.
Wilson DK, Kaplan RM, Timms RM, Dawson A (1985) Acute effects of oxygen treatment upon information processing in hypoxemic COPD patients. Chest; 88: 239–43.
World Health Organization (2002) World Health Report 2002: Reducing Risks, Promoting Healthy Life, WHO, Switzerland.
World Health Organization (2008) COPD information, viewed at http://www.who.int/mediacentre/factsheets/fs315/en/index.html, on 28/07/2008.