economic impact of jobs created/retainedcantonsbdc2.homestead.com/implan_stark_co_2009.pdfeconomic...
TRANSCRIPT
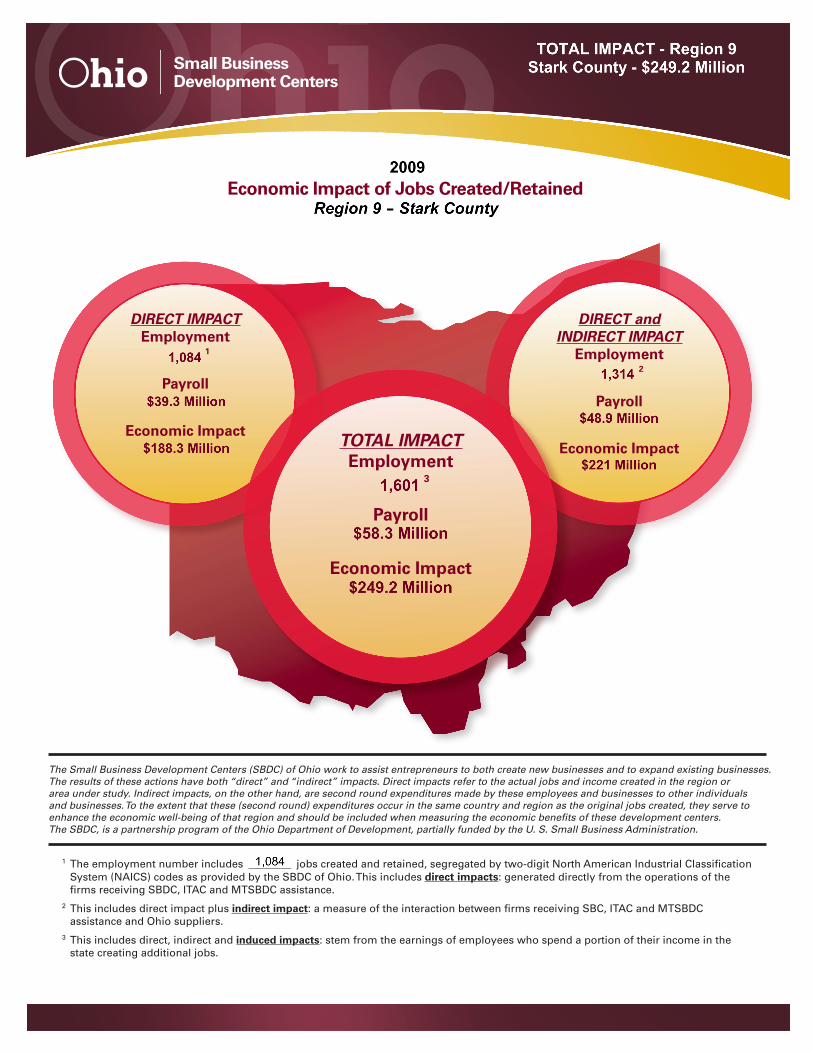
Economic Impact of Jobs Created/Retained
The employment number includes ________ jobs created and retained, segregated by two-digit North American Industrial Classification 1
System (NAICS) codes as provided by the SBDC of Ohio. This includes direct impacts: generated directly from the operations of the firms receiving SBDC, ITAC and MTSBDC assistance.
This includes direct impact plus 2 indirect impact: a measure of the interaction between firms receiving SBC, ITAC and MTSBDC assistance and Ohio suppliers.
This includes direct, indirect and 3 induced impacts: stem from the earnings of employees who spend a portion of their income in the state creating additional jobs.
The Small Business Development Centers (SBDC) of Ohio work to assist entrepreneurs to both create new businesses and to expand existing businesses. The results of these actions have both “direct” and “indirect” impacts. Direct impacts refer to the actual jobs and income created in the region or area under study. Indirect impacts, on the other hand, are second round expenditures made by these employees and businesses to other individuals and businesses. To the extent that these (second round) expenditures occur in the same country and region as the original jobs created, they serve to enhance the economic well-being of that region and should be included when measuring the economic benefits of these development centers. The SBDC, is a partnership program of the Ohio Department of Development, partially funded by the U. S. Small Business Administration.
DIRECT and INDIRECT IMPACT
Employment 2
Payroll
Economic Impact
DIRECT IMPACT Employment
1
Payroll
Economic Impact TOTAL IMPACT
Employment 3
Payroll
Economic Impact
Formula SheetSBDC Employment (Direct Impact) = SBDC Jobs Created + SBDC Jobs RetainedAverage Compensation (for Payroll calculations) = Employment Compensation ÷ Total Employment within the Region or State (Provided by MIG, Inc.)*(Employee Compensation = Employee Compensation + Proprietor Income) Employment Direct Impact = provided by SBDC (Reported in Column 1, Row 1)Employment Direct and Indirect Impact = Network Employment Type 1 Employment Multiplier (Reported in Column 2, Row 1)Employment Total Impact = SBDC Employment x Type SAM Employment Multiplier (Reported in Column 3, Row 1)Payroll Direct Impact = Average Compensation x Network Employment (Reported in Column 1, Row 2)Payroll Direct and Indirect = Payroll Direct Impact x Type 1 Labor Income Multiplier (Reported in Column 2, Row 2)Payroll Total Impact = Payroll Direct Impact x Type SAM Labor Income Multiplier (Reported in Column 3, Row 2)Economic Impact Direct (Output Direct Effect) = Network Employment x Output per Employee (Obtained from MIG, Inc.) (Reported in Column 1, Row 3)Economic Impact Direct and Indirect = Economic Impact Direct x Type 1 Output Multiplier (Reported in Column 2, Row 3)Economic Impact Total = Economic Impact Direct x Type SAM Output Multiplier (Reported in Column 3, Row 3)
Phone: (614) 466-2711 www.entrepreneurohio.org
The Ohio Small Business Development Center Program is funded through a cooperative agreement with the U.S. Small Business Administration and the Ohio Department of Development. For more information, call 1-800-848-1300, ext. 6-2711 or visit www.entrepreneurohio.org All opinions, conclusions or recommendations expressed are those of the author(s) and do not necessarily reflect the views of the SBA. Reasonable accommodations for persons with disabilities will be made if requested at least two weeks in advance. For arrangements, call the Ohio SBDC at (614)-466-2711 or (800) 848-1300, ext. 6-2711.
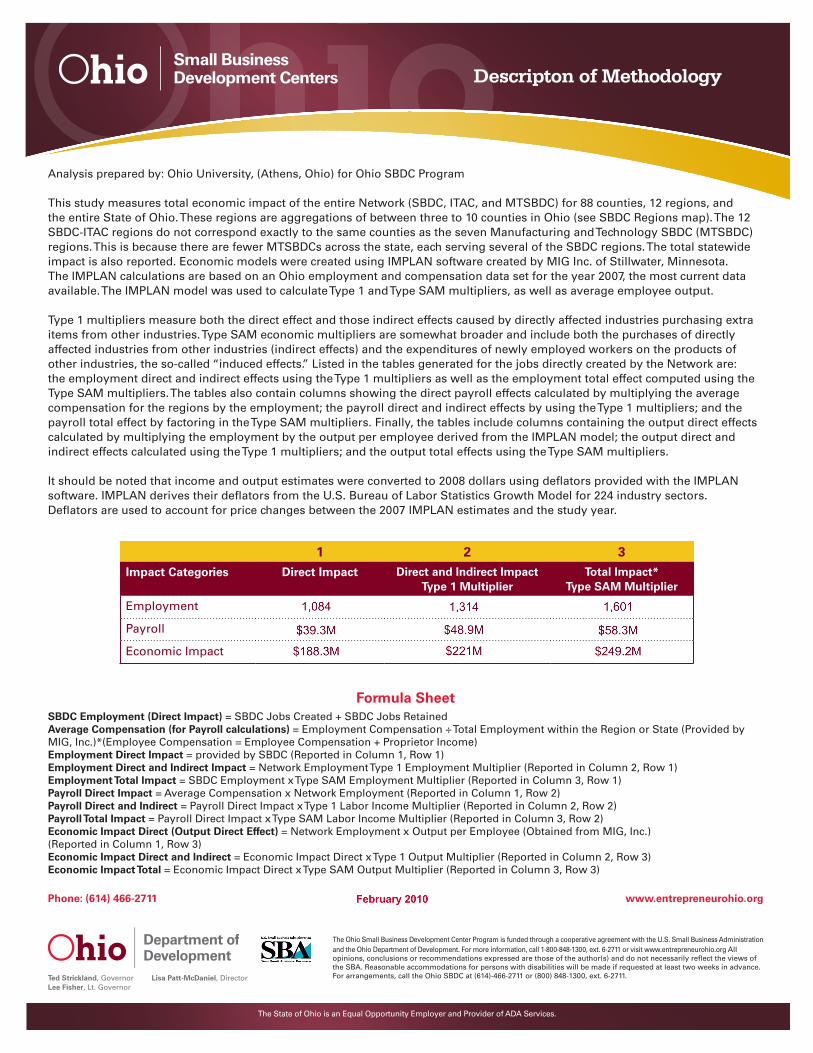
Descripton of Methodology
Analysis prepared by: Ohio University, (Athens, Ohio) for Ohio SBDC Program
This study measures total economic impact of the entire Network (SBDC, ITAC, and MTSBDC) for 88 counties, 12 regions, and the entire State of Ohio. These regions are aggregations of between three to 10 counties in Ohio (see SBDC Regions map). The 12 SBDC-ITAC regions do not correspond exactly to the same counties as the seven Manufacturing and Technology SBDC (MTSBDC) regions. This is because there are fewer MTSBDCs across the state, each serving several of the SBDC regions. The total statewide impact is also reported. Economic models were created using IMPLAN software created by MIG Inc. of Stillwater, Minnesota. The IMPLAN calculations are based on an Ohio employment and compensation data set for the year 2007, the most current data available. The IMPLAN model was used to calculate Type 1 and Type SAM multipliers, as well as average employee output.
Type 1 multipliers measure both the direct effect and those indirect effects caused by directly affected industries purchasing extra items from other industries. Type SAM economic multipliers are somewhat broader and include both the purchases of directly affected industries from other industries (indirect effects) and the expenditures of newly employed workers on the products of other industries, the so-called “induced effects.” Listed in the tables generated for the jobs directly created by the Network are: the employment direct and indirect effects using the Type 1 multipliers as well as the employment total effect computed using the Type SAM multipliers. The tables also contain columns showing the direct payroll effects calculated by multiplying the average compensation for the regions by the employment; the payroll direct and indirect effects by using the Type 1 multipliers; and the payroll total effect by factoring in the Type SAM multipliers. Finally, the tables include columns containing the output direct effects calculated by multiplying the employment by the output per employee derived from the IMPLAN model; the output direct and indirect effects calculated using the Type 1 multipliers; and the output total effects using the Type SAM multipliers.
It should be noted that income and output estimates were converted to 2008 dollars using deflators provided with the IMPLAN software. IMPLAN derives their deflators from the U.S. Bureau of Labor Statistics Growth Model for 224 industry sectors. Deflators are used to account for price changes between the 2007 IMPLAN estimates and the study year.
The State of Ohio is an Equal Opportunity Employer and Provider of ADA Services.
Ted Strickland, Governor Lisa Patt-McDaniel, DirectorLee Fisher, Lt. Governor
1 2 3Impact Categories Direct Impact Direct and Indirect Impact
Type 1 MultiplierTotal Impact*
Type SAM Multiplier
Employment
Payroll
Economic Impact