economic impacts of the safety net provisions in the 2012
TRANSCRIPT

9 14
2011 2012 2013 2014 20159
0
50
100
150
200
250
300
350
Working Paper 12-2
July 2012
Department of Agricultural EconomicsTexas AgriLife ResearchTexas AgriLife Extension ServiceTexas A&M University
College Station, Texas 77843-2124Telephone: (979) 845-5913
Fax: (979) 845-3140http://www.afpc.tamu.edu
RESEARCH&
AFPCAgricultural and Food Policy Center
Economic Impacts of the Safety Net Provisions
in the 2012 Senate and House Farm Bills on
AFPC’s Representative Crop Farms

Economic Impacts of the Safety Net Provisions in the 2012 Senate and House Farm Bills on
AFPC’s Representative Crop Farms
AFPC Working Paper 12-2
Joe L. Outlaw James W. Richardson
George M. Knapek J. Marc Raulston Brian K. Herbst
Agricultural and Food Policy Center Department of Agricultural Economics
Texas AgriLife Research Texas AgriLife Extension Service
Texas A&M University
July 2012
College Station, Texas 77843-2124 Telephone: (979) 845-5913
Fax: (979) 845-3140 Web Site: http://www.afpc.tamu.edu/

Economic Impacts of the Safety Net Provisions in the 2012 Senate and House
Farm Bills on AFPC’s Representative Crop Farms
Executive Summary
The safety net provisions in the Senate (S. 3240) and the Federal Agriculture Reform
and Risk Management (FARRM) Act of 2012 released by the House July 5, 2012 are
analyzed with respect to their economic impacts on 64 representative crop farms
maintained by the Agricultural and Food Policy Center (AFPC) at Texas A&M
University. The Congressional Budget Office has estimated that reforms to Titles 1
and 11 in both the House and Senate farm bills will result in net deficit reduction
between $14 billion and $15 billion over the next 10 years.1 This analysis
incorporates both historical price and production risk for the farms to evaluate and
compare the “safety net” aspects of these bills. Macroeconomic and commodity data
projections are from the January 2012 Food and Agricultural Policy Research
Institute (FAPRI) baseline. The farm’s preference for one policy alternative over
another was based on the alternative with the highest average net cash farm income
(NCFI) over the life of the farm bill.
This report considered the combined support of Title I programs (ARC, PLC, and
RLC) with the SCO and STAX choices in Title XI. In addition, both AGI and individual
payment limits were taken into consideration.
Under current Baseline price projections, more of the representative farms would
prefer the county-based ARC program over the individual-based ARC program in the
Senate. A large number of the representative farms would prefer to opt out of the
ARC program in favor of an SCO option with a wider payment band. The
representative farms would prefer the House PLC option over the RLC option
primarily due to the RLC not having the SCO option. Under baseline prices, all of the
representative farms would prefer the House PLC option over any Senate option.
The results were very similar for the declining price scenario except that more
farms would choose individual-based ARC over county-based ARC. There was a
dramatic reduction in the number of farms opting out of ARC for SCO because SCO
benefits are projected to decline substantially when prices fall over time. The 1 Senate: http://www.cbo.gov/sites/default/files/cbofiles/attachments/s3240Passed.pdf. House: http://www.cbo.gov/sites/default/files/cbofiles/attachments/LettertoLucasDraftLegis.pdf.

substantial increase in PLC benefits offset the decline in SCO benefits and results in
all farms preferring the House PLC option over any Senate option under the
declining price scenario.
The following conclusions can be drawn from the analysis:
All of the Title I options provide some safety net support under current price
forecasts. The House SCO alternative that has a wider payment band than the
Senate SCO option (for producers in Senate ARC) provides significant
support under current price forecasts much like the shallow loss plans.
The Senate Individual and County based ARC options and the House RLC
option are very similar except for two big considerations:
o Reference prices are included in the House which provide downside
protection when prices decline.
o The lower payment limit in the Senate reduces the effectiveness of
these Senate options when prices decline.
All of these revenue plans suffer from the inability to maintain net cash farm
income during declining prices. Only the House PLC option provides support
at meaningful levels when prices decline.
SCO provides significantly less safety net support when prices are declining
due to the reliance on current futures market prices in setting the
benchmark.
STAX with a reference price provides significantly more protection than
without.
Senate payment and AGI limits would be binding regularly enough to make
the Senate options provide substantially less safety net benefits to one-fourth
of the representative farms.

Economic Impacts of the Safety Net Provisions in the 2012 Senate and House
Farm Bills on AFPC’s Representative Crop Farms
Introduction
This report analyzes the economic impacts of the safety net provisions in the
Agriculture Reform, Food and Jobs Act of 2012 (S. 3240) as passed by the Senate
Committee on Agriculture, Nutrition and Forestry and the Federal Agriculture
Reform and Risk Management (FARRM) Act of 2012 as released by the House
Committee on Agriculture on Thursday, July 5, 2012, on the Agricultural and Food
Policy Center’s (AFPC’s) 64 representative crop farms. Amendments to the
Committee passed Senate bill were not included. This analysis includes the
commodity program provisions contained in Title I of each package as well as the
Stacked Income Protection Plan for producers of upland cotton (STAX) and the
Supplemental Coverage Option (SCO) provisions contained in Title XI.
Description of Senate and House Farm Bill Provisions
Both the Senate and House farm bill packages cover the 2013 to 2017 time period
and are similar in a number of respects. However, there are a few significant
differences worth noting. Table 1 contains selected provisions of the Senate and
House farm bill packages.
The primary safety net provisions in the Senate bill are a shallow loss revenue
protection plan called Agriculture Risk Coverage (ARC), an area-wide supplemental
crop insurance option referred to as the Supplemental Coverage Option (SCO), and
the Stacked Income Protection Plan for producers of upland cotton (STAX).
The Senate ARC alternative allows producers to choose between coverage at the
county level or individual producer level. This is described as a one-time
irrevocable decision with the county option paying on more acres than the
individual level coverage option. Both county and individual coverage ARC options
are eligible for SCO coverage (from 79% down to their individual insurance
coverage level). In addition, the Senate farm bill package allows producers to opt
out of ARC completely. If they choose this option, producers would only have SCO
coverage but with a wider SCO coverage band (from 90% percent down to their
individual insurance coverage level).
The House Title I provisions offer producers a choice of price or revenue-based risk
protection on a crop-by-crop and farm-by-farm basis. With this election, producers
have a one-time irrevocable choice of a revenue protection plan called revenue loss
1

coverage (RLC) or a price loss coverage (PLC) option similar to the counter-cyclical
payment (CCP) program in the 2002 and 2008 Farm Bills (Table 2). RLC is similar
to the county ARC option in the Senate farm bill with the most notable differences
being ARC only has reference prices for rice and peanuts where RLC has reference
prices for all program crops, and RLC lowers the trigger point by 4%, requiring
producers to incur a 15% loss before receiving assistance.
The most important difference between PLC and the current CCP program is that
the PLC option pays on planted acres with a whole farm base limitation rather than
being paid on base acres. Producers choosing PLC have an option to update their
payment yields to 90% of the average yield per planted acre for the 2008-2012 crop
years.
The Title XI provisions in the House bill are similar to the Senate in that SCO and
STAX are offered but at significantly different coverage levels for SCO and with a
reference price in STAX in the House bill (Table 3). Also, producers choosing the
House RLC option would not be eligible for SCO coverage. Both the Senate and
House allow cotton producers the choice between STAX and SCO coverage.
Another significant difference between the two bills is the payment limitation
provisions. The Senate bill has a $50,000 payment limitation on ARC benefits while
the House farm bill package has a $125,000 limitation on combined PLC and RLC
payments. Both the Senate and House combine non-farm and farm sources of
adjusted gross income (AGI) to form one overall AGI limitation with the Senate at
$750,000 and the House at $950,000.
2

Table 1. Selected Shallow Loss Safety Net Provisions of the Senate and House
Farm Bills.
Provisions Senate Agriculture Risk Coverage (ARC) Provisions
House Revenue Loss Coverage (RLC) Provisions
Revenue guarantee Starts at 89% of previous 5-year moving Olympic average revenue for the crop
Starts at 85% of previous 5-year moving Olympic average revenue for the crop
County Level or Individual Level Coverage
One time irrevocable producer selection of either county level or individual level
One time irrevocable producer selection of county-level RLC over PLC
Payment acres 65% of planted acres not to exceed the average total acres planted or prevented from being planted to covered commodities and upland cotton on the farm for the 2009 – 2012 crop years if individual level coverage is selected or 80% for county level coverage
85% of planted acres and 30% of prevented planted acres not to exceed base acres on the farm (upland cotton base acres are included in total farm base acres) (payment factor of 85% is applied to planted acres before checking whole farm base cap)
Payment band or range 10% (89% to 79%) 10% (85% to 75%)
Actual revenue Calculated using the average price during the first 5 months of the marketing year and actual yields
Calculated using the average price during the first 5 months of the marketing year and actual yields
Mandatory or Optional Producer has the option to opt out of ARC and select SCO with a wider coverage level
Producer has the option to select RLC or price loss coverage (PLC) with SCO
Transitional Yields Used to Replace Low Yields in Calculating Revenue Guarantee
Can replace low yields with 60% of transitional yields in 2012 or prior years and 70% in 2013 or any subsequent years
Can replace any low yield in revenue calculations with 70% of the transitional yield
3

Table 1. Continued.
Provisions Senate Agriculture Risk Coverage (ARC) Provisions
House Revenue Loss Coverage (RLC) Provisions
Reference Prices Used to Replace Low Prices in Calculating Revenue Guarantee
Only applicable for rice and peanuts Long Grain Rice - $13.00/cwt Medium Grain Rice - $13.00/cwt Peanuts - $530/ton
Wheat - $5.50/bu Corn - $3.70/bu Grain Sorghum - $3.95/bu Barley - $4.95/bu Oats - $2.40/bu Long Grain Rice - $14.00/cwt Medium Grain Rice - $14.00/cwt Soybeans - $8.40/cwt Other Oilseeds - $20.15/cwt Peanuts - $535/ton Dry Peas - $11.00/cwt Lentils - $19.97/cwt Small Chickpeas - $19.04/cwt Large Chickpeas - $21.54/cwt
Payment Limit $50,000, peanuts with a separate limit
$125,000, peanuts with a separate limit
AGI Limitation $750,000 $950,000
4

Table 2. Selected Price Loss Coverage (PLC) Safety Net Provisions of the House Farm Bill.
Provisions House Price Loss Coverage (PLC) Program
Payment Acres 85% of planted acres and 30% of prevented planted acres not to exceed base acres on the farm (upland cotton base acres are included in total farm base acres) (payment factor of 85% is applied to planted acres before checking whole farm base cap)
Reference Prices Wheat - $5.50/bu Corn - $3.70/bu Grain Sorghum - $3.95/bu Barley - $4.95/bu Oats - $2.40/bu Long Grain Rice - $14.00/cwt Medium Grain Rice - $14.00/cwt Soybeans - $8.40/bu Other Oilseeds - $20.15/cwt Peanuts - $535/ton Dry Peas - $11.00/cwt Lentils - $19.97/cwt Small Chickpeas - $19.04/cwt Large Chickpeas - $21.54/cwt
Price Trigger If the average price during the first 5 months of the marketing year falls below the reference price for the commodity
Payment Yields CCP yields from the 2008 Farm Bill. Producer option to update payment yields to 90% of the average yield per planted acre for the crop from 2008 to 2012, excluding any crop year in which the acreage planted was zero. May substitute a plug of 75% of the county average yield.
Payment Limit $125,000, peanuts with a separate limit AGI Limitation $950,000
5
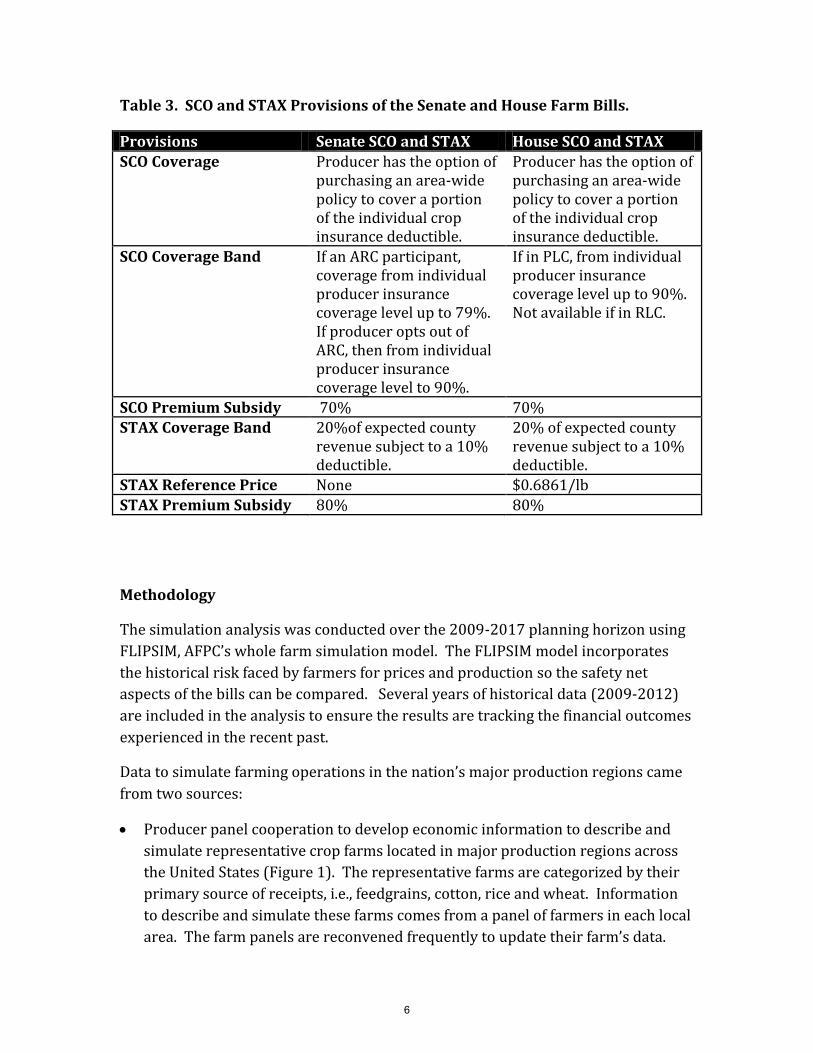
Table 3. SCO and STAX Provisions of the Senate and House Farm Bills.
Provisions Senate SCO and STAX House SCO and STAX
SCO Coverage Producer has the option of purchasing an area-wide policy to cover a portion of the individual crop insurance deductible.
Producer has the option of purchasing an area-wide policy to cover a portion of the individual crop insurance deductible.
SCO Coverage Band If an ARC participant, coverage from individual producer insurance coverage level up to 79%. If producer opts out of ARC, then from individual producer insurance coverage level to 90%.
If in PLC, from individual producer insurance coverage level up to 90%. Not available if in RLC.
SCO Premium Subsidy 70% 70% STAX Coverage Band 20%of expected county
revenue subject to a 10% deductible.
20% of expected county revenue subject to a 10% deductible.
STAX Reference Price None $0.6861/lb
STAX Premium Subsidy 80% 80%
Methodology
The simulation analysis was conducted over the 2009-2017 planning horizon using
FLIPSIM, AFPC’s whole farm simulation model. The FLIPSIM model incorporates
the historical risk faced by farmers for prices and production so the safety net
aspects of the bills can be compared. Several years of historical data (2009-2012)
are included in the analysis to ensure the results are tracking the financial outcomes
experienced in the recent past.
Data to simulate farming operations in the nation’s major production regions came
from two sources:
Producer panel cooperation to develop economic information to describe and
simulate representative crop farms located in major production regions across
the United States (Figure 1). The representative farms are categorized by their
primary source of receipts, i.e., feedgrains, cotton, rice and wheat. Information
to describe and simulate these farms comes from a panel of farmers in each local
area. The farm panels are reconvened frequently to update their farm’s data.
6

The representative farm database has been used for policy analysis for nearly 30
years. Tables summarizing the physical and financial characteristics of each
farm are included in Appendix A. The current crop mix, receipts, acreage, and
assets for the farms are presented in the tables. Appendix B provides the names
of producers, land grant faculty, and industry leaders who cooperated in the
panel interview process to develop the representative farms. Additional
information about the representative farms can be found in Richardson, et al,
2012.
Projected prices, policy variables, and input inflation rates from the Food and
Agricultural Policy Research Institute (FAPRI) January 2012 Baseline (Tables 4
and 5). For most farm policy analyses, FAPRI will develop new sector level
estimates when the policy change is substantial enough to cause concern that
relative prices among commodities may change. FAPRI conducted preliminary
analyses for House Agriculture Committee staff and found relatively small price
impacts would occur when considering the changes in this report in their sector
models. Therefore, we did not utilize different sector results for each policy
change.
Risk on both prices and yields are included in the analysis to add the variability
or risk that farmers are likely to encounter in the future. Given the January 2012
Baseline price levels and historical price risk, the PLC does not trigger very often.
7

Figure 1. Location and Size of AFPC Representative Farms and Classification.
Key Assumptions
All farms classified as moderate scale are the size (acres) considered to be
representative of a majority of full-time commercial farming operations in the
study area. In many regions, a second farm two to three times larger than the
moderate scale farm is developed as an indicator of size economies.
Historical crop yields and prices (2009-2011) were based on actual values
obtained from the producers. Crop yields for 2012-2017 were simulated
stochastically based on the average yields provided by the producers and the
historical yield variability for the farm. FAPRI’s January 2012 Baseline prices
were localized for the farms and used as the average prices for 2012-2017 to
simulate stochastic crop prices.
The representative crop farms were simulated with the 2008 Farm Bill
provisions in place for 2009-2012. From 2013 to 2017, each of the 64 farms was
analyzed assuming the provisions of the Senate or House packages. The 2008
Farm Bill payment limit provisions were in place for 2009-2012. Starting in
2013, all farms are subject to the applicable payment limits from the Senate and
House farm bills.
8

Table 4. FAPRI January 2012 Baseline Projections of Crop Prices, 2013-2017.
2013 2014 2015 2016 2017
Corn ($/bu.) 4.71 4.77 4.86 4.84 4.8
Wheat ($/bu.) 5.6 5.8 6.03 6.15 6.15
Cotton ($/lb.) 0.7788 0.7969 0.8123 0.8234 0.8242
Sorghum ($/bu) 4.54 4.6 4.71 4.71 4.69
Soybeans ($/bu.) 11.25 11.18 11.28 11.42 11.43
Barley ($/bu.) 4.88 4.93 5.02 5.01 5
Oats ($/bu.) 2.95 2.94 2.97 2.97 2.97
Rice ($/cwt.) 12.74 13.08 13.44 13.75 13.79
Soybean Meal ($/ton) 262.37 269.16 278.66 284.35 286.27
All Hay ($/ton) 137.85 135.88 139.49 143.45 146.25
Peanuts ($/ton) 520.99 515.48 520.25 520.04 515.72
Source: Food and Agricultural Policy Research Institute (FAPRI) at the University of Missouri - Columbia.
Table 5. FAPRI January 2012 Baseline Assumed Rates of Change in Input Prices and
Annual Change in Land Values 2013-2017.
2013 2014 2015 2016 2017
Annual Rate of Change for Input Prices Paid
Seed Prices (%) 4.07 0.6 0.37 1.19 0.92
Fertilizer Prices (%) 3.84 1.53 1.91 1.45 0.9
Herbicides Prices (%) 4.39 3.4 1.89 1.36 0.68
Insecticide Prices (%) 3.9 3.18 1.9 1.39 0.77
Fuel and Lube Prices (%) 4.4 0.23 0.04 -0.32 -2.74
Machinery Prices (%) 3.04 2.81 2.44 2.41 2.3
Wages (%) 2.24 2.69 2.9 3.1 3.17
Supplies (%) 3.29 2.68 1.72 1.29 0.8
Repairs (%) 2.39 2.67 2.47 2.37 2.25
Services (%) 3.33 3.05 2.25 2.1 1.8
Taxes (%) 5.47 5.21 3.27 3.17 3.05
PPI Items (%) 0.38 1.29 1.08 1.12 0.74
PPI Total (%) 0.88 1.8 1.67 1.46 1.03
Annual Change in Consumer Price Index (%) 1.83 2.01 2.01 1.9 1.78
Annual Rate of Change for U.S. Land Prices (%) 3.09 2.01 1.9 0.53 0.51
Source: Food and Agricultural Policy Research Institute (FAPRI) at the University of Missouri - Columbia.
9

No off-farm income, including family employment, was included in the analyses.
Therefore, the farm reflects only the ability of the farm to provide for family
living and capital replacement.
Each farm was assumed to start the analysis with 20% debt.
All crop farms are assumed to carry crop insurance with products and coverage
levels common to their area.
All farms were assumed to be eligible for 2 individual payment limits.
Scenarios Analyzed
Both the Senate and House Farm Bill packages discussed previously were analyzed
using the representative farms. Detailed results for each of the 64 crop farms are
contained in Appendix C for the following scenarios:
Senate Farm Bill assuming individual level coverage selected in the ARC program
along with SCO analyzed with FAPRI baseline prices;
Senate Farm Bill assuming county level coverage selected in the ARC program
along with SCO analyzed with FAPRI baseline prices;
House Farm Bill assuming revenue loss coverage (RLC) selected and analyzed
with FAPRI baseline prices;
House Farm Bill assuming price loss coverage (PLC) along with SCO and
analyzed with FAPRI baseline prices.
The House Farm Bill PLC scenario also included updated payment yields if
applicable. The partial yield update allows producers to update their current CCP
yield to 90% of the average yield per planted acre from 2008 to 2012. The historical
yields for each of the representative farms were analyzed to determine whether it
would be beneficial to do the partial yield update.
Table 6 provides information regarding the degree to which farms around the
country would choose to update yields. There were 162 eligible crops on the 64
representative farms that were considered for updating. More than one-half of the
eligible crops would have either updated (73) or developed new program yields for
crops that didn’t previously have one (22).
10

Table 6. Summary of Crop Yield Update Analysis.
Category Number of Individual Crop Yields
Total Number of Yields for Crops That Could Have Been Updated
162
Number of Yields for Crops That Choose Not to Update
67
Number of Crops that Did Not Have a Program Yield that Developed One
22
Number of Yields for Crops That Choose to Update
73
The average yield before and after the update for selected commodities is contained
in Table 7. Note this analysis does not include cotton because neither STAX nor SCO
trigger off of individual farm yields.
Table 7. Summary of Old Crop Yields and Updated Yields.
Crop Old Yield Updated Yield Change % Change
Barley 55 bu. 60 bu. 5 bu. 9.0 Corn 97 bu. 122 bu. 25 bu. 25.7
Grain Sorghum 67 bu. 72 bu. 5 bu. 7.6
Rice 58 cwt. 63 cwt. 5 cwt. 8.6 Soybeans 34 bu. 40 bu. 6 bu. 17.6
Wheat 41 bu. 43 bu. 2 bu. 4.8
Each of these scenarios was also analyzed assuming a declining price scenario
illustrated in Figure 2. Commodity prices were reduced by the same percentage
each year beginning in 2012. The declining price scenario was constructed to
analyze whether the safety net protection provided by a proposed policy tool would
be different between analyses with relatively high prices that are currently
projected to occur over the farm bill period with prices that decline throughout the
period.
11

Figure 2. Comparison of FAPRI Baseline Prices and Prices Used in the
Declining Price Scenario.
$0.00
$1.00
$2.00
$3.00
$4.00
$5.00
$6.00
$7.00
2009 2010 2011 2012 2013 2014 2015 2016 2017
Corn
FAPRI Baseline Declining Price Scenario
$0.00
$2.00
$4.00
$6.00
$8.00
$10.00
$12.00
$14.00
2009 2010 2011 2012 2013 2014 2015 2016 2017
Soybeans
FAPRI Baseline Declining Price Scenario
$0.00
$0.20
$0.40
$0.60
$0.80
$1.00
2009 2010 2011 2012 2013 2014 2015 2016 2017
Cotton
FAPRI Baseline Declining Price Scenario
$0.00
$2.00
$4.00
$6.00
$8.00
$10.00
$12.00
$14.00
$16.00
2009 2010 2011 2012 2013 2014 2015 2016 2017
Rice
FAPRI Baseline Declining Price Scenario
$0.00
$1.00
$2.00
$3.00
$4.00
$5.00
$6.00
$7.00
$8.00
2009 2010 2011 2012 2013 2014 2015 2016 2017
Wheat
FAPRI Baseline Declining Price Scenario
$0.00
$1.00
$2.00
$3.00
$4.00
$5.00
$6.00
$7.00
2009 2010 2011 2012 2013 2014 2015 2016 2017
Grain Sorghum
FAPRI Baseline Declining Price Scenario
12

Definitions of Variables in Appendix C Individual Farm Summary Tables
Loan Deficiency Payments -- 2013-2017 average annual marketing loan
gains/LDP payments.
ARC or PLC or RLC Payments -- 2013-2017 average annual Agriculture Risk
Coverage, Price Loss Coverage, and Revenue Loss Coverage payments.
Government Payments -- 2013-2017 average annual ARC, PLC, RLC, and
marketing loan gains/LDPs for the alternatives.
STAX Net Payments -- 2013-2017 average annual Stacked Income Protection
Plan net payments for upland cotton equal STAX insurance indemnities minus
STAX premiums.
SCO Net Payments -- 2013-2017 average annual Supplemental Coverage Option
(SCO) net payments equal SCO insurance indemnities minus SCO premiums.
Net Cash Farm Income (NCFI) -- 2013-2017 average net cash farm income
equals average total receipts minus average total cash expenses.
Real Net Worth 2017 -- total assets including land minus total debt from all
sources adjusted for inflation is reported at the end of 2017.
AGI 3 Year Moving Average -- 2013-2017 annual average of a three year
moving average of Adjusted Gross Income (AGI).
Probability of Exceeding AGI Limit -- The probability that the farm’s AGI
exceeds the AGI limit for receiving government payment over the 2013-2017
period.
13

Results Assuming FAPRI Baseline Prices
The individual farm results from Appendix C are summarized for all 64
representative farms and by commodity grouping (feedgrain/oilseed, wheat, cotton,
and rice). The summary tables were developed assuming the operators would
choose the alternative with the higher average net cash farm income (NCFI) over the
life of the farm bill as opposed to a lower net cash farm income (note that NCFI
would generally be higher under current law). Summary tables were developed to
consider the specific choices producers could make in both the Senate and House
Farm bills. Finally, a comparison is made regarding the most preferred Senate
option and the most preferred House option. In preliminary analyses, 25 out of 27
representative farms with cotton chose STAX over SCO. Therefore, the assumption
was made throughout this report that cotton on each farm would be in STAX.
Senate Farm Bill
Tables 8 – 11 contain summary results of the Senate Farm Bill package. The Senate
Farm bill has two different choices that were analyzed. First, producers can choose
between individual-level versus county-level ARC coverage. Table 8 indicates that
of the 62 representative farms, 22 would prefer individual-level ARC coverage and
40 would prefer county-level ARC coverage, (two farms [TXSP2500 and ARNC5000]
are 100% cotton so they are in STAX only for the entire farm). The cotton farms
that would choose individual versus county coverage (8 to 6) would be choosing
individual level coverage on all of their crops other than cotton. The 62
representative farms that had a preference for ARC based on individual versus
county yields are presented in Figure 3. In general farms in the West and along the
Mississippi river appear to favor county-based ARC over using their individual
yields. The numbers represent the average amount that the NCFI for the farm is
higher for the option the farm chose (the color) over the other option. On all maps,
the top number in a cluster of two represents the results for the moderate size farm
for the area and the bottom number is for a farm that is representative of large
farms in the area.
The differences in NCFI regardless of the choice between individual level coverage
and county level ARC coverage are relatively small. Table 9 illustrates that for the
22 farms that chose individual level ARC coverage the average difference in NCFI
compared to county level coverage is $2,100 per year. The county level choice
results in slightly larger differences across commodities, but the differences are still
relatively small.
14

Table 8. Number of Representative Farms That Would Prefer Individual versus County Level Coverage Based on NCFI in the Senate ARC Farm Bill Package Assuming Baseline Prices.
1 Two farms, the small Texas southern plains cotton farm TXSP2500 and the Arkansas cotton farm ARNC5000 are 100% cotton and would only be enrolled in STAX. Therefore, there would be no difference between the alternatives.
Table 9. Average Annual Increase in Net Cash Farm Income from 2013-2017 in $1,000s for a Representative Farm That Chose Individual or County Level Coverage in the Senate Package Assuming Baseline Prices.
Individual Coverage $1,000
County Coverage $1,000
Total by Preference 2.1 2.5 Feedgrain/Oilseed 2.8 2.5
Wheat 1.8 2.5
Cotton 1.7 2.0
Rice 1.9 2.9
The Senate Farm Bill package gives producers a second choice that allows producers
to “opt out” of ARC coverage in exchange for a larger payment band on SCO
coverage. This summary compared the highest NCFI among Senate ARC options
(individual or county) versus the SCO payment associated with the PLC option in the
House Farm Bill. The SCO option associated with the PLC House Farm Bill option
has the same payment band as the “opt out” option in the Senate Farm Bill. Table 10
indicates that 46 out of 62 farms would have a higher NCFI, on average, if they opted
out of the Senate ARC program in favor of the larger payment band on SCO coverage.
Individual Coverage County Coverage Total by Preference1 22 40
Feedgrain/Oilseed 7 16 Wheat 3 8
Cotton 8 6 Rice 4 10
15

Figure 3. Results Indicating the Representative Farm’s Preference for Individual or County Based ARC.
Table 11 provides an indication of the amount of difference the ARC SCO would
make. If a farm chose one of the ARC options, on average its NCFI would be $6,400
higher than the “opt out” NCFI. However, of the 46 farms that would choose to “opt
out” of ARC, their average NCFI would be $21,600 more than either of the ARC
options. Figure 4 provides a geographic representation of each farm’s choice along
with the average difference that the choice would make in the farm’s NCFI.
Table 10. Number of Representative Farms that Would Prefer the ARC Plan versus Opting Out of ARC for More SCO Coverage in the Senate Farm Bill Package Assuming Baseline Prices.
Senate ARC “Opt Out” of ARC for More SCO Coverage
Total by Preference1 16 46 Feedgrain/Oilseed 3 20
Wheat 2 9 Cotton 6 8
Rice 5 9 1 Two farms, the small Texas southern plains cotton farm TXSP2500 and the Arkansas cotton farm ARNC5000 are 100% cotton and would only be enrolled in STAX. Therefore, there would be no difference between the alternatives.
16

Table 11. Average Difference in Net Cash Farm Income for Representative Farms that Would Prefer the ARC Plan or Opting Out of ARC for More SCO Coverage in the Senate Farm Bill Package Assuming Baseline Prices ($1000s).
Figure 4. Results Indicating the Representative Farm’s Preference for Opting Out of ARC for a Larger SCO Payment Band or Remaining in ARC.
Senate ARC “Opt Out” of ARC for More SCO Coverage
Total by Preference 6.4 21.6
Feedgrain/Oilseed 3.0 32.3 Wheat 2.8 7.0
Cotton 12.4 13.1
Rice 2.5 19.7
17

House Farm Bill
Tables 12 and 13 contain summary results of the House Farm Bill package. The
House Farm bill allows producers to choose between revenue loss coverage (RLC)
and price loss coverage (PLC). Table 12 indicates that of the 62 representative
farms used in the analysis, all would choose PLC over RLC. Both RLC and PLC are
expected to average small positive payments over the life of the farm bill. However,
RLC is not eligible for SCO coverage. The SCO net benefit makes a significant
difference in a farm’s average NCFI over the life of the farm bill (see Appendix C for
individual farm results or Appendix D for a summary by farm type).
Table 12. Number of Representative Farms That Would Prefer the Revenue Loss Coverage (RLC) versus Price Loss Coverage (PLC) Programs Based on Net Cash Farm Income in the House Farm Bill Package Assuming Baseline Prices.
RLC PLC
Total by Preference1 0 62
Feedgrain/Oilseed 0 23 Wheat 0 11
Cotton 0 14 Rice 0 14 1 Two farms, the small Texas southern plains cotton farm TXSP2500 and the Arkansas cotton farm ARNC5000
are 100% cotton and would only be enrolled in STAX. Therefore, there would be no difference between the
alternatives.
Table 13 provides the average difference in NCFI for the PLC option versus RLC.
Across the 62 farms analyzed, the average difference in NCFI between the two
options was $81,400 per year with the difference for the rice farms being the largest
at just over $112,000 per year.
Table 13. Average Annual Increase in Net Cash Farm Income from 2013-2017 in $1,000s if a Representative Farm Had Chosen PLC Over RLC in the House Farm Bill Package Assuming Baseline Prices.
Average NCFI for PLC Minus NCFI for RLC
$1,000
Total by Preference 81.4 Feedgrain/Oilseed 75.5
Wheat 64.5 Cotton 73.3
Rice 112.6
18

Overall Preference – Senate versus House
The final set of tables compares the most preferred Senate Farm Bill option (e.g.,
individual level or county level ARC or “opt out” of ARC for larger payment band on
SCO coverage) with the most preferred House Farm Bill option – PLC (based on
100% of the farms preferring PLC to RLC in Table 12). As indicated in Table 14 and
Figure 5, all 64 farms (this number includes the two 100% cotton farms that prefer
the House version of STAX) would prefer the House PLC option over the most
preferred Senate option.
Table 15 shows that the difference in NCFI between the most preferred House
option (PLC) and the most preferred Senate option is $44,200 per year.
Table 14. The Number of Representative Farms That Would Choose the Best Option in the Senate Farm Bill Package or the Best Option from the House Farm Bill Package Based on Net Cash Farm Income Assuming Baseline Prices.
Table 15. The Average Difference in Net Cash Farm Income for the Best Option in the House Farm Bill Package Over the Best Option from the Senate Farm Bill Package Based Assuming Baseline Prices ($1,000s).
Best Senate Option Best House Option
All 64 Farms 0 64 Feedgrain/Oilseed 0 23
Wheat 0 11 Cotton 0 16
Rice 0 14
House Best Option Minus Senate Best
Option $1,000
All 64 Farms 44.2 Feedgrain/Oilseed 30.2
Wheat 39.5
Cotton 46.6 Rice 67.9
19

Figure 5. Results Indicating the Representative Farm’s Preference for the House Over the Senate Safety Net Package.
Declining Price Scenario
As in the FAPRI Baseline Price scenario, the individual farm results for the Declining
Price Scenario are contained in Appendix C. This scenario provides an indication of
whether the alternative Senate and House Farm Bill options provide an adequate
producer safety net when prices decline. And further, what part of the safety net
provides the most significant protection when prices decline. Again, the summary
tables were developed assuming the operators would choose the alternative with
the higher net cash farm income (NCFI) as opposed to a lower net cash farm income.
Summary tables were developed to consider the specific choices producers could
make in both the Senate and House Farm bills. Finally, a comparison is made
regarding the most preferred Senate option and the most preferred House option
under declining prices.
20

Senate Farm Bill
Tables 16 – 18 contain summary results of the Senate Farm Bill package. Table 16
indicates that of the 62 representative farms, 30 would prefer individual level ARC
coverage and 32 would prefer county level ARC coverage under the declining price
scenario. Eight additional farms would find it advantageous to have individual level
ARC coverage than under the Baseline prices (Table 16 compared to Table 8).
The relative differences in NCFI regardless of the choice between individual level
coverage and county level coverage are still relatively small. Table 17 illustrates
that for the 30 farms that chose individual level ARC coverage the average difference
in NCFI compared to county level coverage is $ 2,900 per year. These results, while
slightly larger than for the Baseline price scenario, are still relatively small.
Table 16. Number of Representative Farms That Would Prefer Individual versus County Level Coverage Based on NCFI in the Senate ARC Farm Bill Package Assuming Declining Price Scenario.
1 Two farms, the small Texas southern plains cotton farm TXSP2500 and the Arkansas cotton farm ARNC5000 are 100% cotton and would only be enrolled in STAX. Therefore, there would be no difference between the alternatives.
Table 17. Average Annual Increase in Net Cash Farm Income from 2013-2017 in $1,000s for a Representative Farm That Chose Individual or County Level Coverage in the Senate Package Assuming Declining Price Scenario.
Individual Coverage $1,000
County Coverage $1,000
Total by Preference 2.9 3.6
Feedgrain/Oilseed 2.1 3.3 Wheat 4.3 2.2
Cotton 3.0 1.4 Rice 2.7 5.1
Individual Coverage County Coverage
Total by Preference1 30 32 Feedgrain/Oilseed 11 12
Wheat 7 4
Cotton 10 4 Rice 2 12
21

Analysis of the second choice in the Senate Farm Bill that allows producers to “opt
out” of ARC coverage in exchange for a larger payment band on SCO coverage
yielded dramatically different results under the declining price scenario (Table 18)
compared to the Baseline scenario (Table 10). Again, this summary compared the
highest NCFI among Senate ARC options (individual or county) versus the SCO
payment associated with the PLC option in the House Farm Bill. The SCO option in
the PLC House Farm Bill option has the same payment band as the “opt out” option
in the Senate Farm Bill. As indicated in Table 18, the majority of the representative
farms (54) would not “opt out” of ARC under the declining price scenario. Under
Baseline prices, only 16 out of 62 farms would have chosen to stay in ARC. These
results would suggest that the 5 year moving Olympic average in the ARC plan does
provide more downside protection than the SCO insurance option as prices decline.
This makes sense as the benchmark revenue guarantee in the ARC plan declines
more slowly as prices decline due to dropping the high and low each year, however,
the annual futures prices used to calculate the guarantee and actual revenues in the
SCO option move down with the market. The downward movement in futures
prices creates a situation where the benchmark revenue guarantee (the amount that
is being protected) moves down with the declining prices.
Table 19 indicates that the amount of difference the choice would make is still
relatively small, but those farms that chose to stay in ARC would have a slightly
larger difference in NCFI than those that chose to “opt out.”
Table 18. Number of Representative Farms that Would Prefer the ARC Plan versus Opting Out of ARC for More SCO Coverage in the Senate Farm Bill Package Assuming Declining Price Scenario.
1 Two farms, the small Texas southern plains cotton farm TXSP2500 and the Arkansas cotton farm ARNC5000 are 100% cotton and would only be enrolled in STAX. Therefore, there would be no difference between the alternatives.
Senate ARC “Opt Out” of ARC for More SCO Coverage
Total by Preference1 54 8 Feedgrain/Oilseed 18 5
Wheat 10 1
Cotton 12 2
Rice 14 0
22

Table 19. Average Difference in Net Cash Farm Income for Representative Farms that Would Prefer the ARC Plan or Opting Out of ARC for More SCO Coverage in the Senate Farm Bill Package Assuming Declining Price Scenario ($1,000).
House Farm Bill
Tables 20 and 21 contain summary results of the House Farm Bill package under the
declining price scenario. The House Farm bill allows producers to choose between
revenue loss coverage (RLC) and price loss coverage (PLC). Table 20 indicates that
of the 62 representative farms used in the analysis, all would choose PLC over RLC.
Both RLC and PLC are expected to average small positive payments over the life of
the farm bill. However, RLC is not eligible for SCO coverage. Under the declining
price scenario, the SCO net benefit actually declines as prices decline, however, the
PLC payment increases and makes a significant difference in a farm’s average NCFI
over the life of the farm bill (see Appendix C).
Table 21 provides the average difference in NCFI for the PLC option versus RLC.
Across the 62 farms analyzed, the average difference in NCFI between the two
options was $117,500 per year -- which was substantially higher than under the
Baseline price scenario.
Senate ARC
$1,000
“Opt Out” of ARC for More SCO Coverage
$1,000 Total by Preference 23.6 11.3
Feedgrain/Oilseed 18.8 12.6
Wheat 9.9 0.6 Cotton 16.5 13.4
Rice 45.6 n/a
23

Table 20. Number of Representative Farms That Would Prefer the Revenue Loss Coverage (RLC) versus Price Loss Coverage (PLC) Programs Based on Net Cash Farm Income in the House Farm Bill Package Assuming Declining Price Scenario.
1 Two farms, the small Texas southern plains cotton farm TXSP2500 and the Arkansas cotton farm ARNC5000 are 100% cotton and would only be enrolled in STAX. Therefore, there would be no difference between the alternatives.
Table 21. Average Annual Increase in Net Cash Farm Income from 2013-2017 in $1,000s if a Representative Farm Had Chosen PLC Over RLC in the House Farm Bill Package Assuming Declining Price Scenario.
1 Two farms, the small Texas southern plains cotton farm TXSP2500 and the Arkansas cotton farm ARNC5000 are 100% cotton and would only be enrolled in STAX. Therefore, there would be no difference between the alternatives.
RLC PLC
Total by Preference1 0 62 Feedgrain/Oilseed 0 23
Wheat 0 11
Cotton 0 14
Rice 0 14
Average NCFI for PLC Minus RLC
$1,000 Total by Preference1 117.5
Feedgrain/Oilseed 112.2
Wheat 109.9 Cotton 93.9
Rice 155.8
24

Overall Preference – Senate versus House
This final set of tables compares the most preferred Senate Farm Bill option (e.g.,
individual level or county level ARC or “opt out” of ARC for larger payment band on
SCO coverage) with the most preferred House Farm Bill option that again is PLC
(based on 100% of the farms preferring PLC to RLC in Table 20), assuming declining
prices.
Under the Baseline prices, the most preferred Senate Farm Bill option was the “opt
out” option for 46 farms. Under the declining price scenario, the most preferred
Senate Farm Bill option across the representative farms was county level ARC
followed closely by the individual coverage level ARC.
As indicated in Table 22, all 64 farms would prefer the House PLC option over the
most preferred Senate option under the declining price scenario. This result
indicates that while the SCO net payment in the House Farm Bill PLC option declines
as prices decline, the PLC payment increases to offset the SCO declines.
The average difference in NCFI between the most preferred House option (PLC) and
the most preferred Senate option is $125,800 per year (Table 23). These differences
are larger under the declining price scenario relative to the Baseline price scenario.
Table 22. The Number of Representative Farms That Would Choose the Best Option in the Senate Farm Bill Package or the Best Option from the House Farm Bill Package Based on Net Cash Farm Income Assuming Declining Price Scenario.
Best Senate Option Best House Option All 64 Farms 0 64
Feedgrain/Oilseed 0 23 Wheat 0 11
Cotton 0 16 Rice 0 14
25

Table 23. The Average Difference in Net Cash Farm Income for the Best Option in the House Farm Bill Package Over the Best Option from the Senate Farm Bill Package Based Assuming Declining Price Scenario ($1,000s).
A Closer Look at the Numbers
Thus far, this analysis has identified which policy proposal would be the most
preferred farm bill safety net package (both Title I and Title XI programs) for each of
the representative farms based on the highest average net cash farm income (NCFI).
In some instances, the difference in NCFI across proposals was very small, while for
some farms the difference was much larger. The differences in NCFI between
policies can be observed for individual farms in Appendix C. While Appendix D
contains a summary table of the expected government payments for the Baseline
and declining price scenarios under the Senate and House Farm Bill proposals with
each of their choices.
Table 24 provides a summary of the degree to which each of the different policy proposals would fill in the gap for the large decline in crop receipts in the declining price scenario compared to the Baseline price scenario. Across all the farms, the average loss in crop receipts from the two market price assumptions is $527,200. Most of the farm types are around that loss level except for the wheat farms that would be expected to lose about one-half that amount. Over all the farms, the House RLC and both Senate options appear to provide about the same amount of government payments (15 to 16%) of what was lost due to the low prices. The House PLC plan would replace 43% of the lost income across all farm types with wheat providing a higher percentage but on a much smaller number than the other farm types.
House Best Option Minus Senate Best
Option $1,000
All 64 Farms 125.8 Feedgrain/Oilseed 115.9
Wheat 98.7 Cotton 115.1
Rice 175.5
26

Table 24. Estimated Average Loss in Crop Receipts Due to the Declining Price Scenario Relative to the Baseline Price Scenario and the Percent of the Loss Made up by Government Payments from Each of the Senate and House Farm Bill Plans.
Representative Farm Type
Number of
Farms
Estimated Average
Annual Loss in Crop
Receipts Due to
Declining Prices
($1,000)
Average Annual Percent of Lost Receipts Offset by Government
Payments (i.e., ARC, RLC, PLC, STAX, SCO, and LDPs/MLGs) from each of
the Farm Bill Options
Senate ARC
Indiv.
Senate ARC
County
House RLC
House PLC
All 64 Farms 64 527.2 15% 16% 16% 43%
Feedgrain/Oilseed 23 557.1 14% 14% 14% 37% Wheat 11 245.8 16% 15% 13% 59%
Cotton 16 608.7 16% 15% 20% 35% Rice 14 642.9 16% 17% 18% 48%
These results call into question whether the combination of Title I and XI producer
benefits (with producers paying premiums to gain the SCO portion) that replace 15
to 16% of a major loss is enough of a safety net.2 The summary in Appendix D
shows the difference in safety net spending analyzed in this report between the
Baseline price and declining price scenarios. There is little question that the shallow
loss programs in both the Senate and House provide about the same benefits across
farm types during the current high prices. The PLC option provides more Title I
protection than the other alternatives but the big difference is during low price
periods. The support from PLC increases significantly while SCO declines due to
being tied to current futures market prices.
2 It should be noted here that the results in this report also account for the declining value of individual crop insurance in NCFI as prices decline.
27

Throughout this report it is asserted that the House STAX is preferred to the STAX
program offered in the Senate Farm Bill. The programs are very similar except that
the House version has a reference price that provides additional protection when
prices decline below $0.6861/lb. Table 25 isolates the difference in average annual
benefits for the farms with cotton due to the STAX provisions. Clearly, during falling
prices, the presence of the reference price in the STAX calculation makes a
significant difference. The STAX program represents a significant departure from
traditional farm programs for cotton as producers will have to purchase the
coverage.
Table 25. Benefit in Terms of Higher Average Annual STAX Benefits From Including a Reference Price in the STAX Program Calculation Under the Declining Price Scenario.
Senate STAX House STAX Difference (House Minus Senate)
Average for all 27 farms growing cotton
39.4 73.7 34.3
Feedgrain/Oilseed 18.7 35.1 16.4
Wheat n/a n/a n/a Cotton 56.1 103.4 47.3
Rice 39.9 92.8 52.9
In this report, the producer safety net provided by either the Senate or House Farm
Bill packages are viewed as the combination of Title I and Title XI programs –
including payment limits. The results in this report are dependent on looking at the
total package. If the producer safety net from the Senate or House is viewed in
isolation (only Title I or only Title XI) the result will only provide part of the story.
As an example, the Title I benefits from the producer choices in the Senate and
House Farm Bills were compared and summary results are presented in Figure 6.
Based on higher NCFI over the life of the farm bill, forty-nine of the representative
farms would choose either the House PLC (35), RLC (12) or STAX (2) option with 15
selecting the Senate Individual ARC (4) or County based ARC (11). Recall that the
House PLC option that has SCO with the widest payment band was the consensus
option across all of the farms when total government support is considered.
One of the interesting considerations in these results is that the Senate AGI and
payment limit restrictions were the direct cause of 11 farms choosing one of the
House Farm Bill options. Looking at the map, it is clear that in North Dakota, Iowa,
Indiana and Missouri, the small farm in an area chooses the Senate ARC plan and the
28

large farm in the area picks the House RLC option. A closer inspection of the results
uncovers the cause as the tighter payment limits in the Senate Farm Bill. Refer to
Appendix C for more information regarding the probability of hitting the AGI
limitation.
Figure 6. All 64 Representative Farm’s Preferred Title I Safety Net Option of
the Senate Individual and County ARC and the House RLC and PLC
Alternatives.
Summary and Conclusions
AFPC’s 64 representative crop farms were used to analyze the Title I and XI safety net provisions of the Senate and House Farm Bill packages under Baseline price and declining price scenarios over the 2013-2017 life of the bill. The farm’s preference for one policy alternative over another was based on the alternative with the highest average net cash farm income (NCFI) over the life of the farm bill. This report considered the combined government support of Title I programs (ARC, PLC, and
29

RLC) with the SCO and STAX choices in Title XI. In addition, both AGI and individual payment limits were taken into consideration.
Under current Baseline prices, more of the representative farms would prefer the county-based ARC program over the individual yield-based ARC program in the Senate. A large number of the representative farms would prefer to “opt out” of either ARC program in favor of an SCO option with the wider payment band. The representative farms would prefer the House PLC option over the RLC option primarily due to RLC not having the SCO option. Under baseline prices all of the representative farms would prefer the House PLC option over any Senate option.
The results were very similar for the declining price scenario except that more farms would choose individual yield based ARC over county based ARC. There was a dramatic reduction in the number of farms “opting out” of ARC for SCO because SCO benefits are projected to decline substantially when prices fall over time. The substantial increase in PLC benefits offset the decline in SCO benefits which results in all farms preferring the House PLC option over any Senate option under the declining price scenario.
The following conclusions can be drawn from the analysis:
Accounting for downside price risk, all of the Title I options provide some safety net support under current price forecasts. The House SCO alternative (along with the Senate ARC opt out) that has a wider payment band than the Senate SCO option (when combined with Senate ARC) provides significant support under current price forecasts much like the shallow loss plans.
The Senate Individual and County based ARC option and the House RLC option are very similar except for two big considerations:
o Reference prices are included in the House which provide downside protection when prices decline.
o The lower payment limit in the Senate reduces the effectiveness of these Senate options when prices decline.
All of these revenue plans suffer from the inability to provide adequate safety net protection during declining prices. Only the House PLC option provides support at meaningful levels when prices decline.
SCO provides significantly less safety net support when prices are declining due to the reliance on current futures market prices in setting the benchmark.
STAX with a reference price provides significantly more protection than without, but growers must purchase the coverage, representing a significant departure from current law.
Senate payment and AGI limits would be binding regularly enough to make
the Senate options provide substantially less safety net benefits to one-fourth
of the representative farms.
30

References
Food and Agricultural Policy Research Institute (FAPRI). “U.S. Baseline Briefing Book: Projections for agricultural and biofuel markets.” FAPRI-MU Report #01-12, University of Missouri–Columbia, Columbia, Missouri, March 2012. Richardson, James W., Joe L. Outlaw, George M. Knapek, J. Marc Raulston, Brian K. Herbst, David P. Anderson, Henry L. Bryant, Steven L. Klose, and Peter Zimmel. “Representative Farms Economic Outlook for the January 2012 FAPRI/AFPC Baseline.” Texas AgriLife Research, Texas AgriLife Extension Service, Texas A&M University, Department of Agricultural Economics, Agricultural and Food Policy Center Working Paper 12-1, March 2012.
31

APPENDIX A:
CHARACTERISTICS OF
REPRESENTATIVE FARMS
32

2011 CHARACTERISTICS OF PANEL FARMS PRODUCING FEED GRAINS AND OILSEEDS IAG1350 IAG1350 is a 1,350-‐acre northwestern Iowa (Webster County) grain farm. The farm
is moderate-‐sized for the region and plants 880 acres of corn and 470 acres of soybeans annually. Seventy-‐seven percent of this farm’s 2011 receipts come from corn production.
IAG3400 This 3,400-‐acre large-‐sized grain farm is located in northwestern Iowa (Webster
County). It plants 2,040 acres of corn and 1,360 acres of soybeans each year, realizing 74 percent of receipts from corn production.
NEG2400 South central Nebraska (Dawson County) is home to this 2,400-‐acre grain farm.
This farm plants seventy-‐five percent of cultivated acres to corn and twenty-‐five percent to soybeans. The farm splits its corn acres evenly between yellow and white food-‐grade corn. Eighty-‐three percent of gross receipts are derived from corn sales.
NEG4300 This is a 4,300-‐acre grain farm located in south central Nebraska (Dawson County).
This operation plants 2,580 acres of corn and 1,290 acres of soybeans each year. Remaining acres are planted to alfalfa. A portion (25 percent) of the corn acreage is food-‐grade corn. In 2011, 73 percent of total receipts were generated from corn production.
NDG2500 NDG2500 is a 2,500-‐acre, moderate-‐sized, south central North Dakota (Barnes
County) grain farm that plants 500 acres of wheat, 500 acres of corn, and 1,500 acres of soybeans. One hundred acres are enrolled in the Conservation Reserve Program. The farm generated 48 percent of 2011 receipts from soybean sales.
NDG8000 This is an 8,000-‐acre, large-‐sized grain farm in south central North Dakota (Barnes
County) that grows 4,000 acres of soybeans, 2,450 acres of corn, 1,000 acres of wheat, and 300 acres of sunflowers annually. The remaining acreage is enrolled in the Conservation Reserve Program. Soybean and corn sales accounted for 84 percent of 2011 receipts.
ING1000 Shelby County, Indiana, is home to this 1,000-‐acre moderate-‐sized feedgrain farm.
This farm annually plants corn and soybeans in a 50/50 rotation. Due to this farm’s proximity to Indianapolis, land development pressures will likely constrain further expansion of this farm’s operations. Sixty-‐four percent of 2011 receipts came from corn sales.
ING2200 ING2200 is a large-‐sized grain farm located in east central Indiana (Shelby County).
This farm plants 1,100 acres to corn and 1,100 acres to soybeans each year. In 2011, 62 percent of gross receipts were generated by corn sales.
33

Appendix Table A. Characteristics of Panel Farms Producing Feed Grains.
IAG1350 IAG3400 NEG2400 NEG4300 NDG2500 NDG8000 ING1000 ING2200
County Webster Webster Dawson Dawson Barnes Barnes Shelby Shelby
Total Cropland 1,350.00 3,400.00 2,400.00 4,300.00 2,500.00 8,000.00 1,000.00 2,200.00Acres Owned 340.00 850.00 600.00 1,075.00 600.00 3,500.00 300.00 770.00Acres Leased 1,010.00 2,550.00 1,800.00 3,225.00 1,900.00 4,500.00 700.00 1,430.00
Assets ($1000)Total 3,455.00 9,000.00 5,270.00 10,183.00 2,367.00 12,680.00 3,336.00 7,656.00Real Estate 2,416.00 5,899.00 2,517.00 4,995.00 1,529.00 7,593.00 2,308.00 5,850.00Machinery 484.00 1,728.00 1,409.00 3,125.00 415.00 3,408.00 389.00 638.00Other & Livestock 555.00 1,373.00 1,344.00 2,062.00 423.00 1,679.00 639.00 1,167.00
Debt/Asset Ratios Total 0.15 0.15 0.12 0.16 0.11 0.18 0.10 0.10Intermediate 0.38 0.31 0.20 0.28 0.02 0.31 0.17 0.03Long Run 0.14 0.14 0.14 0.14 0.16 0.15 0.10 0.11
2011 Gross Receipts ($1,000)*Total 1,261.80 2,891.30 2,781.70 4,435.10 1,193.40 4,226.30 812.60 1,821.20
Corn 966.50 2,133.70 2,314.30 3,216.50 402.10 1,901.10 518.00 1,132.900.77 0.74 0.83 0.73 0.34 0.45 0.64 0.62
Wheat 0.00 0.00 0.00 0.00 211.00 467.20 1.00 0.000.00 0.00 0.00 0.00 0.18 0.11 0.00 0.00
Soybeans 295.20 757.60 467.40 932.30 576.90 1,650.50 293.60 688.300.23 0.26 0.17 0.21 0.48 0.39 0.36 0.38
Hay 0.00 0.00 0.00 286.30 0.00 0.00 0.00 0.000.00 0.00 0.00 0.07 0.00 0.00 0.00 0.00
Other Receipts 0.00 0.00 0.00 0.00 0.00 10.00 0.00 0.000.00 0.00 0.00 0.00 0.00 0.00 0.00 0.00
2011 Planted Acres**Total 1,350.00 3,400.00 2,400.00 4,300.00 2,600.00 8,000.00 1,000.00 2,200.00
Corn 880.00 2,040.00 1,800.00 2,580.00 500.00 2,450.00 500.00 1,100.000.65 0.60 0.75 0.60 0.19 0.31 0.50 0.50
Wheat 0.00 0.00 0.00 0.00 500.00 1,000.00 0.00 0.000.00 0.00 0.00 0.00 0.19 0.13 0.00 0.00
Soybeans 470.00 1,360.00 600.00 1,290.00 1,500.00 4,000.00 500.00 1,100.000.35 0.40 0.25 0.30 0.58 0.50 0.50 0.50
Hay 0.00 0.00 0.00 430.00 0.00 0.00 0.00 0.000.00 0.00 0.00 0.10 0.00 0.00 0.00 0.00
CRP 0.00 0.00 0.00 0.00 100.00 250.00 0.00 0.000.00 0.00 0.00 0.00 0.04 0.03 0.00 0.00
*Receipts for 2011 are included to indicate the relative importance of each enterprise to the farm. Percents indicate the percentage of the total receipts accounted for by the livestock categories and the crops. **Acreages for 2011 are included to indicate the relative importance of each enterprise to the farm. Total planted acreage may exceed total cropland available due to double cropping. Percents indicate the percentage of total planted acreage accounted for by the crop.
34

2011 PANEL FARMS PRODUCING FEED GRAINS AND OILSEEDS MOCG2300 MOCG2300 is a 2,300-‐acre grain farm located in central Missouri (Carroll County)
and plants 1,150 acres of corn and 1,150 acres of soybeans annually. This farm is located in the Missouri River bottom, an area with a large concentration of livestock production. This farm generated 61 percent of its total revenue from corn and 39 percent from soybeans during 2011.
MOCG4000 This is a 4,000-‐acre central Missouri (Carroll County) grain farm with 2,000 acres of
corn and 2,000 acres of soybeans. This farm is located in the Missouri River bottom, an area with a large concentration of livestock production. Corn sales accounted for 58 percent of farm receipts and soybeans accounted for 42 percent in 2011.
MONG1850 MONG1850 is a 1,850-‐acre diversified northwest Missouri grain farm centered in
Nodaway County. MONG1850 plants 900 acres of corn, 900 acres of soybeans, and 200 acres of hay annually. The farm also has a 200-‐head cow-‐calf herd. Proximity to the Missouri River increases marketing options for area grain farmers due to easily accessible river grain terminals. In 2011, 52 percent of the farm’s total receipts were from corn, 33 percent from soybeans, and 13 percent from cattle sales.
LAG2640 This is a 2,640-‐acre diversified farm located in north Louisiana (Morehouse Parish).
LAC2640 plants 264 acres of cotton and wheat, 1,056 acres of corn, and 1,188 acres of soybeans each year. During 2011, 79 percent of farm receipts were generated from corn and soybean sales.
LANG2500 This is a 2,500-‐acre, large-‐sized northeast Louisiana (Madison Parish) diversified
grain farm. This farm harvests 500 acres of rice, 800 acres of soybeans, 250 acres of cotton, and 950 acres of corn. For 2011, 57 percent of farm receipts came from corn and soybean sales.
TNG900 This is a 900-‐acre, moderate-‐sized grain farm in West Tennessee (Henry County).
Annually, this farm plants 500 acres of corn, 400 acres of soybeans, and 100 acres of wheat (planted before soybeans) in a region of Tennessee recognized for the high level of implementation of conservation practices by farmers. Sixty-‐five percent of 2011 farm receipts were from sales of corn.
TNG2200 West Tennessee (Henry County) is home to this 2,200-‐acre, large-‐sized grain farm.
Farmers in this part of Tennessee are known for their early and continued adoption of conservation practices, including widespread implementation of no-‐till farming. TNG2200 plants 1,100 acres of corn, 300 acres of wheat, and 1,100 acres of soybeans (300 of which are double-‐cropped after wheat). The farm generated 58 percent of its 2011 gross receipts from sales of corn and 33 percent from soybeans.
SCG3500 A 3,500-‐acre, large-‐sized South Carolina (Clarendon County) grain farm with 1,400
acres of corn, 875 acres of cotton, 1,225 acres of wheat, and 1,225 acres of soybeans double-‐cropped after wheat. The farm generated 34 percent of 2011 receipts from corn sales and 16 percent from soybean sales.
35

Appendix Table A. Characteristics of Panel Farms Producing Feed Grains.
MOCG2300 MOCG4000 MONG1850 LAG2640 LANG2500 TNG900 TNG2200 SCG3500
County Carroll Carroll Nodaway Morehouse Madison Henry Henry Clarendon
Total Cropland 2,300.00 4,000.00 1,850.00 2,640.00 2,500.00 900.00 2,200.00 3,500.00Acres Owned 1,380.00 2,000.00 950.00 0.00 1,250.00 150.00 550.00 1,400.00Acres Leased 920.00 2,000.00 900.00 2,640.00 1,250.00 750.00 1,650.00 2,100.00
Pastureland Acres Owned 0.00 0.00 600.00 0.00 0.00 0.00 0.00 1,400.00Acres Leased 0.00 0.00 400.00 0.00 0.00 0.00 0.00 0.00
Assets ($1000)Total 12,091.00 19,824.00 8,024.00 1,676.00 7,108.00 1,948.00 4,306.00 10,038.00Real Estate 9,885.00 16,350.00 6,554.00 600.00 4,654.00 1,055.00 2,375.00 7,570.00Machinery 948.00 986.00 627.00 855.00 1,518.00 460.00 1,261.00 1,015.00Other & Livestock 1,258.00 2,487.00 843.00 221.00 936.00 434.00 670.00 1,453.00
Debt/Asset Ratios Total 0.11 0.11 0.11 0.23 0.15 0.12 0.11 0.14Intermediate 0.16 0.18 0.11 0.33 0.33 0.13 0.10 0.22Long Run 0.11 0.11 0.12 0.15 0.12 0.15 0.13 0.16
Number of Livestock Beef Cows 0.00 0.00 200.00 0.00 0.00 0.00 0.00 0.00
2011 Gross Receipts ($1,000)*Total 1,686.90 2,442.20 1,361.30 2,262.20 2,433.70 630.60 1,324.50 3,167.90
Cattle 0.00 0.00 171.00 0.00 0.00 0.00 0.00 0.000.00 0.00 0.13 0.00 0.00 0.00 0.00 0.00
Corn 1,025.00 1,407.40 706.00 1,076.80 1,011.20 408.90 770.30 1,076.800.61 0.58 0.52 0.48 0.42 0.65 0.58 0.34
Wheat 0.70 1.50 0.00 110.50 0.00 38.80 111.60 654.800.00 0.00 0.00 0.05 0.00 0.06 0.08 0.21
Soybeans 661.20 1,033.40 447.90 704.10 375.80 180.30 442.60 519.900.39 0.42 0.33 0.31 0.15 0.29 0.33 0.16
Cotton 0.00 0.00 0.00 337.30 292.60 0.00 0.00 916.400.00 0.00 0.00 0.15 0.12 0.00 0.00 0.29
Hay 0.00 0.00 26.70 0.00 0.00 0.00 0.00 0.000.00 0.00 0.02 0.00 0.00 0.00 0.00 0.00
Other Receipts 0.00 0.00 9.80 0.00 0.00 2.50 0.00 0.000.00 0.00 0.01 0.00 0.00 0.00 0.00 0.00
2011 Planted Acres**Total 2,300.00 4,000.00 2,850.00 2,772.00 2,500.00 1,000.00 2,500.00 4,725.00
Corn 1,150.00 2,000.00 900.00 1,056.00 950.00 500.00 1,100.00 1,400.000.50 0.50 0.32 0.38 0.38 0.50 0.44 0.30
Wheat 0.00 0.00 0.00 264.00 0.00 100.00 300.00 1,225.000.00 0.00 0.00 0.10 0.00 0.10 0.12 0.26
Soybeans 1,150.00 2,000.00 900.00 1,188.00 800.00 400.00 1,100.00 1,225.000.50 0.50 0.32 0.43 0.32 0.40 0.44 0.26
Cotton 0.00 0.00 0.00 264.00 250.00 0.00 0.00 875.000.00 0.00 0.00 0.10 0.10 0.00 0.00 0.19
Hay 0.00 0.00 200.00 0.00 0.00 0.00 0.00 0.000.00 0.00 0.07 0.00 0.00 0.00 0.00 0.00
CRP 0.00 0.00 50.00 0.00 0.00 0.00 0.00 0.000.00 0.00 0.02 0.00 0.00 0.00 0.00 0.00
Improved Pasture 0.00 0.00 800.00 0.00 0.00 0.00 0.00 0.000.00 0.00 0.28 0.00 0.00 0.00 0.00 0.00
*Receipts for 2011 are included to indicate the relative importance of each enterprise to the farm. Percents indicate the percentage of the total receipts accounted for by the livestock categories and the crops. **Acreages for 2011 are included to indicate the relative importance of each enterprise to the farm. Total planted acreage may exceed total cropland available due to double cropping. Percents indicate the percentage of total planted acreage accounted for by the crop.
36

2011 PANEL FARMS PRODUCING FEED GRAINS AND OILSEEDS TXNP3000 This is a 3,000-‐acre diversified grain farm located on the northern High Plains of
Texas (Moore County). This farm plants 630 acres of cotton, 960 acres of irrigated corn, 240 acres of irrigated sorghum for seed production, and 870 acres of irrigated wheat annually. Fifty percent of total receipts are generated from corn sales.
TXNP8000 TXNP8000 is a large-‐sized diversified grain farm located in the northern Texas
Panhandle (Moore County). This farm annually plants 1,872 acres of irrigated cotton, 3,120 acres of irrigated corn, 867 acres of sorghum (587 acres of dryland and 280 acres of irrigated production for seed), and 1,555 acres of winter wheat (968 acres irrigated and 587 acres dryland). Fifty-‐seven percent of 2011 cash receipts were derived from corn sales.
TXPC2500 The Texas Panhandle is home to this 2,500-‐acre farm (Deaf Smith County).
Annually, wheat is planted on 1,242 acres (875 irrigated and 327 dryland), 875 acres planted to irrigated corn, 200 irrigated acres are planted to cotton, and grain sorghum is planted on 183 dryland acres. Sixty-‐four percent of 2011 cash receipts were generated by corn sales.
TXPG3760 TXPG3760 is a predominately irrigated farm located in the Texas Panhandle (Castro
County). Annually, 1,878 acres are planted to corn and 564 acres are planted to cotton. In 2011, 63 percent of cash receipts were generated from corn sales.
TXHG2500 This 2,500-‐acre grain farm is located on the Blackland Prairie of Texas (Hill County).
On this farm, 800 acres of corn, 900 acres of sorghum, 300 acres of cotton, and 500 acres of wheat are planted annually. Grain sales accounted for 67 percent of 2011 receipts with cotton accounting for 10 percent of sales. Forty beef cows live on 300 acres of improved pasture and contribute approximately three percent of total receipts. Due to the extreme drought in Texas in 2011, the farm received 20 percent of revenue from crop insurance indemnities.
TXWG1600 This 1,600-‐acre farm is located on the Blackland Prairie of Texas (Williamson
County). TXWG1600 plants 750 acres of corn, 300 acres of sorghum, 400 acres of cotton, and 150 acres of winter wheat annually. Additionally, this farm has a 40-‐head beef cow herd that is pastured on rented ground that cannot be farmed. Feedgrain sales accounted for 22 percent of 2011 receipts with cotton accounting for 40 percent of sales. Due to the extreme drought in Texas in 2011, the farm received 34 percent of revenue from crop insurance indemnities.
TXUG1200 TXUG1200 is a grain farm located in Uvalde County, Texas. This farm plants 500
acres of corn, 300 acres of cotton, 250 acres of grain sorghum, and 150 acres of wheat each year. All crops except wheat are grown under irrigation. In 2011, feed grain sales accounted for 55 percent of farm receipts.
37

Appendix Table A. Characteristics of Panel Farms Producing Feed Grains.
TXNP3000 TXNP8000 TXPG2500 TXPG3760 TXHG2500 TXWG1600 TXUG1200
County Moore Moore Deaf Smith Castro Hill Williamson Uvalde
Total Cropland 3,000.00 8,000.00 2,500.00 3,760.00 2,500.00 1,600.00 1,200.00Acres Owned 450.00 1,300.00 1,875.00 1,311.00 400.00 150.00 0.00Acres Leased 2,550.00 6,700.00 625.00 2,449.00 2,100.00 1,450.00 1,200.00
Pastureland Acres Owned 0.00 0.00 0.00 0.00 60.00 30.00 0.00Acres Leased 0.00 0.00 0.00 0.00 240.00 170.00 0.00
Assets ($1000)Total 2,235.00 7,001.00 4,392.00 5,358.00 2,098.00 1,257.00 307.00Real Estate 975.00 2,694.00 2,458.00 3,834.00 1,150.00 752.00 0.00Machinery 680.00 2,214.00 1,493.00 1,248.00 895.00 396.00 217.00Other & Livestock 580.00 2,093.00 440.00 275.00 53.00 109.00 90.00
Debt/Asset Ratios Total 0.13 0.11 0.18 0.17 0.25 0.10 0.09Intermediate 0.26 0.19 0.27 0.25 0.23 0.00 0.12Long Run 0.13 0.12 0.16 0.16 0.16 0.16 0.00
Number of Livestock Beef Cows 0.00 0.00 0.00 0.00 40.00 40.00 0.00
2011 Gross Receipts ($1,000)*Total 2,102.70 5,970.70 1,966.30 4,377.90 781.40 619.70 1,139.30
Cattle 0.00 0.00 0.00 0.00 26.60 21.50 0.000.00 0.00 0.00 0.00 0.03 0.04 0.00
Corn 1,044.70 3,416.30 1,253.90 2,743.80 172.10 72.80 480.700.50 0.57 0.64 0.63 0.22 0.12 0.42
Grain Sorghum 240.90 378.50 30.40 0.00 191.00 31.70 152.700.12 0.06 0.02 0.00 0.24 0.05 0.13
Wheat 297.50 451.50 398.60 0.00 164.90 33.80 27.100.14 0.08 0.20 0.00 0.21 0.05 0.02
Cotton 519.60 1,724.50 234.20 720.90 75.70 250.50 478.800.25 0.29 0.12 0.17 0.10 0.40 0.42
Other Receipts 0.00 0.00 49.20 88.60 0.00 0.00 0.000.00 0.00 0.03 0.02 0.00 0.00 0.00
2011 Planted Acres**Total 2,700.00 7,414.00 2,500.00 3,194.00 2,800.00 1,600.00 1,200.00
Corn 960.00 3,120.00 875.00 1,878.00 800.00 750.00 500.000.36 0.42 0.35 0.59 0.29 0.47 0.42
Grain Sorghum 240.00 867.00 183.00 0.00 900.00 300.00 250.000.09 0.12 0.07 0.00 0.32 0.19 0.21
Wheat 870.00 1,555.00 1,242.00 0.00 500.00 150.00 150.000.32 0.21 0.50 0.00 0.18 0.09 0.13
Cotton 630.00 1,872.00 200.00 564.00 300.00 400.00 300.000.23 0.25 0.08 0.18 0.11 0.25 0.25
CRP 0.00 0.00 0.00 188.00 0.00 0.00 0.000.00 0.00 0.00 0.06 0.00 0.00 0.00
Improved Pasture 0.00 0.00 0.00 0.00 300.00 0.00 0.000.00 0.00 0.00 0.00 0.11 0.00 0.00
*Receipts for 2011 are included to indicate the relative importance of each enterprise to the farm. Percents indicate the percentage of the total receipts accounted for by the livestock categories and the crops. **Acreages for 2011 are included to indicate the relative importance of each enterprise to the farm. Total planted acreage may exceed total cropland available due to double cropping. Percents indicate the percentage of total planted acreage accounted for by the crop.
38

2011 CHARACTERISTICS OF PANEL FARMS PRODUCING WHEAT WAW1725 This is a 1,725-‐acre moderate-‐sized grain farm in the Palouse of southeastern Washington
(Whitman County). It plants 1,147 acres of wheat, 120 acres of barley, and 458 acres of dry peas. Disease concerns dictate rotating a minimum acreage of barley and peas to maintain wheat yields. This farm generated 81 percent of 2011 receipts from wheat.
WAW5500 A 5,500-‐acre, large-‐sized grain farm in the Palouse of southeastern Washington (Whitman
County). Annually, this farm allocates 3,055 acres to wheat, 611 acres to barley, and 1,204 acres to dry peas. Diseases that inhibit wheat yield dictate the rotation of a minimum acreage of barley and peas. Wheat sales accounted for 77 percent of 2011 receipts.
WAAW3500 South central Washington (Adams County) is home to this 3,500-‐acre, large-‐sized grain farm.
Annually, this farm plants 1,500 acres of wheat in a wheat-‐fallow rotation. Additionally, 500 acres are enrolled in CRP In 2011, 96 percent of the farm’s income came from wheat.
ORW3600 ORW3600 is a 3,600-‐acre large-‐sized grain farm located in northeastern Oregon (Morrow
County). This farm plants 1,600 acres annually in a wheat-‐fallow rotation, with 400 additional acres enrolled in a CRP contract. Ninety-‐six percent of this farm’s 2011 total receipts came from wheat sales.
MTW4500 North-‐central Montana (Chouteau County) is home to this 4,500 acre farm on which 2,330
acres of wheat (1,711 acres of winter wheat, 619 acres of spring wheat) are planted each year. MTW4500 uses no-‐till production practices. In 2011, 99 percent of cash income came from wheat.
COW3000 A 3,000-‐acre northeast Colorado (Washington County), moderate-‐sized farm that plants 970
acres of winter wheat, 905 acres of millet, and 500 acres of corn each year. COW3000 has adopted minimum tillage practices on most of its acres. This farm generated 36 percent of its receipts from wheat, 34 percent from millet, and 29 percent from corn.
COW5640 A 5,640-‐acre, large-‐sized northeast Colorado (Washington County) wheat farm. It plants
1,900 acres of wheat, 890 acres of millet, and 890 acres of corn. During 2011, 55 percent of gross receipts came from wheat sales and 26 percent came from corn sales.
KSCW2000 South central Kansas (Sumner County) is home to this 2,000-‐acre, moderate-‐sized grain
farm. KSCW2000 plants 1,200 acres of winter wheat, 400 acres of soybeans, 200 acres of sorghum, and 200 acres of corn each year. For 2011, 55 percent of gross receipts came from wheat.
KSCW4500 A 4,500-‐acre, large-‐sized grain farm in south central Kansas (Sumner County) that plants
2,700 acres of winter wheat, 675 acres of corn, 675 acres of soybeans, and 450 acres of sorghum. Fifty-‐five percent of this farm’s 2011 total receipts were generated from sales of winter wheat.
KSNW4000 This is a 4,000-‐acre, moderate-‐sized northwest Kansas (Thomas County) grain farm. This
farm plants 1,500 acres of winter wheat (wheat-‐fallow rotation), 1,000 acres of corn, and 500 acres of sorghum. KSNW4000 also owns 80 head of beef cows. This farm generated 38 percent of 2011 receipts from wheat, 57 percent of its receipts from feedgrains, and 5 percent from cattle.
KSNW5500 KSNW5500 is a 5,500-‐acre, large-‐sized northwest Kansas (Thomas County) grain farm that
annually plants 1,820 acres of winter wheat, 2,050 acres of corn, 500 acres of sorghum, and 130 acres of soybeans. This farm also runs 100 head of beef cows. The farm generated 25 percent of receipts from wheat and 71 percent from feedgrainse during 2011.
39

Appendix Table A. Characteristics of Panel Farms Producing Wheat.
WAW1725 WAW5500 WAAW3500 ORW3600 MTW4500 COW3000 COW5640 KSCW2000 KSCW4500 KSNW4000 KSNW5500
County Whitman Whitman Adams Morrow Chouteau Washington Washington Sumner Sumner Thomas Thomas
Total Cropland 1,725.00 5,500.00 3,500.00 3,600.00 4,500.00 3,000.00 5,640.00 2,000.00 4,500.00 4,000.00 5,500.00Acres Owned 518.00 2,250.00 1,400.00 1,600.00 2,700.00 1,500.00 1,880.00 700.00 1,000.00 1,170.00 1,800.00Acres Leased 1,207.00 3,250.00 2,100.00 2,000.00 1,800.00 1,500.00 3,760.00 1,300.00 3,500.00 2,830.00 3,700.00
Pastureland Acres Owned 0.00 0.00 0.00 0.00 0.00 200.00 0.00 0.00 0.00 400.00 500.00Acres Leased 0.00 0.00 0.00 0.00 0.00 0.00 0.00 0.00 0.00 400.00 500.00
Assets ($1000)Total 2,044.00 8,413.00 1,670.00 1,592.00 3,421.00 2,130.00 3,389.00 2,162.00 3,795.00 2,847.00 4,842.00Real Estate 1,081.00 5,250.00 1,273.00 860.00 2,924.00 1,625.00 2,122.00 1,570.00 1,928.00 1,686.00 3,217.00Machinery 437.00 2,037.00 362.00 399.00 361.00 226.00 700.00 371.00 1,209.00 684.00 910.00Other & Livestock 525.00 1,126.00 34.00 333.00 136.00 279.00 567.00 220.00 658.00 478.00 715.00
Debt/Asset Ratios Total 0.09 0.11 0.18 0.14 0.13 0.12 0.12 0.11 0.14 0.16 0.15Intermediate 0.06 0.12 0.30 0.23 0.11 0.06 0.16 0.07 0.23 0.27 0.27Long Run 0.14 0.12 0.16 0.15 0.14 0.15 0.13 0.14 0.14 0.14 0.14
Number of Livestock Beef Cows 0.00 0.00 0.00 0.00 0.00 0.00 0.00 0.00 0.00 80.00 100.00
2011 Gross Receipts ($1,000)*Total 795.50 2,383.30 454.60 562.20 672.50 539.20 978.40 638.80 1,376.10 1,128.10 1,913.60
Cattle 0.00 0.00 0.00 0.00 0.00 0.00 0.00 0.00 0.00 59.70 85.400.00 0.00 0.00 0.00 0.00 0.00 0.00 0.00 0.00 0.05 0.05
Wheat 647.80 1,840.80 436.80 539.20 663.30 194.40 539.30 347.90 749.90 425.50 470.200.81 0.77 0.96 0.96 0.99 0.36 0.55 0.55 0.55 0.38 0.25
Grain Sorghum 0.00 0.00 0.00 0.00 0.00 0.00 0.00 75.50 174.70 195.50 197.700.00 0.00 0.00 0.00 0.00 0.00 0.00 0.12 0.13 0.17 0.10
Barley 40.60 225.00 1.00 0.00 9.20 0.00 0.00 0.00 0.00 0.00 0.000.05 0.09 0.00 0.00 0.01 0.00 0.00 0.00 0.00 0.00 0.00
Corn 0.00 0.00 0.00 0.00 0.00 153.50 251.00 99.00 325.90 447.30 1,068.100.00 0.00 0.00 0.00 0.00 0.29 0.26 0.16 0.24 0.40 0.56
Soybeans 0.00 0.00 0.00 0.00 0.00 0.00 0.00 116.40 125.60 0.00 92.100.00 0.00 0.00 0.00 0.00 0.00 0.00 0.18 0.09 0.00 0.05
Dry Peas 107.00 291.60 0.00 0.00 0.00 0.00 0.00 0.00 0.00 0.00 0.000.14 0.12 0.00 0.00 0.00 0.00 0.00 0.00 0.00 0.00 0.00
Millet 0.00 0.00 0.00 0.00 0.00 181.70 179.10 0.00 0.00 0.00 0.000.00 0.00 0.00 0.00 0.00 0.34 0.18 0.00 0.00 0.00 0.00
Other Receipts 0.00 25.90 16.80 23.00 0.00 9.60 9.00 0.00 0.00 0.00 0.000.00 0.01 0.04 0.04 0.00 0.02 0.01 0.00 0.00 0.00 0.00
2011 Planted Acres**Total 1,725.00 5,230.00 2,000.00 2,000.00 2,330.00 2,675.00 3,930.00 2,000.00 4,500.00 3,000.00 4,500.00
Wheat 1,147.00 3,055.00 1,500.00 1,600.00 2,330.00 970.00 1,900.00 1,200.00 2,700.00 1,500.00 1,820.000.67 0.58 0.75 0.80 1.00 0.36 0.48 0.60 0.60 0.50 0.40
Grain Sorghum 0.00 0.00 0.00 0.00 0.00 0.00 0.00 200.00 450.00 500.00 500.000.00 0.00 0.00 0.00 0.00 0.00 0.00 0.10 0.10 0.17 0.11
Barley 120.00 611.00 0.00 0.00 0.00 0.00 0.00 0.00 0.00 0.00 0.000.07 0.12 0.00 0.00 0.00 0.00 0.00 0.00 0.00 0.00 0.00
Corn 0.00 0.00 0.00 0.00 0.00 500.00 890.00 200.00 675.00 1,000.00 2,050.000.00 0.00 0.00 0.00 0.00 0.19 0.23 0.10 0.15 0.33 0.46
Soybeans 0.00 0.00 0.00 0.00 0.00 0.00 0.00 400.00 675.00 0.00 130.000.00 0.00 0.00 0.00 0.00 0.00 0.00 0.20 0.15 0.00 0.03
Dry Peas 458.00 1,204.00 0.00 0.00 0.00 0.00 0.00 0.00 0.00 0.00 0.000.27 0.23 0.00 0.00 0.00 0.00 0.00 0.00 0.00 0.00 0.00
Millet 0.00 0.00 0.00 0.00 0.00 905.00 890.00 0.00 0.00 0.00 0.000.00 0.00 0.00 0.00 0.00 0.34 0.23 0.00 0.00 0.00 0.00
CRP 0.00 360.00 500.00 400.00 0.00 300.00 250.00 0.00 0.00 0.00 0.000.00 0.07 0.25 0.20 0.00 0.11 0.06 0.00 0.00 0.00 0.00
*Receipts for 2011 are included to indicate the relative importance of each enterprise to the farm. Percents indicate the percentage of the total receipts accounted for by the livestock categories and the crops. **Acreages for 2011 are included to indicate the relative importance of each enterprise to the farm. Total planted acreage may exceed total cropland available due to double cropping. Percents indicate the percentage of total planted acreage accounted for by the crop.
40

2011 CHARACTERISTICS OF PANEL FARMS PRODUCING COTTON TXSP2500 A 2,500-‐acre Texas South Plains (Dawson County) cotton farm that is moderate-‐
sized for the area. TXSP2500 plants 2,275 acres of cotton (1,800 dryland, 475 irrigated). For 2011, 60 percent of receipts came from cotton. Due to the extreme drought in Texas in 2011, the farm received 40 percent of revenue from crop insurance indemnities.
TXSP4500 The Texas South Plains (Dawson County) is home to this 4,500-‐acre, large-‐sized
cotton farm that grows 4,047 acres of cotton (2,667 dryland, 1,380 irrigated) and 120 acres of wheat. Cotton sales comprised 78 percent of 2011 receipts. Due to the extreme drought in Texas in 2011, the farm received 19 percent of revenue from crop insurance indemnities.
TXEC5000 This 5,000-‐acre farm is located on the Eastern Caprock of the Texas South Plains
(Crosby County). Annually, 3,650 acres are planted to cotton (2,650 irrigated and 1,000 dryland), 550 acres of sorghum (250 irrigated and 300 dryland), and 300 acres of dryland wheat. In 2011, cotton sales accounted for 94 percent of gross receipts.
TXRP2500 TXRP2500 is a 2,500-‐acre cotton farm located in the Rolling Plains of Texas (Jones
County). This farm plants 1,000 acres of cotton and 1,000 acres of winter wheat each year. The area is limited by rainfall, and the farm uses a conservative level of inputs. Four percent of 2011 farm receipts came from cotton sales. Twenty-‐five head of beef cows generated nine percent of farm receipts. Due to the extreme drought in Texas in 2011, the farm received 63 percent of revenue from crop insurance indemnities.
TXMC1800 This 1,800-‐acre cotton farm is located on the Coastal Plain of southeast Texas
(Wharton County). TXMC1800 farms 300 acres of sorghum, 900 acres of cotton, and 600 acres of corn. In 2011, cotton sales comprised 57 percent of total cash receipts on this operation.
TXCB2250 A 2,250-‐acre cotton farm located on the Texas Coastal Bend (San Patricio County)
that farms 1,250 acres of cotton, 1,125 acres of sorghum, and 125 acres of corn annually. Sixty-‐four percent of 2011 cash receipts were generated by cotton.
TXCB8000 Nueces County, Texas is home to this 8,000-‐acre farm. Annually, 4,000 acres are
planted to cotton and 4,000 acres to sorghum. Cotton sales accounted for 66 percent of 2011 receipts.
TXVC4500 This 4,500-‐acre farm is located in the lower Rio Grande Valley of Texas (Willacy
County) and plants 1,495 acres to cotton (500 irrigated and 995 acres dryland), 2,780 acres to sorghum, and 225 acres of sugarcane. In 2011, 43 percent of TXVC4500’s cash receipts were generated by cotton sales.
41

Appendix Table A. Characteristics of Panel Farms Producing Cotton.
TXSP2500 TXSP4500 TXEC5000 TXRP2500 TXMC1800 TXCB2500 TXCB8000 TXVC4500
County Dawson Dawson Crosby Jones Wharton San Patricio Nueces Willacy
Total Cropland 2,500.00 4,500.00 5,000.00 2,500.00 1,800.00 2,500.00 8,000.00 4,500.00Acres Owned 500.00 900.00 640.00 400.00 180.00 500.00 320.00 900.00Acres Leased 2,000.00 3,600.00 4,360.00 2,100.00 1,620.00 2,000.00 7,680.00 3,600.00
Pastureland Acres Leased 0.00 0.00 0.00 500.00 0.00 0.00 0.00 0.00
Assets ($1000)Total 1,383.00 3,215.00 2,670.00 625.00 1,121.00 1,695.00 4,459.00 4,392.00Real Estate 674.00 900.00 592.00 328.00 431.00 975.00 662.00 1,927.00Machinery 642.00 1,392.00 1,195.00 242.00 690.00 559.00 2,439.00 1,556.00Other & Livestock 67.00 923.00 882.00 55.00 0.00 162.00 1,358.00 909.00
Debt/Asset Ratios Total 0.12 0.12 0.14 0.08 0.38 0.19 0.30 0.19Intermediate 0.12 0.20 0.23 0.00 0.20 0.33 0.50 0.35Long Run 0.14 0.14 0.14 0.16 0.16 0.14 0.16 0.16
Number of Livestock Beef Cows 0.00 0.00 0.00 25.00 0.00 0.00 0.00 0.00
2011 Gross Receipts ($1,000)*Total 804.30 2,148.70 2,725.30 461.30 845.00 1,190.10 4,341.10 2,345.40
Cattle 0.00 0.00 0.00 15.50 0.00 0.00 0.00 0.000.00 0.00 0.00 0.03 0.00 0.00 0.00 0.00
Cotton 484.00 1,675.00 2,549.90 19.30 478.50 760.10 2,878.80 999.500.60 0.78 0.94 0.04 0.57 0.64 0.66 0.43
Grain Sorghum 0.00 0.00 151.10 0.00 113.40 393.00 1,462.30 1,007.300.00 0.00 0.06 0.00 0.13 0.33 0.34 0.43
Wheat 0.00 54.80 24.30 139.70 0.00 0.00 0.00 0.000.00 0.03 0.01 0.30 0.00 0.00 0.00 0.00
Corn 0.00 0.00 0.00 0.00 131.60 37.00 0.00 0.000.00 0.00 0.00 0.00 0.16 0.03 0.00 0.00
Rice 0.00 0.00 0.00 0.00 8.80 0.00 0.00 0.000.00 0.00 0.00 0.00 0.01 0.00 0.00 0.00
2011 Planted Acres**Total 2,275.00 4,167.00 4,500.00 2,000.00 1,800.00 2,500.00 8,000.00 4,500.00
Cotton 2,275.00 4,047.00 3,650.00 1,000.00 900.00 1,250.00 4,000.00 1,495.001.00 0.97 0.81 0.50 0.50 0.50 0.50 0.33
Grain Sorghum 0.00 0.00 550.00 0.00 300.00 1,125.00 4,000.00 2,780.000.00 0.00 0.12 0.00 0.17 0.45 0.50 0.62
Wheat 0.00 120.00 300.00 1,000.00 0.00 0.00 0.00 0.000.00 0.03 0.07 0.50 0.00 0.00 0.00 0.00
Corn 0.00 0.00 0.00 0.00 600.00 125.00 0.00 0.000.00 0.00 0.00 0.00 0.33 0.05 0.00 0.00
*Receipts for 2011 are included to indicate the relative importance of each enterprise to the farm. Percents indicate the percentage of the total receipts accounted for by the livestock categories and the crops. **Acreages for 2011 are included to indicate the relative importance of each enterprise to the farm. Total planted acreage may exceed total cropland available due to double cropping. Percents indicate the percentage of total planted acreage accounted for by the crop.
42

2011 CHARACTERISTICS OF PANEL FARMS PRODUCING COTTON CAC4000 A 4,000-‐acre cotton farm located in Kings County, California, CAC4000 plants 1,333
acres to cotton, 267 acres to hay, 2666 acres of silage, and harvests 400 acres of almonds. Thirty-‐three percent of 2011 receipts came from cotton sales.
ARNC5000 Far northeast Arkansas (Mississippi County) is home to this 5,000-‐acre cotton farm.
ARNC5000 plants all its acres to cotton annually, generating 100 percent of its receipts from cotton.
TNC2100 A 2,100-‐acre, moderate-‐sized West Tennessee (Fayette County) cotton farm.
TNC2100 consists of 525 acres of cotton, 1,020 acres of soybeans, 525 acres of corn, and 30 acres enrolled in CRP. Cotton accounted for 40 percent of 2011 gross receipts, with corn and soybeans contributing 28 percent and 33 percent, respectively.
TNC4050 TNC4050 is a 4,050-‐acre, large-‐sized West Tennessee (Haywood County) cotton
farm. This farm plants 2,025 acres of cotton, 1,425 acres of soybeans, 600 acres of corn, and 475 acres of wheat each year. During 2011, cotton sales generated 63 percent of gross receipts.
ALC3000 A 3,000-‐acre cotton farm located in northern Alabama (Lawrence County) that
plants 1,050 acres to cotton, 1,350 acres to corn, 600 acres of soybeans and 450 acres to wheat annually. This farm was early to adopt no-‐till cropping practices. Cotton sales accounted for 43 percent of total farm receipts during 2011.
GAC2300 Southwest Georgia (Decatur County) is home to a 2,300-‐acre cotton farm that plants
1,200 acres to cotton, 550 acres to peanuts, and 550 acres to corn. In 2011, farm receipts were comprised of cotton sales (45 percent), corn (25 percent), and peanut sales (28 percent).
SCC1800 SCC1800 is a moderate-‐sized, 1,800-‐acre grain farm in South Carolina (Barnwell
County) consisting of 540 acres of corn, 720 acres of cotton, 360 acres of peanuts, 180 acres of soybeans (double cropped behind wheat), and 180 acres of wheat. Fifty-‐two percent of the farm’s receipts were from cotton sales during 2011.
NCC1500 This is a 1,500-‐acre cotton farm located on the upper coastal plain of North Carolina
(Wayne County). NCC1500 plants 225 acres of cotton, 255 acres of wheat, 850 acres of soybeans, and 275 acres of corn annually. Cotton accounted for 20 percent of this farm’s 2011 receipts.
43

Appendix Table A. Characteristics of Panel Farms Producing Cotton.
CAC4000 ARNC5000 TNC2100 TNC4050 ALC3000 GAC2300 SCC1800 NCC1500
County Kings Mississippi Fayette Haywood Lawrence Decatur Calhoun Wayne
Total Cropland 4,000.00 5,000.00 2,100.00 4,050.00 3,000.00 2,300.00 1,800.00 1,500.00Acres Owned 2,000.00 1,000.00 225.00 1,000.00 0.00 1,150.00 450.00 225.00Acres Leased 2,000.00 4,000.00 1,875.00 3,050.00 3,000.00 1,150.00 1,350.00 1,275.00
Pastureland Acres Owned 0.00 0.00 0.00 0.00 0.00 100.00 200.00 0.00Acres Leased 0.00 0.00 0.00 0.00 0.00 100.00 0.00 0.00
Assets ($1000)Total 22,230.00 7,753.00 3,305.00 6,159.00 2,524.00 7,560.00 3,652.00 2,800.00Real Estate 18,900.00 3,100.00 1,337.00 3,629.00 392.00 5,145.00 2,165.00 1,190.00Machinery 985.00 3,932.00 525.00 851.00 1,572.00 1,066.00 705.00 1,108.00Other & Livestock 2,345.00 720.00 1,443.00 1,679.00 560.00 1,349.00 782.00 503.00
Debt/Asset Ratios Total 0.13 0.21 0.07 0.11 0.25 0.16 0.12 0.21Intermediate 0.20 0.29 0.07 0.11 0.35 0.32 0.11 0.36Long Run 0.14 0.15 0.09 0.14 0.16 0.15 0.17 0.15
Number of Livestock Beef Cows 0.00 0.00 0.00 0.00 0.00 125.00 0.00 0.00
2011 Gross Receipts ($1,000)*Total 8,588.70 5,206.40 1,595.60 3,184.10 2,153.80 3,320.30 1,758.30 1,169.40
Cattle 0.00 0.00 0.00 0.00 0.00 85.30 0.00 0.000.00 0.00 0.00 0.00 0.00 0.03 0.00 0.00
Cotton 2,795.40 5,206.40 629.80 2,000.50 923.10 1,491.40 908.40 236.400.33 1.00 0.40 0.63 0.43 0.45 0.52 0.20
Wheat 502.60 0.00 0.00 212.20 187.60 0.00 60.20 90.900.06 0.00 0.00 0.07 0.09 0.00 0.03 0.08
Soybeans 0.00 0.00 521.10 549.70 62.60 0.00 71.20 382.900.00 0.00 0.33 0.17 0.03 0.00 0.04 0.33
Corn 0.00 0.00 442.90 417.70 980.50 818.00 265.10 212.400.00 0.00 0.28 0.13 0.46 0.25 0.15 0.18
Hay 381.60 0.00 0.00 0.00 0.00 0.00 0.00 0.000.04 0.00 0.00 0.00 0.00 0.00 0.00 0.00
Peanuts 0.00 0.00 0.00 0.00 0.00 925.70 453.30 0.000.00 0.00 0.00 0.00 0.00 0.28 0.26 0.00
Silage 2,933.00 0.00 0.00 0.00 0.00 0.00 0.00 0.000.34 0.00 0.00 0.00 0.00 0.00 0.00 0.00
Other Receipts 1,976.10 0.00 1.80 4.00 0.00 0.00 0.00 246.800.23 0.00 0.00 0.00 0.00 0.00 0.00 0.21
2011 Planted Acres**Total 5,333.00 5,000.00 2,100.00 4,525.00 3,000.00 2,500.00 1,980.00 1,605.00
Cotton 1,333.00 5,000.00 525.00 2,025.00 1,050.00 1,200.00 900.00 225.000.25 1.00 0.25 0.45 0.35 0.48 0.46 0.14
Wheat 667.00 0.00 0.00 475.00 450.00 0.00 180.00 255.000.13 0.00 0.00 0.11 0.15 0.00 0.09 0.16
Soybeans 0.00 0.00 1,020.00 1,425.00 150.00 0.00 180.00 850.000.00 0.00 0.49 0.32 0.05 0.00 0.09 0.53
Corn 0.00 0.00 525.00 600.00 1,350.00 550.00 360.00 275.000.00 0.00 0.25 0.13 0.45 0.22 0.18 0.17
Hay 267.00 0.00 0.00 0.00 0.00 0.00 0.00 0.000.05 0.00 0.00 0.00 0.00 0.00 0.00 0.00
Peanuts 0.00 0.00 0.00 0.00 0.00 550.00 360.00 0.000.00 0.00 0.00 0.00 0.00 0.22 0.18 0.00
CRP 0.00 0.00 30.00 0.00 0.00 0.00 0.00 0.000.00 0.00 0.01 0.00 0.00 0.00 0.00 0.00
Almonds 400.00 0.00 0.00 0.00 0.00 0.00 0.00 0.000.08 0.00 0.00 0.00 0.00 0.00 0.00 0.00
Silage 2,666.00 0.00 0.00 0.00 0.00 0.00 0.00 0.000.50 0.00 0.00 0.00 0.00 0.00 0.00 0.00
*Receipts for 2011 are included to indicate the relative importance of each enterprise to the farm. Percents indicate the percentage of the total receipts accounted for by the livestock categories and the crops. **Acreages for 2011 are included to indicate the relative importance of each enterprise to the farm. Total planted acreage may exceed total cropland available due to double cropping. Percents indicate the percentage of total planted acreage accounted for by the crop.
44

2011 CHARACTERISTICS OF PANEL FARMS PRODUCING RICE CAR550 CAR550 is a 550-‐acre moderate-‐sized rice farm in the Sacramento Valley of
California (Sutter and Yuba Counties) that plants 500 acres of rice annually. This farm generated 100 percent of 2011 gross receipts from rice sales.
CAR3000 This is a 3,000-‐acre rice farm located in the Sacramento Valley of California
(Sutter and Yuba Counties) that is large-‐sized for the region. CAR3000 plants 3,000 acres of rice annually. One hundred percent of 2011 total receipts were generated from rice sales.
CABR1300 The Sacramento Valley (Butte County) is home to CABR1300, a 1,300-‐acre
rice farm. CABR1300 harvests 1,200 acres of rice annually, generating 100 percent of 2011 farm receipts from rice sales.
CACR800 CACR800 is a 800-‐acre rice farm located in the Sacramento Valley of
California (Colusa County). This farm harvests 800 acres of rice each year. During 2011, 100 percent of farm receipts were realized from rice sales.
TXR1350 This 1,350-‐acre rice farm located west of Houston, Texas (Colorado County)
is moderate-‐sized for the region. TXR1350 harvests 450 acres of first-‐crop rice and 360 acres of ratoon rice. The farm generated 98 percent of its receipts from rice during 2011.
TXR3000 TXR3000 is a 3,000-‐acre, large-‐sized rice farm located west of Houston,
Texas (Colorado County). This farm harvests 1,200 acres of first-‐crop rice and 1,080 acres of ratoon rice annually. TXR3000 realized 100 percent of 2011 gross receipts from rice sales.
TXBR1800 The Texas Gulf Coast (Matagorda County) is home to this 1,800-‐acre rice
farm. TXBR1800 plants a third of its acres to rice annually and fallows the remainder. In 2011, TXBR1800 realized 100 percent farm receipts from rice sales.
TXER3200 This 3,200-‐acre rice farm is located in the Texas Gulf Coast (Wharton
County). TXER3200 harvests 1,067 acres of first-‐crop rice and 960 acres of ratoon rice each year. The farm also grows 427 acres of soybeans and 640 acres of grain sorghum annually. Seventy-‐seven percent of 2011 receipts came from rice sales.
45

Appendix Table A. Characteristics of Panel Farms Producing Rice.
CAR550 CAR3000 CABR1300 CACR800 TXR1350 TXR3000 TXBR1800 TXER3200
County Sutter Sutter Butte Colusa Colorado Colorado Matagorda Wharton
Total Cropland 550.00 3,000.00 1,300.00 800.00 1,350.00 3,000.00 1,800.00 3,200.00Acres Owned 275.00 769.00 520.00 320.00 405.00 0.00 0.00 320.00Acres Leased 275.00 2,231.00 780.00 480.00 945.00 3,000.00 1,800.00 2,880.00
Assets ($1000)Total 2,464.00 9,823.00 6,885.00 4,257.00 1,585.00 1,193.00 763.00 1,386.00Real Estate 1,913.00 6,326.00 4,422.00 2,667.00 885.00 69.00 0.00 714.00Machinery 478.00 2,330.00 1,257.00 392.00 543.00 671.00 763.00 606.00Other & Livestock 73.00 1,168.00 1,205.00 1,197.00 157.00 453.00 0.00 66.00
Debt/Asset Ratios Total 0.12 0.16 0.15 0.11 0.22 0.11 0.74 0.13Intermediate 0.04 0.29 0.33 0.25 0.30 0.17 0.34 0.11Long Run 0.14 0.14 0.15 0.12 0.13 0.12 0.00 0.16
2011 Gross Receipts ($1,000)*Total 866.00 4,828.50 2,182.60 1,442.10 566.60 1,388.90 987.20 1,718.60
Rice 866.00 4,828.50 2,182.60 1,442.10 556.60 1,383.90 987.20 1,314.101.00 1.00 1.00 1.00 0.98 1.00 1.00 0.77
Soybeans 0.00 0.00 0.00 0.00 0.00 0.00 0.00 132.600.00 0.00 0.00 0.00 0.00 0.00 0.00 0.08
Grain Sorghum 0.00 0.00 0.00 0.00 0.00 0.00 0.00 271.900.00 0.00 0.00 0.00 0.00 0.00 0.00 0.16
Other Receipts 0.00 0.00 0.00 0.00 10.00 5.00 0.00 0.000.00 0.00 0.00 0.00 0.02 0.00 0.00 0.00
2011 Planted Acres**Total 500.00 3,000.00 1,200.00 800.00 450.00 1,200.00 600.00 2,134.00
Rice 500.00 3,000.00 1,200.00 800.00 450.00 1,200.00 600.00 1,067.001.00 1.00 1.00 1.00 1.00 1.00 1.00 0.50
Soybeans 0.00 0.00 0.00 0.00 0.00 0.00 0.00 427.000.00 0.00 0.00 0.00 0.00 0.00 0.00 0.20
Grain Sorghum 0.00 0.00 0.00 0.00 0.00 0.00 0.00 640.000.00 0.00 0.00 0.00 0.00 0.00 0.00 0.30
*Receipts for 2011 are included to indicate the relative importance of each enterprise to the farm. Percents indicate the percentage of the total receipts accounted for by the livestock categories and the crops. **Acreages for 2011 are included to indicate the relative importance of each enterprise to the farm. Total planted acreage may exceed total cropland available due to double cropping. Percents indicate the percentage of total planted acreage accounted for by the crop.
46

2011 CHARACTERISTICS OF PANEL FARMS PRODUCING RICE LASR1480 A 1,480-‐acre southwest Louisiana (Acadia, Jeff Davis, and Vermilion
parishes) rice farm, LASR1480 is moderate-‐sized for the area. This farm harvests 800 acres of rice and 530 acres of soybeans. During 2011, 76 percent of gross receipts were generated from rice sales.
ARMR7500 ARMR7500 is a 7,500-‐acre diversified rice farm in southeast Arkansas
(Desha County) that plants 1,875 acres of rice, 2,375 acres of soybeans (750 double cropped behind wheat), 1,500 acres of cotton, 1,500 acres of corn, and 1,000 acres of wheat. For 2011, 28 percent of gross receipts came from rice sales, 30 percent from cotton sales, 21 percent from corn sales, and 16 percent from soybean sales.
ARSR3240 ARSR3240 is a 3,240-‐acre, large-‐sized Arkansas (Arkansas County) rice farm
that harvests 1,620 acres of rice, 1,620 acres of soybeans, and 324 acres of wheat (planted before soybeans) each year. Sixty-‐seven percent of this farm’s 2011 receipts came from rice sales.
ARWR1400 East central Arkansas (Cross County) is home to this 1,400-‐acre rice farm.
Moderate-‐sized for the region, ARWR1400 annually plants 700 acres each to rice and soybeans. During 2011, rice sales generated 68 percent of gross receipts.
ARHR3000 ARHR3000 is a 3,000-‐acre large-‐sized northeast Arkansas (Lawrence
County) rice farm that annually harvests 1,450 acres of rice, 1,250 acres of soybeans, and 300 acres of corn. Rice sales accounted for 63 percent of 2011 farm receipts.
MOWR4000 A 4,000-‐acre rice farm located in southeast Missouri (Butler County),
MOWR4000 is large-‐sized for the region. Annually, this farm plants 2,000 acres of rice and 2,000 acres of soybeans. Sixty-‐six percent of receipts for this farm came from rice sales in 2011.
47

Appendix Table A. Characteristics of Panel Farms Producing Rice.
LASR1480 ARMR7500 ARSR3240 ARWR1400 ARHR3000 MOWR4000
County Acadia Desha Arkansas Cross Lawrence Butler
Total Cropland 1,480.00 7,500.00 3,240.00 1,400.00 3,000.00 4,000.00Acres Owned 150.00 1,200.00 648.00 420.00 1,000.00 2,000.00Acres Leased 1,330.00 6,300.00 2,592.00 980.00 2,000.00 2,000.00
Assets ($1000)Total 1,390.00 9,503.00 4,738.00 3,132.00 5,166.00 14,196.00Real Estate 952.00 3,253.00 2,039.00 1,788.00 2,487.00 9,490.00Machinery 438.00 4,877.00 2,422.00 1,311.00 2,656.00 3,444.00Other & Livestock 0.00 1,373.00 277.00 33.00 22.00 1,262.00
Debt/Asset Ratios Total 0.11 0.16 0.26 0.19 0.25 0.14Intermediate 0.17 0.21 0.39 0.21 0.28 0.24Long Run 0.07 0.15 0.14 0.14 0.15 0.12
2011 Gross Receipts ($1,000)*Total 1,011.40 6,334.30 2,112.50 1,058.70 2,269.10 3,069.30
Rice 768.90 1,767.30 1,408.10 715.20 1,435.00 2,017.300.76 0.28 0.67 0.68 0.63 0.66
Soybeans 188.20 1,022.40 582.70 343.60 572.50 1,052.000.19 0.16 0.28 0.32 0.25 0.34
Corn 0.00 1,305.20 0.00 0.00 261.60 0.000.00 0.21 0.00 0.00 0.12 0.00
Wheat 0.00 346.30 121.70 0.00 0.00 0.000.00 0.06 0.06 0.00 0.00 0.00
Cotton 0.00 1,893.10 0.00 0.00 0.00 0.000.00 0.30 0.00 0.00 0.00 0.00
Other Receipts 54.40 0.00 0.00 0.00 0.00 0.000.00 0.00 0.00 0.00 0.00 0.00
2011 Planted Acres**Total 1,330.00 8,250.00 3,564.00 1,400.00 3,000.00 4,000.00
Rice 800.00 1,875.00 1,620.00 700.00 1,450.00 2,000.000.60 0.23 0.46 0.50 0.48 0.50
Soybeans 530.00 2,375.00 1,620.00 700.00 1,250.00 2,000.000.40 0.29 0.46 0.50 0.42 0.50
Corn 0.00 1,500.00 0.00 0.00 300.00 0.000.00 0.18 0.00 0.00 0.10 0.00
Wheat 0.00 1,000.00 324.00 0.00 0.00 0.000.00 0.12 0.09 0.00 0.00 0.00
Cotton 0.00 1,500.00 0.00 0.00 0.00 0.000.00 0.18 0.00 0.00 0.00 0.00
*Receipts for 2011 are included to indicate the relative importance of each enterprise to the farm. Percents indicate the percentage of the total receipts accounted for by the livestock categories and the crops. **Acreages for 2011 are included to indicate the relative importance of each enterprise to the farm. Total planted acreage may exceed total cropland available due to double cropping. Percents indicate the percentage of total planted acreage accounted for by the crop.
48

APPENDIX B:
LIST OF PANEL FARM
COOPERATORS
49

FEED GRAIN FARMS Indiana Facilitators Mr. Scott Gabbard - Extension Educator, Shelby County, Purdue Cooperative Extension Panel Participants Mr. David Brown Mr. Kevin Carson Mr. Jerry Drake Mr. Gary Everhart Mr. Richard Fix Mr. Darrell Linville Mr. Mark Nigh Mr. Gary Robards Mr. Ken Simpson Mr. Doug Theobald Mr. Keith Theobald Mr. Jeremy Weaver Iowa Facilitators Mr. Jim Patton - County Extension Director, Webster County Panel Participants Mr. Robert Anderson Mr. Dean Black Mr. Perry Black Mr. A.J. Blair Mr. Jason Carver Mr. and Mrs. Jim Carver Mr. Kevin Carver Mr. Larry Lane Todd Lundgren Mr. Robert Lynch Mr. William Secor Mr. Doug Stanek Mr. Jason Stanek Mr. Loren Wuebker Louisiana Facilitators Mr. Kurt Guidry - Professor, LSU Ag Center Panel Participants Mr. R. Berry Barham Mr. Jess Barr Mr. John Carroll Mr. Randy Miller Mr. Buddy Page Louisiana - Northeast Facilitators Mr. Kurt Guidrey - Professor, LSU Ag Center Panel Participants Mr. Damian Bollich Mr. Mark Brown Mr. Fred Franklin Mr. Ed Greer Mr. Lindy Lingo Mr. Ed Patrick Missouri - Central Facilitators Mr. Parman Green - Farm Management Specialist, University of Missouri-Columbia Panel Participants Mr. Joe Brockmeier Mr. Mark Casner Mr. Kyle Durham Mr. Dennis Germann Mr. Ron Gibson Mr. Todd Gibson Mr. Dale Griffith Mr. Jack Harriman Mr. Mike Hisle Mr. Preston Hisle Mr. Glenn Kaiser Mr. David Kipping Mr. Robert Kipping Mr. Gerald Kitchen Mr. Rob Korff Mr. Craig Linneman Mr. Ron Linneman Mr. Terry Reimer Mr. Mike Ritchhart Mr. James Wheeler
50

FEED GRAIN FARMS (CONTINUED)Missouri - Northwest
Panel ParticipantsMr. Jack Baldwin Mr. Gary EckerMr. Kevin Rosenbohm Mr. Roger Vest
Nebraska - CentralFacilitators
Mr. Bruce Treffer - Extension Educator, Dawson CountyPanel Participants
Mr. Jim Aden Mr. Rob AndersonMr. Jeremy Geiger Mr. Greg HueftleMr. Pat Luther Mr. Tim MalineMr. Scott McPheeters Mr. Dave RoweMr. Paul Stieb Mr. Dan Strauss
North DakotaFacilitators
Dr. Dwight Aakre - Extension Associate-Farm Management, North Dakota State UniversityMr. Randy Grueneich - County Extension Agent, North Dakota State University
Panel ParticipantsMr. Jim Broten Mr. Wade BrunsMr. Mike Clemens Mr. Jack FormoMr. Leland Guscette Mr. Raymond HaugenMr. Greg Shanenko Mr. Anthony ThilmonyMr. Arvid Winkler
South CarolinaFacilitators
Dr. Todd Davis - Assistant Professor/Extension Economist, Clemson UniversityMr. Scott Mickey
Panel ParticipantsMr. Troy Allen Ms. Vikki BrogdonMr. Cag Brunson Mr. Chris CogdillMr. Harry DuRant Mr. Sam DuRantMr. Jason Gamble Mr. Steven GambleMr. Barry Hutto Mr. Tommy LeeMr. Joe McKeower Mr. John Michael Parimuha
TennesseeFacilitators
Mr. Ranson Goodman - Extension Agent & County Director, Henry CountyMr. Jeff Lannom - Extension Agent & County Director, Weakley CountyMr. Tim Smith - County Extension Agent, Obion County
Panel ParticipantsMr. Jason Crabtree Mr. James S. DavisMr. John Erwin Mr. Mike FreemanMr. David Grant Mr. Wayne GrantMr. Bob Grooms Mr. Donald ParkerMr. Doug Schoolfield Mr. Jamie TuckMr. Gilbert Workman, Jr.
51

FEED GRAIN FARMS (CONTINUED)Texas - Northern Blackland Prairie
FacilitatorsMr. Ryan Collett - County Extension Agent, Hill CountyMr. Marty Jungman - County Extension Agent, Hill County
Panel ParticipantsMr. Justin Kaska Mr. Kenneth MachacMr. Chad Radke Mr. John SawyerMr. Aaron Walters
Texas - Northern High PlainsFacilitators
Dr. Steve Amosson - Extension Economist - Management, Texas A&M UniversityMr. Marcel Fischbacher - County Extension Agent, Moore County
Panel ParticipantsMr. Kerry Cartrite Mr. Brent ClarkMr. Kelly Hays Mr. Casey KimbrellMr. Rick May Mr. Tom MooreMr. H.D. Morton Mr. Wesley SpurlockMr. Darren Stallwitz Mr. Dee VaughanMr. Willie Wieck Ms. Linda Williams
Texas - PanhandleFacilitators
Mr. Steve Young - County Extension Agent, Castro CountyPanel Participants
Mr. Donny Carpenter Mr. Coby GilbreathMs. Rosie Kleman Mr. Lance LoudderMr. Greg Sides Mr. Andy Williams
Texas - PanhandleFacilitators
Mr. Rick Auckerman - County Extension Agent, Texas Cooperative ExtensionMr. Michael Clayman - Regional Vice President, First Ag Credit
Panel ParticipantsMr. Michael Carlson Mr. Roy CarlsonMr. Greg Chavez Mr. Steve HoffmanMr. Bob Meyer Mr. Harold Sides
Texas - Southern Blackland PrairieFacilitators
Mr. Dustin Coufal - County Extension Agent, Williamson CountyPanel Participants
Mr. Terry Pekar Mr. Herbert RaeszMr. Doug Schernik Mr. Ken SeggernMr. Donald Stolte
Texas - SouthwestFacilitators
Mr. Bryson Dalrymple - County Extension Agent, Uvalde CountyPanel Participants
Mr. Jimmy Carnes Mr. Mark LandryMr. Danny Parker Mr. James Parker
52

WHEAT FARMSColorado
FacilitatorsMr. John Deering - Ag Business Agent, Colorado State UniversityMr. Dennis Kaan - Director, Golden Plains Area Extension, Colorado State University
Panel ParticipantsMr. Rollie Deering Mr. Ward DeeringMr. David Foy Mr. William HarmanMs. Gisele Jefferson Mr. Terry KuntzMr. Dave Lillich Mr. Max OlsenMs. Sara Olsen Mr. Ken RemingtonMr. Craig Saxton Mr. Calvin SchaffertMr. Harlan Schaffert Mr. Dave WagersMr. John Wright
Kansas - NorthwestFacilitators
Dr. Dan O'Brien - Area Extension Director, Kansas State UniversityMr. Mark Wood - Extension Agricultural Economist, Kansas Farm Mgmt. Association
Panel ParticipantsMr. Vernon Akers Mr. Steve BusseRich Calliham Mr. Richard CallihamMr. Sam Crouse Mr. Dennis FranklinMr. Lyman Goetsch Mr. Lee JuenemannMr. Brian Laufer Mr. Lance LeebrickMr. Harold Mizell Mr. Steve Schertz
Kansas - South CentralFacilitators
Mr. Gary Cramer - County Extension Agent, Sedgwick CountyMr. Johnny Roberts - County Extension Agent, Sumner County
Panel ParticipantsMr. Dennis Gruenbacher Mr. Doug HiskenMr. Kent Ott Mr. David ReichenbergerMr. Nick Steffen Troy & Julia StrnadMr. Jim Stuhlsatz Mr. Tim TurekMr. Robert White
Montana - North CentralFacilitators
Mr. Lochiel EdwardsPanel Participants
Mr. Darin Arganbright Mr. Steve BahnmillerMr. Duane Beirwagen Mr. Will RoehmMr. Dan Works
Oregon - North CentralFacilitators
Jon Farquharson - BMCC Farm ManagementPanel Participants
Mr. Dana Heideman Mr. Bill JepsenMr. Joe McElligott Mr. Craig MilesMrs. Shannon Rust Mr. Tim Rust
53

WHEAT FARMS (CONTINUED)Washington
FacilitatorsMr. Aaron Esser - County Director, WSU Extension
Panel ParticipantsMr. Dan Hille Mr. Alan KochMr. Mike Miller Mr. Tim SmithMr. Steve Taylor
Washington - PalouseFacilitators
Dr. Janet Schmidt - Extension Faculty, Washington State UniversityMr. Steve Van Vleet - Extension Agronomist, Washington State University
Panel ParticipantsMr. Eric Appel Mr. Ben BarstowMr. Asa Clark Mr. Gavin ClarkMr. Tom Cocking Mr. David HarlowMr. Brian Largent Mr. Gary LargentMr. Michael Largent Mr. Clark MillerMr. Bruce Nelson Mr. Randy SuessMr. David Swannack Mr. Del TeadeMr. Steve Teade Mr. Jon Whitman
54

COTTON FARMSAlabama
Panel ParticipantsMr. James Blythe Mr. Paul ClarkDr. Steve Ford Mr. William LeeMs. Larkin Martin Mr. Ron Terry
Arkansas - Adams Land Co. GinFacilitators
Mr. Dave Freeze - CEA Mississippi County, U of Arkansas Cooperative ExtensionMr. Ronnie KennettMr. Blake McClellandMs. Jenny StacksDr. Brad Watkins - Research Assistant Professor, U. of Arkansas Cooperative Extension
Panel ParticipantsMr. Chad Costner Mr. Heath DonnerMr. Todd Edwards Mr. Cole HawkinsMr. Justin Hawkins Mr. Randy JacksonMr. David Wildy
California - HanfordFacilitators
Mr. Steve Wright - Cooperative Extension County Offices, Tulare CountyPanel Participants
Mr. Bo Champlin Mr. Kirk GilkeyMr. Matt Gilkey Mr. Ted SheelyMr. Bill Stone Mr. Bill TosMr. Mark Watte
Georgia - SouthwestFacilitators
Mr. Rome Ethredge - County Extension Coordinator, Seminole CountyMr. Mitchell May - County Extension Coordinator, Decatur CountyDr. Don Shurley - Professor/Economist - Cotton, University of GeorgiaDr. Nathan Smith - Assistant Professor, Extension Economist, University of Georgia
Panel ParticipantsMr. Andy Bell Mr. Jerry JonesMr. Willard Mims Mr. Raymond Thompson
North CarolinaFacilitators
Mr. Kevin Johnson - County Extension Agent, Wayne CountyPanel Participants
Mr. Landis Brantham, Jr. Mr. Willie HowellMr. David B. Mitchell, Sr. Mr. Danny C. PierceMr. Craig West Mr. Bryant Worley
55

COTTON FARMS (CONTINUED)South Carolina
FacilitatorsDr. Todd Davis - Assistant Professor/Extension Economist, Clemson UniversityMr. Scott Mickey
Panel ParticipantsMr. James Bookhart
Mr. Corrin F. "Bud" Bowers Mr. Johnny & Debbie CriderMr. Jimmie Griner Mr. Henry HerndonMr. Bates Houck Mr. Dean & Richard HuttoMr. Doug Jarrell Mr. J. O. PattersonMr. Jeff Sandifer Mr. Stephen Still
TennesseeFacilitators
Mr. Jim Castellaw - Extension Area Specialist, Farm ManagementDr. Chism Craig - University of TennesseeMr. Chuck Danehower - Extension Area Specialist, Farm ManagementMr. Chris Main - Cotton SpecialistMs. Tracey Sullivan - County Extension Agent, Haywood CountyMr. Jeff Via - County Extension Director, Fayette County
Panel ParticipantsMr. Harris Armour, III Mr. Chuck DacusMr. R. Morris English, Jr. Mr. Lee GravesMr. Dewayne Hendrix Mr. Tom KarcherMr. Allen King Mr. John KingMr. Travis Lonon Mr. William E. PowersMr. Ronald Woods
Texas - Coastal BendFacilitators
Mr. Duane Campion - County Extension Agent, San Patricio County and Aransas CountyDr. Larry Falconer - Extension Economist - Management, Texas A&M UniversityMr. Mark Miller - Chief Operations Officer, Texas AgFinanceMr. Jeff Nunley - Executive Director, South Texas Cotton & Grain AssociationMr. John Parker - Vice President, Texas AgFinanceMr. Jeff Stapper - County Extension Agent, Nueces CountyMr. Mac Young - Extension Specialist-Risk Management, Texas AgriLife Extension
Panel ParticipantsMr. Travis Adams Mr. Marvin Beyer, Jr.Mr. Brad Bickham Mr. Jimmy DodsonMr. Jon Gwynn Mr. Darrell LawhonMr. Larry McNair Mr. Andrew MillerMr. Toby Robertson Mr. Darby SalgeMr. David Weaver Mr. Jon Whatley
Texas - Eastern CaprockFacilitators
Mr. Clay Miller - Vice President, Ag Texas Farm Credit ServicesPanel Participants
Mr. Lloyd Arthur Mr. Brooks EllisonMr. Edwin Moore Mr. Marvin Schoepf
56

COTTON FARMS (CONTINUED)Texas - Mid Coast
FacilitatorsDr. Larry Falconer - Extension Economist - Management, Texas A&M UniversityMr. Jeff Nunley - Executive Director, South Texas Cotton & Grain AssociationMr. Jimmy Roppolo - General Manager, Farmers Co-op of El CampoMr. Jimmy Schulz - Sales Coordinator, Farmers Co-op of El Campo
Panel ParticipantsMr. Jimmy Barosh Mr. Keith BramMr. Brent Cerny Mr. Glenn EmshosfMr. Daniel Gavranovic Mr. Rob KainerMr. Cedric Popp Mr. Michael Popp
Texas - Rio Grande ValleyFacilitators
Mr. Reagan Florence - Exec. VP - Chief Lending Officer, Ag Credit of South TexasMr. Luis Ribera - District Economist, Texas Cooperative ExtensionMr. Terry Wolfe - Loan Officer, Ag Credit of South Texas
Panel ParticipantsMr. Gary Busse Mr. Derrick SwanbergMr. Marshall Swanberg Mr. Mark Willis
Texas - Rolling PlainsFacilitators
Mr. Steven Estes - County Extension Agent, Texas AgriLife ExtensionPanel Participants
Mr. Rex Ford Mr. Kelly HeadMr. Michael McLellan Mr. Brian SandbotheMr. Mike Sloan Mr. Dale SpurginMr. Ferdie Walker Mr. Terry White
Texas - Southern High PlainsFacilitators
Dr. Jackie Smith - Extension Economist - Management, Texas A&M UniversityMr. Jeff Wyatt - County Extension Agent, Dawson County
Panel ParticipantsMr. Steven Archer Mr. Brad BoydMr. Andy Bratcher Mr. Terry ColemanMr. Will Cozart Mr. Kirk TidwellMr. Johnny Ray Todd Mr. Donald VoglerMr. David Warren
57

RICE FARMSArkansas
FacilitatorsMr. Chuck CappsMr. Steve Kelley - County Agent, U. of Arkansas Cooperative ExtensionDr. Brad Watkins - Research Assistant Professor, U. of Arkansas Cooperative Extension
Panel ParticipantsMr. Jeff Keeter Mr. Joe MencerMr. Matt Miles Mr. Jim WhitakerMr. Sam Whitaker
Arkansas - East Central-Arkansas CountyFacilitators
Mr. Bill Free - Riceland Foods, Inc.Dr. Brad Watkins - Research Assistant Professor, U. of Arkansas Cooperative Extension
Panel ParticipantsMr. Derek Bohanan Mr. Monty BohananMr. Jerry Burkett Mr. Dusty HoskynMr. David Jessup
Arkansas - East Central-Cross CountyFacilitators
Dr. Brad Watkins - Research Assistant Professor, U. of Arkansas Cooperative ExtensionMr. Rick Wimberley - County Extension Agent - Staff Chair, U. of Arkansas Cooperative Exte
Panel ParticipantsMr. Corbin Brown Mr. John CooperMr. Byron Holmes, Jr. Mr. Keith LockleyMr. Bryan Moery Mr. Roger Pohlner
Arkansas - Northeast-Lawrence CountyFacilitators
Mr. Herb GinnDr. Brad Watkins - Research Assistant Professor, U. of Arkansas Cooperative Extension
Panel ParticipantsMr. Greg Baltz Mr. Jeremy BaltzMr. Kyle Baltz Mr. Michael CuretonMr. Terry Gray Mr. Marvin Hare, Jr.Mr. Tori Hicks Mr. Dwain MorrisMr. Ray Stone
California - Butte CountyFacilitators
Dr. Cass Mutters - Farm Advisor, University of CaliforniaPanel Participants
Mr. Ken Anderson Mr. Mike BoegerMr. Lee Carrico Mr. Tom ColemanMr. Eric Larrabee Mr. Brad MattsonMr. Steve Rystrom Mr. Josh SheppardMr. Lance Tennis Mr. Eric Waterbury
58

RICE FARMS (CONTINUED)California - Colusa County
FacilitatorsDr. Cass Mutters - Farm Advisor, University of California
Panel ParticipantsMr. Don Bransford Mr. Mike LuxMr. Charles Marsh Mr. Joe StruckmeyerMr. Robert Sutton
California - Sutter CountyFacilitators
Dr. Chris Greer - Farm Advisor, University of CaliforniaPanel Participants
Mr. Paul Baggett Mr. Steve ButlerMr. Jack DeWitt Mr. Scott LeathersMr. Ned Lemenager Mr. Paul LoweryMr. Walt Trevethan Mr. Scott TuckerMr. Bob Van Dyke Mr. Wayne Vineyard
Louisiana - Southwest-AcadianaFacilitators
Mr. Barrett Courville - County Extension Agent, Acadia ParishMr. Stuart Gauthier - County Extension Agent, Vermilion ParishMr. Kurt Guidry - Professor, LSU Ag CenterMr. Allen Hogan - County Extension Agent, Jeff Davis Parish
Panel ParticipantsMr. Tommy Faulk Mr. David LacourMr. Jackie Loewer Mr. Christian RichardMr. Brian Wild Mr. Fred Zaunbrecher
Missouri - Bootheel West
Panel ParticipantsMr. Rodney Eaker Mr. Rusty EakerMr. John French Mr. Eric PattersonMr. Frank Smody Mr. Mike SmodyMr. Brian Yarbro
Texas - Bay City-Matagorda CountyFacilitators
Mr. Brent Batchelor - County Extension Agent, Matagorda CountyPanel Participants
Mr. Donnie Bulanek Mr. Mike BurnsideMr. Barrett Franz Mr. Billy MannMr. Curt Mowery Mr. Joey SlivaMr. Paul Sliva
Texas - Eagle Lake-Colorado County
Panel ParticipantsMr. Andy Anderson Mr. Steve BalasMr. Kenneth Danklefs Mr. W.A. "Billy" Hefner, IIIMr. Jason Hlavinka Mr. Patrick PavluMr. John Waligura Mr. Jim Wiese
59

RICE FARMS (CONTINUED)Texas - El Campo-Wharton County
Panel ParticipantsMr. L.G. Raun Mr. Layton RaunMr. Glen Rod Mr. Robert Shoemate
60

APPENDIX C:
INDIVIDUAL FARM RESULTS
61

IAG1350
ARC Indiv. ARC County RLC PLC ARC Indiv. ARC County RLC PLC
Loan Deficiency Payments 0.00 0.00 0.00 0.00 0.01 0.01 0.01 0.01
ARC or RLC or PLC Payments 22.64 27.63 25.13 12.19 40.69 48.56 51.10 95.30
Government Payments 22.64 27.63 25.13 12.19 40.71 48.57 51.11 95.31
STAX Net Payments 0.00 0.00 0.00 0.00 0.00 0.00 0.00 0.00
SCO Net Payments 13.46 13.46 0.00 46.16 9.46 9.46 0.00 32.43
Net Cash Farm Income 424.81 429.80 413.83 447.09 121.63 129.65 122.66 200.32
Real Net Worth 2017 4,220.83 4,236.58 4,186.71 4,291.24 3,141.66 3,174.06 3,155.64 3,451.03
AGI 3 Year Moving Average 404.72 406.80 397.20 418.79 233.82 237.85 232.01 268.13
Probability of Exceeding AGI Limit (%) 1 1 1 1 1 1 1 1
IAG3400
ARC Indiv. ARC County RLC PLC ARC Indiv. ARC County RLC PLC
Loan Deficiency Payments 0.00 0.00 0.00 0.00 0.03 0.03 0.03 0.03
ARC or RLC or PLC Payments 7.77 8.70 23.84 10.04 49.45 52.11 94.21 131.35
Government Payments 7.77 8.70 23.84 10.04 49.48 52.15 94.25 131.38
STAX Net Payments 0.00 0.00 0.00 0.00 0.00 0.00 0.00 0.00
SCO Net Payments 30.58 30.58 0.00 105.25 21.50 21.50 0.00 73.92
Net Cash Farm Income 1,094.06 1,094.99 1,079.61 1,171.09 393.07 395.76 418.36 531.32
Real Net Worth 2017 11,060.21 11,063.07 11,053.84 11,340.05 8,585.01 8,594.32 8,742.74 9,136.15
AGI 3 Year Moving Average 939.29 939.48 938.35 997.25 535.71 536.29 557.23 614.78
Probability of Exceeding AGI Limit (%) 75 75 49 57 33 33 21 22
NEG2400
ARC Indiv. ARC County RLC PLC ARC Indiv. ARC County RLC PLC
Loan Deficiency Payments 0.00 0.00 0.00 0.00 0.02 0.02 0.02 0.02
ARC or RLC or PLC Payments 23.11 22.38 40.29 20.67 65.06 64.42 100.85 149.61
Government Payments 23.11 22.38 40.29 20.67 65.08 64.44 100.87 149.64
STAX Net Payments 0.00 0.00 0.00 0.00 0.00 0.00 0.00 0.00
SCO Net Payments 27.32 27.32 0.00 95.89 19.27 19.27 0.00 67.45
Net Cash Farm Income 699.47 698.73 689.35 765.80 77.19 76.50 94.73 214.52
Real Net Worth 2017 6,555.46 6,553.05 6,531.84 6,773.48 4,202.54 4,199.74 4,302.81 4,794.02
AGI 3 Year Moving Average 650.61 650.02 643.93 693.74 297.09 296.22 305.87 367.51
Probability of Exceeding AGI Limit (%) 37 37 9 13 13 13 1 1
FAPRI Baseline Price Scenario Declining Price ScenarioSenate House Senate House
$1,000s $1,000s
FAPRI Baseline Price Scenario Declining Price ScenarioSenate House Senate House
$1,000s $1,000s
FAPRI Baseline Price Scenario Declining Price ScenarioSenate House Senate House
$1,000s $1,000s
62

NEG4300
ARC Indiv. ARC County RLC PLC ARC Indiv. ARC County RLC PLC
Loan Deficiency Payments 0.00 0.00 0.00 0.00 0.04 0.04 0.04 0.04
ARC or RLC or PLC Payments 7.99 8.15 24.99 11.95 54.74 54.49 127.47 144.79
Government Payments 7.99 8.15 24.99 11.95 54.78 54.53 127.51 144.84
STAX Net Payments 0.00 0.00 0.00 0.00 0.00 0.00 0.00 0.00
SCO Net Payments 40.49 40.49 0.00 142.25 28.55 28.55 0.00 99.96
Net Cash Farm Income 1,202.62 1,202.77 1,179.19 1,308.67 123.15 122.86 169.91 291.86
Real Net Worth 2017 11,927.03 11,927.50 11,859.33 12,273.81 7,690.11 7,688.29 7,936.82 8,428.74
AGI 3 Year Moving Average 999.49 999.56 982.20 1,064.75 377.56 377.22 396.61 464.55
Probability of Exceeding AGI Limit (%) 75 75 54 63 30 30 20 21
MOCG2300
ARC Indiv. ARC County RLC PLC ARC Indiv. ARC County RLC PLC
Loan Deficiency Payments 0.00 0.00 0.00 0.00 0.02 0.02 0.02 0.02
ARC or RLC or PLC Payments 25.76 28.23 22.14 14.43 50.79 51.28 46.86 110.25
Government Payments 25.76 28.23 22.14 14.43 50.81 51.31 46.89 110.28
STAX Net Payments 0.00 0.00 0.00 0.00 0.00 0.00 0.00 0.00
SCO Net Payments 23.71 23.71 0.00 72.29 16.60 16.60 0.00 50.65
Net Cash Farm Income 651.19 653.66 623.78 688.50 252.80 253.25 231.70 348.02
Real Net Worth 2017 13,184.49 13,192.20 13,096.49 13,304.66 11,754.32 11,753.97 11,682.68 12,120.71
AGI 3 Year Moving Average 537.81 539.04 519.87 561.43 314.63 314.52 298.23 357.79
Probability of Exceeding AGI Limit (%) 8 8 1 2 1 1 1 1
MOCG4000
ARC Indiv. ARC County RLC PLC ARC Indiv. ARC County RLC PLC
Loan Deficiency Payments 0.00 0.00 0.00 0.00 0.04 0.04 0.04 0.04
ARC or RLC or PLC Payments 4.69 5.76 14.01 8.49 45.28 47.27 66.39 128.25
Government Payments 4.69 5.76 14.01 8.49 45.31 47.31 66.42 128.29
STAX Net Payments 0.00 0.00 0.00 0.00 0.00 0.00 0.00 0.00
SCO Net Payments 37.09 37.09 0.00 113.03 25.97 25.97 0.00 79.19
Net Cash Farm Income 1,091.32 1,092.39 1,063.58 1,171.08 494.46 496.46 489.94 631.51
Real Net Worth 2017 22,195.93 22,199.34 22,201.79 22,545.67 20,147.59 20,153.49 20,232.89 20,691.44
AGI 3 Year Moving Average 965.61 966.16 965.88 1,032.66 621.55 622.32 635.34 710.74
Probability of Exceeding AGI Limit (%) 83 83 53 62 34 34 14 17
$1,000s $1,000s
FAPRI Baseline Price Scenario Declining Price ScenarioSenate House Senate House
FAPRI Baseline Price Scenario Declining Price ScenarioSenate House Senate House
$1,000s $1,000s
$1,000s $1,000s
FAPRI Baseline Price Scenario Declining Price ScenarioSenate House Senate House
63

MONG1850
ARC Indiv. ARC County RLC PLC ARC Indiv. ARC County RLC PLC
Loan Deficiency Payments 0.00 0.00 0.00 0.00 0.02 0.02 0.02 0.02
ARC or RLC or PLC Payments 24.03 22.80 20.28 11.29 37.55 41.12 42.76 86.09
Government Payments 24.03 22.80 20.28 11.29 37.57 41.14 42.78 86.11
STAX Net Payments 0.00 0.00 0.00 0.00 0.00 0.00 0.00 0.00
SCO Net Payments 12.73 12.73 0.00 41.44 8.91 8.91 0.00 28.98
Net Cash Farm Income 392.50 391.10 375.40 408.95 6.06 9.76 1.59 81.56
Real Net Worth 2017 8,763.62 8,756.22 8,704.84 8,813.70 7,075.58 7,089.48 7,059.25 7,415.09
AGI 3 Year Moving Average 322.80 321.42 312.42 333.59 103.66 105.04 99.14 135.61
Probability of Exceeding AGI Limit (%) 1 1 1 1 1 1 1 1
ING1000
ARC Indiv. ARC County RLC PLC ARC Indiv. ARC County RLC PLC
Loan Deficiency Payments 0.00 0.00 0.00 0.00 0.01 0.01 0.01 0.01
ARC or RLC or PLC Payments 14.33 16.89 15.19 8.10 26.01 28.93 30.36 61.58
Government Payments 14.33 16.89 15.19 8.10 26.02 28.94 30.37 61.59
STAX Net Payments 0.00 0.00 0.00 0.00 0.00 0.00 0.00 0.00
SCO Net Payments 10.35 10.35 0.00 32.33 7.23 7.23 0.00 22.59
Net Cash Farm Income 220.67 223.25 211.12 236.55 18.92 22.00 15.88 72.37
Real Net Worth 2017 3,679.89 3,688.55 3,648.40 3,734.16 2,877.20 2,890.48 2,868.20 3,119.02
AGI 3 Year Moving Average 195.34 196.64 189.56 205.35 82.37 83.83 79.35 105.52
Probability of Exceeding AGI Limit (%) 1 1 1 1 1 1 1 1
ING2200
ARC Indiv. ARC County RLC PLC ARC Indiv. ARC County RLC PLC
Loan Deficiency Payments 0.00 0.00 0.00 0.00 0.03 0.03 0.03 0.03
ARC or RLC or PLC Payments 27.84 33.74 33.77 16.10 54.22 61.08 64.91 113.71
Government Payments 27.84 33.74 33.77 16.10 54.25 61.11 64.94 113.74
STAX Net Payments 0.00 0.00 0.00 0.00 0.00 0.00 0.00 0.00
SCO Net Payments 25.43 25.43 0.00 75.50 17.74 17.74 0.00 52.73
Net Cash Farm Income 548.86 554.78 529.32 587.28 124.54 131.55 117.40 220.67
Real Net Worth 2017 8,967.59 8,987.38 8,902.38 9,100.18 7,286.80 7,316.46 7,265.84 7,712.78
AGI 3 Year Moving Average 465.81 469.06 454.23 490.01 225.71 229.42 219.19 269.59
Probability of Exceeding AGI Limit (%) 4 4 1 1 1 1 1 1
FAPRI Baseline Price Scenario Declining Price ScenarioSenate House Senate House
$1,000s $1,000s
FAPRI Baseline Price Scenario Declining Price ScenarioSenate House Senate House
$1,000s $1,000s
FAPRI Baseline Price Scenario Declining Price ScenarioSenate House Senate House
$1,000s $1,000s
64

NDG2500
ARC Indiv. ARC County RLC PLC ARC Indiv. ARC County RLC PLC
Loan Deficiency Payments 0.00 0.00 0.00 0.00 0.02 0.02 0.02 0.02
ARC or RLC or PLC Payments 21.34 23.28 20.27 15.22 40.16 42.31 44.86 91.40
Government Payments 21.34 23.28 20.27 15.22 40.18 42.33 44.88 91.43
STAX Net Payments 0.00 0.00 0.00 0.00 0.00 0.00 0.00 0.00
SCO Net Payments 4.90 4.90 0.00 23.12 3.39 3.39 0.00 16.06
Net Cash Farm Income 327.97 329.91 321.94 340.19 18.77 20.96 20.05 85.37
Real Net Worth 2017 3,205.27 3,212.04 3,186.16 3,247.61 1,938.72 1,949.84 1,951.01 2,252.65
AGI 3 Year Moving Average 296.90 297.20 292.61 304.64 123.88 124.00 121.49 151.48
Probability of Exceeding AGI Limit (%) 1 1 1 1 1 1 1 1
NDG8000
ARC Indiv. ARC County RLC PLC ARC Indiv. ARC County RLC PLC
Loan Deficiency Payments 0.00 0.00 0.00 0.00 0.14 0.14 0.14 0.14
ARC or RLC or PLC Payments 7.54 8.36 20.40 15.47 57.35 58.05 128.60 156.74
Government Payments 7.54 8.36 20.40 15.47 57.49 58.19 128.74 156.88
STAX Net Payments 0.00 0.00 0.00 0.00 0.00 0.00 0.00 0.00
SCO Net Payments 16.36 16.36 0.00 76.10 11.43 11.43 0.00 52.87
Net Cash Farm Income 1,343.48 1,344.30 1,340.42 1,411.66 246.35 247.04 309.78 392.51
Real Net Worth 2017 15,888.49 15,891.11 15,951.77 16,183.30 11,657.12 11,659.26 12,038.62 12,340.80
AGI 3 Year Moving Average 1,061.57 1,061.92 1,079.53 1,121.57 429.92 429.81 479.05 522.45
Probability of Exceeding AGI Limit (%) 80 80 64 66 30 30 20 21
TNG900
ARC Indiv. ARC County RLC PLC ARC Indiv. ARC County RLC PLC
Loan Deficiency Payments 0.00 0.00 0.00 0.00 0.01 0.01 0.01 0.01
ARC or RLC or PLC Payments 11.10 13.16 12.50 6.41 19.91 18.75 20.15 44.59
Government Payments 11.10 13.16 12.50 6.41 19.92 18.76 20.16 44.59
STAX Net Payments 0.00 0.00 0.00 0.00 0.00 0.00 0.00 0.00
SCO Net Payments 18.84 18.84 0.00 42.21 13.05 13.05 0.00 29.25
Net Cash Farm Income 217.01 219.07 199.26 235.96 50.05 48.72 35.97 93.98
Real Net Worth 2017 2,383.32 2,389.18 2,319.54 2,449.41 1,654.85 1,646.83 1,589.98 1,861.34
AGI 3 Year Moving Average 113.20 114.51 103.50 124.19 21.55 21.03 13.33 41.04
Probability of Exceeding AGI Limit (%) 1 1 1 1 1 1 1 1
$1,000s $1,000s
FAPRI Baseline Price Scenario Declining Price ScenarioSenate House Senate House
FAPRI Baseline Price Scenario Declining Price ScenarioSenate House Senate House
$1,000s $1,000s
$1,000s $1,000s
FAPRI Baseline Price Scenario Declining Price ScenarioSenate House Senate House
65

TNG2200
ARC Indiv. ARC County RLC PLC ARC Indiv. ARC County RLC PLC
Loan Deficiency Payments 0.00 0.00 0.00 0.00 0.02 0.02 0.02 0.02
ARC or RLC or PLC Payments 23.60 29.51 28.52 14.59 42.67 40.59 43.89 98.78
Government Payments 23.60 29.51 28.52 14.59 42.68 40.60 43.91 98.80
STAX Net Payments 0.00 0.00 0.00 0.00 0.00 0.00 0.00 0.00
SCO Net Payments 46.51 46.51 0.00 99.73 32.19 32.19 0.00 69.06
Net Cash Farm Income 392.84 398.79 350.52 437.66 37.68 35.31 4.25 136.22
Real Net Worth 2017 4,979.47 4,997.70 4,828.92 5,134.71 3,456.72 3,441.11 3,304.72 3,915.26
AGI 3 Year Moving Average 232.34 235.96 209.18 258.22 36.52 35.55 16.71 80.96
Probability of Exceeding AGI Limit (%) 1 1 1 1 1 1 1 1
SCG3500
ARC Indiv. ARC County RLC PLC ARC Indiv. ARC County RLC PLC
Loan Deficiency Payments 38.22 38.22 38.22 38.22 163.40 163.40 163.40 163.40
ARC or RLC or PLC Payments 19.19 23.98 35.50 36.82 59.29 58.87 75.01 177.31
Government Payments 57.41 62.20 73.72 75.04 222.69 222.27 238.41 340.72
STAX Net Payments 47.15 47.15 48.03 48.03 32.75 32.75 58.56 58.56
SCO Net Payments 35.17 35.17 0.00 82.18 24.42 24.42 0.00 56.96
Net Cash Farm Income 738.94 743.71 721.37 805.54 92.95 92.31 112.04 277.63
Real Net Worth 2017 12,437.14 12,452.10 12,435.42 12,717.34 9,895.91 9,891.19 10,051.13 10,736.05
AGI 3 Year Moving Average 670.09 671.70 675.92 726.98 302.81 301.04 322.27 409.88
Probability of Exceeding AGI Limit (%) 38 39 12 16 10 10 1 1
TXNP3000
ARC Indiv. ARC County RLC PLC ARC Indiv. ARC County RLC PLC
Loan Deficiency Payments 16.59 16.59 16.59 16.59 71.02 71.02 71.02 71.02
ARC or RLC or PLC Payments 20.88 23.74 22.60 14.21 35.04 41.27 46.62 73.44
Government Payments 37.46 40.33 39.19 30.80 106.06 112.29 117.63 144.46
STAX Net Payments 20.77 20.77 21.26 21.26 14.48 14.48 29.76 29.76
SCO Net Payments 14.91 14.91 0.00 51.26 10.31 10.31 0.00 35.39
Net Cash Farm Income 360.94 363.95 347.88 392.43 ‐73.08 ‐66.01 ‐54.96 12.72
Real Net Worth 2017 3,126.37 3,137.87 3,082.28 3,237.73 1,291.59 1,325.42 1,381.86 1,694.16
AGI 3 Year Moving Average 317.11 318.96 310.65 335.64 73.84 78.23 80.33 112.99
Probability of Exceeding AGI Limit (%) 1 1 1 1 1 1 1 1
FAPRI Baseline Price Scenario Declining Price ScenarioSenate House Senate House
$1,000s $1,000s
FAPRI Baseline Price Scenario Declining Price ScenarioSenate House Senate House
$1,000s $1,000s
FAPRI Baseline Price Scenario Declining Price ScenarioSenate House Senate House
$1,000s $1,000s
66

TXNP8000
ARC Indiv. ARC County RLC PLC ARC Indiv. ARC County RLC PLC
Loan Deficiency Payments 50.14 50.14 50.14 50.14 212.71 212.71 212.71 212.71
ARC or RLC or PLC Payments 12.23 13.02 31.62 26.87 53.25 53.03 118.12 156.55
Government Payments 62.37 63.16 81.76 77.01 265.96 265.74 330.83 369.26
STAX Net Payments 81.06 81.06 82.77 82.77 56.52 56.52 105.73 105.73
SCO Net Payments 28.87 28.87 0.00 157.37 20.11 20.11 0.00 110.00
Net Cash Farm Income 950.98 951.76 943.29 1,101.42 ‐249.33 ‐249.70 ‐147.08 13.18
Real Net Worth 2017 9,691.56 9,693.67 9,674.83 10,230.29 4,558.96 4,556.53 5,064.38 5,770.12
AGI 3 Year Moving Average 908.35 908.40 902.15 997.94 224.73 223.99 268.99 355.54
Probability of Exceeding AGI Limit (%) 65 65 48 57 27 27 17 18
TXHG2500
ARC Indiv. ARC County RLC PLC ARC Indiv. ARC County RLC PLC
Loan Deficiency Payments 5.31 5.31 5.31 5.31 22.74 22.74 22.74 22.74
ARC or RLC or PLC Payments 23.19 20.04 21.79 106.75 27.69 19.61 22.84 143.89
Government Payments 28.50 25.35 27.10 112.06 50.43 42.35 45.58 166.63
STAX Net Payments 10.74 10.74 10.88 10.88 7.45 7.45 12.07 12.07
SCO Net Payments 55.97 55.97 0.00 101.32 38.51 38.51 0.00 69.82
Net Cash Farm Income 102.45 98.65 38.73 243.97 ‐154.44 ‐163.95 ‐199.21 18.00
Real Net Worth 2017 1,584.43 1,565.34 1,310.59 2,133.10 311.24 264.47 92.59 1,144.07
AGI 3 Year Moving Average 11.08 8.32 ‐21.98 90.05 ‐125.81 ‐131.89 ‐151.97 ‐35.63
Probability of Exceeding AGI Limit (%) 1 1 1 1 1 1 1 1
TXPG2500
ARC Indiv. ARC County RLC PLC ARC Indiv. ARC County RLC PLC
Loan Deficiency Payments 9.57 9.57 9.57 9.57 41.06 41.06 41.06 41.06
ARC or RLC or PLC Payments 27.52 29.59 28.32 32.15 37.32 37.22 38.07 106.97
Government Payments 37.10 39.16 37.90 41.72 78.38 78.28 79.13 148.03
STAX Net Payments 7.54 7.54 7.73 7.73 5.25 5.25 11.80 11.80
SCO Net Payments 24.37 24.37 0.00 64.73 17.07 17.07 0.00 45.32
Net Cash Farm Income 194.48 196.53 169.65 242.62 ‐208.62 ‐208.97 ‐220.60 ‐91.17
Real Net Worth 2017 3,970.88 3,978.53 3,871.58 4,159.93 2,047.12 2,045.05 1,990.12 2,616.98
AGI 3 Year Moving Average 116.82 117.33 102.07 146.63 ‐99.71 ‐100.44 ‐109.29 ‐44.36
Probability of Exceeding AGI Limit (%) 1 1 1 1 1 1 1 1
$1,000s $1,000s
FAPRI Baseline Price Scenario Declining Price ScenarioSenate House Senate House
FAPRI Baseline Price Scenario Declining Price ScenarioSenate House Senate House
$1,000s $1,000s
$1,000s $1,000s
FAPRI Baseline Price Scenario Declining Price ScenarioSenate House Senate House
67

TXPG3760
ARC Indiv. ARC County RLC PLC ARC Indiv. ARC County RLC PLC
Loan Deficiency Payments 27.88 27.88 27.88 27.88 119.40 119.40 119.40 119.40
ARC or RLC or PLC Payments 47.85 40.33 50.08 33.70 75.46 71.72 98.89 168.20
Government Payments 75.72 68.21 77.96 61.57 194.85 191.12 218.28 287.60
STAX Net Payments 25.28 25.28 25.82 25.82 17.52 17.52 36.38 36.38
SCO Net Payments 31.69 31.69 0.00 108.66 22.30 22.30 0.00 76.41
Net Cash Farm Income ‐97.59 ‐106.72 ‐132.40 ‐22.63 ‐952.30 ‐957.02 ‐931.04 ‐753.35
Real Net Worth 2017 3,545.25 3,504.68 3,398.99 3,857.89 ‐674.46 ‐697.50 ‐569.07 297.21
AGI 3 Year Moving Average ‐16.67 ‐21.97 ‐37.56 27.29 ‐467.66 ‐470.41 ‐463.74 ‐374.63
Probability of Exceeding AGI Limit (%) 1 1 1 1 1 1 1 1
TXWG1600
ARC Indiv. ARC County RLC PLC ARC Indiv. ARC County RLC PLC
Loan Deficiency Payments 6.69 6.69 6.69 6.69 28.62 28.62 28.62 28.62
ARC or RLC or PLC Payments 11.14 11.93 11.24 32.28 14.71 14.73 15.14 57.83
Government Payments 17.83 18.62 17.93 38.96 43.33 43.34 43.76 86.45
STAX Net Payments 15.15 15.15 15.39 15.39 10.53 10.53 16.82 16.82
SCO Net Payments 8.31 8.31 0.00 19.73 5.78 5.78 0.00 13.73
Net Cash Farm Income 113.86 114.76 105.45 148.77 ‐47.67 ‐47.55 ‐46.82 16.54
Real Net Worth 2017 1,404.97 1,407.25 1,373.99 1,532.37 664.57 664.00 670.48 962.30
AGI 3 Year Moving Average 103.28 104.25 98.88 123.88 14.48 15.03 13.54 45.87
Probability of Exceeding AGI Limit (%) 1 1 1 1 1 1 1 1
TXUG1200
ARC Indiv. ARC County RLC PLC ARC Indiv. ARC County RLC PLC
Loan Deficiency Payments 18.04 18.04 18.04 18.04 77.16 77.16 77.16 77.16
ARC or RLC or PLC Payments 15.93 15.51 15.38 33.49 20.12 19.88 21.71 56.32
Government Payments 33.96 33.55 33.41 51.53 97.28 97.04 98.88 133.48
STAX Net Payments 20.44 20.44 20.91 20.91 14.28 14.28 27.38 27.38
SCO Net Payments 7.24 7.24 0.00 19.76 5.03 5.03 0.00 13.74
Net Cash Farm Income 101.19 100.74 93.61 133.10 ‐110.96 ‐111.24 ‐100.66 ‐46.60
Real Net Worth 2017 270.86 269.05 243.09 388.41 ‐679.86 ‐681.31 ‐628.91 ‐373.83
AGI 3 Year Moving Average 124.31 124.06 120.27 143.24 6.10 5.91 8.76 36.53
Probability of Exceeding AGI Limit (%) 1 1 1 1 1 1 1 1
FAPRI Baseline Price Scenario Declining Price ScenarioSenate House Senate House
$1,000s $1,000s
FAPRI Baseline Price Scenario Declining Price ScenarioSenate House Senate House
$1,000s $1,000s
FAPRI Baseline Price Scenario Declining Price ScenarioSenate House Senate House
$1,000s $1,000s
68

LAG2640
ARC Indiv. ARC County RLC PLC ARC Indiv. ARC County RLC PLC
Loan Deficiency Payments 9.79 9.79 9.79 9.79 42.25 42.25 42.25 42.25
ARC or RLC or PLC Payments 36.25 32.66 29.10 17.04 59.01 61.69 62.35 113.19
Government Payments 46.04 42.45 38.89 26.83 101.26 103.94 104.60 155.44
STAX Net Payments 13.13 13.13 13.43 13.43 9.18 9.18 17.02 17.02
SCO Net Payments 21.31 21.31 0.00 67.86 14.93 14.93 0.00 47.57
Net Cash Farm Income 345.42 341.54 315.61 374.10 ‐232.91 ‐229.86 ‐238.59 ‐126.77
Real Net Worth 2017 1,952.04 1,933.96 1,844.88 2,041.42 ‐598.14 ‐585.11 ‐619.02 ‐95.60
AGI 3 Year Moving Average 225.83 223.60 207.42 243.76 ‐86.34 ‐84.68 ‐94.75 ‐41.45
Probability of Exceeding AGI Limit (%) 2 2 1 1 1 1 1 1
LANG2500
ARC Indiv. ARC County RLC PLC ARC Indiv. ARC County RLC PLC
Loan Deficiency Payments 10.64 10.64 10.64 10.64 45.81 45.81 45.81 45.81
ARC or RLC or PLC Payments 35.13 35.12 30.76 47.34 74.61 72.12 73.96 183.66
Government Payments 45.77 45.76 41.40 57.98 120.42 117.93 119.77 229.46
STAX Net Payments 12.23 12.23 12.49 12.49 8.50 8.50 15.94 15.94
SCO Net Payments 23.67 23.67 0.00 70.03 16.56 16.56 0.00 48.90
Net Cash Farm Income 569.65 569.64 541.44 629.24 72.96 70.32 62.59 226.87
Real Net Worth 2017 7,904.79 7,904.46 7,812.22 8,102.71 5,937.22 5,923.80 5,900.55 6,610.05
AGI 3 Year Moving Average 468.75 468.67 450.54 505.17 187.07 185.90 176.50 265.03
Probability of Exceeding AGI Limit (%) 3 3 1 1 1 1 1 1
WAW1725
ARC Indiv. ARC County RLC PLC ARC Indiv. ARC County RLC PLC
Loan Deficiency Payments 0.00 0.00 0.00 0.00 0.35 0.35 0.35 0.35
ARC or RLC or PLC Payments 10.14 10.78 11.44 20.07 12.48 13.00 19.91 58.39
Government Payments 10.14 10.78 11.44 20.07 12.83 13.34 20.25 58.74
STAX Net Payments 0.00 0.00 0.00 0.00 0.00 0.00 0.00 0.00
SCO Net Payments 3.09 3.09 0.00 14.37 2.12 2.12 0.00 10.00
Net Cash Farm Income 263.12 263.76 261.33 284.33 106.51 107.01 111.84 160.42
Real Net Worth 2017 2,626.46 2,628.52 2,620.58 2,699.31 2,042.68 2,043.74 2,064.03 2,239.70
AGI 3 Year Moving Average 244.54 244.75 244.10 258.36 156.53 156.75 158.90 185.20
Probability of Exceeding AGI Limit (%) 1 1 1 1 1 1 1 1
$1,000s $1,000s
FAPRI Baseline Price Scenario Declining Price ScenarioSenate House Senate House
FAPRI Baseline Price Scenario Declining Price ScenarioSenate House Senate House
$1,000s $1,000s
$1,000s $1,000s
FAPRI Baseline Price Scenario Declining Price ScenarioSenate House Senate House
69

WAW5500
ARC Indiv. ARC County RLC PLC ARC Indiv. ARC County RLC PLC
Loan Deficiency Payments 0.00 0.00 0.00 0.00 0.97 0.97 0.97 0.97
ARC or RLC or PLC Payments 24.98 26.27 30.56 57.28 31.71 31.54 46.46 164.56
Government Payments 24.98 26.27 30.57 57.28 32.68 32.51 47.43 165.53
STAX Net Payments 0.00 0.00 0.00 0.00 0.00 0.00 0.00 0.00
SCO Net Payments 7.15 7.15 0.00 37.18 4.88 4.88 0.00 25.87
Net Cash Farm Income 451.27 452.53 449.75 514.10 ‐20.17 ‐20.51 ‐9.73 138.67
Real Net Worth 2017 8,852.27 8,855.55 8,850.38 9,090.32 6,757.30 6,753.88 6,807.23 7,479.57
AGI 3 Year Moving Average 432.99 433.18 433.64 473.48 168.92 167.98 173.98 252.42
Probability of Exceeding AGI Limit (%) 6 6 1 2 1 1 1 1
WAAW3500
ARC Indiv. ARC County RLC PLC ARC Indiv. ARC County RLC PLC
Loan Deficiency Payments 0.00 0.00 0.00 0.00 0.00 0.00 0.00 0.00
ARC or RLC or PLC Payments 5.45 8.06 8.32 18.12 6.75 9.05 14.76 52.16
Government Payments 5.45 8.06 8.32 18.12 6.75 9.05 14.76 52.16
STAX Net Payments 0.00 0.00 0.00 0.00 0.00 0.00 0.00 0.00
SCO Net Payments 2.96 2.96 0.00 9.88 2.02 2.02 0.00 6.82
Net Cash Farm Income 82.69 85.57 82.91 105.87 ‐13.44 ‐10.82 ‐6.36 46.51
Real Net Worth 2017 1,544.44 1,554.54 1,547.16 1,630.68 1,136.07 1,147.56 1,171.10 1,400.28
AGI 3 Year Moving Average 62.22 63.53 62.63 75.93 12.87 14.03 15.66 42.93
Probability of Exceeding AGI Limit (%) 1 1 1 1 1 1 1 1
KSCW2000
ARC Indiv. ARC County RLC PLC ARC Indiv. ARC County RLC PLC
Loan Deficiency Payments 0.00 0.00 0.00 0.00 0.00 0.00 0.00 0.00
ARC or RLC or PLC Payments 13.23 14.55 14.73 27.82 20.92 18.62 21.20 72.81
Government Payments 13.23 14.55 14.73 27.82 20.92 18.62 21.20 72.82
STAX Net Payments 0.00 0.00 0.00 0.00 0.00 0.00 0.00 0.00
SCO Net Payments 15.57 15.57 0.00 39.01 10.59 10.59 0.00 26.44
Net Cash Farm Income 157.05 158.33 142.10 197.44 ‐4.66 ‐7.45 ‐16.51 70.51
Real Net Worth 2017 2,134.05 2,137.17 2,079.46 2,278.57 1,426.21 1,412.16 1,370.94 1,774.53
AGI 3 Year Moving Average 125.41 125.50 117.75 146.72 38.89 36.97 32.04 74.78
Probability of Exceeding AGI Limit (%) 1 1 1 1 1 1 1 1
FAPRI Baseline Price Scenario Declining Price ScenarioSenate House Senate House
$1,000s $1,000s
FAPRI Baseline Price Scenario Declining Price ScenarioSenate House Senate House
$1,000s $1,000s
FAPRI Baseline Price Scenario Declining Price ScenarioSenate House Senate House
$1,000s $1,000s
70
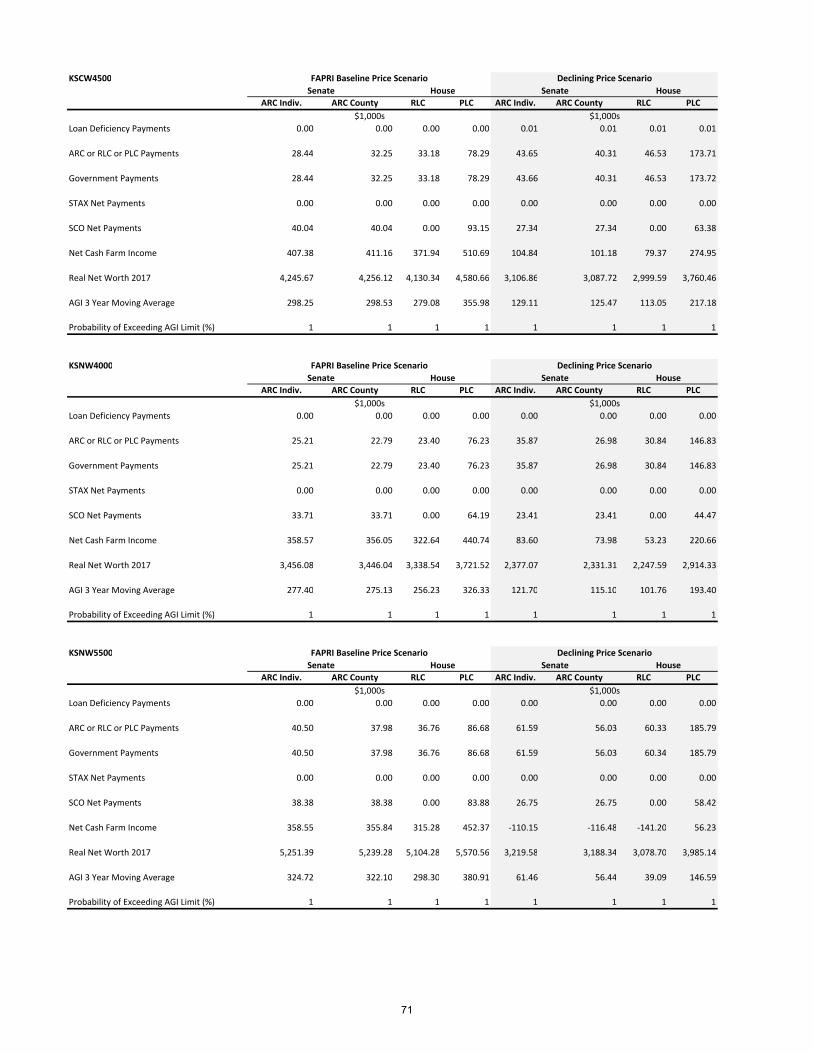
KSCW4500
ARC Indiv. ARC County RLC PLC ARC Indiv. ARC County RLC PLC
Loan Deficiency Payments 0.00 0.00 0.00 0.00 0.01 0.01 0.01 0.01
ARC or RLC or PLC Payments 28.44 32.25 33.18 78.29 43.65 40.31 46.53 173.71
Government Payments 28.44 32.25 33.18 78.29 43.66 40.31 46.53 173.72
STAX Net Payments 0.00 0.00 0.00 0.00 0.00 0.00 0.00 0.00
SCO Net Payments 40.04 40.04 0.00 93.15 27.34 27.34 0.00 63.38
Net Cash Farm Income 407.38 411.16 371.94 510.69 104.84 101.18 79.37 274.95
Real Net Worth 2017 4,245.67 4,256.12 4,130.34 4,580.66 3,106.86 3,087.72 2,999.59 3,760.46
AGI 3 Year Moving Average 298.25 298.53 279.08 355.98 129.11 125.47 113.05 217.18
Probability of Exceeding AGI Limit (%) 1 1 1 1 1 1 1 1
KSNW4000
ARC Indiv. ARC County RLC PLC ARC Indiv. ARC County RLC PLC
Loan Deficiency Payments 0.00 0.00 0.00 0.00 0.00 0.00 0.00 0.00
ARC or RLC or PLC Payments 25.21 22.79 23.40 76.23 35.87 26.98 30.84 146.83
Government Payments 25.21 22.79 23.40 76.23 35.87 26.98 30.84 146.83
STAX Net Payments 0.00 0.00 0.00 0.00 0.00 0.00 0.00 0.00
SCO Net Payments 33.71 33.71 0.00 64.19 23.41 23.41 0.00 44.47
Net Cash Farm Income 358.57 356.05 322.64 440.74 83.60 73.98 53.23 220.66
Real Net Worth 2017 3,456.08 3,446.04 3,338.54 3,721.52 2,377.07 2,331.31 2,247.59 2,914.33
AGI 3 Year Moving Average 277.40 275.13 256.23 326.33 121.70 115.10 101.76 193.40
Probability of Exceeding AGI Limit (%) 1 1 1 1 1 1 1 1
KSNW5500
ARC Indiv. ARC County RLC PLC ARC Indiv. ARC County RLC PLC
Loan Deficiency Payments 0.00 0.00 0.00 0.00 0.00 0.00 0.00 0.00
ARC or RLC or PLC Payments 40.50 37.98 36.76 86.68 61.59 56.03 60.33 185.79
Government Payments 40.50 37.98 36.76 86.68 61.59 56.03 60.34 185.79
STAX Net Payments 0.00 0.00 0.00 0.00 0.00 0.00 0.00 0.00
SCO Net Payments 38.38 38.38 0.00 83.88 26.75 26.75 0.00 58.42
Net Cash Farm Income 358.55 355.84 315.28 452.37 ‐110.15 ‐116.48 ‐141.20 56.23
Real Net Worth 2017 5,251.39 5,239.28 5,104.28 5,570.56 3,219.58 3,188.34 3,078.70 3,985.14
AGI 3 Year Moving Average 324.72 322.10 298.30 380.91 61.46 56.44 39.09 146.59
Probability of Exceeding AGI Limit (%) 1 1 1 1 1 1 1 1
$1,000s $1,000s
FAPRI Baseline Price Scenario Declining Price ScenarioSenate House Senate House
FAPRI Baseline Price Scenario Declining Price ScenarioSenate House Senate House
$1,000s $1,000s
$1,000s $1,000s
FAPRI Baseline Price Scenario Declining Price ScenarioSenate House Senate House
71

COW3000
ARC Indiv. ARC County RLC PLC ARC Indiv. ARC County RLC PLC
Loan Deficiency Payments 0.00 0.00 0.00 0.00 0.00 0.00 0.00 0.00
ARC or RLC or PLC Payments 6.45 8.59 8.43 11.47 11.18 10.72 12.78 51.40
Government Payments 6.45 8.59 8.43 11.47 11.18 10.72 12.78 51.40
STAX Net Payments 0.00 0.00 0.00 0.00 0.00 0.00 0.00 0.00
SCO Net Payments 11.15 11.15 0.00 24.74 7.75 7.75 0.00 17.20
Net Cash Farm Income 190.79 192.93 181.45 209.86 79.29 78.74 72.53 132.33
Real Net Worth 2017 2,509.46 2,516.27 2,478.86 2,571.99 2,111.44 2,108.91 2,087.01 2,297.00
AGI 3 Year Moving Average 161.39 162.36 155.97 173.08 99.78 99.31 95.22 125.96
Probability of Exceeding AGI Limit (%) 1 1 1 1 1 1 1 1
COW5640
ARC Indiv. ARC County RLC PLC ARC Indiv. ARC County RLC PLC
Loan Deficiency Payments 0.00 0.00 0.00 0.00 0.00 0.00 0.00 0.00
ARC or RLC or PLC Payments 14.20 14.19 14.09 19.70 23.83 18.35 21.89 84.65
Government Payments 14.20 14.19 14.09 19.70 23.83 18.35 21.89 84.65
STAX Net Payments 0.00 0.00 0.00 0.00 0.00 0.00 0.00 0.00
SCO Net Payments 19.55 19.55 0.00 45.90 13.57 13.57 0.00 31.88
Net Cash Farm Income 237.36 237.08 216.62 270.86 29.66 23.18 11.89 116.24
Real Net Worth 2017 3,579.69 3,575.46 3,506.80 3,697.82 2,722.58 2,690.87 2,642.73 3,115.09
AGI 3 Year Moving Average 186.11 185.07 173.87 205.64 73.59 69.04 61.79 115.31
Probability of Exceeding AGI Limit (%) 1 1 1 1 1 1 1 1
MTW4500
ARC Indiv. ARC County RLC PLC ARC Indiv. ARC County RLC PLC
Loan Deficiency Payments 0.00 0.00 0.00 0.00 0.00 0.00 0.00 0.00
ARC or RLC or PLC Payments 9.16 15.39 16.49 29.32 18.44 22.01 31.01 109.48
Government Payments 9.16 15.39 16.49 29.32 18.44 22.01 31.01 109.48
STAX Net Payments 0.00 0.00 0.00 0.00 0.00 0.00 0.00 0.00
SCO Net Payments 14.46 14.46 0.00 25.35 9.97 9.97 0.00 17.41
Net Cash Farm Income 155.28 161.70 147.81 189.33 ‐13.86 ‐9.95 ‐11.26 99.05
Real Net Worth 2017 3,338.99 3,359.26 3,313.47 3,466.10 2,616.52 2,632.08 2,631.63 3,115.43
AGI 3 Year Moving Average 149.28 152.50 145.36 170.64 58.87 60.62 58.10 114.74
Probability of Exceeding AGI Limit (%) 1 1 1 1 1 1 1 1
FAPRI Baseline Price Scenario Declining Price ScenarioSenate House Senate House
$1,000s $1,000s
FAPRI Baseline Price Scenario Declining Price ScenarioSenate House Senate House
$1,000s $1,000s
FAPRI Baseline Price Scenario Declining Price ScenarioSenate House Senate House
$1,000s $1,000s
72

ORW3600
ARC Indiv. ARC County RLC PLC ARC Indiv. ARC County RLC PLC
Loan Deficiency Payments 0.00 0.00 0.00 0.00 0.00 0.00 0.00 0.00
ARC or RLC or PLC Payments 5.94 7.82 8.01 11.41 4.51 6.21 7.88 29.34
Government Payments 5.94 7.82 8.01 11.41 4.51 6.21 7.88 29.34
STAX Net Payments 0.00 0.00 0.00 0.00 0.00 0.00 0.00 0.00
SCO Net Payments 12.15 12.15 0.00 21.94 8.47 8.47 0.00 15.24
Net Cash Farm Income 254.77 256.65 244.69 270.05 146.19 147.87 141.04 177.92
Real Net Worth 2017 2,084.20 2,089.80 2,052.76 2,131.82 1,724.21 1,728.14 1,706.78 1,824.36
AGI 3 Year Moving Average 209.68 210.84 203.98 219.42 148.54 149.48 144.88 166.46
Probability of Exceeding AGI Limit (%) 1 1 1 1 1 1 1 1
CAC4000
ARC Indiv. ARC County RLC PLC ARC Indiv. ARC County RLC PLC
Loan Deficiency Payments 83.03 83.03 83.03 83.03 356.47 356.47 356.47 356.47
ARC or RLC or PLC Payments 0.27 0.90 1.99 0.42 1.70 2.13 4.10 4.81
Government Payments 83.30 83.94 85.02 83.45 358.18 358.60 360.57 361.28
STAX Net Payments 62.42 62.42 66.53 66.53 43.52 43.52 130.18 130.18
SCO Net Payments 58.48 58.48 0.00 99.21 40.66 40.66 0.00 69.04
Net Cash Farm Income 1,777.78 1,778.43 1,723.59 1,824.13 1,245.51 1,245.95 1,294.80 1,367.89
Real Net Worth 2017 26,370.93 26,372.88 26,198.21 26,517.91 24,551.83 24,553.17 24,707.65 24,946.58
AGI 3 Year Moving Average 1,834.54 1,834.72 1,803.76 1,861.77 1,522.23 1,522.27 1,535.20 1,578.99
Probability of Exceeding AGI Limit (%) 96 96 91 92 87 87 80 83
TXSP2500
ARC Indiv. ARC County RLC PLC ARC Indiv. ARC County RLC PLC
Loan Deficiency Payments 37.87 37.87 37.87 37.87 163.50 163.50 163.50 163.50
ARC or RLC or PLC Payments 0.00 0.00 0.00 0.00 0.00 0.00 0.00 0.00
Government Payments 37.87 37.87 37.87 37.87 163.50 163.50 163.50 163.50
STAX Net Payments 75.91 75.91 76.77 76.77 52.58 52.58 80.07 80.07
SCO Net Payments 0.00 0.00 0.00 0.00 0.00 0.00 0.00 0.00
Net Cash Farm Income 273.16 273.16 274.12 274.12 60.30 60.30 89.85 89.85
Real Net Worth 2017 1,881.84 1,881.84 1,885.75 1,885.75 1,017.53 1,017.53 1,136.41 1,136.41
AGI 3 Year Moving Average 184.24 184.24 184.95 184.95 61.91 61.91 73.15 73.15
Probability of Exceeding AGI Limit (%) 1 1 1 1 1 1 1 1
$1,000s $1,000s
FAPRI Baseline Price Scenario Declining Price ScenarioSenate House Senate House
FAPRI Baseline Price Scenario Declining Price ScenarioSenate House Senate House
$1,000s $1,000s
$1,000s $1,000s
FAPRI Baseline Price Scenario Declining Price ScenarioSenate House Senate House
73
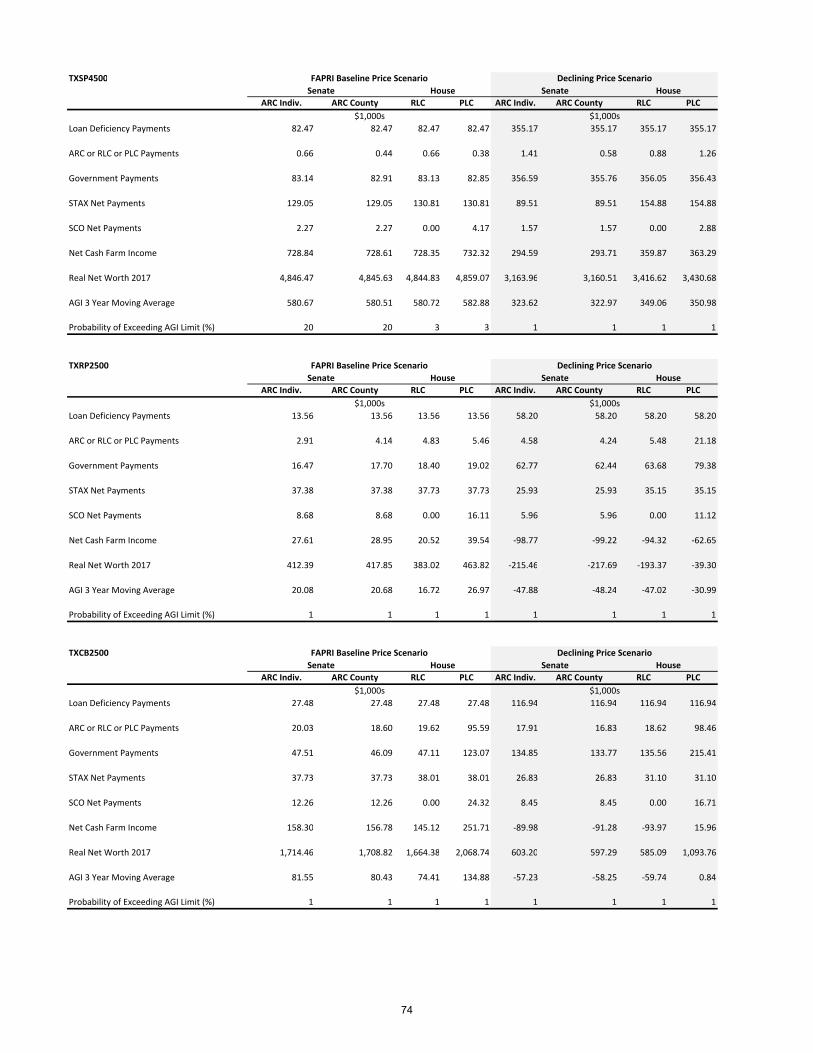
TXSP4500
ARC Indiv. ARC County RLC PLC ARC Indiv. ARC County RLC PLC
Loan Deficiency Payments 82.47 82.47 82.47 82.47 355.17 355.17 355.17 355.17
ARC or RLC or PLC Payments 0.66 0.44 0.66 0.38 1.41 0.58 0.88 1.26
Government Payments 83.14 82.91 83.13 82.85 356.59 355.76 356.05 356.43
STAX Net Payments 129.05 129.05 130.81 130.81 89.51 89.51 154.88 154.88
SCO Net Payments 2.27 2.27 0.00 4.17 1.57 1.57 0.00 2.88
Net Cash Farm Income 728.84 728.61 728.35 732.32 294.59 293.71 359.87 363.29
Real Net Worth 2017 4,846.47 4,845.63 4,844.83 4,859.07 3,163.96 3,160.51 3,416.62 3,430.68
AGI 3 Year Moving Average 580.67 580.51 580.72 582.88 323.62 322.97 349.06 350.98
Probability of Exceeding AGI Limit (%) 20 20 3 3 1 1 1 1
TXRP2500
ARC Indiv. ARC County RLC PLC ARC Indiv. ARC County RLC PLC
Loan Deficiency Payments 13.56 13.56 13.56 13.56 58.20 58.20 58.20 58.20
ARC or RLC or PLC Payments 2.91 4.14 4.83 5.46 4.58 4.24 5.48 21.18
Government Payments 16.47 17.70 18.40 19.02 62.77 62.44 63.68 79.38
STAX Net Payments 37.38 37.38 37.73 37.73 25.93 25.93 35.15 35.15
SCO Net Payments 8.68 8.68 0.00 16.11 5.96 5.96 0.00 11.12
Net Cash Farm Income 27.61 28.95 20.52 39.54 ‐98.77 ‐99.22 ‐94.32 ‐62.65
Real Net Worth 2017 412.39 417.85 383.02 463.82 ‐215.46 ‐217.69 ‐193.37 ‐39.30
AGI 3 Year Moving Average 20.08 20.68 16.72 26.97 ‐47.88 ‐48.24 ‐47.02 ‐30.99
Probability of Exceeding AGI Limit (%) 1 1 1 1 1 1 1 1
TXCB2500
ARC Indiv. ARC County RLC PLC ARC Indiv. ARC County RLC PLC
Loan Deficiency Payments 27.48 27.48 27.48 27.48 116.94 116.94 116.94 116.94
ARC or RLC or PLC Payments 20.03 18.60 19.62 95.59 17.91 16.83 18.62 98.46
Government Payments 47.51 46.09 47.11 123.07 134.85 133.77 135.56 215.41
STAX Net Payments 37.73 37.73 38.01 38.01 26.83 26.83 31.10 31.10
SCO Net Payments 12.26 12.26 0.00 24.32 8.45 8.45 0.00 16.71
Net Cash Farm Income 158.30 156.78 145.12 251.71 ‐89.98 ‐91.28 ‐93.97 15.96
Real Net Worth 2017 1,714.46 1,708.82 1,664.38 2,068.74 603.20 597.29 585.09 1,093.76
AGI 3 Year Moving Average 81.55 80.43 74.41 134.88 ‐57.23 ‐58.25 ‐59.74 0.84
Probability of Exceeding AGI Limit (%) 1 1 1 1 1 1 1 1
FAPRI Baseline Price Scenario Declining Price ScenarioSenate House Senate House
$1,000s $1,000s
FAPRI Baseline Price Scenario Declining Price ScenarioSenate House Senate House
$1,000s $1,000s
FAPRI Baseline Price Scenario Declining Price ScenarioSenate House Senate House
$1,000s $1,000s
74

TXCB8000
ARC Indiv. ARC County RLC PLC ARC Indiv. ARC County RLC PLC
Loan Deficiency Payments 92.55 92.55 92.55 92.55 394.09 394.09 394.09 394.09
ARC or RLC or PLC Payments 57.16 54.79 69.63 193.00 65.56 61.56 72.62 241.60
Government Payments 149.72 147.34 162.18 285.55 459.65 455.65 466.70 635.69
STAX Net Payments 123.52 123.52 124.75 124.75 85.70 85.70 121.25 121.25
SCO Net Payments 35.86 35.86 0.00 66.78 24.67 24.67 0.00 45.64
Net Cash Farm Income 794.70 792.28 774.50 967.82 ‐41.67 ‐45.95 ‐17.31 209.05
Real Net Worth 2017 4,954.41 4,946.06 5,068.49 5,769.96 1,413.99 1,395.12 1,715.56 2,705.89
AGI 3 Year Moving Average 545.23 543.18 575.00 687.81 64.09 60.83 110.50 237.80
Probability of Exceeding AGI Limit (%) 29 29 16 23 7 7 3 3
TXVC4500
ARC Indiv. ARC County RLC PLC ARC Indiv. ARC County RLC PLC
Loan Deficiency Payments 32.94 32.94 32.94 32.94 141.34 141.34 141.34 141.34
ARC or RLC or PLC Payments 40.89 37.62 44.46 164.69 39.33 33.12 37.17 180.20
Government Payments 73.83 70.56 77.40 197.63 180.67 174.46 178.51 321.54
STAX Net Payments 64.02 64.02 65.18 65.18 44.33 44.33 68.79 68.79
SCO Net Payments 35.01 35.01 0.00 69.07 24.41 24.41 0.00 48.16
Net Cash Farm Income 692.21 688.91 661.78 852.01 203.40 196.86 200.89 398.66
Real Net Worth 2017 6,029.22 6,017.83 5,926.58 6,571.39 4,188.52 4,160.56 4,187.96 4,918.55
AGI 3 Year Moving Average 551.11 548.27 531.24 651.07 270.10 265.73 261.45 379.59
Probability of Exceeding AGI Limit (%) 13 13 2 9 1 1 1 1
TXMC1800
ARC Indiv. ARC County RLC PLC ARC Indiv. ARC County RLC PLC
Loan Deficiency Payments 23.42 23.42 23.42 23.42 100.61 100.61 100.61 100.61
ARC or RLC or PLC Payments 13.88 11.01 10.53 30.38 16.69 14.62 15.40 53.89
Government Payments 37.30 34.43 33.95 53.80 117.30 115.22 116.00 154.49
STAX Net Payments 25.74 25.74 26.40 26.40 18.05 18.05 38.58 38.58
SCO Net Payments 12.46 12.46 0.00 29.51 8.63 8.63 0.00 20.46
Net Cash Farm Income 163.51 160.40 146.58 202.03 ‐76.83 ‐79.16 ‐65.32 3.83
Real Net Worth 2017 941.19 928.35 871.24 1,090.93 ‐152.08 ‐163.63 ‐96.95 229.79
AGI 3 Year Moving Average 74.23 73.07 65.96 96.21 ‐56.49 ‐57.30 ‐53.23 ‐18.57
Probability of Exceeding AGI Limit (%) 1 1 1 1 1 1 1 1
$1,000s $1,000s
FAPRI Baseline Price Scenario Declining Price ScenarioSenate House Senate House
FAPRI Baseline Price Scenario Declining Price ScenarioSenate House Senate House
$1,000s $1,000s
$1,000s $1,000s
FAPRI Baseline Price Scenario Declining Price ScenarioSenate House Senate House
75

TXEC5000
ARC Indiv. ARC County RLC PLC ARC Indiv. ARC County RLC PLC
Loan Deficiency Payments 77.06 77.06 77.06 77.06 329.88 329.88 329.88 329.88
ARC or RLC or PLC Payments 7.23 8.90 9.28 33.04 6.41 7.83 8.63 36.19
Government Payments 84.29 85.96 86.34 110.11 336.29 337.71 338.51 366.07
STAX Net Payments 170.28 170.28 172.02 172.02 117.91 117.91 179.70 179.70
SCO Net Payments 7.40 7.40 0.00 13.96 5.18 5.18 0.00 9.76
Net Cash Farm Income 401.38 403.09 397.67 436.53 ‐49.12 ‐47.58 12.50 52.25
Real Net Worth 2017 3,138.07 3,144.58 3,126.64 3,267.74 1,174.02 1,181.33 1,468.39 1,646.06
AGI 3 Year Moving Average 337.17 337.93 334.77 358.05 75.59 76.37 95.75 118.94
Probability of Exceeding AGI Limit (%) 1 1 1 1 1 1 1 1
GAC2300
ARC Indiv. ARC County RLC PLC ARC Indiv. ARC County RLC PLC
Loan Deficiency Payments 60.49 60.49 60.49 60.49 290.01 290.01 290.01 290.01
ARC or RLC or PLC Payments 34.10 33.18 22.90 69.67 66.63 61.27 48.23 154.80
Government Payments 94.59 93.66 83.38 130.15 356.63 351.28 338.24 444.81
STAX Net Payments 55.54 55.54 57.22 57.22 38.66 38.66 92.25 92.25
SCO Net Payments 0.93 0.93 0.00 15.37 0.67 0.67 0.00 10.79
Net Cash Farm Income 485.99 484.96 474.79 540.24 ‐49.50 ‐55.55 ‐13.74 114.84
Real Net Worth 2017 8,842.68 8,838.63 8,804.25 9,024.35 6,526.70 6,497.73 6,703.45 7,293.59
AGI 3 Year Moving Average 405.78 404.52 396.94 437.49 94.57 90.65 100.30 173.30
Probability of Exceeding AGI Limit (%) 3 3 1 1 1 1 1 1
TNC2100
ARC Indiv. ARC County RLC PLC ARC Indiv. ARC County RLC PLC
Loan Deficiency Payments 21.56 21.56 21.56 21.56 92.75 92.75 92.75 92.75
ARC or RLC or PLC Payments 16.29 16.15 14.97 9.21 31.62 29.60 30.82 68.62
Government Payments 37.84 37.70 36.52 30.76 124.37 122.35 123.57 161.37
STAX Net Payments 19.24 19.24 19.75 19.75 13.43 13.43 30.92 30.92
SCO Net Payments 13.38 13.38 0.00 37.74 9.36 9.36 0.00 26.33
Net Cash Farm Income 543.26 543.13 529.08 561.07 221.10 219.07 228.46 292.68
Real Net Worth 2017 5,284.07 5,283.53 5,235.82 5,344.70 4,105.00 4,097.46 4,132.06 4,353.10
AGI 3 Year Moving Average 508.92 508.48 500.19 519.85 322.04 320.19 321.32 352.48
Probability of Exceeding AGI Limit (%) 2 2 1 1 1 1 1 1
FAPRI Baseline Price Scenario Declining Price ScenarioSenate House Senate House
$1,000s $1,000s
$1,000s $1,000s
FAPRI Baseline Price Scenario Declining Price ScenarioSenate House Senate House
FAPRI Baseline Price Scenario Declining Price ScenarioSenate House Senate House
$1,000s $1,000s
76

TNC4050
ARC Indiv. ARC County RLC PLC ARC Indiv. ARC County RLC PLC
Loan Deficiency Payments 68.65 68.65 68.65 68.65 295.31 295.31 295.31 295.31
ARC or RLC or PLC Payments 13.45 15.93 21.69 17.40 35.52 38.98 45.02 109.07
Government Payments 82.10 84.58 90.34 86.05 330.83 334.29 340.33 404.38
STAX Net Payments 77.15 77.15 79.25 79.25 53.70 53.70 114.93 114.93
SCO Net Payments 22.37 22.37 0.00 55.25 15.63 15.63 0.00 38.49
Net Cash Farm Income 666.08 668.57 653.99 705.58 93.98 97.50 150.34 255.83
Real Net Worth 2017 8,306.98 8,315.35 8,268.31 8,444.37 6,089.14 6,104.38 6,334.69 6,749.06
AGI 3 Year Moving Average 648.86 649.48 642.73 674.59 316.20 317.26 336.88 389.25
Probability of Exceeding AGI Limit (%) 34 35 5 8 9 9 1 1
ARNC5000
ARC Indiv. ARC County RLC PLC ARC Indiv. ARC County RLC PLC
Loan Deficiency Payments 171.02 171.02 171.02 171.02 734.96 734.96 734.96 734.96
ARC or RLC or PLC Payments 0.00 0.00 0.00 0.00 0.00 0.00 0.00 0.00
Government Payments 171.02 171.02 171.02 171.02 734.96 734.96 734.96 734.96
STAX Net Payments 250.28 250.28 256.69 256.69 174.39 174.39 364.11 364.11
SCO Net Payments 0.00 0.00 0.00 0.00 0.00 0.00 0.00 0.00
Net Cash Farm Income 974.04 974.04 980.81 980.81 130.99 130.99 332.49 332.49
Real Net Worth 2017 8,807.48 8,807.48 8,831.35 8,831.35 5,466.19 5,466.19 6,290.23 6,290.23
AGI 3 Year Moving Average 645.90 645.90 650.92 650.92 156.17 156.17 237.87 237.87
Probability of Exceeding AGI Limit (%) 39 39 21 21 9 9 2 2
ALC3000
ARC Indiv. ARC County RLC PLC ARC Indiv. ARC County RLC PLC
Loan Deficiency Payments 33.57 33.57 33.57 33.57 143.61 143.61 143.61 143.61
ARC or RLC or PLC Payments 29.33 32.91 26.36 13.25 45.35 45.57 40.00 87.33
Government Payments 62.90 66.48 59.93 46.82 188.96 189.18 183.60 230.94
STAX Net Payments 43.39 43.39 44.15 44.15 30.12 30.12 51.28 51.28
SCO Net Payments 39.60 39.60 0.00 86.94 27.60 27.60 0.00 60.54
Net Cash Farm Income 375.64 379.24 331.75 408.84 ‐90.06 ‐89.98 ‐104.37 13.95
Real Net Worth 2017 2,444.86 2,452.33 2,284.89 2,553.13 390.57 387.72 329.72 878.44
AGI 3 Year Moving Average 220.89 222.48 194.89 238.91 ‐38.48 ‐38.54 ‐53.29 4.96
Probability of Exceeding AGI Limit (%) 1 1 1 1 1 1 1 1
FAPRI Baseline Price Scenario Declining Price Scenario
FAPRI Baseline Price Scenario Declining Price Scenario
FAPRI Baseline Price Scenario Declining Price Scenario
Senate House Senate House
$1,000s $1,000s
Senate House Senate House
$1,000s $1,000s
Senate House Senate House
$1,000s $1,000s
77

SCC1800
ARC Indiv. ARC County RLC PLC ARC Indiv. ARC County RLC PLC
Loan Deficiency Payments 36.79 36.79 36.79 36.79 171.80 171.80 171.80 171.80
ARC or RLC or PLC Payments 17.12 15.50 9.22 33.65 24.10 21.82 16.76 76.14
Government Payments 53.90 52.28 46.01 70.44 195.91 193.63 188.56 247.94
STAX Net Payments 38.45 38.45 39.29 39.29 26.70 26.70 57.60 57.60
SCO Net Payments 0.41 0.41 0.00 6.34 0.23 0.23 0.00 4.31
Net Cash Farm Income 362.96 361.21 355.25 386.80 48.67 46.10 72.57 139.31
Real Net Worth 2017 4,544.68 4,535.31 4,515.27 4,624.51 3,283.80 3,268.42 3,388.09 3,669.59
AGI 3 Year Moving Average 300.54 298.85 295.45 314.82 114.71 112.59 120.47 156.71
Probability of Exceeding AGI Limit (%) 1 1 1 1 1 1 1 1
NCC1500
ARC Indiv. ARC County RLC PLC ARC Indiv. ARC County RLC PLC
Loan Deficiency Payments 8.82 8.82 8.82 8.82 37.87 37.87 37.87 37.87
ARC or RLC or PLC Payments 13.46 15.67 15.30 9.16 23.23 19.93 21.50 53.96
Government Payments 22.28 24.49 24.12 17.98 61.10 57.80 59.37 91.83
STAX Net Payments 9.78 9.78 10.05 10.05 6.78 6.78 14.33 14.33
SCO Net Payments 32.59 32.59 0.00 65.88 22.35 22.35 0.00 45.34
Net Cash Farm Income 348.04 350.23 317.26 377.53 140.32 136.89 123.32 202.71
Real Net Worth 2017 3,166.09 3,171.96 3,067.21 3,259.32 2,407.04 2,390.21 2,341.54 2,652.36
AGI 3 Year Moving Average 238.02 238.72 221.44 254.59 121.03 118.52 109.34 149.77
Probability of Exceeding AGI Limit (%) 1 1 1 1 1 1 1 1
CAR550
ARC Indiv. ARC County RLC PLC ARC Indiv. ARC County RLC PLC
Loan Deficiency Payments 0.00 0.00 0.00 0.00 0.00 0.00 0.00 0.00
ARC or RLC or PLC Payments 13.28 16.20 14.36 4.53 34.04 38.97 41.40 80.59
Government Payments 13.28 16.20 14.36 4.53 34.04 38.97 41.40 80.59
STAX Net Payments 0.00 0.00 0.00 0.00 0.00 0.00 0.00 0.00
SCO Net Payments 11.67 11.67 0.00 25.51 7.53 7.53 0.00 16.46
Net Cash Farm Income 273.61 276.64 262.95 278.63 16.99 22.69 17.19 78.14
Real Net Worth 2017 2,649.88 2,660.01 2,618.79 2,663.03 1,657.72 1,682.21 1,663.40 1,941.72
AGI 3 Year Moving Average 195.51 197.58 189.98 197.75 58.15 61.68 58.54 81.39
Probability of Exceeding AGI Limit (%) 1 1 1 1 1 1 1 1
FAPRI Baseline Price Scenario Declining Price ScenarioSenate House Senate House
$1,000s $1,000s
FAPRI Baseline Price Scenario Declining Price ScenarioSenate House Senate House
$1,000s $1,000s
FAPRI Baseline Price Scenario Declining Price ScenarioSenate House Senate House
$1,000s $1,000s
78

CAR3000
ARC Indiv. ARC County RLC PLC ARC Indiv. ARC County RLC PLC
Loan Deficiency Payments 0.00 0.00 0.00 0.00 0.00 0.00 0.00 0.00
ARC or RLC or PLC Payments 6.94 7.62 27.05 12.24 79.89 81.34 205.84 193.69
Government Payments 6.94 7.62 27.05 12.24 79.89 81.34 205.84 193.69
STAX Net Payments 0.00 0.00 0.00 0.00 0.00 0.00 0.00 0.00
SCO Net Payments 70.86 70.86 0.00 154.86 45.69 45.69 0.00 99.89
Net Cash Farm Income 1,417.72 1,418.42 1,366.99 1,507.45 ‐70.84 ‐69.39 12.10 100.55
Real Net Worth 2017 12,807.30 12,809.61 12,663.18 13,094.23 7,229.62 7,234.34 7,627.81 7,952.20
AGI 3 Year Moving Average 995.50 996.09 971.85 1,049.63 157.04 157.65 208.87 248.54
Probability of Exceeding AGI Limit (%) 73 73 56 58 8 8 1 3
CABR1300
ARC Indiv. ARC County RLC PLC ARC Indiv. ARC County RLC PLC
Loan Deficiency Payments 0.00 0.00 0.00 0.00 0.00 0.00 0.00 0.00
ARC or RLC or PLC Payments 6.84 6.98 26.63 7.95 73.68 75.25 113.62 154.63
Government Payments 6.84 6.98 26.63 7.95 73.68 75.25 113.62 154.63
STAX Net Payments 0.00 0.00 0.00 0.00 0.00 0.00 0.00 0.00
SCO Net Payments 27.45 27.45 0.00 59.30 17.67 17.67 0.00 38.23
Net Cash Farm Income 1,018.47 1,018.61 1,010.81 1,051.43 420.72 422.29 443.04 522.29
Real Net Worth 2017 9,190.20 9,190.67 9,174.14 9,296.52 7,186.68 7,192.92 7,274.38 7,528.99
AGI 3 Year Moving Average 840.19 840.33 840.26 859.98 503.52 503.32 522.10 549.22
Probability of Exceeding AGI Limit (%) 67 68 24 29 7 7 1 1
CACR800
ARC Indiv. ARC County RLC PLC ARC Indiv. ARC County RLC PLC
Loan Deficiency Payments 0.00 0.00 0.00 0.00 0.00 0.00 0.00 0.00
ARC or RLC or PLC Payments 21.43 26.28 23.95 7.20 56.63 67.28 71.10 122.04
Government Payments 21.43 26.28 23.95 7.20 56.63 67.28 71.10 122.04
STAX Net Payments 0.00 0.00 0.00 0.00 0.00 0.00 0.00 0.00
SCO Net Payments 19.13 19.13 0.00 43.56 12.28 12.28 0.00 28.02
Net Cash Farm Income 494.55 499.42 477.90 504.72 99.61 110.54 101.97 181.98
Real Net Worth 2017 5,372.41 5,387.62 5,321.61 5,403.15 4,022.81 4,064.33 4,039.90 4,330.52
AGI 3 Year Moving Average 439.37 442.43 430.41 443.69 219.79 226.45 221.33 251.85
Probability of Exceeding AGI Limit (%) 1 1 1 1 1 1 1 1
$1,000s $1,000s
FAPRI Baseline Price Scenario Declining Price ScenarioSenate House Senate House
FAPRI Baseline Price Scenario Declining Price ScenarioSenate House Senate House
$1,000s $1,000s
$1,000s $1,000s
FAPRI Baseline Price Scenario Declining Price ScenarioSenate House Senate House
79

TXR1350
ARC Indiv. ARC County RLC PLC ARC Indiv. ARC County RLC PLC
Loan Deficiency Payments 0.00 0.00 0.00 0.00 0.00 0.00 0.00 0.00
ARC or RLC or PLC Payments 8.58 8.13 7.50 34.58 26.48 29.47 32.10 111.37
Government Payments 8.58 8.13 7.50 34.58 26.48 29.47 32.10 111.37
STAX Net Payments 0.00 0.00 0.00 0.00 0.00 0.00 0.00 0.00
SCO Net Payments 6.59 6.59 0.00 14.20 4.59 4.59 0.00 9.89
Net Cash Farm Income ‐131.38 ‐131.96 ‐140.91 ‐89.11 ‐275.50 ‐271.90 ‐274.71 ‐165.46
Real Net Worth 2017 211.58 208.71 164.97 416.46 ‐535.05 ‐517.35 ‐531.15 5.50
AGI 3 Year Moving Average ‐131.38 ‐131.76 ‐136.61 ‐107.22 ‐205.83 ‐204.08 ‐206.39 ‐150.48
Probability of Exceeding AGI Limit (%) 1 1 1 1 1 1 1 1
TXR3000
ARC Indiv. ARC County RLC PLC ARC Indiv. ARC County RLC PLC
Loan Deficiency Payments 0.00 0.00 0.00 0.00 0.00 0.00 0.00 0.00
ARC or RLC or PLC Payments 20.94 18.90 17.44 78.74 64.61 68.53 74.64 225.00
Government Payments 20.94 18.90 17.44 78.74 64.61 68.53 74.64 225.00
STAX Net Payments 0.00 0.00 0.00 0.00 0.00 0.00 0.00 0.00
SCO Net Payments 16.09 16.09 0.00 34.64 11.20 11.20 0.00 24.13
Net Cash Farm Income ‐35.89 ‐38.32 ‐57.87 50.53 ‐364.46 ‐360.00 ‐366.59 ‐162.22
Real Net Worth 2017 237.63 225.60 143.70 620.26 ‐1,415.36 ‐1,393.68 ‐1,425.58 ‐432.93
AGI 3 Year Moving Average ‐7.07 ‐8.63 ‐19.67 44.34 ‐179.55 ‐177.52 ‐183.02 ‐72.30
Probability of Exceeding AGI Limit (%) 1 1 1 1 1 1 1 1
TXBR1800
ARC Indiv. ARC County RLC PLC ARC Indiv. ARC County RLC PLC
Loan Deficiency Payments 0.00 0.00 0.00 0.00 0.00 0.00 0.00 0.00
ARC or RLC or PLC Payments 13.14 12.18 11.19 71.57 47.86 43.79 47.69 213.88
Government Payments 13.14 12.18 11.19 71.57 47.86 43.79 47.69 213.88
STAX Net Payments 0.00 0.00 0.00 0.00 0.00 0.00 0.00 0.00
SCO Net Payments 12.31 12.31 0.00 27.46 8.58 8.58 0.00 19.14
Net Cash Farm Income ‐107.98 ‐109.16 ‐124.44 ‐20.60 ‐363.98 ‐368.90 ‐374.91 ‐156.87
Real Net Worth 2017 ‐777.64 ‐783.41 ‐846.12 ‐379.31 ‐2,092.78 ‐2,116.95 ‐2,146.34 ‐1,083.36
AGI 3 Year Moving Average ‐147.66 ‐148.41 ‐156.88 ‐96.00 ‐282.21 ‐285.14 ‐289.79 ‐173.17
Probability of Exceeding AGI Limit (%) 1 1 1 1 1 1 1 1
FAPRI Baseline Price Scenario Declining Price ScenarioSenate House Senate House
$1,000s $1,000s
FAPRI Baseline Price Scenario Declining Price ScenarioSenate House Senate House
$1,000s $1,000s
FAPRI Baseline Price Scenario Declining Price ScenarioSenate House Senate House
$1,000s $1,000s
80

TXER3200
ARC Indiv. ARC County RLC PLC ARC Indiv. ARC County RLC PLC
Loan Deficiency Payments 0.00 0.00 0.00 0.00 0.00 0.00 0.00 0.00
ARC or RLC or PLC Payments 33.03 34.39 33.92 133.61 77.54 84.95 93.21 243.70
Government Payments 33.03 34.39 33.92 133.61 77.55 84.96 93.21 243.70
STAX Net Payments 0.00 0.00 0.00 0.00 0.00 0.00 0.00 0.00
SCO Net Payments 49.00 49.00 0.00 96.62 33.89 33.89 0.00 67.06
Net Cash Farm Income ‐363.61 ‐362.01 ‐422.46 ‐179.35 ‐821.57 ‐812.64 ‐845.28 ‐573.05
Real Net Worth 2017 ‐1,281.09 ‐1,273.12 ‐1,567.22 ‐397.41 ‐3,648.28 ‐3,604.43 ‐3,764.75 ‐2,428.12
AGI 3 Year Moving Average ‐237.91 ‐237.31 ‐268.15 ‐136.23 ‐473.03 ‐468.84 ‐487.92 ‐339.55
Probability of Exceeding AGI Limit (%) 1 1 1 1 1 1 1 1
LASR1480
ARC Indiv. ARC County RLC PLC ARC Indiv. ARC County RLC PLC
Loan Deficiency Payments 0.00 0.00 0.00 0.00 0.01 0.01 0.01 0.01
ARC or RLC or PLC Payments 14.76 15.85 14.66 46.17 46.97 49.97 53.88 156.14
Government Payments 14.76 15.85 14.66 46.17 46.98 49.97 53.89 156.15
STAX Net Payments 0.00 0.00 0.00 0.00 0.00 0.00 0.00 0.00
SCO Net Payments 15.15 15.15 0.00 32.00 10.58 10.58 0.00 22.32
Net Cash Farm Income ‐129.03 ‐127.93 ‐147.73 ‐69.84 ‐405.03 ‐401.78 ‐410.61 ‐260.13
Real Net Worth 2017 ‐49.86 ‐44.63 ‐138.95 229.91 ‐1,471.98 ‐1,456.01 ‐1,499.39 ‐760.62
AGI 3 Year Moving Average ‐124.16 ‐124.03 ‐134.85 ‐90.34 ‐267.13 ‐266.23 ‐272.60 ‐195.37
Probability of Exceeding AGI Limit (%) 1 1 1 1 1 1 1 1
ARSR3240
ARC Indiv. ARC County RLC PLC ARC Indiv. ARC County RLC PLC
Loan Deficiency Payments 0.00 0.00 0.00 0.00 0.02 0.02 0.02 0.02
ARC or RLC or PLC Payments 31.53 39.58 41.24 103.09 87.69 95.74 134.83 243.22
Government Payments 31.53 39.58 41.24 103.09 87.71 95.76 134.86 243.24
STAX Net Payments 0.00 0.00 0.00 0.00 0.00 0.00 0.00 0.00
SCO Net Payments 23.22 23.22 0.00 57.70 16.17 16.17 0.00 40.20
Net Cash Farm Income 73.97 83.72 58.57 202.10 ‐532.61 ‐522.61 ‐495.69 ‐311.07
Real Net Worth 2017 2,635.95 2,681.67 2,576.54 3,205.88 ‐425.83 ‐376.72 ‐244.44 659.73
AGI 3 Year Moving Average ‐115.66 ‐110.42 ‐124.01 ‐41.61 ‐430.16 ‐424.68 ‐413.11 ‐310.26
Probability of Exceeding AGI Limit (%) 1 1 1 1 1 1 1 1
$1,000s $1,000s
FAPRI Baseline Price Scenario Declining Price ScenarioSenate House Senate House
FAPRI Baseline Price Scenario Declining Price ScenarioSenate House Senate House
$1,000s $1,000s
$1,000s $1,000s
FAPRI Baseline Price Scenario Declining Price ScenarioSenate House Senate House
81

ARWR1400
ARC Indiv. ARC County RLC PLC ARC Indiv. ARC County RLC PLC
Loan Deficiency Payments 0.00 0.00 0.00 0.00 0.01 0.01 0.01 0.01
ARC or RLC or PLC Payments 17.37 19.02 17.26 60.45 50.67 55.55 59.71 197.86
Government Payments 17.37 19.02 17.26 60.45 50.69 55.57 59.72 197.87
STAX Net Payments 0.00 0.00 0.00 0.00 0.00 0.00 0.00 0.00
SCO Net Payments 11.94 11.94 0.00 31.21 8.33 8.33 0.00 21.80
Net Cash Farm Income ‐101.10 ‐99.17 ‐115.48 ‐25.60 ‐407.98 ‐402.21 ‐407.80 ‐218.01
Real Net Worth 2017 1,353.41 1,362.85 1,285.21 1,713.03 ‐237.82 ‐209.48 ‐236.93 695.27
AGI 3 Year Moving Average ‐181.39 ‐180.47 ‐189.47 ‐137.19 ‐342.80 ‐339.85 ‐344.41 ‐246.06
Probability of Exceeding AGI Limit (%) 1 1 1 1 1 1 1 1
ARHR3000
ARC Indiv. ARC County RLC PLC ARC Indiv. ARC County RLC PLC
Loan Deficiency Payments 0.00 0.00 0.00 0.00 0.02 0.02 0.02 0.02
ARC or RLC or PLC Payments 34.70 38.97 37.81 101.35 91.26 94.25 114.71 243.06
Government Payments 34.70 38.97 37.81 101.35 91.28 94.27 114.73 243.09
STAX Net Payments 0.00 0.00 0.00 0.00 0.00 0.00 0.00 0.00
SCO Net Payments 30.28 30.28 0.00 78.08 21.14 21.14 0.00 54.50
Net Cash Farm Income ‐298.74 ‐293.51 ‐331.53 ‐157.96 ‐973.41 ‐969.68 ‐971.49 ‐745.87
Real Net Worth 2017 1,367.99 1,393.36 1,217.83 2,031.08 ‐2,117.16 ‐2,098.82 ‐2,107.67 ‐1,000.79
AGI 3 Year Moving Average ‐376.56 ‐373.72 ‐394.62 ‐296.53 ‐727.63 ‐725.49 ‐728.61 ‐604.26
Probability of Exceeding AGI Limit (%) 1 1 1 1 1 1 1 1
ARMR7500
ARC Indiv. ARC County RLC PLC ARC Indiv. ARC County RLC PLC
Loan Deficiency Payments 62.03 62.03 62.03 62.03 267.03 267.03 267.03 267.03
ARC or RLC or PLC Payments 47.10 47.75 71.02 115.90 96.57 96.33 203.64 246.81
Government Payments 109.13 109.78 133.05 177.93 363.59 363.35 470.66 513.84
STAX Net Payments 56.99 56.99 58.70 58.70 39.87 39.87 92.75 92.75
SCO Net Payments 42.36 42.36 0.00 128.52 29.63 29.63 0.00 89.93
Net Cash Farm Income 537.53 538.01 520.27 714.43 ‐1,141.41 ‐1,141.84 ‐987.93 ‐822.69
Real Net Worth 2017 8,287.31 8,288.15 8,247.87 8,983.85 174.35 172.25 930.08 1,731.84
AGI 3 Year Moving Average 160.90 160.22 150.41 266.55 ‐729.97 ‐730.52 ‐662.78 ‐564.70
Probability of Exceeding AGI Limit (%) 10 10 3 6 1 1 1 1
FAPRI Baseline Price Scenario Declining Price ScenarioSenate House Senate House
$1,000s $1,000s
FAPRI Baseline Price Scenario Declining Price ScenarioSenate House Senate House
$1,000s $1,000s
FAPRI Baseline Price Scenario Declining Price ScenarioSenate House Senate House
$1,000s $1,000s
82

MOWR4000
ARC Indiv. ARC County RLC PLC ARC Indiv. ARC County RLC PLC
Loan Deficiency Payments 0.00 0.00 0.00 0.00 0.04 0.04 0.04 0.04
ARC or RLC or PLC Payments 41.55 38.94 50.38 117.61 92.31 94.34 180.22 247.26
Government Payments 41.55 38.94 50.38 117.61 92.35 94.38 180.27 247.31
STAX Net Payments 0.00 0.00 0.00 0.00 0.00 0.00 0.00 0.00
SCO Net Payments 31.33 31.33 0.00 84.77 21.85 21.85 0.00 59.12
Net Cash Farm Income 485.07 481.65 461.78 628.16 ‐428.64 ‐426.37 ‐349.44 ‐196.69
Real Net Worth 2017 13,418.25 13,396.86 13,359.31 13,952.78 9,171.23 9,180.86 9,569.67 10,264.67
AGI 3 Year Moving Average 188.41 185.60 174.70 275.09 ‐294.19 ‐293.16 ‐258.50 ‐166.17
Probability of Exceeding AGI Limit (%) 2 2 1 2 1 1 1 1
$1,000s $1,000s
FAPRI Baseline Price Scenario Declining Price ScenarioSenate House Senate House
83

APPENDIX D:
SUMMARY OF SAFETY NET
COVERAGE BY FARM TYPE AND
PRICE SCENARIO
Appendix D. Summary of Average Annual Government Payments by Representative Farm Type and Overall.
RLC PLC ARC Indiv. ARC Cty. RLC PLC ARC Indiv. ARC Cty. RLC PLC ARC Indiv. ARC Cty.
Overall 22.6 39.9 19.3 20.2 0.0 56.7 22.0 22.0 22.6 96.5 41.2 42.1
FG/Oilseed 25.1 23.7 20.5 21.5 0.0 74.3 24.3 24.3 25.1 98.0 44.8 45.8
Wheat 18.7 39.7 16.7 18.1 0.0 41.8 18.0 18.0 18.7 81.5 34.7 36.1
Cotton 17.0 42.2 16.7 16.6 0.0 36.9 17.6 17.6 17.0 79.1 34.3 34.2
Rice 28.2 63.9 22.2 23.6 0.0 62.0 26.2 26.2 28.2 126.0 48.5 49.9
RLC PLC ARC Indiv. ARC Cty. RLC PLC ARC Indiv. ARC Cty. RLC PLC ARC Indiv. ARC Cty.
Overall 55.3 119.5 40.9 41.3 0.0 39.2 15.2 15.2 55.3 158.7 56.1 56.5
FG/Oilseed 62.4 115.2 45.2 46.0 0.0 51.9 17.0 17.0 62.4 167.1 62.2 63.0
Wheat 28.5 102.6 24.6 23.0 0.0 28.8 12.4 12.4 28.5 131.5 37.1 35.4
Cotton 22.8 74.2 23.8 22.4 0.0 25.6 12.2 12.2 22.8 99.8 36.0 34.6
Rice 101.9 191.4 66.2 69.7 0.0 42.2 17.8 17.8 101.9 233.6 84.0 87.5
ARC or PLC or RLC Payments SCO Net Payment ARC or PLA or RLA Payments + SCO Payments
ARC or PLC or RLC Payments
House Farm Bill Senate Farm Bill House Farm Bill Senate Farm Bill House Farm Bill Senate Farm Bill
SCO Net Payment ARC or PLA or RLA Payments + SCO Payments
Declining Price Scenario
FAPRI Baseline Price Scenario
House Farm Bill Senate Farm Bill House Farm Bill Senate Farm Bill House Farm Bill Senate Farm Bill
84