economic impacts of tourism in german protected areas
TRANSCRIPT
Economic Impacts of Tourismin Large Scale Protected Areas
Key Figures for Mecklenburg-Vorpommern
Parliamentary Evening:„25 years protected areas in Mecklenburg-Vorpommern –
biodiversity policy as contribution to a sustainable (economical)development “ 25.11.2015, Brussels
Niklas Scheder

Large Scale Protected Areas of Mecklenburg-Vorpommern
27.11.2015 Department for Geography and Geology / Chair for Geography and Regional Research 2
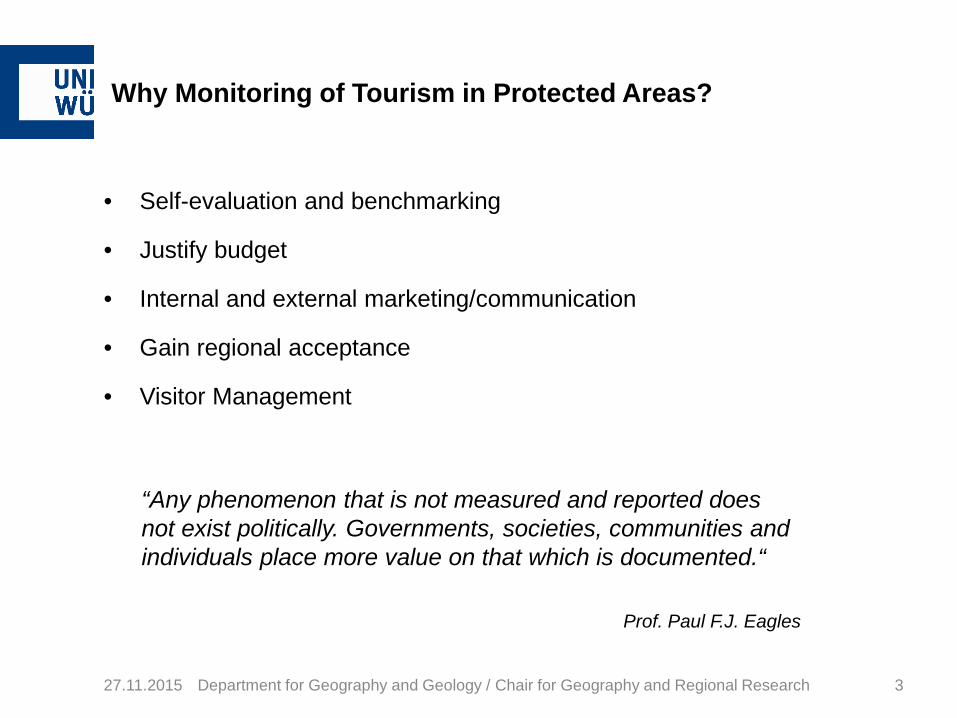
Why Monitoring of Tourism in Protected Areas?
27.11.2015 Department for Geography and Geology / Chair for Geography and Regional Research 3
“Any phenomenon that is not measured and reported does not exist politically. Governments, societies, communities and individuals place more value on that which is documented.“
Prof. Paul F.J. Eagles
• Self-evaluation and benchmarking
• Justify budget
• Internal and external marketing/communication
• Gain regional acceptance
• Visitor Management

Evaluation of Regional Economic Impacts: A Brief History
• 2001/02: First attempt to evaluate economic impacts of tourism withinthe Berchtesgaden National Park region
• 2003-05: Development of a standardized method for the evaluation of economic impacts of tourism in German large scale protected areas based on three case study regions
• 2006-2019: Application to 14 national parks and 12 biosphere reserves by a series of research projects
• Funding was always granted by by the Federal Ministry for Environment, Building and Nuclear Safety (BMUB) and Federal Nature Conservation Agency (BfN) as well as some of the local management bodies
27.11.2015 Department for Geography and Geology / Chair for Geography and Regional Research 4

Research Design
27.11.2015 Department for Geography and Geology / Chair for Geography and Regional Research 5
Destination Survey
Short Interviews
Long Interviews
Gross Tourist SpendingCountings
& Official Statistics Visitor Days per Year
Total Income &Income Equivalents
(FTE)
Direct & IndirectMultipliers
Computation Official Statistics
Visitor Structure
Expenditures & Motivation

Visitation
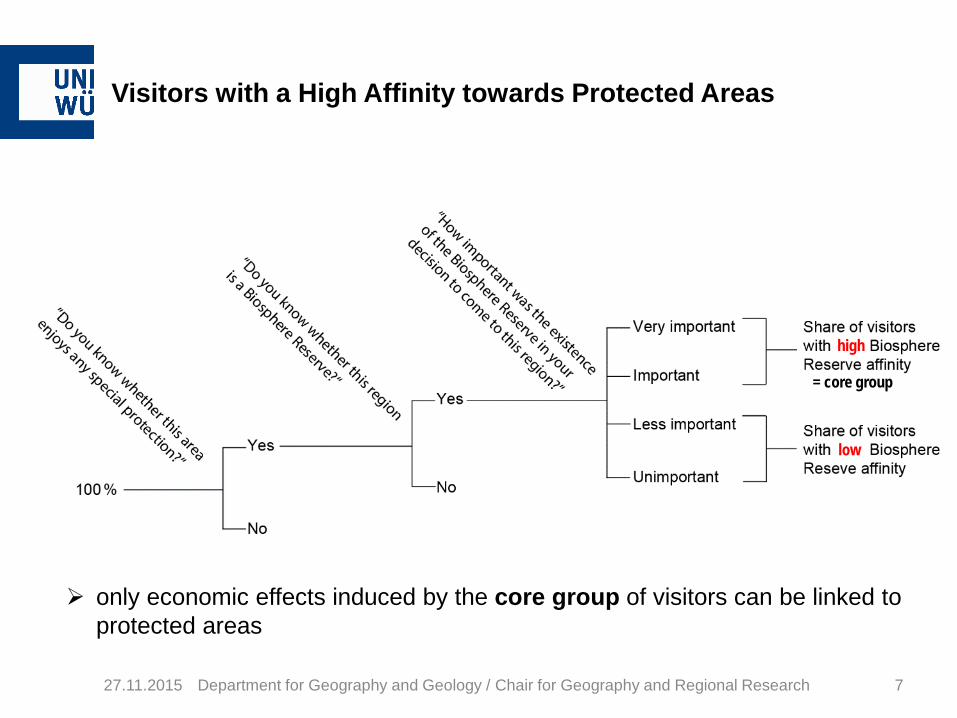
Visitors with a High Affinity towards Protected Areas
27.11.2015 Department for Geography and Geology / Chair for Geography and Regional Research 7
low
high
only economic effects induced by the core group of visitors can be linked toprotected areas
= core group
27.11.2015 Department for Geography and Geology / Chair for Geography and Regional Research 8
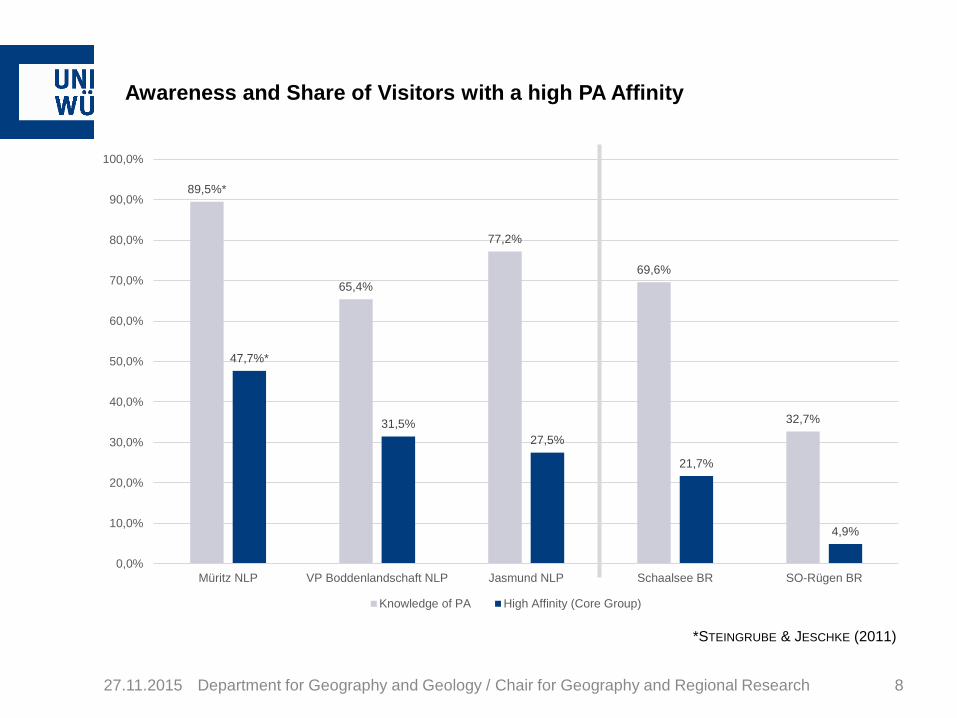
Awareness and Share of Visitors with a high PA Affinity
*STEINGRUBE & JESCHKE (2011)
89,5%*
65,4%
77,2%
69,6%
32,7%
47,7%*
31,5%27,5%
21,7%
4,9%
0,0%
10,0%
20,0%
30,0%
40,0%
50,0%
60,0%
70,0%
80,0%
90,0%
100,0%
Müritz NLP VP Boddenlandschaft NLP Jasmund NLP Schaalsee BR SO-Rügen BR
Knowledge of PA High Affinity (Core Group)
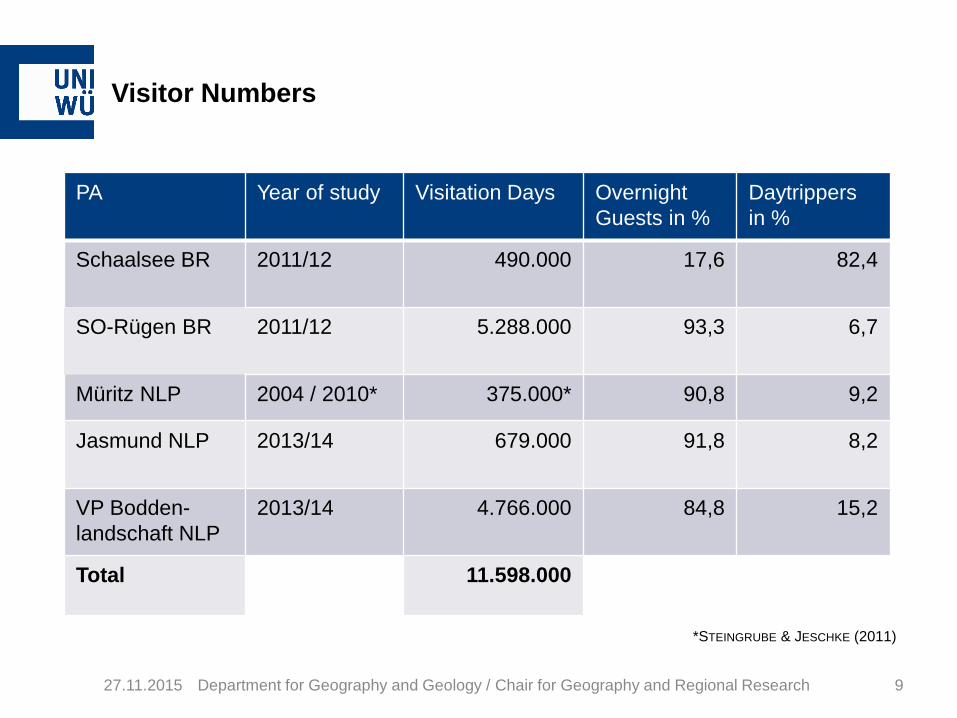
Visitor Numbers
27.11.2015 Department for Geography and Geology / Chair for Geography and Regional Research 9
PA Year of study Visitation Days OvernightGuests in %
Daytrippersin %
Schaalsee BR 2011/12 490.000 17,6 82,4
SO-Rügen BR 2011/12 5.288.000 93,3 6,7
Müritz NLP 2004 / 2010* 375.000* 90,8 9,2
Jasmund NLP 2013/14 679.000 91,8 8,2
VP Bodden-landschaft NLP
2013/14 4.766.000 84,8 15,2
Total 11.598.000
*STEINGRUBE & JESCHKE (2011)
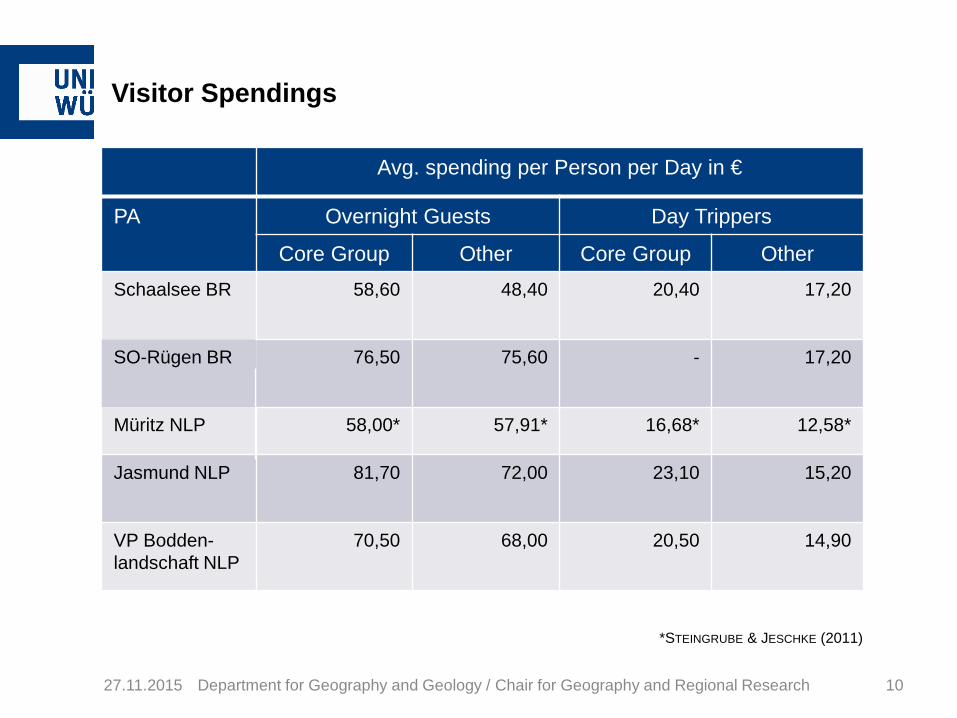
Visitor Spendings
27.11.2015 Department for Geography and Geology / Chair for Geography and Regional Research 10
Avg. spending per Person per Day in €
PA Overnight Guests Day Trippers
Core Group Other Core Group OtherSchaalsee BR 58,60 48,40 20,40 17,20
SO-Rügen BR 76,50 75,60 - 17,20
Müritz NLP 58,00* 57,91* 16,68* 12,58*
Jasmund NLP 81,70 72,00 23,10 15,20
VP Bodden-landschaft NLP
70,50 68,00 20,50 14,90
*STEINGRUBE & JESCHKE (2011)
Economic Impacts

Economic Impact Assessment: Value Added Analysis
27.11.2015 Department for Geography and Geology / Chair for Geography and Regional Research 12
Scha
alse
eBi
osph
ere
Res
erve
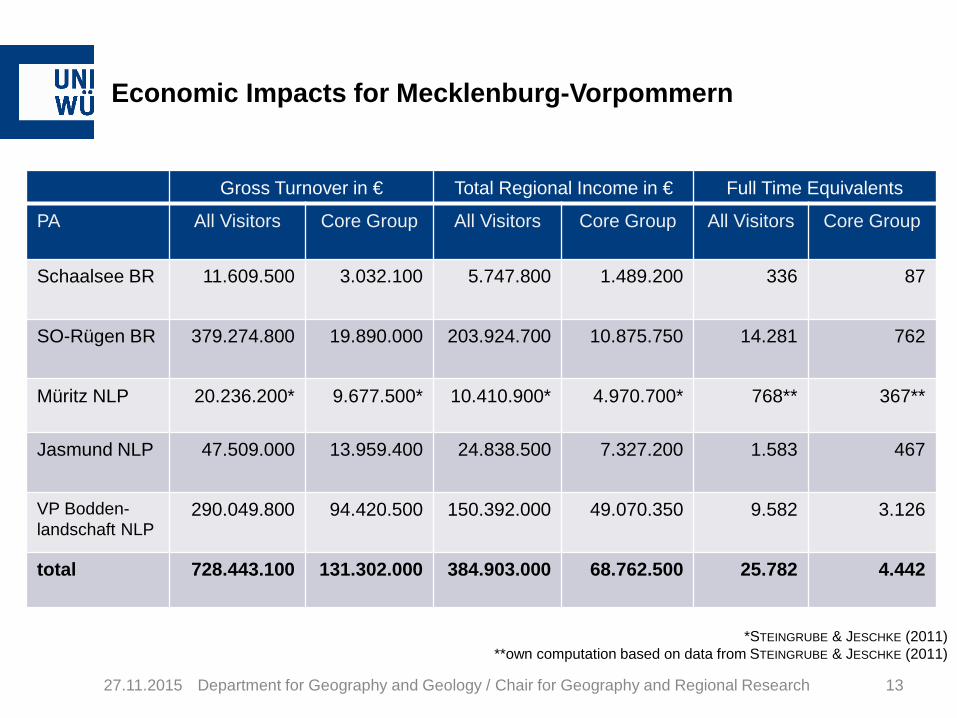
Economic Impacts for Mecklenburg-Vorpommern
27.11.2015 Department for Geography and Geology / Chair for Geography and Regional Research 13
Gross Turnover in € Total Regional Income in € Full Time Equivalents
PA All Visitors Core Group All Visitors Core Group All Visitors Core Group
Schaalsee BR 11.609.500 3.032.100 5.747.800 1.489.200 336 87
SO-Rügen BR 379.274.800 19.890.000 203.924.700 10.875.750 14.281 762
Müritz NLP 20.236.200* 9.677.500* 10.410.900* 4.970.700* 768** 367**
Jasmund NLP 47.509.000 13.959.400 24.838.500 7.327.200 1.583 467
VP Bodden-landschaft NLP
290.049.800 94.420.500 150.392.000 49.070.350 9.582 3.126
total 728.443.100 131.302.000 384.903.000 68.762.500 25.782 4.442
*STEINGRUBE & JESCHKE (2011)**own computation based on data from STEINGRUBE & JESCHKE (2011)
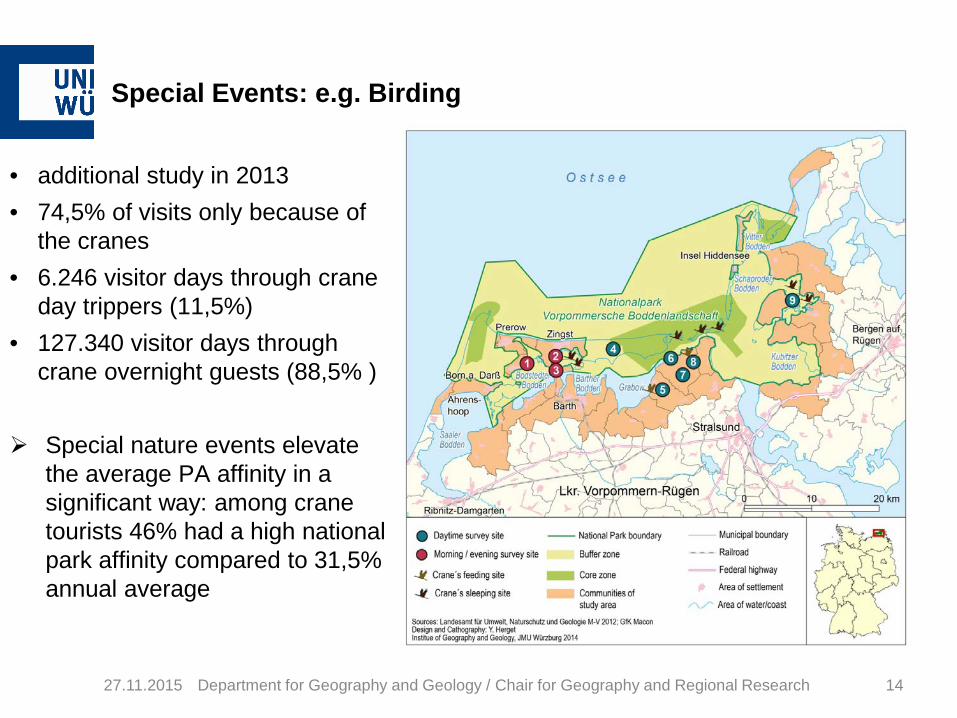
Special Events: e.g. Birding
27.11.2015 Department for Geography and Geology / Chair for Geography and Regional Research 14
• additional study in 2013• 74,5% of visits only because of
the cranes• 6.246 visitor days through crane
day trippers (11,5%)• 127.340 visitor days through
crane overnight guests (88,5% )
Special nature events elevatethe average PA affinity in a significant way: among cranetourists 46% had a high national park affinity compared to 31,5% annual average
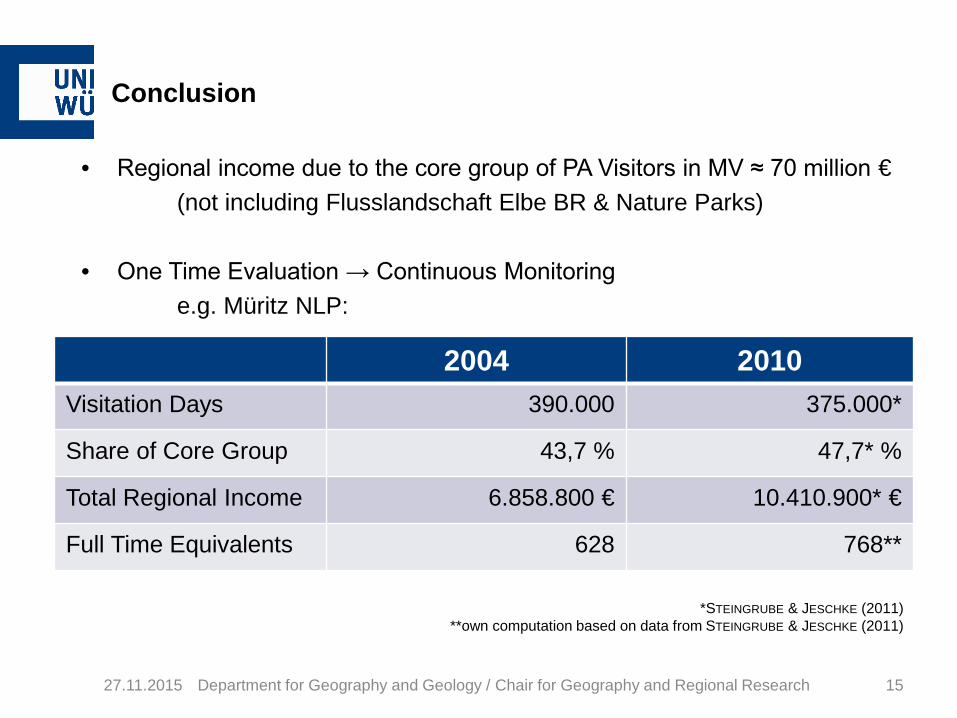
Conclusion
• Regional income due to the core group of PA Visitors in MV ≈ 70 million €(not including Flusslandschaft Elbe BR & Nature Parks)
• One Time Evaluation → Continuous Monitoringe.g. Müritz NLP:
27.11.2015 Department for Geography and Geology / Chair for Geography and Regional Research 15
2004 2010Visitation Days 390.000 375.000*
Share of Core Group 43,7 % 47,7* %
Total Regional Income 6.858.800 € 10.410.900* €
Full Time Equivalents 628 768**
*STEINGRUBE & JESCHKE (2011)**own computation based on data from STEINGRUBE & JESCHKE (2011)
27.11.2015 Department for Geography and Geology / Chair for Geography and Regional Research 16
Thank you.