economic implications of selection of long-life versus
TRANSCRIPT

Economic Implications of Selection of Long-Life versus Conventional Caltrans Rehabilitation Strategies for High-Volume Highways
Draft report prepared for the
CALIFORNIA DEPARTMENT OF TRANSPORTATION
Division of Research and Innovation
Office of Roadway Research
By:
David Jones CSIR Transportek
Charles Lee UC Davis
John Harvey
UC Davis
June 2005
Pavement Research Center University of California, Davis
University of California, Berkeley

EXECUTIVE SUMMARY
This report presents the results of a two-part study that compared the lifecycle costs of
two long-life pavement (LLP) rehabilitation options and several conventional rehabilitation
strategies for existing asphalt and concrete pavements, considering both agency costs and road
user cost associated with traffic delay caused by construction. In the first part of the research,
data from a 1996 study was reanalyzed using a more appropriate method of calculating traffic
demand whilst using other assumptions of the earlier study. Then, a factorial sensitivity study
was performed comparing lifecycle costs of hypothetical long-life strategies and conventional
rehabilitation strategies, but with more variables than were included in the 1996 study and more
appropriate data sourced from recent projects. The RealCost software package, developed by the
Federal Highway Administration, was used for all analyses.
The results of the analyses showed that for the current data and assumptions (pavement
lives, construction productivity, hourly traffic patterns) used in the study together with better
traffic delay analysis, the LLP options have greater total costs than conventional rehabilitation
alternatives assuming 24-hour-per-day closures for LLP options and 8-hour nighttime closures
for conventional alternatives. However, the sensitivity analyses showed that as traffic demand is
reduced by implementation of Traffic Management Plans (TMP) and use of weekend closures,
the traffic delay costs associated with LLP options are significantly reduced. The sensitivity
analyses also showed that if non-pavement costs are reduced for the LLP options (they were not
considered for the conventional rehabilitation alternatives), LLP options become competitive for
projects with large numbers of lanes.
Because of a lack of good pavement performance data, and limited cost data for long-life
projects (two projects), the results of the sensitivity analyses presented in this report should be
considered in terms of their general trends, and should absolutely not be used to compare
i

different conventional rehabilitation strategies or alternative long life strategies for individual
projects without using better and site-specific data. The alternatives considered in this study are
all hypothetical cases. The study was limited to rehabilitation strategies only and is not
applicable to new construction or widening.
The sensitivity analyses made clear the need to perform lifecycle cost analysis for each
project using project-specific data for both agency costs and road user costs. Despite the findings
of this study, LLP is still considered to be a feasible rehabilitation option. It is thus strongly
recommended that LCCA be performed on a case-by-case basis when determining whether to
use long-life or conventional strategies as significantly different results could be obtained when
project specific data and actual overhead and administration costs are used. An example is
provided in the report in which lifecycle cost analyses showed LLP to be more cost-effective
than conventional rehabilitation alternatives because the existing pavement condition made some
conventional rehabilitation alternatives infeasible, which would have resulted in shorter lives
than those assumed in this study. Local conditions resulted in a traffic management plan with
significantly greater reduction in traffic demand that that assumed in this study.
The results of LCCA are dependent on the following variables which are different for
each project:
• Traffic demand patterns, including hourly demand, weekday and weekend demand,
directional peaks and discretionary versus job-related travel
• Alternative routes and modes
• Lane and shoulder configurations and highway geometry in each direction
• Feasibility and expected life of each rehabilitation strategy, which depend on truck
traffic and existing pavement condition in each lane
ii
• Expected construction durations
Sensitivity analyses should be carried out to identify specific issues that influence the
agency and road user costs and which could be managed better to reduce the costs on alternative
strategies. There is consensus in the industry that quality LCCA in the design phase of
rehabilitation projects can result in more appropriate strategies, considerable total savings
(agency and road user) and better cash flow management.
iii

iv

TABLE OF CONTENTS
Executive Summary ......................................................................................................................... i
Table of Contents............................................................................................................................ v
List of Tables ................................................................................................................................. ix
1.0 Introduction..................................................................................................................... 1
1.1 Basic Elements of Lifecycle Cost Analysis.................................................................... 2
1.1.1 Costs............................................................................................................................ 2
1.1.2 Analysis Period ........................................................................................................... 3
1.1.3 Discount Rate.............................................................................................................. 4
1.1.4 Salvage Value ............................................................................................................. 4
1.1.5 Sensitivity and Uncertainty......................................................................................... 5
1.2 The LCCA Process ......................................................................................................... 5
1.3 RealCost LCCA Software............................................................................................... 6
2.0 Re-analysis of the 1996 Data .......................................................................................... 9
2.1 The 1996 Study............................................................................................................... 9
2.1.1 Input ............................................................................................................................ 9
2.1.2 Results....................................................................................................................... 11
2.2 Re-analysis with RealCost ............................................................................................ 11
2.2.1 Input Data.................................................................................................................. 11
2.2.2 Results....................................................................................................................... 12
3.0 Factorial Sensitivity Analysis ....................................................................................... 15
3.1 Experiment Design ....................................................................................................... 15
3.2 Input Data—Baseline Study ......................................................................................... 16
3.3 Results........................................................................................................................... 22
v

3.3.1 Asphalt Concrete Pavements .................................................................................... 22
3.3.2 Portland Cement Concrete Pavements...................................................................... 27
3.4 Other Considerations .................................................................................................... 29
3.4.1 Traffic Refinements .................................................................................................. 29
3.4.2 Non-pavement Related Multipliers........................................................................... 33
3.5 Project-Specific Sensitivity Analysis............................................................................ 38
4.0 Conclusions and Recommendations ............................................................................. 41
4.1 Conclusions................................................................................................................... 41
4.2 Recommendations......................................................................................................... 44
5.0 References..................................................................................................................... 47
vi

LIST OF FIGURES
Figure 1. Lowest cost alternatives compared to lowest cost LLP for AC pavements,
project cost. ........................................................................................................................... 25
Figure 2. Lowest cost alternatives compared to lowest cost LLP for AC pavements,
lane-mile cost. ....................................................................................................................... 25
Figure 3. Lowest cost alternatives compared to lowest cost LLP for PCC pavements,
project cost. ........................................................................................................................... 26
Figure 4. Lowest cost alternatives compared to lowest cost LLP for PCC pavements,
lane-mile cost. ....................................................................................................................... 26
Figure 5. Comparison of traffic refinements for LLP-1, lane-mile cost. ...................................... 31
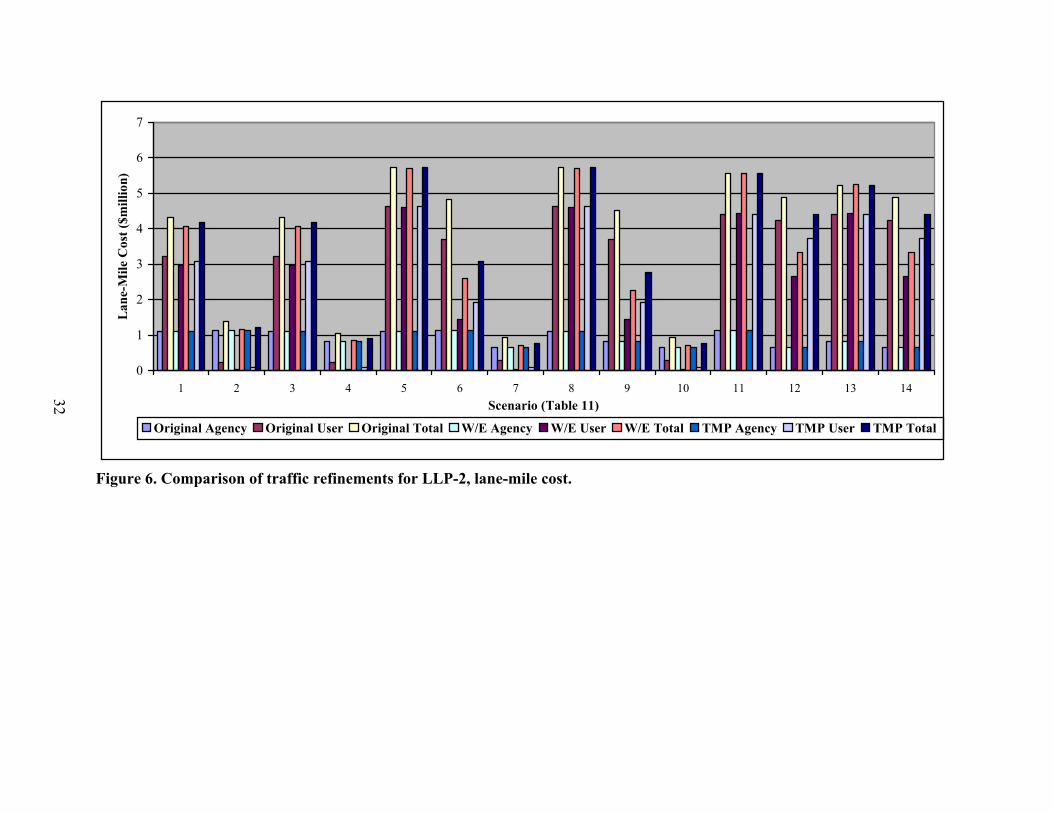
Figure 6. Comparison of traffic refinements for LLP-2, lane-mile cost. ...................................... 32
Figure 7. Comparison of multiplier effect for LLP-1, lane-mile cost........................................... 35
Figure 8. Comparison of multiplier effect for LLP-2, lane-mile cost........................................... 36
vii

viii
LIST OF TABLES
Table 1 Input Data for Re-analysis with RealCost, Analysis Options................................... 12
Table 2 Cost (× $1000) Comparison of Asphalt Concrete Overlay and Long Life PCC
Strategies from Rerun of 1996 Study.................................................................................... 13
Table 3 Input Data for RealCost LCCA, Analysis Options................................................... 17
Table 4 Input Data for RealCost LCCA, Rehabilitation and Maintenance Activities........... 17
Table 5 Input Data for RealCost LCCA, Activity Costs and Construction Durations .......... 18
Table 6 Input Data for RealCost LCCA, Assumed Sequence of Activities for Each
Rehabilitation Strategy.......................................................................................................... 19
Table 7 Results of LCCA (Project Cost), Lowest Cost Alternative for AC Pavements........ 19
Table 8 Results of LCCA (Project Lane-Mile Cost), Lowest Cost Alternative for AC
Pavements ............................................................................................................................. 23
Table 9 Results of LCCA (Project Cost), Lowest Cost Alternative for PCC Pavements...... 23
Table 10 Results of LCCA (Project Lane-Mile Cost), Lowest Cost Alternative for PCC
Pavements ............................................................................................................................. 24
Table 11 Comparison of Normal, Weekend, and Weekday Traffic Management Plan (Lane-
Mile Cost) ............................................................................................................................. 30
Table 12 Comparison of Normal and Normal without Multiplier Factor (Lane-Mile Cost) ... 34
Table 13 Comparison of Agency Costs, LLP without Multiplier Factor and Lowest Cost
Alternative Strategies (Lane-Mile Cost)............................................................................... 37
Table 14 Schedule, Delay, and Cost Comparison for Closure Scenarios for I-15 Devore
Rehabilitation........................................................................................................................ 40
ix

x
1.0 INTRODUCTION
The California Department of Transportation (Caltrans) has a number of options
available for rehabilitating high traffic volume highways. The choice of an appropriate option
depends on many factors including the existing pavement type and condition, funding, and traffic
characteristics, among others. Caltrans policy, detailed in the Highway Design Manual (1), has
been to seek greatest efficiency in the use of available funding in terms of pavement lifecycle
cost and road user delay cost associated with maintaining pavement serviceability.
In 1996, an internal Caltrans study was undertaken to compare the lifecycle costs of
rehabilitating an existing Portland cement concrete pavement using a standard 10-year asphalt
concrete overlay strategy with those of using a 35-year Portland cement concrete, so-called
“long-life” rehabilitation strategy. The study entailed a basic spreadsheet computation that
compared the net present values of pavements with different lifecycle maintenance and
rehabilitation costs under different traffic volume assumptions. Data were obtained from five
projects with annual average daily traffic (AADT) volumes varying between 50,000 and 220,000
vehicles per day and 10 to 20 percent heavy vehicles. The study found that for AADT above
about 150,000 and/or truck traffic higher than about 15,000 units per day, user costs were
dominant in strategy selection and that long-life pavement (LLP) designs typically had lower
lifecycle costs than conventional designs.
The 1996 study was undertaken with limited data and basic lifecycle cost analysis
(LCCA) principles. More data has since become available, and in late 2004 Caltrans requested
that a more detailed study be undertaken by the Pavement Research Center (PPRC) to determine
whether the 150,000 AADT/15,000 trucks figures were still appropriate. This report summarizes
the study, part of which was originally written up as a dissertation for a Master’s thesis at the
University of California, Davis (2). The study consists of a reanalysis of the 1996 study using
1

new information, a factorial sensitivity study comparing lifecycle costs of long-life strategies and
conventional rehabilitation strategies with more variables than were included in the 1996 study,
and more appropriate data from recent projects.
1.1 Basic Elements of Lifecycle Cost Analysis
The basic elements of lifecycle cost analysis (LCCA) pertinent to this study include:
• Costs
• Analysis period
• Discount rate
• Salvage value
• Sensitivity and uncertainty
Each of these is briefly introduced in the following sections. Additional information on
LCCA can be found in the literature (3, 4).
1.1.1 Costs
Numerous factors, each with a cost, are associated with pavements over their lifecycle.
For LCCA, two distinct categories can be distinguished, namely agency-related costs and added
costs. Agency costs are those directly represented by the budget or out-of-pocket costs paid by
the road owner and include the following:
• Initial construction costs
• Future costs (maintenance, rehabilitation, renovation, and reconstruction)
• Salvage return or residual value at the end of the design period
• Engineering and administration
• Costs of borrowing
2
For this study, at least some historical construction cost data was available for initial
construction costs and resulting rehabilitation and major maintenance for each strategy
considered. Routine minor maintenance, costs of engineering, and Caltrans overhead were not
considered because of lack of readily available state-wide data. Borrowing costs were also not
considered.
The added cost component comprises two main elements:
• User costs (e.g., vehicle operating, time, and accidents costs)
• External costs (e.g., environmental and social costs)
Of these added costs, only the road user delay costs associated with Caltrans pavement
maintenance, rehabilitation, and reconstruction activities were considered, following Caltrans
policy in the Highway Design Manual (1).
1.1.2 Analysis Period
The analysis period is a fundamental component of the lifecycle cost analysis process and
is essentially a policy decision dependent on the agency, circumstances, and infrastructure
involved. It should be long enough to include the maintenance and rehabilitation and/or
reconstruction activities that are a consequence of the initial strategy selected, but the period
should not fall outside what can be reliably predicted into the future from historical records.
Furthermore, any costs anticipated far into the future that are discounted back to present worth
will become negligible in terms of the other costs earlier on in the lifecycle.
Analysis periods for highway rehabilitation typically do not exceed 20 years. A general
rule is that the analysis period should be approximately 1.5 times the design life of the strategy
selected. However, periods of 35 years need to be considered for long life pavement designs, but
3

the implications of discounting and projecting traffic volumes over the longer period must be
assessed. A 35 year analysis period was used for this study.
In the California Highway Design Manual (1), the recommended analysis periods vary
depending on the pavement service life and range from 20 to 50 years for 10- and 40-year
pavement service lives, respectively.
1.1.3 Discount Rate
The discount rate takes into account the time value of money and is essentially the
difference between inflation and the interest rate. The selection of an appropriate discount rate is
critical since it can result in the preference of a particular alternative if one discount rate is
chosen over another. Two extreme cases therefore exist:
• The discount rate is too low. Future costs, especially when there are many, dominate
over the initial cost when the discount rate is low.
• The discount rate is too high. Initial costs dominate, and the future costs are
discounted to insignificant present worth costs when the discount rate is high.
Most agencies specify discount rates for lifecycle cost analysis as a matter of policy.
Caltrans has typically used a 4 percent discount rate in the LCCA calculator included in the
Highway Design Manual. Four percent was used for the analyses in this study.
1.1.4 Salvage Value
When fixed analysis periods are used in LCCA, the serviceable life of some alternatives
might stretch beyond that period. The salvage value refers to the economic value remaining in
the pavement after the analysis period. The FHWA characterizes the salvage value as the cost of
the last rehabilitation activity multiplied by the ratio of years until the end of the analysis period
4

to the years until the next activity beyond the analysis period, essentially a straight line
depreciation of the pavement asset (3). Furthermore, any pavement will have some intrinsic
value at the end of its lifecycle—whether that is the recycling value of the construction materials
or the value of the engineered base below the surface of the pavement. Salvage values are
typically small in comparison with the other costs associated with the lifecycle of a pavement.
For this study, salvage values followed straight line depreciation to the end of their design life.
1.1.5 Sensitivity and Uncertainty
Sensitivity analyses are usually included in LCCA to understand and address the
variability within input assumptions, projections, and estimates, which are typically averages
based on imperfect historical pavement performance, rehabilitation, lifecycle and road user data.
When analyzing the results of a lifecycle cost analysis, the accuracy of the estimation of each
cost component will vary from good to poor, depending on the quality of the historical data and
its applicability to the activities considered in the lifecycle cost analysis. The procedure treats all
costs as if they are equally important (5). Specific comments are made in this report on the
potential variability of the assumptions made for the analyses, and some sensitivity analyses
were performed with regard to traffic assumptions.
1.2 The LCCA Process
LCCA typically entails seven steps:
1. Identification of alternatives
2. Mapping of lifecycles for each alternative
3. Estimation of lifecycle costs
4. Defining constants
5

5. Discounting future costs
6. Summing all present values
7. Comparing alternatives
1.3 RealCost LCCA Software
The RealCost LCCA software (6) was used for all of the calculations presented in this
report. RealCost was developed by the FHWA as a tool for pavement designers to incorporate
lifecycle costs into pavement investment decisions. It automates LCCA methodology as it
applies to pavements incorporating agency and user costs associated with construction and
rehabilitation. The user must input agency costs and service lives for individual construction or
maintenance and rehabilitation (M&R) activities. Default values for other agency costs as well as
road user costs are provided. Each of the defaults was checked against Caltrans policy before use
in this study. As with any economic tool, LCCA provides critical information to the overall
decision-making process, but not the answer itself. RealCost performs calculations for LCCA,
but the validity of the results is dependent on the validity of the information used as input to the
program.
Traffic delay costs in RealCost are calculated using demand-capacity models and queue
formation and dissipation algorithms similar to those in the Transportation Research Board
Highway Capacity Manual. Default hourly distributions for weekday traffic in RealCost were
used for this study. These algorithms have been validated by measurements made by the PPRC
during the rehabilitation of I-710 at Long Beach (7) and I-15 at Devore (8). A typical hourly
distribution was used for weekend traffic delay analysis. There is a great deal of variation in
hourly traffic distribution patterns for both weekdays and weekends across high traffic volume
highways in California. The traffic distributions used for this analysis are reasonable for
6

representing typical distributions across the state; however, they are not necessarily the same as
the actual traffic distribution for any individual project.
7

8

2.0 RE-ANALYSIS OF THE 1996 DATA
2.1 The 1996 Study
In 1996, Caltrans undertook a study to compare the economic benefits of conventional
asphalt concrete (AC) overlay rehabilitation to longer life Portland cement concrete (PCC)
overlays (9). The study used basic LCCA principles in an Excel spreadsheet and was based on
the principle that the justification of using a long life pavement (LLP) strategy would be driven
by the implicit or real user cost savings that resulted from avoiding user delays and coincident
vehicle costs.
2.1.1 Input
Data were obtained from existing projects at the time, the 1995 Caltrans Highway
Congestion Management Plan (HICOMP) and interviews with Caltrans staff.
The following assumptions were made for input:
• Treatments: thick PCC overlay versus multiple AC Overlays
• Analysis period: 35 years (salvage value included in analysis)
• Congestion period: assumed to increase by 50 percent during construction
• User costs: $7.20/hour/vehicle, $25.00/hour/truck
• Initial lane mile costs per mile:
· AC overlay $250,000
· PCC Long-Life $600,000
• Lane mile costs per mile for additional M&R:
9

· AC Overlay: thin blanket, year 10, $15,000;
routine maintenance, year 18, $12,000;
AC overlay, year 21, $250,000;
routine maintenance, year 28, $15,000;
thin blanket, year 32, $25,000
· PCC Long-Life: joint seal, year 8, $12,000;
CAPM, year 20, $85,000;
CAPM, year 28, $85,000
• Site Locations as examples for each AADT:
· 220,000/10% trucks: LA 5 (San Bernardino Fwy to Ventura Fwy)
· 200,000/10% trucks: LA 710 (Long Beach to I-5)
· 150,000/10% trucks: Sacramento 99 (Florin Rd to Rte 50)
· 100,000/12% trucks: San Bernardino 10 (Rte 38 to Yucaipa Blvd)
· 50,000/20% trucks: San Joaquin 5 (Hammer Ln to Pocket Rd)
• Traffic delay was estimated separately for each individual project, and calculated
using a simple formula based only on change of traffic speed (miles per hour) through
the work zone, as follows:
AADT AC overlay PCC Long-Life 220,000 45 to 25 45 to 25 200,000 45 to 25 45 to 25 150,000 50 to 30 60 to 35 100,000 55 to 35 55 to 35 50,000 60 to 60 60 to 35
• Traffic delay through the work zone for AC overlay was calculated directly from the
assumed speed changes, and applied to assumed congested hours per day. The
number of congested hours per day was assumed to be the same for both PCC long-
10

life and AC overlay construction, meaning that differences in traffic delay between
55-hour weekend closures for PCC long-life and weeknight closures for AC overlays
were not considered. It was assumed that there would be no queuing, only two lanes
would be affected by the traffic speed change, and the change of speed in the work
zone had an influence on vehicle operating costs (9).
• Traffic delays were only assumed for the initial construction, and for AC overlays,
with all other M&R activities having no delay cost. Traffic delay costs per day were
multiplied by the assumed number of construction work days for each project and
strategy as follows:
AADT AC overlay PCC Long-Life 220,000 40 100 200,000 45 100 150,000 45 100 100,000 75 100 50,000 75 100
2.1.2 Results
The study found that for AADT above about 150,000 and/or truck traffic higher than
about 15,000 vehicles per day, user costs were dominant in strategy selection and long-life
pavement designs typically had lower lifecycle costs than conventional designs. For traffic
volumes below 150,000 AADT, conventional AC overlay strategies had lower lifecycle costs.
2.2 Re-analysis with RealCost
2.2.1 Input Data
The 1996 study was re-analyzed using RealCost. The data used in the 1996 study was
used as input and RealCost defaults were used for those aspects not included in the original
study, except as described below.
11

Traffic delay in construction work zone closures was calculated using the HCM-based
simple model in RealCost. The use of 24-hour-per-day weekday closures was assumed for both
the AC overlay and PCC long-life strategies to provide a common baseline. Vehicle operating
costs were not considered.
Input data is summarized in Table 1. The agency costs for the two alternatives are very
similar and consequently have little influence on the total cost in contrast to the user cost.
Table 1 Input Data for Re-analysis with RealCost, Analysis Options Parameter Values used Comment
Discount rate (%) Annual average daily traffic (‘000s) Truck traffic (%) for AADTs above Annual traffic growth (%) Free flow capacity (v/hr/lane) Work zone capacity (v/hr/lane) Free flow speed (mph) Work zone speed (mph) Queue dissipation capacity (v/hr/ln) User time value - car ($/hr) User time - single unit truck ($/hr) User time - combination truck ($/hr)
4 50, 100, 150, 200, 220 10, 10, 10, 12, 20 2.625 2,000 1,000 60 35 1,500 and 2,000 7.20 25.00 25.00
RealCost default RealCost default RealCost default
2.2.2 Results
The results of the re-analysis of the 1996 study data are presented in Table 2. The long
life Portland cement concrete strategy is clearly the lower cost option for all five of the traffic
scenarios when compared with the multiple asphalt concrete overlay strategy. This contradicts
the findings of the 1996 study discussed in the previous section, because of the difference in the
traffic delay calculations, and the assumption of 24-hour-per-day weekday closures for both
alternatives. The results confirm that user costs have increasing influence on total user costs as
AADT increases.
12
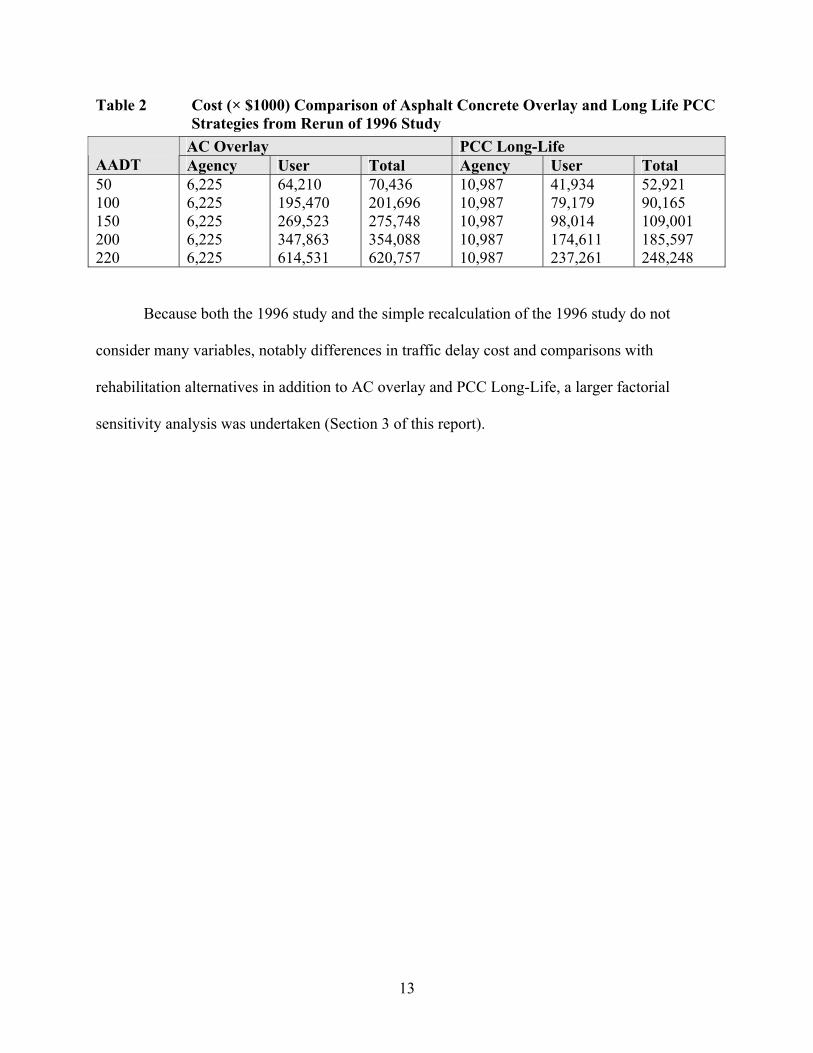
Table 2 Cost (× $1000) Comparison of Asphalt Concrete Overlay and Long Life PCC Strategies from Rerun of 1996 Study
AC Overlay PCC Long-Life AADT Agency User Total Agency User Total 50 100 150 200 220
6,225 6,225 6,225 6,225 6,225
64,210 195,470 269,523 347,863 614,531
70,436 201,696 275,748 354,088 620,757
10,987 10,987 10,987 10,987 10,987
41,934 79,179 98,014 174,611 237,261
52,921 90,165 109,001 185,597 248,248
Because both the 1996 study and the simple recalculation of the 1996 study do not
consider many variables, notably differences in traffic delay cost and comparisons with
rehabilitation alternatives in addition to AC overlay and PCC Long-Life, a larger factorial
sensitivity analysis was undertaken (Section 3 of this report).
13

14

3.0 FACTORIAL SENSITIVITY ANALYSIS
A RealCost LCCA was carried out on various scenarios to supplement the 1996 analysis.
Data from recently completed projects were used. Certain RealCost defaults were used if
accurate California specific data could not be obtained. It should be noted that although actual
costs were used where possible, the study remained largely hypothetical because of lack of
project specific data. There is a low probability that a real project would have exactly similar
combinations of variables as those used for these calculations. Due to the exponential increase in
the number of RealCost analyses each time a variable is added, the study was also limited to
those variables selected. Project specific studies will therefore provide a more realistic output
than that obtained from this study, although this study provides an indication of trends in
lifecycle cost between long-life and conventional rehabilitation alternatives with respect to the
variables included in the analysis, assuming that the input data used is realistic.
3.1 Experiment Design
The study was based on a partial factorial design. Components of this design included:
• Three traffic scenarios (100,000, 150,000, and 250,000 AADT)
• Two centerline lengths (4 and 12 miles)
• Three different lane configurations (6, 8, and 10: total number of lanes in both
directions)
• Two different long life pavement rehabilitation strategies (AC and PCC)
• Up to three conventional rehabilitation strategies for each underlying pavement type
(flexible or rigid).
15

Within each conventional rehabilitation strategy, an assumed lifecycle of activities was
evaluated. Each activity within that strategy had its own assumed serviceable life. It was also
assumed that rehabilitation strategies were carried out on a timely basis and that interventions
took place before the condition of the pavement deteriorated to poor or very poor condition. Two
types of closure were considered: 8-hour night time for conventional rehabilitation strategies and
24-hour continuous for long-life strategies.
This resulted in an initial factorial of 180 cells, which was reduced to a partial factorial
design of 140 cells by excluding the following unrealistic combinations:
• The 10 lane option for the 100,000 AADT scenario
• The 6 lane option for the 250,000 AADT scenario
For each run, the agency, user, and total costs (in present worth) were calculated for both
alternatives. Variations to check the sensitivity of the analysis to certain inputs were also
considered. These are discussed in more detail in Section 3.4.
3.2 Input Data—Baseline Study
The input data used in this study is summarized in Tables 3–7. Cost data for conventional
rehabilitation activities were obtained from construction and maintenance records averaged over
five years, published by Caltrans (10). There was a great deal of variability in the cost per lane-
mile of many activities during this period. Construction durations for each conventional
rehabilitation activity were estimated by experienced Caltrans Construction Division staff as
there is currently no database of construction durations available for Caltrans projects. The
construction durations for the LLP strategies were based on data from the recent LLP
16

Table 3 Input Data for RealCost LCCA, Analysis Options
17
Parameter Values used CommentAnalysis period Start year of Analysis Period Discount rate (%) Truck traffic (%) Annual traffic growth (%) Free flow capacity (v/hr/lane)* Free flow speed (mph)* Queue dissipation capacity (v/hr/lane)* User time value - car ($/hr) User time - single unit truck ($/hr) User time - combination truck ($/hr)
35 2005 4 10 2 2,000 65 1,750 7.20 25.00 25.00
See discussion in Section 1 - Rate recommended in Highway Design Manual - - - - - RealCost default RealCost default RealCost default
*Capacity, speed, and queue dissipation for this study were based on the assumption of a morning peak in one direction and an afternoon peak in the opposite direction. It should be noted that on many highways in California, morning and afternoon peaks occur in both directions. Traffic delay costs for LLP projects used weekday traffic patterns, not weekend patterns Table 4 Input Data for RealCost LCCA, Rehabilitation and Maintenance Activities
Option Existing Pavement Description
OG-ACOL ACOL flex PCC overlay LLP-1 AC LLP-2 PCC ACOL rigid PCC grind PCC slab (5%) PCC slab (10%)
AC AC AC AC, PCC AC, PCC PCC PCC PCC PCC
Open graded asphalt concrete (AC) overlay, for noise and spray reduction, mostly in urban areas AC overlay and inner membranes on existing flexible pavement PCC overlay on rigid or flexible pavement AC pavement intended to last at least 35 years between rehabilitation treatments PCC pavement intended to last at least 35 years between rehabilitation treatments AC overlay and inner membranes on existing rigid pavement Removing irregularities in the surface to improve ride quality PCC slab replacement - 5% of all slabs replaced PCC slab replacement - 10% of all slabs replaced

Table 5 Input Data for RealCost LCCA, Activity Costs and Construction Durations Parameters
Option
Workdays 8-hr nighttime closure 4 lane-miles
Workdays 24-hr closure across 72-hour weekdays 4 lane-miles
Agency cost/lane mile ($)
OG-ACOL ACOL flex1
PCC overlay2
LLP-1 AC LLP-2 PCC* ACOL rigid3
PCC grind PCC slab (5%) PCC slab (10%)
1.0 2.5 22.0 - - 4.5 12.0 7.5 15.0
- - - 5,04
9.05
- - -
32,970 233,770 918,460 1,280,000 1,600,000 348,490 150,460 71,632 143,264
1 ACOL flex construction productivity assumes 3-in. overlay 2 ACOL rigid assumes crack and seat, leveling course, fabric interlayer and 3-in. overlay 3 PCC overlay assumes continuous 10-in. rapid strength concrete with no grade adjustment
18
4 LLP Option 2 only rehabilitates two truck lanes per direction 5 LLP Options require a continuous 24-hour closure for initial construction. Thereafter maintenance is on 8-hour nighttime closures.
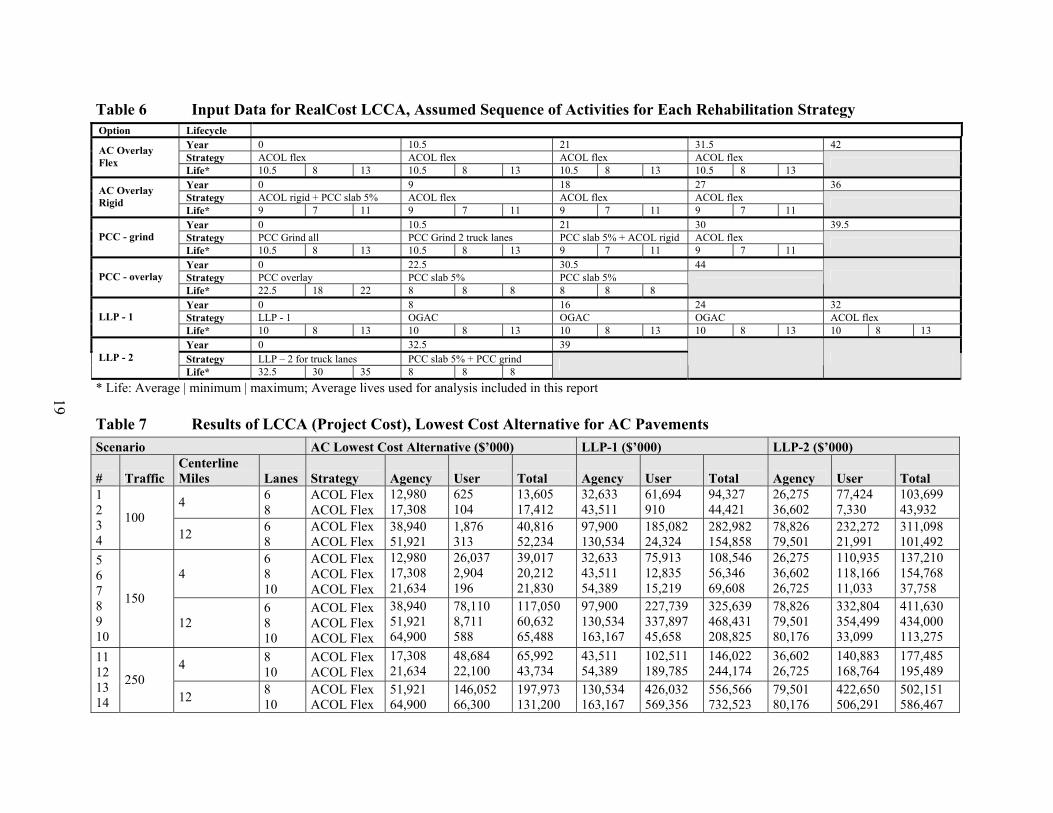
Table 6 Input Data for RealCost LCCA, Assumed Sequence of Activities for Each Rehabilitation Strategy
19
Option LifecycleYear 0 10.5 21 31.5 42Strategy ACOL flex ACOL flex ACOL flex ACOL flex AC Overlay
Flex Life* 10.5 8 13 10.5 8 13 10.5 8 13 10.5 8 13
Year 0 9 18 27 36Strategy ACOL rigid + PCC slab 5% ACOL flex ACOL flex ACOL flex AC Overlay
Rigid Life* 9 7 11 9 7 11 9 7 11 9 7 11
Year 0 10.5 21 30 39.5Strategy PCC Grind all PCC Grind 2 truck lanes PCC slab 5% + ACOL rigid ACOL flex PCC - grind Life* 10.5 8 13 10.5 8 13 9 7 11 9 7 11
Year 0 22.5 30.5 44Strategy PCC overlay PCC slab 5% PCC slab 5% PCC - overlay Life* 22.5 18 22 8 8 8 8 8 8
Year 0 8 16 24 32Strategy LLP - 1 OGAC OGAC OGAC ACOL flex LLP - 1 Life* 10 8 13 10 8 13 10 8 13 10 8 13 10 8 13Year 0 32.5 39Strategy LLP – 2 for truck lanes PCC slab 5% + PCC grind LLP - 2 Life* 32.5 30 35 8 8 8
* Life: Average | minimum | maximum; Average lives used for analysis included in this report
Table 7 Results of LCCA (Project Cost), Lowest Cost Alternative for AC Pavements Scenario AC Lowest Cost Alternative ($’000) LLP-1 ($’000) LLP-2 ($’000)
# Traffic Centerline Miles Lanes Strategy Agency User Total Agency User Total Agency User Total
4 6 8
ACOL Flex ACOL Flex
12,980 17,308
625 104
13,605 17,412
32,633 43,511
61,694 910
94,327 44,421
26,275 36,602
77,424 7,330
103,699 43,932
1 2 3 4
100 12 6
8 ACOL Flex ACOL Flex
38,940 51,921
1,876 313
40,816 52,234
97,900 130,534
185,082 24,324
282,982 154,858
78,826 79,501
232,272 21,991
311,098 101,492
4 6 8 10
ACOL Flex ACOL Flex ACOL Flex
12,980 17,308 21,634
26,037 2,904 196
39,017 20,212 21,830
32,633 43,511 54,389
75,913 12,835 15,219
108,546 56,346 69,608
26,275 36,602 26,725
110,935 118,166 11,033
137,210 154,768 37,758
5 6 7 8 9 10
150
12 6 8 10
ACOL Flex ACOL Flex ACOL Flex
38,940 51,921 64,900
78,110 8,711 588
117,050 60,632 65,488
97,900 130,534 163,167
227,739 337,897 45,658
325,639 468,431 208,825
78,826 79,501 80,176
332,804 354,499 33,099
411,630 434,000 113,275
4 8 10
ACOL Flex ACOL Flex
17,308 21,634
48,684 22,100
65,992 43,734
43,511 54,389
102,511 189,785
146,022 244,174
36,602 26,725
140,883 168,764
177,485 195,489
11 12 13 14
250 12 8
10 ACOL Flex ACOL Flex
51,921 64,900
146,052 66,300
197,973 131,200
130,534 163,167
426,032 569,356
556,566 732,523
79,501 80,176
422,650 506,291
502,151 586,467
reconstruction projects on I-710 and I-15, on which intensive construction productivity data was
collected by the PRC.
The conventional strategy called Concrete Pavement Restoration (CPR) in Reference (10)
was not included in the analysis because the lack of detail as to which activities are included for
different projects made it too difficult to estimate the lives.
The costs associated with long life pavement projects were based on construction data
obtained from Caltrans from the recent I-80 and I-710 reconstruction projects and include cost
multipliers considering pavement and non-pavement items obtained from a study by the
Partnered Pavement Research Center to assess costs of recent long life pavement projects (11,
12). Therefore, the comparative costs between the two LLP strategies are based on one project
only for AC and PCC pavements, each with its own special conditions and thus these values and
the relative costs of the two types of LLP strategy should absolutely not be assumed to be
representative of other projects. They should only be used to obtain a general trend of LLP
strategies versus conventional strategies. Also, cost multipliers for non-pavement items that may
be included in conventional rehabilitation strategies were not included in the analyses because of
lack of data.
Discussions with Caltrans Maintenance Division staff indicated that conventional
rehabilitation costs from the 2003 State of the Pavement Report (10) and the LLP costs contain
similar scope (include all costs paid to the contractor for the work and no Caltrans internal
overhead and engineering costs). Maintenance staff also indicated that where several
conventional rehabilitation types are performed within a given project, the costs of all of the
rehabilitation types in that project are summed together and categorized in the State of the
Pavement report according to the type with the greatest cost. The summed cost is then divided by
20
the total project lane-miles to find the cost per lane-mile. This approach is used for expediency
because of the large amount of time necessary to separate out individual items within a contract.
This practice may explain some of the variability from year to year of different rehabilitation
treatments as reported in the State of the Pavement Report.
Eight-hour weeknight closures were assumed for conventional rehabilitation strategies,
and 72-hour continuous weekday closures were assumed for LLP strategies. Traffic closure
sequences were assumed for the LLP alternatives based on experience to date. These may vary
significantly from project to project, based on site-specific traffic demand and the availability of
shoulders for traffic use.
A major shortcoming of the analyses included in this study is the need to assume the lives
of various conventional rehabilitation activities (Table 7) even on average for the entire state,
due to lack of availability of performance data. The lives (duration of serviceable use) of AC
overlays on flexible and rigid pavements were estimated based on average values from 1978 to
1992 (13). The lives of other conventional activities were estimated based on anecdotal
observation. The effects of different traffic volumes could not be considered in estimating
average lives of conventional activities because of the lack of data.
The effects of existing pavement condition also could not be considered in the analysis
because it would lead to a significant number of variables in the analysis, with many
combinations that are not realistic. These assumptions again emphasize that only general trends
can be obtained from factorial analyses such as those presented in this report, and that lifecycle
cost analysis to select the most cost-effective rehabilitation strategy should be done for each
project using the specific information for that project.
21

3.3 Results
The lowest project cost alternative of each option detailed in Table 5 for the rehabilitation
of AC and PCC pavements are summarized in Table 8 and Table 9 respectively for each traffic
volume. The costs of both LLP options are also provided in each table for comparative purposes.
All costs are recalculated for AC and PCC pavements as lane mile costs in Tables 9 and 10,
respectively. The results of the lowest cost alternative for each pavement type from each table
are illustrated in Figures 1–4.
Care should be taken in interpreting the results, given that the scenarios are hypothetical
highways and not project specific. Although input data were based on actual project costs and
experience, specific details with regard to engineering design have not been accommodated.
3.3.1 Asphalt Concrete Pavements
The results of the LCCA on the 14 closure scenarios indicate that:
• The asphalt overlay flexible pavement rehabilitation strategy with periodic asphalt
concrete overlays was the lowest total cost alternative for all fourteen scenarios.
• The next lowest alternatives were in all instances significantly more costly than the
lowest alternative and will not be discussed further. This confirms the need to
undertake quality LCCA for each project undertaken.
• The cost of the lowest long-life pavement option was at least double the cost of the
cheapest alternative.
• For the LLP-1 option, agency costs were 2.5 times higher than the cost of the
cheapest alternative, while for the LLP-2 option, agency costs varied between 1.2 and
2.1 times higher. The difference in agency costs between the cheapest alternative and
the LLP-2 option reduced with increasing traffic and number of lanes.
22
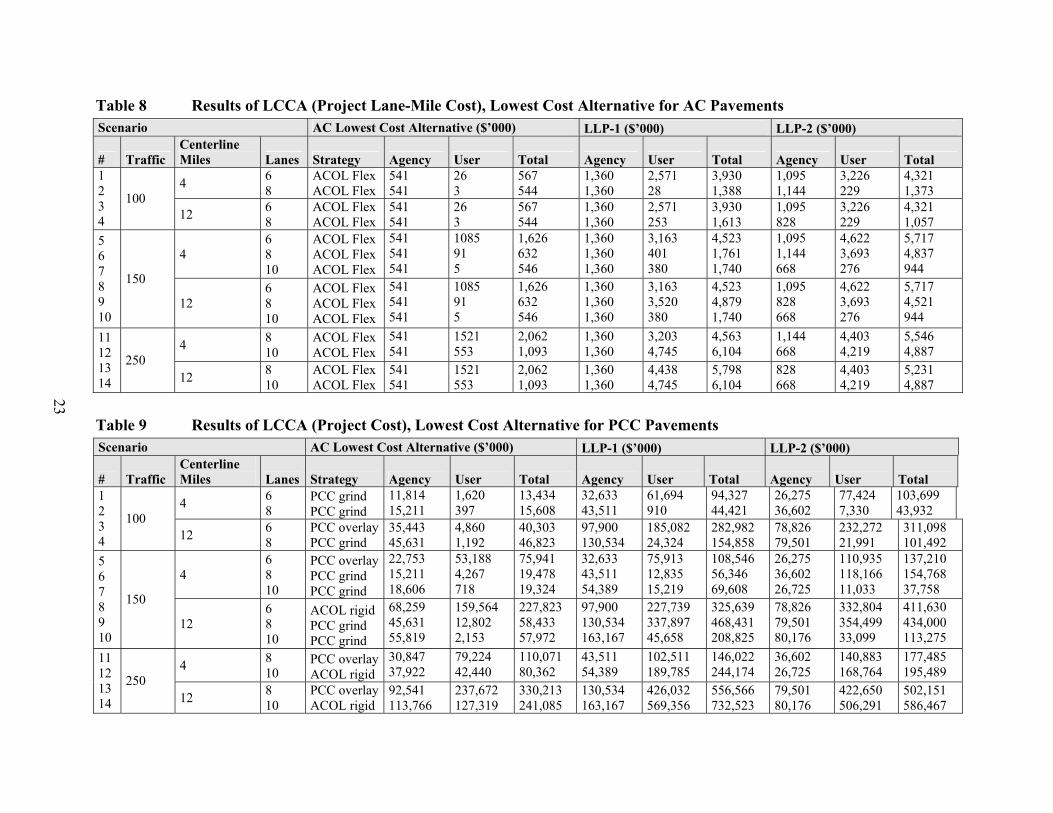
Table 8 Results of LCCA (Project Lane-Mile Cost), Lowest Cost Alternative for AC Pavements Scenario AC Lowest Cost Alternative ($’000) LLP-1 ($’000) LLP-2 ($’000)
# Traffic Centerline Miles Lanes Strategy Agency User Total Agency User Total Agency User Total
4 6 8
ACOL Flex ACOL Flex
541 541
26 3
567 544
1,360 1,360
2,571 28
3,930 1,388
1,095 1,144
3,226 229
4,321 1,373
1 2 3 4
100 12 6
8 ACOL Flex ACOL Flex
541 541
26 3
567 544
1,360 1,360
2,571 253
3,930 1,613
1,095 828
3,226 229
4,321 1,057
4 6 8 10
ACOL Flex ACOL Flex ACOL Flex
541 541 541
1085 91 5
1,626 632 546
1,360 1,360 1,360
3,163 401 380
4,523 1,761 1,740
1,095 1,144 668
4,622 3,693 276
5,717 4,837 944
5 6 7 8 9 10
150
12 6 8 10
ACOL Flex ACOL Flex ACOL Flex
541 541 541
1085 91 5
1,626 632 546
1,360 1,360 1,360
3,163 3,520 380
4,523 4,879 1,740
1,095 828 668
4,622 3,693 276
5,717 4,521 944
4 8 10
ACOL Flex ACOL Flex
541 541
1521 553
2,062 1,093
1,360 1,360
3,203 4,745
4,563 6,104
1,144 668
4,403 4,219
5,546 4,887
11 12 13 14
250 12 8
10 ACOL Flex ACOL Flex
541 541
1521 553
2,062 1,093
1,360 1,360
4,438 4,745
5,798 6,104
828 668
4,403 4,219
5,231 4,887
23
Table 9 Results of LCCA (Project Cost), Lowest Cost Alternative for PCC Pavements Scenario AC Lowest Cost Alternative ($’000) LLP-1 ($’000) LLP-2 ($’000)
# Traffic Centerline Miles Lanes Strategy Agency User Total Agency User Total Agency User Total
4 6 8
PCC grind PCC grind
11,814 15,211
1,620 397
13,434 15,608
32,633 43,511
61,694 910
94,327 44,421
26,275 36,602
77,424 7,330
103,699 43,932
1 2 3 4
100 12 6
8 PCC overlayPCC grind
35,443 45,631
4,860 1,192
40,303 46,823
97,900 130,534
185,082 24,324
282,982 154,858
78,826 79,501
232,272 21,991
311,098 101,492
4 6 8 10
PCC overlayPCC grind PCC grind
22,753 15,211 18,606
53,188 4,267 718
75,941 19,478 19,324
32,633 43,511 54,389
75,913 12,835 15,219
108,546 56,346 69,608
26,275 36,602 26,725
110,935 118,166 11,033
137,210 154,768 37,758
5 6 7 8 9 10
150
12 6 8 10
ACOL rigid PCC grind PCC grind
68,259 45,631 55,819
159,564 12,802 2,153
227,823 58,433 57,972
97,900 130,534 163,167
227,739 337,897 45,658
325,639 468,431 208,825
78,826 79,501 80,176
332,804 354,499 33,099
411,630 434,000 113,275
4 8 10
PCC overlayACOL rigid
30,847 37,922
79,224 42,440
110,071 80,362
43,511 54,389
102,511 189,785
146,022 244,174
36,602 26,725
140,883 168,764
177,485 195,489
11 12 13 14
250 12 8
10 PCC overlayACOL rigid
92,541 113,766
237,672 127,319
330,213 241,085
130,534 163,167
426,032 569,356
556,566 732,523
79,501 80,176
422,650 506,291
502,151 586,467
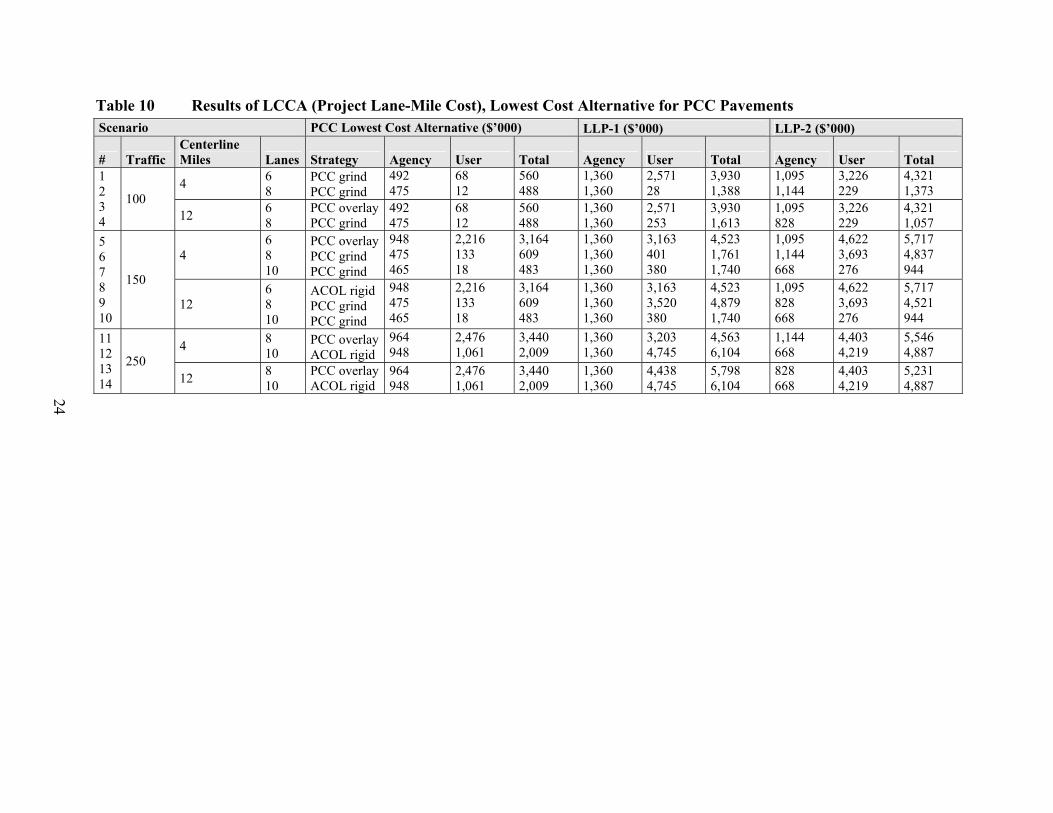
Table 10 Results of LCCA (Project Lane-Mile Cost), Lowest Cost Alternative for PCC Pavements Scenario PCC Lowest Cost Alternative ($’000) LLP-1 ($’000) LLP-2 ($’000)
# Traffic Centerline Miles Lanes Strategy Agency User Total Agency User Total Agency User Total
4 6 8
PCC grind PCC grind
492 475
68 12
560 488
1,360 1,360
2,571 28
3,930 1,388
1,095 1,144
3,226 229
4,321 1,373
1 2 3 4
100 12 6
8 PCC overlayPCC grind
492 475
68 12
560 488
1,360 1,360
2,571 253
3,930 1,613
1,095 828
3,226 229
4,321 1,057
4 6 8 10
PCC overlayPCC grind PCC grind
948 475 465
2,216 133 18
3,164 609 483
1,360 1,360 1,360
3,163 401 380
4,523 1,761 1,740
1,095 1,144 668
4,622 3,693 276
5,717 4,837 944
5 6 7 8 9 10
150
12 6 8 10
ACOL rigid PCC grind PCC grind
948 475 465
2,216 133 18
3,164 609 483
1,360 1,360 1,360
3,163 3,520 380
4,523 4,879 1,740
1,095 828 668
4,622 3,693 276
5,717 4,521 944
4 8 10
PCC overlayACOL rigid
964 948
2,476 1,061
3,440 2,009
1,360 1,360
3,203 4,745
4,563 6,104
1,144 668
4,403 4,219
5,546 4,887
11 12 13 14
250 12 8
10 PCC overlayACOL rigid
964 948
2,476 1,061
3,440 2,009
1,360 1,360
4,438 4,745
5,798 6,104
828 668
4,403 4,219
5,231 4,887 24

0
100
200
300
400
500
600
700
1LL
P1 2LL
P2 3LL
P1 4LL
P2 5LL
P1 6LL
P1 7LL
P2 8LL
P1 9LL
P2 10LL
P2 11LL
P1 12LL
P2
Scenario (Table 7)
Proj
ect C
ost (
$mill
ion)
13LL
P2 14LL
P2
Agency User Total
Figure 1. Lowest cost alternatives compared to lowest cost LLP for AC pavements, project cost.
0
1
2
3
4
5
6
1LL
P1 2LL
P2 3LL
P1 4LL
P2 5LL
P1 6LL
P1 7LL
P2 8LL
P1 9LL
P2 10LL
P2 11LL
P1 12LL
P2
Scenario (Table 7)
Lan
e-M
ile C
ost (
$mill
ion)
13LL
P2 14LL
P2
Agency User Total
Figure 2. Lowest cost alternatives compared to lowest cost LLP for AC pavements, lane-mile cost.
25

0
100
200
300
400
500
600
700
1LL
P1 2LL
P2 3LL
P1 4LL
P2 5LL
P1 6LL
P1 7LL
P2 8LL
P1 9LL
P2 10LL
P2 11LL
P1 12LL
P2
Scenario (Table 7)
Proj
ect C
ost (
$mill
ion)
13LL
P2 14LL
P2
Agency User Total
Figure 3. Lowest cost alternatives compared to lowest cost LLP for PCC pavements, project cost.
0
1
2
3
4
5
6
1LL
P1 2LL
P2 3LL
P1 4LL
P2 5LL
P1 6LL
P1 7LL
P2 8LL
P1 9LL
P2 10LL
P2 11LL
P1 12LL
P2
Scenario (Table 7)
Lan
e-M
ile C
ost (
$mill
ion)
13LL
P2 14LL
P2
Agency User Total
Figure 4. Lowest cost alternatives compared to lowest cost LLP for PCC pavements, lane-mile cost.
26

• Road user costs varied between 3 and 100 and between 3 and 124 times the costs of
those of the cheapest alternative for the LLP-1 and LLP-2 options respectively.
• The difference between the LLP-1 option and the cheapest alternative remained
constant, while the difference between the LLP-2 option and the cheapest alternative
reduced with increasing traffic, project distance and number of lanes, with agency
costs having the biggest influence. The reason for this is that as the total number of
lanes increases, the cost of LLP-1 to rehabilitate all lanes increases proportionally,
while the cost of the LLP-2, which only rehabilitates the outer two truck lanes,
remains fairly constant.
• The results do not compare with the 1996 study results in that both LLP options are
still significantly more costly than the cheapest conventional rehabilitation
alternative, regardless of traffic. This was attributed to the use of more realistic data
and more thorough analysis using the RealCost LCCA software. The biggest
influence attributed to the higher costs of the LLP options appears to be related to 24-
hour continuous closures, compared to the 8-hour night time closures used for the
conventional rehabilitation strategies. No traffic reduction through Traffic
Management Plans was considered in this baseline study.
3.3.2 Portland Cement Concrete Pavements
The results of the LCCA on the 14 PCC pavement scenarios indicate that:
• The PCC grind strategy was the lowest cost alternative in 7 of the 14 scenarios. The
PCC overlay was lowest in 4 of the scenarios, typically in projects with fewer lanes.
The AC overlay for rigid pavements was the lowest alternative in the remaining three
27

scenarios, two of which were those projects with highest traffic and highest number
of lanes.
• The agency cost of the LLP-2 option was cheaper than the agency cost of the lowest
total cost alternative for three of 14 scenarios, all of which had the highest traffic
level.
• The next lowest alternatives were in all instances significantly more costly than the
lowest alternative and will not be discussed further.
• The cost of the cheapest LLP option was in most instances at least double the cost of
the cheapest alternative for the 100,000 and 150,000 traffic scenarios. For the 250,000
AADT traffic scenario, the difference reduced to 1.3 times more costly.
• For the LLP-1 option, agency costs were between 1.4 and 2.9 times higher than the
cheapest alternative, while the LLP-2 option varied between being 1.4 times cheaper
than the selected alternative (higher traffic/higher lane numbers) to 2.4 times more
expensive than the cheaper alternative.
• Road user costs varied between 1.3 and 37.8 times higher than the user costs of the
cheapest alternative, while for the LLP-2 alternative, the costs were between 1.8 and
47.4 times higher. The difference between the LLP options and the cheapest
alternative were generally less for higher traffic/higher lane numbers than for lower
traffic/lower lane numbers.
• The results do not compare with the 1996 study results for the same reasons cited in
Section 3.3.1. No traffic reduction through Traffic Management Plans was considered
in this baseline study.
28

3.4 Other Considerations
The initial analysis discussed above revealed that the long-life pavement options were in
most instances significantly more expensive than a conventional rehabilitation strategy with both
agency and users costs affecting the result. However, it should again be noted that the analyses
are largely hypothetical and that the use of project specific data will probably provide
significantly different results. In order to assess the sensitivity of the process to various factors, a
number of refinements were made to the input data and the files re-run with RealCost. These
changes and the results are discussed below. While these are still hypothetical cases, they
identify trends in change of costs with changes in input variables.
3.4.1 Traffic Refinements
Given that user costs tend to dominate the output in most of the scenarios, two additional
analyses were carried out to monitor the impact of different lane closure strategies on the two
LLP options. The first entailed a scenario that assumes 25 percent less AADT during weekends
and a single widely spread peak hour in the early afternoon (approximately 1:00 PM to 4:00
PM). The second accommodates the implementation of a Traffic Management Plan that assumes
a 15 per1cent reduction in AADT during weekday closures, but maintains the normal double
AM/PM peak traffic pattern. A comparison of these two alternatives with the originals is
summarized as lane mile cost in Table 11 and Figures 5 (LLP-1) and 6 (LLP-2).
The results indicate that the user costs in both LLP options are sensitive to refinements.
In this analysis, user costs in both the weekend allowance and the traffic management plan
refinements were lower than the original with the weekend allowance showing the largest
reduction in costs. The difference generally increased with increasing traffic and number of
29

Table 11 Comparison of Normal, Weekend, and Weekday Traffic Management Plan (Lane-Mile Cost)
Scenario Original 72-hour Weekdays ($’000)
55-hour Weekend Traffic ($’000)
72-hour Weekdays with 15% AADT Reduction (TMP) ($’000)
# Traffic Centerline Miles Lanes Strategy Agency User Total Agency User Total Agency User Total
1 6 LLP-1 LLP-2
1,360 1,095
2,571 3,226
3,930 4,321
1,360 1,095
2,482 2,979
3,842 4,047
1,360 1,095
2,557 3,072
3,917 4,167
2 4
8 LLP-1 LLP-2
1,360 1,144
28 229
1,388 1,373
1,360 1,144
19 28
1,378 1,172
1,360 1,144
21 75
1,381 1,219
3 6 LLP-1 LLP-2
1,360 1,095
2,571 3,226
3,930 4,321
1,360 1,095
2,482 2,979
3,842 4,074
1,360 1,095
2,557 3,072
3,917 4,167
4
100
12 8 LLP-1
LLP-2 1,360 828
253 229
1,613 1,057
1,360 828
30 28
1,390 ,856
1,360 828
82 75
1,442 903
5 6 LLP-1 LLP-2
1,360 1,095
3,163 4,622
4,523 5,717
1,360 1,095
2,783 4,605
4,142 5,700
1,360 1,095
2,846 4,622
4,205 5,717
6 8 LLP-1 LLP-2
1,360 1,144
4,013 3,693
1,761 4,837
1,360 1,144
45 1,442
1,405 2,586
1,360 1,144
124 1,927
1,483 3,070
7
150 4
10 LLP-1 LLP-2
1,360 668
380 276
1,740 944
1,360 668
45 34
1,405 702
1,360 668
123 90
1,483 758
8 6 LLP-1 LLP-2
1,360 1,095
3,163 4,622
4,523 5,717
1,360 1,095
2,783 4,605
4,142 5,700
1,360 1,095
2,846 4,622
4,205 5,717
9 8 LLP-1 LLP-2
1,360 828
3,520 3,693
4,879 4,521
1,360 828
1,601 1,442
2,961 2,271
1,360 828
2,123 1,927
3,483 2,755
10
150 12
10 LLP-1 LLP-2
1,360 668
380 276
1,740 944
1,360 668
45 34
1,405 702
1,360 668
123 90
1,483 758
11 8 LLP-1 LLP-2
1,360 1,144
3,203 4,403
4,563 5,546
1,360 1,144
2,172 4,416
3,532 5,560
1,360 1,144
2,815 4,403
4,174 5,546
12 4
10 LLP-1 LLP-2
1,360 668
4,745 4,219
6,104 4,887
1,360 668
2,955 2,664
4,315 3,332
1,360 668
3,882 3,737
5,242 4,405
13 8 LLP-1 LLP-2
1,360 828
4,438 4,403
5,789 5,231
1,360 828
3,897 4,416
5,257 5,244
1,360 828
4,111 4,403
5,471 5,231
14
250
12 10 LLP-1
LLP-2 1,360 668
4,745 4,219
6,104 4,887
1,360 668
2,955 2,664
4,315 3,332
1,360 668
3,882 3,737
5,242 4,405
30

31
0
1
2
3
4
5
6
7
1 2 3 4 5 6 7 8 9 10 11 12 13Scenario (Table 11)
Lan
e-M
ile C
ost (
$mill
ion)
14
Original Agency Original User Original Total W/E Agency W/E User W/E Total TMP Agency TMP User
TMP Total
Figure 5. Comparison of traffic refinements for LLP-1, lane-mile cost.
32
0
1
2
3
4
5
6
7
1 2 3 4 5 6 7 8 9 10 11 12 13Scenario (Table 11)
Lan
e-M
ile C
ost (
$mill
ion)
14
Original Agency Original User Original Total W/E Agency W/E User W/E Total TMP Agency TMP User
TMP Total
Figure 6. Comparison of traffic refinements for LLP-2, lane-mile cost.
lanes. However, the user costs on both LLP options after refinement were still significantly
higher than the cheapest alternative discussed in the previous section using the very conservative
reductions in traffic included in this analysis.
The assumption of the weekend traffic pattern was conservative, and since much of
weekend traffic is discretionary for many project locations, a much greater traffic reduction may
occur during weekend closures. This was illustrated by the experience on the reconstruction of
the I-710 freeway at Long Beach where a well-developed traffic management plan and the ability
to use shoulders as traffic lanes resulted in almost no traffic delay during the 55-hour weekend
closures (7). A sophisticated traffic management plan used for the reconstruction of the I-15
freeway at Devore resulted in an approximate 40 percent reduction in weekday traffic during the
peak periods and thus reducing the traffic delay significantly more than was captured with the 15
percent reduction assumed in this analysis (8). However, the results in these two cases cannot be
assumed to be applicable to all project sites in the state, again pointing to the need for site-
specific lifecycle cost analysis for each project.
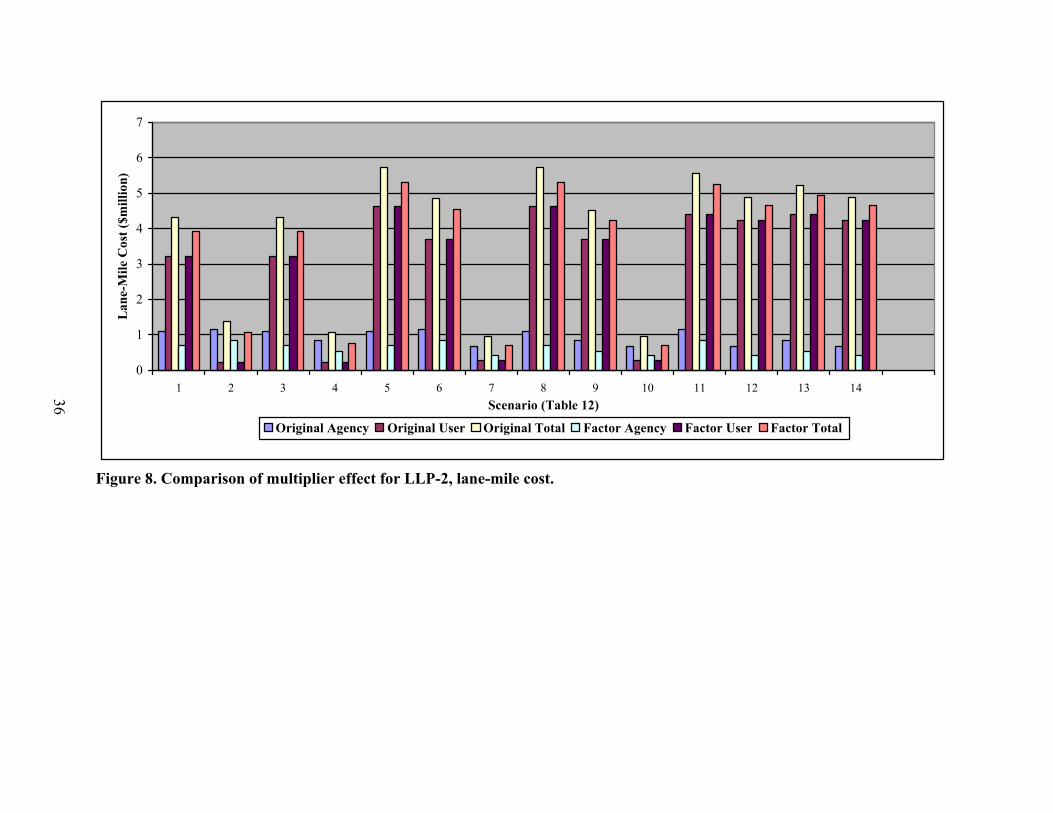
3.4.2 Non-pavement Related Multipliers
In the original analysis discussed in Section 3.3, non-pavement related multipliers were
included in the costs of the LLP options, but not in the costs of the conventional rehabilitation
options. In this refinement, the multiplier was subtracted from the cost of the LLP options in
order to assess its impact. The results of the comparison with the original analysis are listed in
Table 12 and illustrated in Figures 7 (LLP-1) and 8 (LLP-2).
33

Table 12 Comparison of Normal and Normal without Multiplier Factor (Lane-Mile Cost)
Scenario Original ($’000)
Minus Multiplier Factor ($’000)
# Traffic Centerline Miles Lanes Strategy Agency User Total Agency User Total
1 6 LLP-1 LLP-2
1,360 1,095
2,571 3,226
3,930 4,321
873 689
2,571 3,226
3,444 3,915
2 4
8 LLP-1 LLP-2
1,360 1,144
28 229
1,388 1,373
873 840
28 229
902 1,069
3 6 LLP-1 LLP-2
1,360 1,095
2,571 3,226
3,930 4,321
873 589
2,571 3,226
3,444 3,915
4
100
12 8 LLP-1
LLP-2 1,360 828
253 229
1,613 1,057
873 524
253 229
1,127 753
5 6 LLP-1 LLP-2
1,360 1,095
3,163 4,622
4,523 5,717
873 689
3,163 4,622
4,036 5,312
6 8 LLP-1 LLP-2
1,360 1,144
4,013 3,693
1,761 4,837
873 840
401 3,693
1,274 4,533
7
4
10 LLP-1 LLP-2
1,360 668
380 276
1,740 944
873 425
380 276
1,254 701
8 6 LLP-1 LLP-2
1,360 1,095
3,163 4,622
4,523 5,717
873 689
3,163 4,622
4,036 5,312
9 8 LLP-1 LLP-2
1,360 828
3,520 3,693
4,879 4,521
873 524
3,520 3,693
4,393 4,217
10
150
12
10 LLP-1 LLP-2
1,360 668
380 276
1,740 944
873 425
380 276
1,254 701
11 8 LLP-1 LLP-2
1,360 1,144
3,203 4,403
4,563 5,546
873 840
3,203 4,403
4,077 5,242
12 4
10 LLP-1 LLP-2
1,360 668
4,745 4,219
6,104 4,887
873 425
4,745 4,219
5,618 4,644
13 8 LLP-1 LLP-2
1,360 828
4,438 4,403
5,789 5,231
873 524
4,438 4,403
5,311 4,927
14
250
12 10 LLP-1
LLP-2 1,360 668
4,745 4,219
6,104 4,887
873 425
4,745 4,219
5,618 4,644
34

35
0
1
2
3
4
5
6
7
1 2 3 4 5 6 7 8 9 10 11 12 13Scenario (Table 12)
Lan
e-M
ile C
ost (
$mill
ion)
14
Original Agency Original User Original Total Factor Agency Factor User Factor Total
Figure 7. Comparison of multiplier effect for LLP-1, lane-mile cost.
36
0
1
2
3
4
5
6
7
1 2 3 4 5 6 7 8 9 10 11 12 13 14Scenario (Table 12)
Lan
e-M
ile C
ost (
$mill
ion)
Original Agency Original User Original Total Factor Agency Factor User Factor Total
Figure 8. Comparison of multiplier effect for LLP-2, lane-mile cost.

The results indicate a significant reduction in agency and hence total cost compared to the
original input. User costs are not affected for obvious reasons. Despite the reduction in agency
cost after taking the multiplier into consideration, the LLP options are still more costly with
respect to total cost when compared to the lowest cost alternative discussed in Section 3.3.
However, when only agency costs are compared, as shown in Table 13, the agency costs of one
or both of the LLP options without the multiplier are less than or similar to those of the
conventional rehabilitation strategy for 12 centerline miles and 8 and 10 lanes. These results
Table 13 Comparison of Agency Costs, LLP without Multiplier Factor and Lowest Cost Alternative Strategies (Lane-Mile Cost)
Scenario Agency Cost without Multiplier ($’000)
# Traffic Centerline Miles Lanes
LLP Strategy
Cost without Multiplier
PCC Pavement Strategy
Cost
AC Pavement Strategy
Cost
1 6 LLP-1 LLP-2
873 689 PCC Grind 492 AC Overlay
Flex 541
2 4
8 LLP-1 LLP-2
873 840 PCC Grind 475 AC Overlay
Flex 541
3 6 LLP-1 LLP-2
873 589 PCC Overlay 492 AC Overlay
Flex 541
4
100
12 8 LLP-1
LLP-2 873 524 PCC Grind 475 AC Overlay
Flex 541
5 6 LLP-1 LLP-2
873 689 PCC Overlay 948 AC Overlay
Flex 541
6 8 LLP-1 LLP-2
873 840 PCC Grind 475 AC Overlay
Flex 541
7
4
10 LLP-1 LLP-2
873 425 PCC Grind 465 AC Overlay
Flex 541
8 6 LLP-1 LLP-2
873 689
AC Overlay Rigid 948 AC Overlay
Flex 541
9 8 LLP-1 LLP-2
873 524 PCC Grind 475 AC Overlay
Flex 541
10
150
12
10 LLP-1 LLP-2
873 425 PCC Grind 465 AC Overlay
Flex 541
11 8 LLP-1 LLP-2
873 840 PCC Overlay 964 AC Overlay
Flex 541
12 4
10 LLP-1 LLP-2
873 425
AC Overlay Rigid 948 AC Overlay
Flex 541
13 8 LLP-1 LLP-2
873 524 PCC overlay 964 AC Overlay
Flex 541
14
250
12 10 LLP-1
LLP-2 873 425 ACOL rigid 948 AC Overlay
Flex 541
37

indicate that, for large projects, LLP options need to be seriously considered as a means of
reducing pavement lifecycle costs.
3.5 Project-Specific Sensitivity Analysis
Apart from the refinements discussed in the previous section, additional sensitivity
analyses were not attempted given that the scenarios are not project specific and numerous
assumptions were made in terms of data input. To continue with additional sensitivity analyses
leads to the creation of very detailed, yet completely hypothetical projects. They should,
however, be undertaken when project specific studies are carried out.
The trends shown in the sensitivity analyses presented in this report indicate that
considerations in project-specific sensitivity analyses should include:
• The condition of the existing pavement and its effect on the performance and cost of a
conventional rehabilitation. For example, badly cracked PCC slabs are not suitable
for PCC grinding, and will significantly shorten the life of AC overlays. For AC
pavements, thicker AC overlays will be required for high truck traffic conditions and
existing pavements in very poor condition. The construction productivity and
therefore the traffic delay and project cost will depend on the project-specific overlay
design.
• The extent to which traffic can be reduced and delay minimized during construction
through implementation of a Traffic Management Plan. This will depend on factors
such as:
· how much traffic demand is discretionary
· the presence of alternative routes and modes
· the ability to use shoulders as traffic lanes or construction access lanes
38

· the ability to widen the pavement to carry traffic during construction
· impacts of continuous closures on local business and residents
• The statement of work proposed for the project, and costs of non-pavement items
included in the project, which will control the pavement to non-pavement cost
multiplier. Multipliers should be considered for both LLP options and conventional
rehabilitation strategies. The multipliers include the costs of traffic handling for both
types of projects.
• The importance of the route and of minimizing future maintenance and rehabilitation
activities on the route.
For some projects, LLP options will be shown by lifecycle cost analysis to be more cost-
effective when project-specific conditions are considered. For example, on the I-15 Devore
project the existing slabs were so badly cracked and displaced in the outer truck lane that
grinding was not an option, and that an AC overlay would have had a short life. Cost calculations
for the agency cost for the project showed that long-life rigid rehabilitation was more cost-
effective.
The benefits to traffic of using a 55-hour weekend closures instead of weekday nighttime
closures, which are obvious for most Southern California freeways, were not as clear for the
Devore project because of its unique traffic patterns. Four construction closure scenarios were
compared from the perspective of construction schedule, traffic inconvenience, and agency costs:
• 72-hour weekday (Tuesday-Thursday),
• 55-hour weekend (Friday-Sunday),
• one-roadbed continuous (about 9 days), and
• 10-hour nighttime closures.
39

The CA4PRS model was used to estimate the total number and duration of closures for
each closure scenario. Traffic analysis was then performed for each closure scenario to calculate
total traffic delay and maximum delay (queue length) per closure, using a demand-capacity
spreadsheet model based on the Highway Capacity Manual with the hourly distributions of
freeway traffic data particular to each closure, very similar to the approach used in RealCost.
The total cost, calculated as the sum of the agency cost and cost of traffic delay caused by
construction, was used to select the most economical closure scenario. Table 14 shows the result
of the comprehensive comparison from the perspectives of schedule, traffic delay, and total cost
used to select the most economical closure scenario (8). The one-roadbed continuous closure
scenario was selected as the best candidate strategy in terms of agency, road user, and total costs.
The PCC long-life option with the continuous closure scenario requires 81 percent less
total closure time, 29 percent less road user cost due to traffic delay, and 28 percent less agency
cost for construction and traffic control compared to traditional 10-hour nighttime closures to
replace the concrete slabs in the outside truck lane. The traffic costs are based on the assumption
of a 20 percent reduction in traffic demand, which was made possible in part by the local
network configuration and nature of the traffic demand for this project location.
Table 14 Schedule, Delay, and Cost Comparison for Closure Scenarios for I-15 Devore
Rehabilitation Schedule Comparison Traffic Comparisona Cost Comparison
Closure Scenario Closure Number
Closure Hours
Traffic Delay Cost ($1000)
Peak Delay (Minute)
Agency Costb ($1000)
Total Costc ($1000)
1-Roadbed Continuous 72-Hour Weekday 55-Hour Weekend 10-Hour Nighttime
2 8
10 220
400512550
2,200
5,0005,000
10,0007,000
80508030
15,000 16,000 17,000 21,000
20,00021,00027,00028,000
a with assumption of 20 percent traffic demand reduction b Engineer’s re-estimate based on the unsuccessful first round of bid c Total cost = Traffic delay cost + Agency cost (per row)
40
4.0 CONCLUSIONS AND RECOMMENDATIONS
4.1 Conclusions
This brief study into the economic implications of rehabilitation strategies on high traffic
roads in California has emphasized the need for detailed lifecycle cost analysis for all projects
using project-specific information, based on the significant variation in total costs of the various
scenarios considered. The need for improved pavement performance data and construction
duration data has also been identified.
In a 1996 study, it was concluded that traffic delay costs dominate lifecycle costs and that
a PCC long-life option was more cost-effective than repeated AC overlays at AADT levels above
150,000 when considering total cost (agency cost and traffic delay cost). Traffic delay in that
study was based on assumed change of speed through the work zone and not traffic delay
analysis. Differences in traffic delay between 55-hour weekend closures for PCC long-life and
weeknight closures for AC overlays were also not considered in the study.
The 1996 data was reanalyzed using most of the same assumptions but using the simple
traffic delay calculations in RealCost, a software package developed by the Federal Highway
Administration. 24-hour-per-day closures for both PCC long-life and AC overlays, similar to
those used in the 1996 study, were used in this re-analysis. The long life Portland cement
concrete strategy was found to be clearly the lowest cost option for all five of the traffic
scenarios analyzed (AADT of 100,000 to 220,000) when compared with the multiple asphalt
concrete overlay strategy. This contradicts the findings of the original study, and is attributed to
the difference in the traffic delay calculations and the assumption of 24-hour-per-day weekday
closures for both alternatives. The results confirmed that user costs have increasing influence on
total user costs as AADT increases.
41
A new sensitivity study was then performed. This used a factorial experiment design that
considered both AC and PCC long-life strategies, more conventional rehabilitation strategies
instead of just conventional AC overlays, a new set of assumptions of the performance of
different alternatives and cost data from recently completed projects. “Typical” construction
productivities for the conventional rehabilitation measures were obtained from construction
experts, while productivities from two recent LLP projects were used for the long-life
alternatives. Certain RealCost defaults were used, particularly the assumed hourly traffic pattern,
which is “typical,” but does not represent the large variety of traffic patterns found in California.
It should be noted that although actual costs were used where possible, the study remained
largely hypothetical because of lack of project specific data. There is a low probability that a real
project would have exactly similar combinations of variables as those used for these calculations,
which were based on a variety of lane configurations and AADTs combined with 4- and 12-mile
centerline lengths.
In the baseline factorial sensitivity study, the long-life cost data included combined
pavement and non-pavement costs for recent long-life projects, and assumed 8-hour nighttime
closures for the conventional rehabilitation alternatives and 24-hour-per-day closures for the
long-life alternatives. The results contradicted the earlier findings, instead indicating that
conventional asphalt concrete overlays were the most cost-effective rehabilitation option for
existing asphalt pavements regardless of the traffic volume, while grinding, PCC overlays or AC
overlays were found to be the most cost-effective options for PCC pavements depending on
circumstances. The long-life pavement options were in all instances considerably more
expensive that the conventional strategy, with road user costs having a significant impact in all
scenarios. This discrepancy in findings between the earlier and current studies is attributed to the
42
use of more realistic data, more appropriate traffic analysis with the RealCost software package
and the significant impacts that 24-hour continuous closures and higher up-front agency costs
have on the total cost of the long-life alternatives.
Two additional analyses were carried out to assess the impact of different lane closure
strategies on the two LLP options. While these are still hypothetical cases, they identified trends
that result in change of costs with changes in input variables. The first entailed a scenario that
assumed 25 percent less AADT during weekends and a single widely spread peak hour in the
early afternoon (approximately 1:00 PM to 4:00 PM). The second assumed the implementation
of a Traffic Management Plan that assumes a 15 percent reduction in AADT during weekday
closures, but maintains the normal double AM/PM peak traffic pattern. A comparison of these
two alternatives with the originals still showed that the conventional rehabilitation alternatives
had lower total costs than the long-life alternatives, although the results were somewhat closer,
particularly as the number of lanes and the AADT increased.
A third additional analysis was performed in which the original traffic closure
assumptions were maintained, but the non-pavement item multiplier was removed from the long-
life costs. This permitted a comparison with just pavement costs for both the conventional and
long-life alternatives. The results indicated a significant reduction in agency and hence total cost.
Despite the reduction in agency cost (but using baseline traffic delay assumptions) after taking
the multiplier into consideration, the LLP options are still more costly with respect to total cost
when compared to the lowest cost conventional rehabilitation alternative. However, when only
agency costs were compared, the agency costs of one or both of the LLP options without the
multiplier are less than or similar to those of the conventional rehabilitation strategy for 12
centerline miles and 8 and 10 lanes.
43

All of the analyses presented in this report used hypothetical data that in many instances
could have had a significant influence on the findings and hence the results should be interpreted
with caution, and should not be taken to be applicable to all projects. This is emphasized in the
findings that the results were sensitive to both traffic management refinements and the inclusion
of multiplier factors. The results indicated that long-life projects can become more cost-effective
where traffic delay costs for 24-hour-per-day closures can be reduced through traffic
management plans, and where non-pavement multipliers can be minimized.
It is expected that project specific studies using actual data and fewer assumptions may
provide significantly different results. An example was presented where the existing pavement
was in such poor condition that some conventional rehabilitation treatments were not feasible
and others would have had shorter lives than that assumed in this study. In addition, a reduction
in traffic demand was achieved by means of a Traffic Management Plan (TMP) that was greater
than that assumed in this study.
The study was limited to rehabilitation strategies only and is not applicable to new
construction or widening.
4.2 Recommendations
There is consensus in the industry that quality LCCA in the design phase of rehabilitation
projects can result in more appropriate strategies, considerable total savings (agency and road
user) and better cash flow management. It is therefore recommended that LCCA is adopted as a
standard procedure on all projects and that realistic and accurate data are used.
The findings of this study contradict findings from a 1996 study that found that long-life
strategies will generally have lower total cost for higher traffic facilities with more lanes.
However, LLP is still considered to be a feasible rehabilitation option and it is strongly
44

recommended that LCCA be performed on a case-by-case basis when determining whether to
use long-life or conventional strategies as significantly different results could be obtained when
realistic project specific data are used.
The results of LCCA for each project will be dependent on the following variables which
are different for each project:
• Traffic demand patterns, including hourly, weekday, and weekend demand;
directional peaks; and discretionary versus job-related travel
• Alternative routes and modes
• Lane and shoulder configurations and highway geometry in each direction
• Feasibility and expected life of each rehabilitation strategy, which depend on truck
traffic and existing pavement condition in each lane
• Expected construction durations
Sensitivity analyses should be carried out to identify specific issues that influence the
agency and road user costs and which could be managed better to reduce the costs on alternative
strategies. Better comparisons of strategies will be obtained if overhead and administration costs
are included in the analyses. However, it is important to ensure that correct costs are used in each
alternative considered to ensure that realistic and accurate comparisons are made.
45

46

47
5.0 REFERENCES
1. Highway Design Manual. 2004. Sacramento, CA: Caltrans Division of Design (Chapter 600 - Pavement Structural Section).
2. Du Toit, J.W. 2005. Lifecycle Cost Analysis on Long Life Pavement Projects. MSc Project Dissertation. University of California, Davis.
3. Lifecycle Cost Analysis in Pavement Design. 1998. Washington, DC: United States Federal Highway Administration. (FHWA-SA-98-079).
4. Life-cycle Cost Analysis Primer. 2002. Washington, DC: United States Federal Highway Administration. (FHWA-IF-02-047).
5. Beg, M.A., Z. Zhang, and W.R. Hudson. 2000. “Development of Pavement Type Evaluation Procedures for Texas Department of Transportation.” Washington, DC: Transportation Research Board. (Transportation Research Record, TRR 1669).
6. Life-cycle Cost Analysis—RealCost User Manual. 2004. Washington, DC: Federal Highway Administration, Office of Asset Management. (RealCost v2.1).
7. Lee, E. B., H. J. Lee, J. Harvey. 2004. Fast-Track Urban Freeway Rehabilitation with 55-hour Extended Weekend Closures: I-710 Long Beach Case Study. Draft report for the California Department of Transportation, Pavement Research Center, University of California Berkeley, University of California Davis.
8. Lee, E. B., D. Thomas, J. Harvey. 2005. Integrated Design/Construction/Operations Analysis for Fast-Track Urban Freeway Reconstruction. Draft report for the California Department of Transportation, Pavement Research Center, University of California, Berkeley, University of California, Davis.
9. Woerner, M. 1996. Unpublished notes and spreadsheets for lifecycle cost analysis of long life pavements.
10. California Department of Transportation—2003 State of the Pavement Report. 2004. Sacramento, CA: Caltrans Maintenance Program. Pavement Management Information Branch.
11. Harvey, J., N. Santero, H. Lee, W. du Toit, M. G. Fermo. 2005. Evaluation of I-710 Long Beach (07-1384U4) Long-Life Pavement Rehabilitation Costs. Technical Memorandum TM-UCB-PRC-2005-6 prepared for the California Department of Transportation. Pavement Research Center, Institute of Transportation Studies, University of California Berkeley, University of California, Davis.
12. Santero, N., W. Nokes, and J. Harvey. 2005. Evaluation of I-80 Long-Life Corridor Costs. Technical Memorandum TM-UCB-PRC-2005-4 prepared for the California Department of Transportation. Pavement Research Center, Institute of Transportation Studies, University of California Berkeley, University of California, Davis.

48
13. Lea, J.; Harvey, J. 2002. Data Mining of the Caltrans Pavement Management System (PMS) Database. Draft report prepared for the California Department of Transportation, Pavement Research Center, Institute of Transportation Studies, University of California, Berkeley.