economic indicators, october...
TRANSCRIPT

Economic Indicators, October 2012 RESEARCH PAPER 12/55 02 October 2012
This Research Paper series summarises the main economic indicators currently available for the UK, along with comparisons with other major OECD countries.
• The ONS revised its estimate of GDP in the second quarter, from a 0.5% contraction to a 0.4% fall compared with the previous quarter. GDP has declined for three successive quarters. Household consumption, which makes up around two-thirds of GDP, was down by 0.2%.
• The contrast with more positive labour market data continues, with employment rising by 240,000 and unemployment relatively flat in the three months to July 2012 compared with the previous quarter.
This month’s articles:
• More with less – competitiveness and productivity
• Was it a golden summer for the economy?
Lorna Booth (editor)

Recent Research Papers
12/45 Small Charitable Donations Bill [Bill 28 of 2012-13] 14.08.12
12/46 Unemployment by Constituency, August 2012 15.08.12
12/47 European Union (Approval of Treaty Amendment Decision) Bill 30.08.12
[Bill 57 of 2012-13]
12/48 Syria: no end in sight? 30.08.12
12/49 Defamation Bill: Committee Stage Report 03.09.12
12/50 Economic Indicators, September 2012 04.09.12
12/51 Social Care (Local Sufficiency) and Identification of Carers Bill 06.09.12
[Bill 10 of 2012-13]
12/52 Mental Health (Discrimination) (No. 2) Bill [Bill 11 of 2012-13] 10.09.12
12/53 Unemployment by Constituency, September 2012 12.09.12
12/54 Infrastructure (Financial Assistance) Bill [Bill 66 of 2012-13] 12.09.12
Research Paper 12/55
Contributing Authors: Lorna Booth (editor), Economic Policy and Statistics section
This information is provided to Members of Parliament in support of their parliamentary duties and is not intended to address the specific circumstances of any particular individual. It should not be relied upon as being up to date; the law or policies may have changed since it was last updated; and it should not be relied upon as legal or professional advice or as a substitute for it. A suitably qualified professional should be consulted if specific advice or information is required.
This information is provided subject to our general terms and conditions which are available online or may be provided on request in hard copy. Authors are available to discuss the content of this briefing with Members and their staff, but not with the general public.
We welcome comments on our papers; these should be e-mailed to [email protected].
ISSN 1368-8456

Summary The ONS revised its estimate of GDP in the second quarter, from a 0.5% contraction to a 0.4% fall compared with the previous quarter. GDP has declined for three successive quarters. Household consumption, which makes up around two-thirds of GDP, was down by 0.2%. The contrast with more positive labour market data continues, with employment rising by 240,000 and unemployment relatively flat in the three months to July 2012 compared with the previous quarter.
GDP growth page 1 (% change quarter-on-quarter)
The economy contracted by an estimated 0.4% in Q2 2012. This follows a 0.3% decline in GDP in Q1 2012. GDP remains 4.1% below its pre-recession level in Q1 2008.
Inflation (CPI) page 7 (% change on year ago)
The annual rate of CPI inflation was 2.5% in August compared with a year ago, down from 2.6% in July. The Bank of England target is 2%.
Employment page 10 (total, millions)
Compared with the previous quarter, the number of people employed rose by 236,000 to 29.56 million in the three months to July.
Unemployment page 11 (total, millions, ILO definition)
Compared with the previous quarter, ILO unemployment fell by 7,000 to 2.59 million in the three months to July. The unemployment rate remained at 8.1%.
Gold price page 16 ($ per ounce)
The price of gold has been increasing over recent months and was $1771/ounce on 1 October.
-3%-2%-1%0%1%2%
Q1 Q3 Q1 Q3 Q1 Q3 Q1 Q3 Q1 Q3 Q1
2007 2008 2009 2010 2011 2012
0%1%2%3%4%5%6%
2007 2008 2009 2010 2011 2012
28.5
29.0
29.5
30.0
2007 2008 2009 2010 2011 2012
0.00.51.01.52.02.53.0
2007 2008 2009 2010 2011 2012
0
500
1,000
1,500
2,000
Jan 2010 Jan 2011 Jan 2012
Next issue: 6 November Editor: Daniel Harari
To receive Economic Indicators by e-mail and/or hard copy on a regular basis please visit our page on the parliamentary intranet, where updated data is also available, at: http://hcl1.hclibrary.parliament.uk/wdw/subject/ei.asp.


RESEARCH PAPER 12/55
Contents
1 Introduction to Economic Indicators i
2 More with less – competitiveness and productivity ii
3 Was it a golden summer for the economy? iv
4 Indicator pages:
A. Growth and Output 1
1. Gross Domestic Product 1
2. GDP: International Comparisons 2
3. Components of GDP 3
4. Output and Employment by Industry 4
5. Manufacturing (Including Automotives) 5
6. Productivity 6
B. Prices and Wages 7
1. Inflation 7
2. Inflation: International 8
3. Average Earnings 9
C. Labour Market 10
1. Employment 10
2. Unemployment: National 11
3. Unemployment: Regional 12
4. Unemployment: International Comparisons 13
D. Finance and Government Borrowing 14
1. Interest Rates and the Money Supply 14
2. Public Finances 15
3. Financial Indicators 16
E. Trade and Exchange Rates 17
1. UK Balance of Trade 17
2. Exchange Rates 18

RESEARCH PAPER 12/55
F. Other Indicators 19
1. Business and Consumer Confidence 19
2. Retail Sales 20
3. Housing Market 21
4. Household Debt 22
5 Indicator sources 23
6 Glossary 25

RESEARCH PAPER 12/55
1 Introduction to Economic Indicators Economic Indicators Research Papers are usually published on the first Tuesday of the month. Individual indicator pages are updated more frequently and are made available through the Library’s intranet both under the relevant subject page headings, and collectively on the Economic Indicators subject page.1
Feedback If you have any comments or suggestions about Economic Indicators please contact the editor, Daniel Harari, on x2464.
Weekly email alert A weekly email alert with updated indicators is available to Members and their staff on request. To subscribe, please visit http://hcl1.hclibrary.parliament.uk/wdw/subject/EI.asp
Sources and glossary A guide to sources is provided in section 5. Economic terms, symbols and abbreviations used in the publication are described in the glossary in section 6.
Contacts Members and their staff are encouraged to talk to Library subject specialists. A comprehensive guide is available in Using the Library.2 Researchers are not able to discuss pages with members of the public. For enquiries in these subject areas please contact the following specialists:
Subject Statistician tel. extn.Balance of payments Grahame Allen 3977Business Lucinda Maer 3841EC finance Gavin Thompson 2042GDP Grahame Allen 3977Employment Daniel Harari 2464Financial services Lucinda Maer 3841Housing Matthew Keep 6789Incomes Lorna Booth 2883Industries Lucinda Maer 3841International Trade Grahame Allen 3977National accounts Grahame Allen 3977International development Gavin Thompson 2042International economies Gavin Thompson 2042Prices and interest rates Grahame Allen 3977Public expenditure Dominic Webb 4324Taxation Dominic Webb 4324Unemployment Chris Rhodes 2454Wages and earnings Lorna Booth 2883
1 http://hcl1.hclibrary.parliament.uk/wdw/subject/EI.asp 2 http://intranet.parliament.uk/Documents/intranet/offices-departments/assets/using-the-commons-library.pdf
i

RESEARCH PAPER 12/55
2 More with less – competitiveness and productivity “Each nation is like a big corporation competing in the global marketplace”
Bill Clinton, 1994
Many economists would beg to differ. But detecting and analysing changes in the relative economic performance of countries is seen as increasingly important. There is a broad consensus that the problems in the eurozone stemmed from a divergence of competitiveness within the currency union, generating a build-up of private and public debt in the periphery. Meanwhile, hopes for the UK’s recovery are pinned partly on export growth, something, it is said, that will require improvements in our productivity and competitiveness. However, because the term has no single definition or measurement, discussions about competitiveness are fraught with conceptual ambiguity. And the terms ‘productivity’ and ‘competitiveness’ are deployed so loosely and interchangeably in public debate that the relationship and distinction between the two is unclear. This article attempts to distinguish productivity both from ‘classical’ measures of competitiveness based on relative prices, and from broader definitions that also take into account the particular features of countries’ economic and institutional environments. Unlike competitiveness, productivity is a well-defined concept, albeit one that is difficult to measure with accuracy: it refers to how efficiently productive inputs (labour and capital) are used to produce outputs (goods and services). At a general level, the main challenge in measuring productivity involves aggregating inputs and outputs in a meaningful way; in effect, finding a unit of account by which inputs and outputs can be added up. Chart 1 shows how labour productivity, measured by output per hour worked, has changed in selected economies, including the UK, since 2000.3
0 10 20 30 40 50 60
Korea
Czech Rep.
Japan
Singapore
Canada
Italy
Australia
UK
Finland
Spain
Denmark
Austria
Sweden
Germany
France
Ireland
herlands
Belgium
US
Chart 1: Real GDP per hour workedUS dollars, purchasing-power-parity, 2000 and 2010
2000 + ■ 2010
Net
Source: US Bureau of Labor Statistics International LaborComparisons
Productivity growth is directly linked to living standards since, other things being equal, a rise in productivity implies a rise in GDP per capita. In linking productivity with competitiveness, then, some economists would stop here, pointing out that a country with a high GDP per capita must be competitive in the sense that its economy is capable of generating a high level of welfare for its citizens. But developments in productivity on their own tell us little about a country’s ability to compete in export markets. In order to make the link between productivity and export competitiveness, some account must be taken of how the relative costs of output are changing between countries. A country with rising (labour) productivity may at the same time be experiencing currency appreciation or rising labour costs which, depending on developments in other countries, may be causing its price competitiveness to fall. 3 Although this is the most commonly used measure of productivity, and has the advantage of being relatively easy to measure, it is not straightforward to interpret. Changes may be driven by a number of factors, many of which have little to do with the innate qualities or efforts of employees. Other things being equal, an increase in capital or developments in technology will both increase the amount of output for a given labour input, thereby raising observed labour productivity.
ii
RESEARCH PAPER 12/55
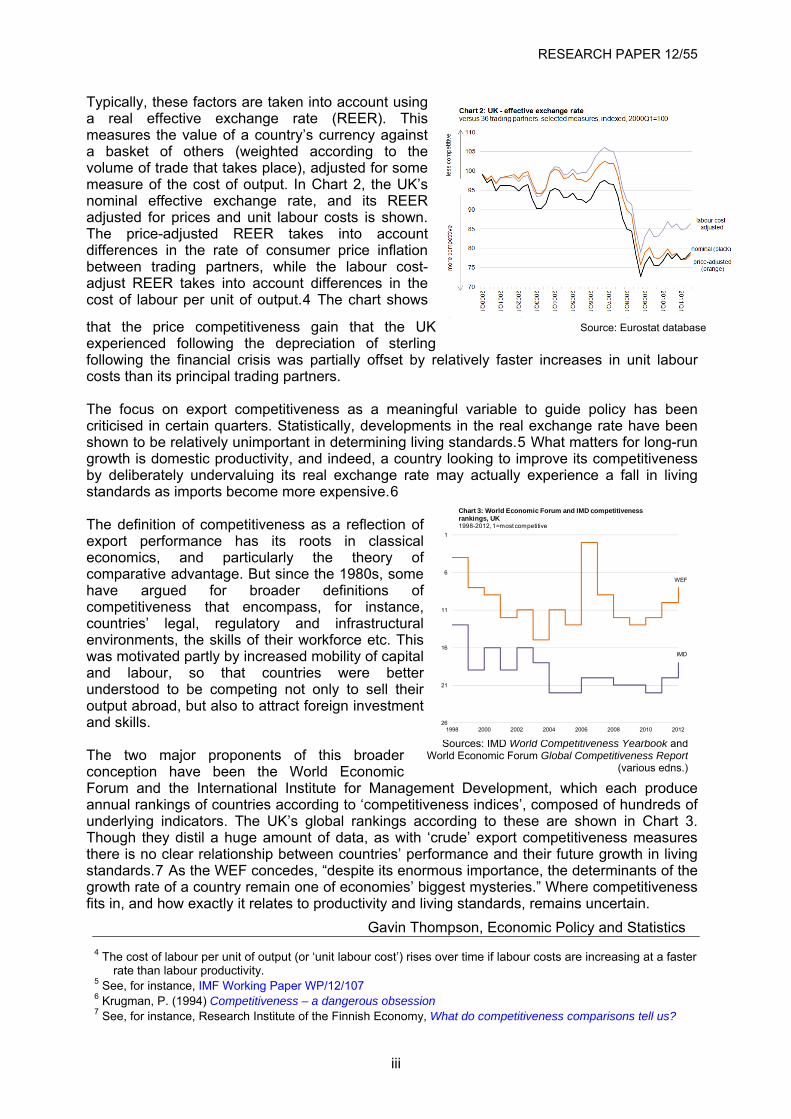
Typically, these factors are taken into account using a real effective exchange rate (REER). This measures the value of a country’s currency against a basket of others (weighted according to the volume of trade that takes place), adjusted for some measure of the cost of output. In Chart 2, the UK’s nominal effective exchange rate, and its REER adjusted for prices and unit labour costs is shown. The price-adjusted REER takes into account differences in the rate of consumer price inflation between trading partners, while the labour cost-adjust REER takes into account differences in the cost of labour per unit of output.4 The chart shows
that the price competitiveness gain that the UK experienced following the depreciation of sterling following the financial crisis was partially offset by relatively faster increases in unit labour costs than its principal trading partners.
Source: Eurostat database
The focus on export competitiveness as a meaningful variable to guide policy has been criticised in certain quarters. Statistically, developments in the real exchange rate have been shown to be relatively unimportant in determining living standards.5 What matters for long-run growth is domestic productivity, and indeed, a country looking to improve its competitiveness by deliberately undervaluing its real exchange rate may actually experience a fall in living standards as imports become more expensive.6 The definition of competitiveness as a reflection of export performance has its roots in classical economics, and particularly the theory of comparative advantage. But since the 1980s, some have argued for broader definitions of competitiveness that encompass, for instance, countries’ legal, regulatory and infrastructural environments, the skills of their workforce etc. This was motivated partly by increased mobility of capital and labour, so that countries were better understood to be competing not only to sell their output abroad, but also to attract foreign investment and skills. The two major proponents of this broader conception have been the World Economic Forum and the International Institute for Management Development, which each produce annual rankings of countries according to ‘competitiveness indices’, composed of hundreds of underlying indicators. The UK’s global rankings according to these are shown in Chart 3. Though they distil a huge amount of data, as with ‘crude’ export competitiveness measures there is no clear relationship between countries’ performance and their future growth in living standards.7 As the WEF concedes, “despite its enormous importance, the determinants of the growth rate of a country remain one of economies’ biggest mysteries.” Where competitiveness fits in, and how exactly it relates to productivity and living standards, remains uncertain.
4 The cost of labour per unit of output (or ‘unit labour cost’) rises over time if labour costs are increasing at a faster
rate than labour productivity. 5 See, for instance, IMF Working Paper WP/12/107 6 Krugman, P. (1994) Competitiveness – a dangerous obsession 7 See, for instance, Research Institute of the Finnish Economy, What do competitiveness comparisons tell us?
Sources: IMD World Competitiveness Yearbook and World Economic Forum Global Competitiveness Report
(various edns.)
WEF
IMD
1
6
11
16
261998 2000 2002 2004 2006 2008 2010 2012
Chart 3: World Economic Forum and IMD competitiveness rankings, UK1998-2012, 1=most competitive
21
Gavin Thompson, Economic Policy and Statistics
iii

RESEARCH PAPER 12/55
3 Was it a golden summer for the economy? "By spreading happiness and good cheer the Games have made us all feel better. And, who knows, the impact on confidence may give the economy a boost. But ultimately the games cannot alter the underlying economic situation we face”.
Mervyn King, Governor of the Bank of England.
Many including the Governor of the Bank of England hoped that the Olympics would provide a boost to the UK economy. Oxford Economics estimated that £11.9 billion could be spent on 2012 Games-related construction between 2005 and 2017. Olympic ticket sales are expected to add around 0.1% in GDP in Q3 2012. But are there any other signs that the six-week Olympic summer period – running from 27 July to 9 September – might have boosted the economy in the short-term?
3.1 Has the Olympics boosted consumer confidence? It appears that the Olympics did not have the desired effect on levels of consumer confidence. Data from the GfK consumer confidence survey showed that the net level of overall consumer confidence in July, August and September was at much the same level it has been over the rest of the last year.
3.2 Did we buy more?
The Sunday Trading (London Olympic Games and Paralympic Games) Act led to a temporary eight-week suspension of restrictions surrounding Sunday trading for large stores from 22 July to 9 September. The Government hoped that this would show that the UK is ‘open for business’, offering tourists the chance to spend more money in the UK, and suggested that this had the potential for a considerable economic impact.
In August 2012 – the month at the heart of the Olympic period – the value of retail sales increased by 3.0% compared to the year before (with a 0.2% rise on July 2012). The volume of retail sales rose less quickly, with a 2.7% increase year on year (volumes fell by 0.2% on July). The figures are however broadly in line with longer-term trends.
There is some indication of an Olympic effect in certain sectors. Department stores (non-specialised stores), textile, clothing and footwear stores (potentially including some sports clothes) and ‘other stores’ (including stores selling sporting goods and toys) saw an increase in sales in August 2012 compared with the previous year. Feedback from ‘other stores’ suggests that sales were boosted by an increase of sales of football shirts due to the start of the new season and Euro 2012 but also because of increased sales dues to the Olympics.
0
20
40
60
80
100
120
140
160
2010 2011 2012
Value of selected retail sectorsIndex (2009=100), seasonally adjusted
Non‐store retailing
Non‐specialised stores
Textile, clothing and footwear stores
Predominantly food stores
Other stores
Household goods stores
iv

RESEARCH PAPER 12/55
v
However, not all retail sectors have reported an Olympic bounce. In August 2012, the value of internet sales as a proportion of all retailing fell by 0.9%-points month-on-month, to 8.1% of all retail sales (except automotive fuel). Online retailers suggested that this fall might be linked to consumers watching the Olympics coverage rather than visiting online shops.
3.3 Was there a bounce in employment? The Olympics also offered the potential for a boost in employment in the UK, including in temporary jobs across the Olympic period.
In the three months to July 2012, the employment rate for people aged 16-64 was 71.2% in the UK, an increase of 0.8% on a year ago. In total, there were 29.56 million people in employment, up 236,000 from the three months to April and up 431,000 on a year earlier.
-1.0%-0.5%0.0%0.5%1.0%1.5%2.0%2.5%3.0%
Lond
on
Sout
h W
est
Nor
th E
ast
Nor
th W
est
Wes
t Mid
land
s
Eas
t
York
shire
and
the
Hum
ber
Sout
h Ea
st
Eas
t Mid
land
s
% change in employment between Feb-Apr 2012 and May-Jul 2012Seasonally adjusted
Early evidence suggests that this increase could – in part – be due to an Olympic effect. Of the 236,000 increase in employment across the
UK in the three months to July, 91,000 was due to an increase in employment in London.
It is still too early to make a full judgement on the effect the Olympics had on the economy. The August retail data give a mixed picture, but do not suggest a large effect on sales, although the heightened interest in sport may have impacted on some sectors. Data on the labour market in London does suggest that the Olympics may have had an effect on the levels of employment, with an increase in the number of people in work. Consumer confidence has however not moved.
The release of a wider set of data over the next few months will allow us to see if the “cheer of the Games” did have a wider effect on the economy or if the Governor was right, and that ultimately the Games didn’t change the underlying economic situation.
Aliyah Dar, Economic Policy and Statistics


RESEARCH PAPER 12/55
A1: Gross Domestic Product The economy contracted by an estimated 0.4% in Q2 2012, revised from the previous estimate of a contraction of 0.5%. In September, HM Treasury’s average of independent economic forecasts of GDP growth for 2012 was -0.3% (downgraded from -0.2% in the August edition) and 1.2% for 2013. The Office for Budget Responsibility’s (OBR) central forecasts from March 2012 are 0.8% growth for 2012 and 2.0% for 2013. Real GDP Growth since 1988
-8%
-6%
-4%
-2%
0%
2%
4%
6%
8%
1988 1990 1992 1994 1996 1998 2000 2002 2004 2006 2008 2010 2012
quarterly data, % change on previous year
Real GDP Growth since 2007 Gross Domestic Product
-2.5%
-2.0%
-1.5%
-1.0%
-0.5%
0.0%
0.5%
1.0%
1.5%
2007 2008 2009 2010 2011 2012
GDP growth, % change on previous quarterseasonally adjusted
% change % change % change£ billion on year on quarter on year
2009 1,402 -2.7 … -4.02010 1,467 4.6 … 1.82011 1,516 3.4 … 0.8
2011 Q1 377.1 4.4 0.5 1.4Q2 378.6 3.7 0.1 0.7Q3 380.7 3.2 0.5 0.6Q4 382.8 3.1 -0.4 0.7
2012 Q1 382.8 1.5 -0.3 -0.1Q2 386.7 2.1 -0.4 -0.5
Source: ONS, series: YBHA, ABM I
Current pricesReal GDP
(inflation-adjusted)
• The UK economy is still in recession and has contracted for three quarters in a row. In Q2 2012, real GDP
was estimated to be 0.5% below what it was in Q2 2011. GDP remains 4.1% below its pre-recession level (Q1 2008).
• In Q2 2012, output of the production industries decreased by an estimated 0.7%, construction sector output decreased by 3.0%, manufacturing output decreased by 0.8%, and output of the service industries decreased by 0.1%, compared with Q1 2012, in chained volume measures.
• The ONS suggested that the extra bank holiday for the Jubilee in June 2012 and the bad weather between April and June 2012 may have “added additional uncertainty” to the estimate for Q2 2012.
Contact: Grahame Allen, x3977 Updates: HMT, Comparison of Independent Forecasts, 17 Oct
ONS, GDP: Preliminary Estimate - Q3 2012, 25 Oct
1

RESEARCH PAPER 12/55
A2: GDP: International Comparisons UK output contracted by 0.4% in Q2 2012, while US output expanded by 0.4% over the same period. In the eurozone as a whole, output contracted by 0.2% in Q2 2012, though Germany saw its output expand by 0.3%
Quarter-on-quarter
growth rates
Real GDP (% changes)
In July 2012, the IMF lowered their 2012 forecast for world growth by 0.1 percentage points to 3.5%. 2012 growth forecasts for the UK were lowered by 0.6 percentage points and for the US by 0.1 percentage points. The 2012 forecast for the eurozone was left unchanged. Major emerging markets also saw downward revisions to their 2012 growth forecast: China’s was revised down by 0.2 percentage points, India’s by 0.7 percentage points and Brazil’s by 0.6 percentage points. The European Commission’s May forecast revised down February forecasts of UK growth in 2012 by 0.1 percentage points to 0.5%. Most eurozone economies saw only slight revisions: France and Germany’s growth forecasts were revised up by 0.1 percentage points each to 0.5% and 0.7% respectively. The OECD’s May forecast made only slight revisions to its November projections for most major economies. However, eurozone growth in 2012 was revised down from 0.2% to -0.1%, and for 2013 from 1.4% to 0.9%. Real growth forecasts (% changes, year-on-year)
Contact: Gavin Thompson, x2042 Update: OECD Main Economic Indicators, 8 Oct 2012
EC Economic Forecast, 7 Nov 2012 IMF World Economic Outlook, Oct 2012
-4
-3
-2
-1
0
+1
+2
07Q1 08Q1 09Q1 10Q1 11Q1 12Q1
UK
-4
-3
-2
-1
0
+1
+2
07Q1 08Q1 09Q1 10Q1 11Q1 12Q1
France
-4
-3
-2
-1
0
+1
+2
07Q1 08Q1 09Q1 10Q1 11Q1 12Q1
Germany
-4
-3
-2
-1
0
+1
+2
07Q1 08Q1 09Q1 10Q1 11Q1 12Q1
Eurozone
-4
-3
-2
-1
0
+1
+2
07Q1 08Q1 09Q1 10Q1 11Q1 12Q1
US
-4
-3
-2
-1
0
+1
+2
07Q1 08Q1 09Q1 10Q1 11Q1 12Q1
G7
11Q3 11Q4 12Q1 12Q2 11Q3 11Q4 12Q1 12Q2US 1.6 2.0 2.4 2.3 0.3 1.0 0.5 0.4Japan -0.7 -0.6 2.8 3.6 1.8 0.1 1.3 0.3UK 0.5 0.6 -0.2 -0.5 0.6 -0.4 -0.3 -0.4Germany 2.7 1.9 1.2 1.0 0.4 -0.1 0.5 0.3France 1.5 1.2 0.3 0.3 0.3 0.0 0.0 0.0Eurozone 1.3 0.7 0.0 -0.4 0.1 -0.3 0.0 -0.2
G7 1.2 1.3 1.7 1.7 0.6 0.4 0.4 0.2OECD 1.7 1.5 1.7 .. 0.5 0.4 0.5 ..
Source: OECD, M ain Economic Indicators (via stat.OECD website)
change on prev. year change on prev. quarter
2012 2013 # 2012 2013 2012 2013UK 0.2 1.4 # 0.5 1.7 0.5 1.9France 0.3 0.8 # 0.5 1.3 0.6 1.2Germany 1.0 1.4 # 0.7 1.7 1.2 2.0Eurozone -0.3 0.7 # -0.3 1.0 -0.1 0.9US 2.0 2.3 .. 2.0 2.1 2.4 2.6Japan 2.4 1.5 .. 1.9 1.7 2.0 1.5OECD .. .. .. .. .. 1.6 2.2China 8.0 8.5 .. .. .. 8.2 9.3India 6.1 6.5 .. .. .. 7.1 7.7Brazil 2.5 4.6 .. .. .. 3.2 4.2World 3.5 3.9 .. .. .. .. ..Sources: IMF Jul 2012 WEO update; EC EEF; OECD Economic Outlook No.91
IMF (Jul 12) OECD (May 12)EC (May 12)
2

RESEARCH PAPER 12/55
A3: Components of GDP GDP is made up of a number of elements, including household consumption, government spending, investment and net trade (exports less imports). Household consumption is the largest element accounting for 62% of the total in 2011. Government consumption accounted for 22% and investment for 14%.
Household consumption and government consumption
House-hold
Govt
-2%
-1%
0%
1%
2%
3%
4%
2007 2008 2009 2010 2011 2012
quarterly data, % change on previous quarter • In Q2 2012, household consumption fell by
0.2% in real terms compared with Q1 2012.
• Government consumption fell by 1.6% in Q2 2012.
• Exports fell by 1.1% while imports rose by 1.4% in Q2 2012.
• GDP fell by 0.4% in Q2 2012, revised from an earlier estimate of a fall of 0.5%.
Gross fixed capital formation
-8%
-6%
-4%
-2%
0%
2%
4%
6%
2007 2008 2009 2010 2011 2012
quarterly data, % change on previous quarter
• Gross fixed capital formation (GFCF) measures investment in buildings and machinery.
• In Q2 2012 GFCF fell by 2.7%, the biggest
quarterly fall since Q2 2010. The main reason was a fall in investment in dwellings.
• Business investment, a component of overall GFCF, increased by 0.9% in Q2 2012.
Components of GDP% change on previous quarter (real terms)
Household Governmentconsumption consumption GFCF (a) Exports Imports GDP
2010 (annual % change) 1.3% 0.4% 3.5% 6.4% 8.0% 1.8%2011 (annual % change) -1.1% 0.2% -2.4% 4.5% 0.5% 0.9%
2011 Q1 -1.2% 0.2% -1.9% 1.6% -2.5% 0.5%2011 Q2 -0.3% 0.3% 0.0% -2.3% -0.5% 0.1%2011 Q3 0.0% 0.1% 0.5% 0.0% 0.3% 0.5%2011 Q4 0.2% 0.3% -0.7% 3.0% 1.6% -0.4%2012 Q1 0.3% 3.1% 3.2% -1.6% -0.1% -0.3%2012 Q2 -0.2% -1.6% -2.7% -1.1% 1.4% -0.4%Source: ONS series ABJR, NM RY, NPQT, IKBK, IKBL and ABM I Note: (a) gross fixed capital formation
Contact: Dominic Webb, x4324 Update: ONS, Second estimate of GDP, 27 November
3

RESEARCH PAPER 12/55
A4: Output and employment by industry
In 2010 (the latest National Accounts data), services accounted for 78% of UK Gross Value Added (GVA), manufacturing 10%, other production (mining & quarrying, and utilities) 5%, construction 7% and agriculture, hunting and fishing 1%. The services sector accounts for 83% of total workforce jobs (Q1 2012).
Output
• Manufacturing output fell by 0.8% in the second quarter of 2012. Services fell by 0.1%. Construction output fell by 3.0%, following a 5.9% fall in Q1.
• The ONS suggested that the extra bank holiday for the Jubilee and the bad weather may have had an impact in some sectors.
• Manufacturing output rose by 2.0% in 2011 and services by 1.2%. Construction output grew by 2.6%. • Output in the business services and finance sector was unchanged in Q2 2012.
Employment
• The number of manufacturing jobs has risen. In Q2 2012, the manufacturing workforce grew by 1.1% on the previous quarter and was 2.4% higher than a year earlier.
• The number of jobs in the construction sector decreased by 1.7% in Q2 2012, while the services workforce grew by 0.3%.
• The public administration, health and education workforce fell by 1.4% in the year to Q2 2012.
Contact: Lucinda Maer, x3841 Update: ONS, Workforce Jobs, 17 October 2012
GVA growth by industrySeasonally adjusted, chained volume measures at basic prices
Manufacturing Construction Services Total GDP
Annual % changes2010 3.8 7.9 1.1 1.82011 2.0 2.6 1.2 0.92011 Q4 -0.5 1.4 1.6 0.72012 Q1 -1.2 -4.6 1.2 -0.12012 Q2 -2.2 -9.0 0.8 -0.5# /Quarter-on-quarter % changes2011 Q4 -1.0 0.2 -0.1 -0.42012 Q1 0.0 -5.9 0.2 -0.32012 Q2 -0.8 -3.0 -0.1 -0.4
Source: ONS Series L2KX, L2N8, L2NC, YBEZ
Manufac
Services
-6
-5
-4
-3
-2
-1
0
1
2
3
2007 Q1
2008 Q1
2009 Q1
2010 Q1
2011 Q1
2012 Q1
Manufacturing and services outputQuarter-on-quarter growth (%)
Workforce jobs by industrySeasonally adjusted
Manufacturing Construction Services Total
Annual % changes
2010 Q2 -2.8% -6.3% 0.0% -0.5%2011 Q2 -1.4% -4.4% 0.0% -0.5%
2012 Q1 0.7% 0.3% 1.8% 1.6%2012 Q2 2.4% -1.2% 2.5% 2.3%
Quarter-on-quarter
2012 Q1 1.6% -0.8% 1.1% 1.0%2012 Q2 1.1% -1.7% 0.3% 0.3%
Thousands
2012 Q2 2,594 1,996 26,528 31,935
Source: ONS series JWR7, JWS2, JWT8, DYDC
Manufac
Services
-6%
-5%
-4%
-3%
-2%
-1%
0%
1%
2%
2007 Q1
2008 Q1
2009 Q1
2010 Q1
2011 Q1
2012 Q1
Manufacturing and services jobsQuarter-on-quarter growth
4

RESEARCH PAPER 12/55
A5: Manufacturing ONS produces a monthly index of manufacturing output data. The Markit/Chartered Institute of Purchasing & Supply (CIPS) UK Manufacturing Purchasing Managers’ Index is a leading indicator of manufacturing output. The Society of Motor Manufacturers and Traders (SMMT) publishes monthly vehicle production statistics. Manufacturing Output
-15%
-10%
-5%
0%
5%
10%
2007 2008 2009 2010 2011 2012
monthly data, % change on previous yearIndex Value % change % change over(2009=100) over month 12 months
2010 103.8 … 3.82011 106.0 … 2.1
2012 Apr 104.2 -1.0 -1.4May 105.7 +1.4 -1.2Jun 102.6 -2.9 -3.9Jul 105.9 +3.2 -0.5
Source: ONS, series K22A
• Manufacturing output increased by 3.2% in July 2012 compared with June 2012. Manufacturing output fell by 0.5% in July 2012 compared to July 2011.
• Total industrial production (including mining and utilities) increased by 2.9% compared with June 2012. Total production was 0.8% lower in July 2012 than in July 2011.
• The ONS urged caution when using the June 2012 figures due to changes in public holidays that month. Manufacturing Purchasing Managers’ Index
30
40
50
60
70
2007 2008 2009 2010 2011 2012
Expanding
Contracting
Markit/CIPS UK Manufacturing PMI50=No change
Index Monthly change2010 Sep 53.5 ...2011 Sep 50.8 ...
2012 Jun 48.2 +2.3Jul 45.2 -3.0Aug 49.6 +4.4Sep 48.4 -1.2
Source: M arkit/CIPS UK M anufacturing PM IData as originally published
• The Markit/CIPS UK Manufacturing PMI fell to 48.4 in September from 49.6 in August (where 50.0 is no
change). • The index has been below 50 for five successive months. The average PMI in Q3 2012 is its lowest since
Q2 2009.
Vehicle Production
-100%
-50%
0%
50%
100%
2007 2008 2009 2010 2011 2012
monthly data, % change on previous yearNumber % change over
'000s 12 months2010 1,393 +27.82011 1,465 +5.12011 Aug 93 +10.6
2012 Jun 128 -2.2Jul 129 +20.2Aug 86 -7.0
Source: SM M T, not seasonally adjusted
• UK vehicle production was 86,000 in August 2012, 7.0% lower than August 2011. SMMT said that volumes
were traditionally low and variable in August. Continued weak demand in Europe was a concern but new investment and strong demand from better performing global markets should ensure growth in output.
• In 2011, 1.47 million vehicles were produced in the UK, up by 5.1% compared with 2010.
Contact: Lucinda Maer, x3841
Update: ONS, Index of Production, 9 Oct Markit/CIPS UK Manufacturing PMI, 1 Nov SMMT, Vehicle Production, mid Oct
5

RESEARCH PAPER 12/55
A6: Productivity Productivity is a measure of the efficiency of production in an economy. It is usually expressed as a ratio of units of output to units of input.
In measuring labour productivity, three measures are commonly used: output (or GDP) per worker, output per job and output per hour worked. The latter is the purest measure of productivity, as it adjusts for changes in working hours such as more part-time working.
UK data are published every three months, with international comparisons updated biannually.
UK productivity by sector • Productivity across the whole UK economy, measured by output per hour, is estimated to have fallen by
2.6% over the last year and by 0.9% 2012 Q1 to 2012 Q2. • Output per hour in manufacturing fell by 3.5% between 2011 Q2 and 2012 Q2; this is the largest fall since
2008 Q4. Services productivity fell by 1.8%, the largest fall since 2009 Q2.
Output per hour, seasonally adjusted
Manufact. ServicesWhole
economy
Annual % change
2009 -1.5 -0.5 -1.52010 4.6 0.8 1.72011 3.8 0.3 0.6
Q1 1.7 -1.6 -0.82011 Q2 5.0 0.9 1.4
Q3 4.1 0.8 0.8Q4 4.5 0.8 1.1Q1 1.7 0.1 -0.5
2012 Q2 -3.5 -1.8 -2.6
-0.8 -1.5 -0.9
Source: ONS series LZVD, DJK8, DJQ3
Latest q-on-q % change
Services
-6
-4
-2
0
2
4
6
2007 2008 2009 2010 2011 2012
Manufact
Annual %change
Whole economy
• Within manufacturing, output per hour in Chemicals and Pharmaceuticals fell the most, by 15.6% between 2011 Q2 and 2012 Q2. Output per hour in Machinery & Equipment increased by 8.8% over the same period.
International comparisons
0 25 50 75 100 125
Japan
Canada
UK = 100
Italy
Germany
France
USA
GDP per hour, 2011, index where UK=100
• International comparisons of productivity are
presented as an index where the UK=100.
• In 2011, based on GDP per hour, the UK came fifth of the G7 countries, with the USA top and Japan bottom. UK productivity was 15% below the G7 average, the widest productivity gap since 1995.
• On a per hour worked basis the productivity gap between the UK and the USA in 2011 was at its widest since 1992.
Contact: Grahame Allen, x3977 Update: ONS, Labour Productivity, 3 Jan 2013 ONS, International Comparisons, Feb 2013
6

RESEARCH PAPER 12/55
B1: Inflation Compared with a year ago, the consumer prices index (CPI) showed inflation at 2.5% in August, down from 2.6% in July and above the Bank of England’s 2% target for the thirty-third successive month.
On 10 December 2003 the (then) Chancellor wrote to the Bank of England setting a new UK inflation target of 2.0%, measured by the consumer prices index (CPI).
Consumer Prices Index (CPI)
• The CPI annual inflation rate was 2.5% in August, down from 2.6% in July (July had been the first rise in CPI inflation since March 2012).
• The main upward pressure came from housing & household services, particularly gas and rent, where charges, overall, rose by 13.4% and 3.4% respectively over the twelve months to August.
• The RPI (all items) measure of annual inflation
was 2.9% in August, down from 3.2% in July (July had been the first rise in RPI inflation since it peaked at 5.6% in Sept 2011).
Retail Prices Index (RPI)
Price Indices
CPI and RPI since 1990
Contact: Grahame Allen, x3977 Update: ONS, Consumer Price Indices, 16 Oct
-2%
-1%
0%
1%
2%
3%
4%
5%
6%
2008 2009 2010 2011 2012
monthly data, % change on previous year
Inflation target
-2%
-1%
0%
1%
2%
3%
4%
5%
6%
2008 2009 2010 2011 2012
monthly data, % change on previous year% change on a year ago
CPI RPI2009 2.2 -0.52010 3.3 4.62011 4.5 5.2
2012 Mar 3.5 3.6Apr 3.0 3.5
May 2.8 3.1Jun 2.4 2.8Jul 2.6 3.2
Aug 2.5 2.9
Source: ONS database, series: D7G7, CZBH
-2%
0%
2%
4%
6%
8%
10%
12%
1990 1992 1994 1996 1998 2000 2002 2004 2006 2008 2010 2012
monthly data, % change on previous year
CPI
RPI
7

RESEARCH PAPER 12/55
B2: Inflation: International UK inflation, measured by the Consumer Prices Index (CPI), remained positive throughout the recession. Other major economies, including the US, France and Germany, saw deflation (negative inflation, or falling prices).
Inflation in the EU, some other European countries, and the US, can be compared using the standard Harmonised Index of Consumer Prices (HICP), or the CPI as it is known in the UK. National inflation calculations methods differ from this standard to varying degrees. For example, the US’ national measure is based on prices in urban areas only, and unlike the HICP includes costs of owner-occupied housing. Care should therefore be taken when making comparisons between national and harmonised measures.
• In the year to August, UK inflation was 2.5%, down from 2.6% in July. The Bank of England’s UK inflation target is 2%.
• The flash estimate of eurozone inflation in the year to September 2012 was 2.7%, up from 2.6% in August. The European Central Bank (ECB) aims to keep inflation “below, but close to, 2% over the medium term”.
• Sweden had the lowest annual inflation rates in the EU in August, at 0.9%. The highest rate was in Hungary, at 6.0%.
• HICP annual inflation in the US in the year to July was 1.4%, down from 1.5% in June. Using its national definition, US inflation in the year to July was 1.4%, down from 1.7% in June.
Contact: Gavin Thompson, x2042 Updates: ONS Consumer Prices bulletin (UK), 16 Oct 2012 Eurostat, HICP full release, 16 Oct 2012 Eurostat, Flash estimate (Oct), 31 Oct 2012
Inflation rates: selected countriesAnnual % change in consumer prices
2009 2010 2011 May-12 Jun-12 Jul-12 Aug-12
HICP (ONS/Eurostat)
UK 2.2 3.3 4.5 2.8 2.4 2.6 2.5Eurozone 0.3 1.6 2.7 2.4 2.4 2.4 2.6EU 1.0 2.1 3.1 2.5 2.5 2.5 2.7France 0.1 1.7 2.3 2.3 2.3 2.2 2.4Germany 0.2 1.2 2.5 2.2 2.0 1.9 2.2Greece 1.3 4.7 3.1 0.9 1.0 0.9 1.2Italy 0.8 1.6 2.9 3.5 3.6 3.6 3.3Spain -0.2 2.0 3.1 1.9 1.8 2.2 2.7US 1.0 2.1 3.1 1.5 1.5 1.4 :
National definitions (OECD)
Canada 0.3 1.8 2.9 1.2 1.5 1.3 ..Japan -1.3 -0.7 -0.3 0.2 -0.2 -0.4 ..US -0.4 1.6 3.2 1.7 1.7 1.4 ..
G7 -0.1 1.4 2.6 1.7 1.6 1.4 ..OECD 0.5 1.9 2.9 2.1 2.0 1.9 ..
Brazil 4.9 5.0 6.6 5.0 4.9 5.2 5.2China -0.7 3.3 5.4 3.0 2.2 1.8 2.0India 10.9 12.0 8.9 10.2 10.1 9.8 ..Russia 11.7 6.9 8.4 3.6 4.3 5.6 ..Source: ONS, Eurostat & stat.OECD database
-3
0
+3
+6
2007 2008 2009 2010 2011 2012
USHICP data, as in other charts
-3
0
+3
+6
2007 2008 2009 2010 2011 2012
Eurozone
-3
0
+3
+6
2007 2008 2009 2010 2011 2012
Italy
-3
0
+3
+6
2007 2008 2009 2010 2011 2012
France
-3
0
+3
+6
2007 2008 2009 2010 2011 2012
Germany
-3
0
+3
+6
2007 2008 2009 2010 2011 2012
UK
8

RESEARCH PAPER 12/55
B3: Average Earnings Average weekly earnings (three-month average including bonuses) for the whole economy rose by 1.5% in July compared with a year ago, down from 1.8% in June. Average weekly earnings excluding bonuses rose by 1.9% in the three months to July compared with a year ago, down 0.1 percentage points on June. Inflation as measured by the CPI was 2.6% in July 2012. Average Earnings, Whole Economy
Average Earnings, Including Bonuses
-6%
-4%
-2%
0%
2%
4%
6%
8%
2007 2008 2009 2010 2011 2012
monthly data, % change on previous year
excluding bonuses
including bonuses
% change on year; seas. adj.; Great BritainPrivate Public Manuf. Serv. Total
2009 Jul 0.0 3.4 0.0 0.8 0.62010 Jul 0.9 3.4 4.3 1.6 1.72011 Jul 3.1 2.7 1.7 3.3 2.9
2012 Feb 0.9 1.1 1.4 1.0 0.9Mar 0.5 0.8 0.8 0.6 0.6Apr 1.4 1.0 1.4 1.4 1.4May 1.9 1.2 1.6 1.7 1.7Jun 2.2 1.3 2.7 1.7 1.8Jul 1.8 1.2 2.6 1.3 1.5
Source: ONS, data shows latest 3-month period Average Earnings in the Public and Private Sectors
-6%
-4%
-2%
0%
2%
4%
6%
8%
2007 2008 2009 2010 2011 2012
monthly data, including bonuses% change on previous year
Public
Private
• Average total pay (including bonuses) in the
private sector rose by 1.8% in the three months to July, compared with 1.2% in the public sector. Excluding financial services, public sector earnings rose by 2.0%.
• Average weekly earnings (including bonuses) in
July in the public sector were £485 compared with £468 in the private sector.
• In 2011, headline (including bonuses) earnings in
the private sector averaged a rise of 2.6%, while the public sector averaged a 2.1% increase.
Average Earnings in Services and Manufacturing
Services
-6%
-4%
-2%
0%
2%
4%
6%
8%
2007 2008 2009 2010 2011 2012
monthly data, including bonuses % change on previous year
Manufacturing
• Average total pay growth (including bonuses) in the manufacturing sector was 2.6% in the three months to July, compared with 1.3% in the services sector.
• Average weekly earnings (including bonuses) in
July in the manufacturing sector were £545 compared with £456 in the services sector.
• In 2011, headline (including bonuses) earnings in
the services sector averaged a rise of 2.7% compared with a 1.4% increase in the manufacturing sector.
Contact: Daniel Harari, x2464 Update: ONS, Labour Market Statistics, 17 Oct
9

RESEARCH PAPER 12/55
C1: Employment Employment rose by 236,000 over the quarter to July 2012, to 29.56 million. This is the highest number of people in employment since the pre-recession peak of 29.57 million in the three months to May 2008.
Total employment (% change on previous year)
-4%
-3%
-2%
-1%
0%
1%
2%
2002 2004 2006 2008 2010 2012
• Over the past year, employment rose among all age groups featured in the table below. It also rose over the last quarter for all the age groups below.
• The number of self-employed people rose by 52,000 over the quarter, to 4.22 million. The number of employees rose by 144,000 over the same period, to 25.07 million.
• The number of people employed part-time rose by 134,000 over the quarter, to 8.12 million.
• The number of people employed full-time rose by 102,000 to 21.44 million.
Employment by gender (% change on previous year)
Male
Female
-4%
-3%
-2%
-1%
0%
1%
2%
2002 2004 2006 2008 2010 2012
• The number of men in employment increased by
109,000 over the last quarter to 15.85 million.
• The number of women in employment increased by 128,000 over the last quarter to 13.71 million.
• Excluding reclassified FE workers, public sector
employment fell by 39,000 in the three months to June 2012, to 5.66 million or 19.2% of all employment.
• Excluding reclassified FE workers, private sector employment increased by 275,000 in the three months to June 2012, to 23.90 million or 80.8% of all employment.
Employment by age group
3-month period: '000s & % changes; seasonally adjustedTotal 16-24 25-49 50-64 65+
May-Jul 2010 29,118 3,809 17,131 7,313 864May-Jul 2011 29,130 3,675 17,226 7,369 859
Aug-Oct 2011 29,102 3,635 17,205 7,402 860Nov-Jan 2012 29,141 3,618 17,234 7,424 867Feb-Apr 2012 29,324 3,641 17,308 7,468 907May-Jul 2012 29,560 3,699 17,405 7,501 955
% change on previous 3 months +0.8 +1.6 +0.6 +0.4 +5.4% change on previous year +1.5 +0.7 +1.0 +1.8 +11.2
Source: ONS
Contact: Chris Rhodes, x2454 Update: ONS, Labour Market Statistics, 17 Oct
10

RESEARCH PAPER 12/55
C2: Unemployment: National The Office for National Statistics uses the International Labour Organisation (ILO) definition of unemployment as the headline measure of unemployment. In the UK this is obtained from the Labour Force Survey (LFS).
• ILO unemployment in May to July 2012 was 2,592,000 (8.1% of all economically active) – down 7,000 from the previous quarter. (UK, seasonally adjusted.)
0
500
1,000
1,500
2,000
2,500
3,000
3,500
1979 1981 1983 1985 1987 1989 1991 1993 1995 1997 1999 2001 2003 2005 2007 2009 2011
Unemployment, 1979 to current(seasonally adjusted levels, thousands)
Recessions (two or more consecutive quarters of negative GDP growth)
ILO Unemployed
JSA/unemployment benefit claimants
[Source: ONS, Labour Market Statistics]
ILO unemployment (May to July 2012)
There were 904,000 people unemployed for more than 12 months, an increase of 22,000 on the previous quarter when there were 882,000 in this group. The unemployment level among 16- to 24-year-olds was 1,017,000, up 7,000 on the previous quarter. (See table below.)
Jobseeker’s Allowance (JSA) claimant count The seasonally-adjusted monthly JSA claimant count decreased by 15,000 between July and August 2012 to 1,570,500. 0
500
1,000
1,500
2,000
2,500
3,000
2007 2008 2009 2010 2011 2012
ILO unemployment levelSeasonally adjusted, thousands
Total
Male
Female
1,491
2,592
1,101
ILO Unemployment in the UK seasonally adjusted
'000s (%) '000s (%) '000s (%) '000s (%) '000s (%)
May-Jul 2007 1,643 5.3 711 14.6 685 3.8 232 3.2 15 2.4May-Jul 2008 1,719 5.5 727 14.8 747 4.1 232 3.1 13 1.8May-Jul 2009 2,469 7.9 944 19.8 1,151 6.3 351 4.6 23 3.0May-Jul 2010 2,475 7.8 923 19.5 1,154 6.3 379 4.9 19 2.2
May-Jul 2011 2,531 8.0 980 21.0 1,165 6.3 364 4.7 22 2.5Aug-Oct 2011 2,637 8.3 1,026 22.0 1,200 6.5 383 4.9 30 3.3Nov-Jan 2012 2,652 8.3 1,038 22.3 1,188 6.4 402 5.1 24 2.7Feb-Apr 2012 2,599 8.1 1,010 21.7 1,167 6.3 394 5.0 27 2.9May-Jul 2012 2,592 8.1 1,017 21.6 1,162 6.3 390 4.9 23 2.3% change on quarter -0.3 +0.7 -0.5 -1.1 -15.3% change on year +2.4 +3.8 -0.3 +7.2 +5.9
Source: ONS, Labour Market Statistics.Notes: Rates are percentages of economically active in the relevant age group. Levels might not sum due to rounding.
50 to 64 65 and over25 to 4916 to 24Total
Contact: Lorna Booth, x2883 Update: ONS, Labour Market Statistics, 17 October 2012
11

RESEARCH PAPER 12/55
C3: Unemployment: Regional The Office for National Statistics uses the International Labour Organisation (ILO) definition of unemployment as the headline measure of unemployment. In the UK this is obtained from the Labour Force Survey (LFS).
• Over the period May to July 2012, the North East had the highest unemployment rate, at 10.4% of the economically active population. The lowest rate over the same period was 5.7% in the South West.
10.4%10.0%
9.0% 8.9% 8.9% 8.8% 8.3% 8.2% 8.2%
6.5% 6.3%5.7%
0%
2%
4%
6%
8%
10%
12%
North East
Yorks/ Humber
North West
London Wales West Midlands
East Midlands
ScotlandN. Ireland East of England
South East
South West
UK= 8.1%
ILO unemployment rates (seasonally adjusted) over period May to July 2012
• The largest increase in unemployment over the last quarter was in Yorkshire and the Humber (+23,000). The largest decrease was in London (-22,000).
• The seasonally-adjusted JSA claimant count increased in one country, and decreased in eleven regions and countries in August, compared with July 2012.
Key labour market statistics for countries and regions, seasonally adjusted
Level (000s)
Rate (%)(a)
qtr-on-qtr (000s)
year-on-year (000s)
Level (000s)
change since prev. month (000s)
North East 134 10.4 -11 -4 93.5 -0.2North West 316 9.0 -8 +27 198.4 -2.2Yorkshire & Humber 272 10.0 +23 +28 164.9 -0.7East Midlands 193 8.3 +5 +6 108.6 -0.9West Midlands 237 8.8 +16 -1 163.8 -1.2East of England 201 6.5 -9 +4 113.6 -1.3London 377 8.9 -22 -32 216.6 -5.5South East 283 6.3 -6 +24 138.2 -1.4South West 153 5.7 -9 -24 88.6 -0.9Wales 132 8.9 +1 +9 79.3 -0.2Scotland 223 8.2 +4 +16 141.9 -0.6Northern Ireland 71 8.2 +10 +7 63.1 +0.1
Source: ONS, Labour Market StatisticsNote: (a) Rates are percentages of economically active population in the region.
May - July 2012
ILO unemployment JSA claimant count
August 2012Change in level
Contact: Lorna Booth, x2883 Update: ONS, Labour Market Statistics, 17 October 2012
12
RESEARCH PAPER 12/55
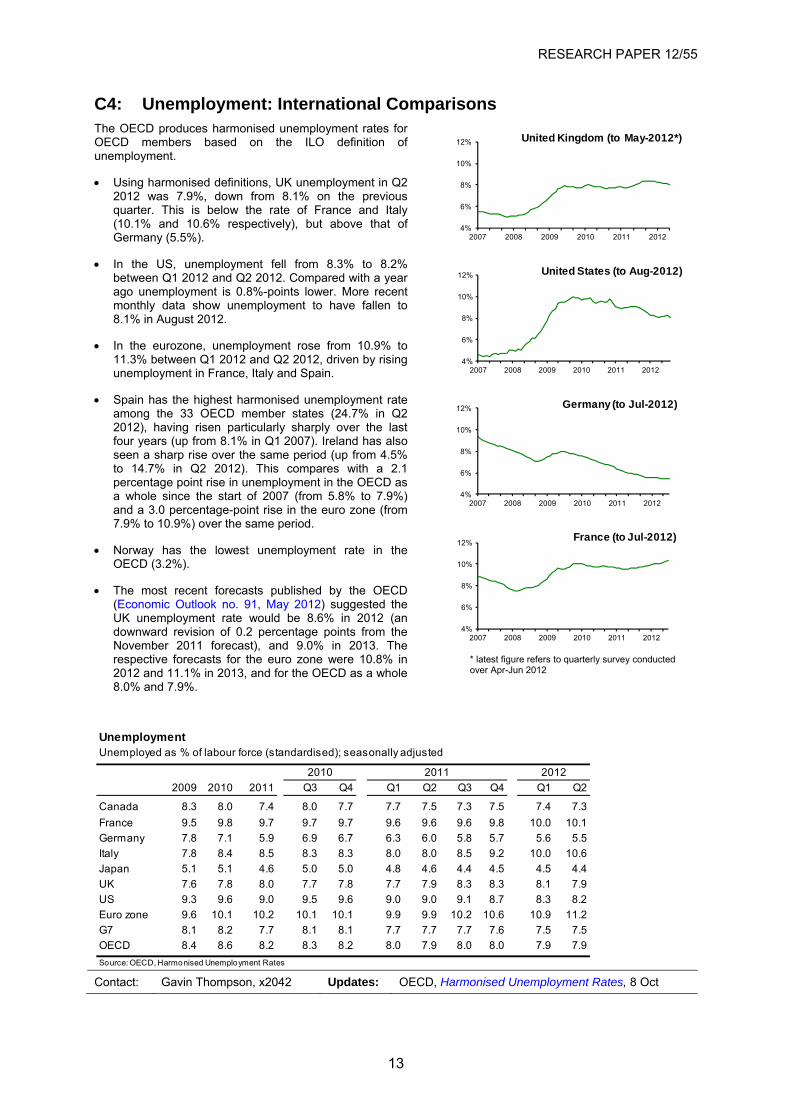
C4: Unemployment: International Comparisons The OECD produces harmonised unemployment rates for OECD members based on the ILO definition of unemployment.
• Using harmonised definitions, UK unemployment in Q2 2012 was 7.9%, down from 8.1% on the previous quarter. This is below the rate of France and Italy (10.1% and 10.6% respectively), but above that of Germany (5.5%).
• In the US, unemployment fell from 8.3% to 8.2% between Q1 2012 and Q2 2012. Compared with a year ago unemployment is 0.8%-points lower. More recent monthly data show unemployment to have fallen to 8.1% in August 2012.
• In the eurozone, unemployment rose from 10.9% to 11.3% between Q1 2012 and Q2 2012, driven by rising unemployment in France, Italy and Spain.
• Spain has the highest harmonised unemployment rate among the 33 OECD member states (24.7% in Q2 2012), having risen particularly sharply over the last four years (up from 8.1% in Q1 2007). Ireland has also seen a sharp rise over the same period (up from 4.5% to 14.7% in Q2 2012). This compares with a 2.1 percentage point rise in unemployment in the OECD as a whole since the start of 2007 (from 5.8% to 7.9%) and a 3.0 percentage-point rise in the euro zone (from 7.9% to 10.9%) over the same period.
• Norway has the lowest unemployment rate in the OECD (3.2%).
• The most recent forecasts published by the OECD (Economic Outlook no. 91, May 2012) suggested the UK unemployment rate would be 8.6% in 2012 (an downward revision of 0.2 percentage points from the November 2011 forecast), and 9.0% in 2013. The respective forecasts for the euro zone were 10.8% in 2012 and 11.1% in 2013, and for the OECD as a whole 8.0% and 7.9%.
* latest figure refers to quarterly survey conducted over Apr-Jun 2012
Contact: Gavin Thompson, x2042 Updates: OECD, Harmonised Unemployment Rates, 8 Oct
4%
6%
8%
10%
12%
2007 2008 2009 2010 2011 2012
France (to Jul-2012)
4%
6%
8%
10%
12%
2007 2008 2009 2010 2011 2012
Germany (to Jul-2012)
4%
6%
8%
10%
12%
2007 2008 2009 2010 2011 2012
United States (to Aug-2012)
4%
6%
8%
10%
12%
2007 2008 2009 2010 2011 2012
United Kingdom (to May-2012*)
UnemploymentUnemployed as % of labour force (standardised); seasonally adjusted
2009 2010 2011 Q3 Q4 Q1 Q2 Q3 Q4 Q1 Q2
Canada 8.3 8.0 7.4 8.0 7.7 7.7 7.5 7.3 7.5 7.4 7.3France 9.5 9.8 9.7 9.7 9.7 9.6 9.6 9.6 9.8 10.0 10.1Germany 7.8 7.1 5.9 6.9 6.7 6.3 6.0 5.8 5.7 5.6 5.5Italy 7.8 8.4 8.5 8.3 8.3 8.0 8.0 8.5 9.2 10.0 10.6Japan 5.1 5.1 4.6 5.0 5.0 4.8 4.6 4.4 4.5 4.5 4.4UK 7.6 7.8 8.0 7.7 7.8 7.7 7.9 8.3 8.3 8.1 7.9US 9.3 9.6 9.0 9.5 9.6 9.0 9.0 9.1 8.7 8.3 8.2Euro zone 9.6 10.1 10.2 10.1 10.1 9.9 9.9 10.2 10.6 10.9 11.2G7 8.1 8.2 7.7 8.1 8.1 7.7 7.7 7.7 7.6 7.5 7.5OECD 8.4 8.6 8.2 8.3 8.2 8.0 7.9 8.0 8.0 7.9 7.9Source: OECD, Harmonised Unemployment Rates
2010 2011 2012
13

RESEARCH PAPER 12/55
D1: Interest Rates and the Money Supply
In consecutive monthly meetings from October 2008 to March 2009, the Bank of England cut the official Base Rate from 4.50% to 0.50%, the lowest since the Bank was founded in 1694. The rate has remained at 0.50% since March 2009.
With little room for further cuts in interest rates, the Bank initiated an asset purchase or ‘quantitative easing’ (QE) programme in March 2009. In the face of continuing weak economic data, QE was increased in October 2011, February 2012 and July 2012 to a total of £375 billion.
Official interest rates UK Base/Repo rate changes
UKUS
ECB
0%
1%
2%
3%
4%
5%
6%
2006 2007 2008 2009 2010 2011 2012
% per annum
Date New rate New rate
2001 Oct 4 4.50 2007 Jan 11 5.25Nov 8 4.00 May 10 5.50
2003 Feb 6 3.75 Jul 5 5.75Jul 10 3.50 Dec 6 5.50Nov 6 3.75 2008 Feb 7 5.25
2004 Feb 5 4.00 A pr 10 5.00May 6 4.25 Oct 8 4.50
Jun 10 4.50 Nov 6 3.00A ug 5 4.75 Dec 4 2.00
2005 A ug 4 4.50 2009 Jan 8 1.502006 A ug 3 4.75 Feb 5 1.00
Nov 9 5.00 Mar 5 0.50
So urce: B ank o f England
Date
• From November 2011, the European Central Bank’s official interest rate was lowered in three steps from 1.50% to 0.75%. The current rate of 0.75% is a record low for the ECB rate.
• The US Federal Reserve’s target range for the federal funds rate has been 0-0.25% since 16 December 2008.
Asset purchase programme (quantitative easing) • On 5 March 2009, the Bank of England announced that it would undertake quantitative easing. From an initial
£75 billion, QE was increased to £200 billion by November 2009. QE was again increased by £75 billion in October 2011, £50 billion in February 2012 and £50 billion in July 2012, to a total of £375 billion. In August 2012, the Bank announced that “inflation was still slightly above 2% but likely to remain close to the target in the coming months” and that therefore QE would remain at £375 billion.
• The majority (over 99%) of assets purchased by the Bank of England though QE have been gilts (UK Government securities).
Money supply
M4 excl IOFCs
0
2
4
6
8
10
12
2006 2007 2008 2009 2010 2011 2012
Money supply growth (SA)% annual increase
Notes and coins
Note: M4 data is quarterly up to June 2010, and monthly thereafter
• In its August 2012 Inflation Report, the Bank of
England said that although money supply growth “remains subdued”, it grew faster than nominal GDP in Q1 (1.8%) for the first time since 2009.
• Annual growth in M4 excluding intermediate other financial corporations (a measure monitored by the Bank of England Monetary Policy Committee) was 3.5% in Q2, up from 3.0% in Q1.
• The value of notes and coins in circulation outside the Bank of England rose by 5.0% in July 2012 compared with a year ago, down from 5.8% in June 2012.
Contact: Chris Rhodes, x2454 Updates: Monetary policy meeting: 4 Oct (UK), Bank of England, Monetary and Financial Statistics, 3 Oct
14

RESEARCH PAPER 12/55
D2: Public Finances The independent Office for Budget Responsibility (OBR) forecasts that public borrowing will be £120 billion in 2012/13, equivalent to 7.6% of GDP.
• Public sector net borrowing was £14.4 billion in August 2012, the same as in August 2011.
• Public sector net debt was £1,039.5 billion at the end of August 2012, 66.1% of GDP. At the end of August 2011 net debt was £955.8 billion, 62.7% of GDP.
• Excluding the effects of the £28 billion Royal Mail pension transfer, borrowing so far in 2012/13 was £59 billion. Borrowing for the same period in 2011/12 was £48.4 billion.
• Borrowing for 2011/12 was £119 billion, less than the OBR’s forecast of £126 billion.
£ billion % GDP £ billion % GDP
2009/10 159 11.2 761 52.52010/11 142 9.6 903 60.02011/12 119 7.8 1020 65.62012/13 120 7.6 1,159 71.92013/14 98 5.9 1,272 75.02014/15 75 4.3 1,365 76.32015/16 52 2.8 1,437 76.02016/17 21 1.1 1,479 74.3Source: ONS, OBR. Excludes financial sector interventions
Net borrowing Net debt
Public sector net borrowing (% of GDP)
-6
-4
-2
0
2
4
6
8
10
12
1974/75 1980/81 1986/87 1992/93 1998/99 2004/05 2010/11 2016/17
OBR Forecasts
Public sector net debt (% of GDP)
0
10
20
30
40
50
60
70
80
90
1974/75 1980/81 1986/87 1992/93 1998/99 2004/05 2010/11
OBR Forecasts
Contact: Dominic Webb, x4324 Update: ONS Public Sector Finances, 19 Oct 2012
15

RESEARCH PAPER 12/55
D3: Financial Indicators The leading share index in the UK, the FTSE 100, tracks share-price movements in the country’s 100 largest companies (by market capitalisation). It hit an all-time high of 6,930 in December 1999. It approached those highs again in 2007, before falling sharply in 2008. During the second half of 2011, it rose steadily. It fell in the early months of 2012 due to renewed fears about the Eurozone but has recovered since then.
The price of oil reached an all time high above $145/barrel in July 2008. The price fell below $100/barrel in early June 2012 for the first time since February 2011, but has returned to above $100 again.
The price of gold exceeded $1,800/ounce for the first time in August 2011, but has since fallen.
Data from 01 Oct 2012
FTSE-100 Oil ($/bbl) Gold ($/oz)
01 Oct 2012 5,820.5 112.2 1,771.2%change over:
1-month +1% -0.3% +6%12-months +10% +5% +9%
%change from:cyclical peak -14% -23% -7%
date 15 Jun '07 03 Jul '08 23 Aug '11cyclical trough +66% +208% +149%
date 03 Mar '09 24 Dec '08 24 Oct '08Note: Oil is Brent near-month futures priceSource: Financial Times
FTSE-100 Index
3,000
4,000
5,000
6,000
7,000
2005 2006 2007 2008 2009 2010 2011 2012
daily closing price
Oil price ($ per barrel)
0
25
50
75
100
125
150
2005 2006 2007 2008 2009 2010 2011 2012
daily closing price of Brent crude, near-month futures contract
Gold price ($ per ounce)
0
400
800
1,200
1,600
2,000
2005 2006 2007 2008 2009 2010 2011 2012
daily price
Contact: Chris Rhodes, x2454 Update: Page updated on a weekly basis
16

RESEARCH PAPER 12/55
E1: UK Balance of Trade Annually, the current account deficit in 2011 was £29.0 billion, equivalent to -1.9% of GDP. That compared with £37.3 billion (revised down from £48.6 billion) or -2.5% of GDP in 2010. This change can principally be attributed to an increase in the UK’s trade in services surplus (from £67 billion in 2010 to £76 billion in 2011).
Current Account
• On a quarterly basis, the current account deficit was £20.8 billion in Q2 2012, widening from £15.4 billion in Q2 2012. The surplus on services rose to £17.9 billion while the deficit on goods rose to £28.0 billion.
• The annual current account deficit with EU27 countries in 2011 was £45.6 billion, compared with a surplus with non-EU countries of £17.6 billion. On a quarterly basis, the deficit with EU27 countries fell to £19.5 billion in Q2 2012. With non-EU countries, the current account surplus fell to £1.3 billion.
Trade in Goods and Services
• The estimated deficit on goods trade in July was £7.1bn, narrowing from £10.1bn in June.
• The monthly trade surplus on services was an estimated £5.6bn in July, down slightly from the June surplus of £5.7bn.
• The overall monthly deficit on goods and services combined in July was £1.5bn, narrowing from £4.3bn in June.
• The goods deficit with the EU27 was £4.3bn in July, down from £5.0bn in June, while the deficit with non-EU countries was £2.9bn in July (a record month for exports), down from £5.1bn in June.
Contact: Grahame Allen, x3977 Updates: ONS, UK Trade, 9 Oct; ONS, UK Balance of Payments, 21 Dec
-12%
-7%
-2%
3%
8%
2006 2007 2008 2009 2010 2011
Transfers GoodsIncome ServicesBalance
Contributions to current accout balance(% of GDP)
Current Account Balances£ millions; seasonally adjusted
Goods Services Income Transfers
Current Account Balance
Balance Balance Exports Imports Balance
2010 -98,509 67,007 447,885 479,387 -31,502 14,628 -20,410 -37,2842011 -100,014 76,305 492,880 516,589 -23,709 16,849 -22,142 -29,002
2011 Q2 -24,807 18,547 122,409 128,669 -6,260 8,054 -4,824 -3,030Q3 -27,751 19,793 123,127 131,085 -7,958 2,763 -5,802 -10,997Q4 -24,702 18,998 125,665 131,369 -5,704 3,120 -5,872 -8,456
2012 Q1 -25,415 17,302 123,268 131,381 -8,113 -1,918 -5,335 -15,366Q2 -28,059 17,942 121,118 131,235 -10,117 -5,150 -5,500 -20,767
Source: ONS database, series: BOKI, IKBD, IKBH, IKBI, IKBJ, HBOJ, HBOP
Goods and Services
Goods
Services
-30
-20
-10
0
10
20
30
2009 2010 2011 2012
Balance of trade, goods and services, quarterly data, Balance of trade, goods and services, quarterly data,
17

RESEARCH PAPER 12/55
E2: Exchange rates The Sterling Exchange Rate Index (SERI) measures sterling’s value against a ‘basket’ of currencies, ‘trade-weighted’ (based on currencies’ relative importance in UK trade).
The SERI rose by 0.3% in September, following an increase of 0.1% in August. Compared with the same period last year, the SERI was 6.3% higher. It is now 9.3% above its March 2009 level, when it was at its lowest point since the series began in 1980. However, sterling is still 20.1% down from its pre-recession July 2007 peak. Sterling Exchange Rate Index (SERI)
75
80
85
90
95
100
105
110
1992 1993 1994 1995 1996 1997 1998 1999 2000 2001 2002 2003 2004 2005 2006 2007 2008 2009 2010 2011 2012
16 Sept 1992: UK exit from ERM
[Source: Bank of England, Bankstats database, XUMABK67]
monthly data, Jan 2005=100
US$/£ Exchange Rate
1.4
1.6
1.8
2.0
2.2
2007 2008 2009 2010 2011 2012
$ per £, monthly average
• On average in August, the pound was 4 cents
higher against the dollar compared with August. At the 1 October market close the pound stood at $1.61, the September average.
• Sterling was on average 2 cents higher against
the Euro in September compared with August.
• At the 1 October market close the pound stood at €1.25, the September average. This compares with an all-time low of €1.02 (on 30 December 2008), and a launch rate of €1.48 on 31 December 1998.
€/£ Exchange Rate
Sterling Exchange Rates
1.0
1.1
1.2
1.3
1.4
1.5
1.6
2007 2008 2009 2010 2011 2012
€ per £, monthly average
average rates in period and % changes
Rate% change
on year Rate% change
on year
2009 1.57 -15.5% 1.12 -10.8%2010 1.55 -1.3% 1.17 3.8%2011 1.60 3.7% 1.15 -1.2%
2011 Sep 1.58 1.3% 1.15 -3.6%
2012 Jul 1.56 -3.4% 1.27 12.2%Aug 1.57 -3.8% 1.27 11.0%Sep 1.61 2.1% 1.25 9.2%
Source: Bank of England, Bankstats database
Euro (€)US Dollar ($)
Contact: Aliyah Dar, x5919 Updates: Financial Times, ssterling exchange rates (daily)
Bank of England, SERI & monthly rates, 2 Nov
18

RESEARCH PAPER 12/55
F1: Business and Consumer Confidence Confidence surveys, with information generally released ahead of official statistical data, can indicate changes to the economic outlook as well as turning points in the economic cycle. European Commission Economic Sentiment Indicator
UK
euro zone
5060708090
100110120
2007 2008 2009 2010 2011 2012
monthly index value, long-term average (1990-2011) = 100 UK monthly change on
Index change year ago2010 Sep 100.5 … …2011 Sep 89.8 … …
2012 Jul 94.6 +1.7 -4.22012 Aug 91.5 -3.1 -1.72012 Sep 91.9 +0.4 +2.1
Source: European Commission
• The European Commission conducts regular harmonised surveys for different sectors (manufacturing, services, retail, construction and consumers) of EU member states’ economies.
• Between August and September 2012 the overall UK sentiment index increased by 0.4 points to 91.9. The euro zone index decreased by 1.1 points to 85.0, its lowest level since 2009.
CBI Industrial Trends Survey
-60
-40
-20
0
20
40
2007 2008 2009 2010 2011 2012
future output expectations,% balance expecting improvement/deterioration
balance (as a %) of those expecting an improvementminus those expecting a deterioration
Future output monthly change onexpectations change year ago
2010 Sep +12 … …2011 Sep +9 … …2012 Jul +11 +4 +52012 Aug 0 -11 -132012 Sep +7 +7 -2
Source: CBI, Industrial Trends Survey
• The CBI carries out monthly and quarterly Industrial Trends surveys.
• In September 2012, more manufacturers thought that output would rise over the next three months than thought it would fall – the difference was 7% of firms. This is up from +0% of firms in August.
GfK NOP Consumer Confidence Survey
-60
-40
-20
0
20
40
2007 2008 2009 2010 2011 2012
% balance expecting improvement/deterioration
balance (as a %) of those expecting an improvementminus those expecting a deterioration
Consumer monthly change onConf. Index change year ago
2010 Sep -20 … …2011 Sep -30 … …2012 Jul -29 0 +2012 Aug -2
19 0 +
2012 Sep -22
8 +1 +2Source: GfK NOP for EC, Consumer Confidence
• GfK NOP’s Consumer Confidence Barometer measures a range of consumer attitudes, including forward expectations of the general economic situation and households’ financial positions, and views on making major household purchases.
• Overall consumer confidence was -28 in September 2012. It has been at much the same level for the last year.
Contact: Lorna Booth, x2883
Update: CBI, Industrial Trends, 24 Oct EC, Economic Sentiment Indicator, 30 Oct Gfk NOP, Consumer Confidence, 31 Oct
19

RESEARCH PAPER 12/55
F2: Retail Sales Retail sales are an indicator of household consumption. A number of retail sales surveys are conducted, for instance by the CBI. This page uses official data from the Office for National Statistics.
Value of Retail Sales
-6%
-4%
-2%
0%
2%
4%
6%
8%
2007 2008 2009 2010 2011 2012
latest 3-month period, % change on previous year• The annual increase in the value of retail sales in
the three months to August 2012 was 2.7%.
• The value of retail sales in August 2012 alone showed an increase of 0.2% compared with July 2012.
• The value of retail sales in August 2012 alone was 3.0% higher than in August 2011.
• Internet sales are now estimated to account for
8.1% of all retail sales values, excluding automotive fuel.
Value of Food & non-Food Store Sales
Food
Non-food
-6%
-4%
-2%
0%
2%
4%
6%
8%
2007 2008 2009 2010 2011 2012
latest 3-month period, % change on previous year• The value of sales in food stores in the three
months to August rose by 3.2% on the same period last year.
• The annual rate of increase in the value of sales in non-food stores was 3.3%.
• The ONS commented that feedback from online retailers suggested that sales were lower as consumers watched the Olympics instead of shopping online. Meanwhile stores selling textiles, clothing and footwear (including sports clothes) saw an increase in sales, as did other stores (which includes stores selling sporting goods and toys).
Value of Retail Sales
annual data and latest 3-month period, % change on previous year; seasonally adjusted
Food StoresClothing & Footw ear
Household goods Other Total
2010 1.6 5.4 -3.5 2.0 2.6 2.72011 4.2 3.4 -2.7 0.4 1.1 5.02012 Apr 3.1 1.0 0.6 -0.1 1.5 3.2
May 2.9 0.8 1.7 0.3 2.2 3.2Jun 2.7 -0.9 1.9 0.6 1.9 2.0Jul 3.5 1.0 1.9 1.8 2.8 2.8Aug 3.2 2.0 0.8 3.9 3.3 2.7
Source: ONS, series: IEAU, IEBJ, IEBM, IEBA, IEAX, J5BY
Non-Food Stores All retailing
total
Contact: Lucinda Maer, x3841 Update: ONS, Retail Sales, 18 Oct 2012
20

RESEARCH PAPER 12/55
F3: Housing Market House prices on the Nationwide index fell by 0.4% in September 2012 after rising by 1.1% in September. Prices were 1.4% lower in September compared with a year ago on this measure. House prices on the Halifax index fell by 0.4% in August 2012 following a 0.7% decline in August. Prices are now 1.1% lower than a year ago on this measure.
Numbers of mortgage approvals have remained generally flat since early 2010, at below half of pre-recession levels. Housing starts have increased since the recession but still remain well below pre-recession levels.
House price indices Halifax house price index
Latest monthly dataUK, seasonally adjusted
Halifax Nationw ide
Latest data Aug-12 Sep-12
Change in month -0.4% -0.4%Change in year -1.1% -1.4%
Peak date Aug-07 Oct-07Change since peak -19.7% -12.4%
Trough date Apr-09 Feb-09Change since trough +3.6% +8.6%
• The recovery in house prices since early 2009 has been tepid. In mid-2012 the average house price on the Halifax and Nationwide measures was just over £160,000.
• There is considerable regional variation. In Q3 2012 prices rose by 2% in London but fell by 9% in Northern Ireland compared with a year earlier (Nationwide data).
-4
-3
-2
-1
0
+1
+2
+3
2007 2008 2009 2010 2011 2012
monthly % change (SA) UK
Nationwide house price index
-3
-2
-1
0
+1
+2
+3
2007 2008 2009 2010 2011 2012
monthly % change (SA), UK
Mortgage approvals
0
50
100
150
2007 2008 2009 2010 2011 2012
monthly number (thousands SA), UK • Bank of England data on the number of mortgages
approved to finance house purchases are a leading indicator of house sales.
• There were 47,665 mortgage approvals in August a 0.2% rise on July. The number of approvals has remained generally flat since early 2010.
House-building
Starts
Completions
0
10
20
30
40
50
60
2007 2008 2009 2010 2011 2012
quarterly number (thousands SA), England
• There were 21,540 house building starts in England in
Q2 2012, down 9.6% from 23,820 in Q1 2012. This is above the low of 14,470 in Q1 2009, but still well below the 46,190 starts in Q1 2007.
• There were 29,470 dwelling completions in Q2 2012, down from 31,350 in Q1 2012.
Contact:
Aliyah Dar, x5919 Updates:
Halifax House Price Index, early Oct; Bank of England, Lending to Individuals, 29 Oct; Nationwide House Price Index, early Nov; DCLG, House-building, 15 Nov;
21

RESEARCH PAPER 12/55
F4: Household debt Changes in monthly net lending, £bn
-2
0
2
4
6
8
10
12
2007 2008 2009 2010 2011 2012Source: Bank of England
Total net lending
Data on lending to individuals is published on a monthly basis and is seasonally adjusted.
• Total net lending to individuals (excluding student loans) fell by £0.4 billion in August 2012. This compares with an increase of £0.6 billion in July.
• Monthly net unsecured lending fell by £0.1 billion in August, compared with a decrease of £0.2 billion in July.
• Monthly net secured lending (mortgages) fell by £0.3 billion in August, compared with an increase of £0.9 billion in July.
Current average mortgage interest rates
0%
2%
4%
6%
8%
2008 2009 2010 2011 2012
Average SVR
2‐year fixed (75% LTV)
2‐year discounted (75% LTV)
• Average interest rates offered by banks and
building societies have fallen sharply since late 2008.
• The average Standard Variable Rate (SVR) in August was 4.27%, compared with 4.10% a year previously.
• The average fixed mortgage rate was 3.69% in August (3.00% a year ago). The average discounted rate was 3.54% in August (2.69% a year ago). These figures are for a loan to value ratio of 75%.
Individual insolvencies, England and Wales
0
10,000
20,000
30,000
40,000
Q1 2007
Q3 Q1 2008
Q3 Q1 2009
Q3 Q1 2010
Q3 Q1 2011
Q3 Q1 2012
Source: Insolvency Service
not seasonally adjusted
• There were 27,390 individual insolvencies in England and Wales in Q2 2012, a 10.2% decrease on a year earlier. These figures are not seasonally adjusted and are a provisional estimate.
• In Scotland in Q2 2012 there were 5,601 individual insolvencies, an increase of 5.3% on Q2 2011.
• In N Ireland in Q2 2012 there were 796 individual
insolvencies, a rise of 5.9% on Q2 2011.
Contact: Dominic Webb, x4324 Update: Bank of England, Lending to Individuals, 29 Oct Insolvency Service, Insolvency Statistics, 2 Nov
22

RESEARCH PAPER 12/55
5 Indicator sources The table gives details of sources used in this paper. Office for National Statistics (ONS) releases are available from http://www.ons.gov.uk/ons/release-calendar/index.html.
Indicator Source details A1 Gross Domestic
Product ONS releases: GDP Preliminary Estimate; Second Estimate of GDP; Quarterly national accounts HM Treasury, Forecasts for the UK Economy
A2 GDP: International Comparisons
Gross Domestic Product: Organisation for Economic Co-operation and Development (OECD), Main Economic Indicators, via Stat.OECD database (link to user defined table) Growth Forecasts: OECD, Economic Outlook (full document via www.sourceoecd.org); IMF World Economic Outlook database and updates European Commission’s growth forecasts
A3 Components of GDP
ONS releases: Second Estimate of GDP; Quarterly national accounts
A4 Output and Employment by Industry
ONS releases: GDP Preliminary Estimate; Second Estimate of GDP; Quarterly national accounts
A5 Manufacturing ONS, Index of Production Markit/CIPS UK Manufacturing Purchasing Managers Index SMMT, Vehicle Production
A6 Productivity ONS, Labour Productivity
B1 Inflation ONS, Consumer Price Indices
B2 Inflation: International
CPI: OECD, Main Economic Indicators (link to user defined table); EU data: Eurostat news release and database
B3 Average Earnings Index
ONS, Labour Market Statistics
C1 Employment ONS, Labour Market Statistics
C2 Unemployment: National
ONS, Labour Market Statistics
C3 Unemployment: Regional
ONS, Labour Market Statistics and Regional Labour Market Statistics
C4 Unemployment: International Comparisons
Data: OECD, Main Economic Indicators Commentary: OECD, Economic Outlook (full document via www.sourceoecd.org)
23

RESEARCH PAPER 12/55
Indicator Source details D1 Interest Rates
and the Money Supply
UK: Bank of England, Monetary Policy Committee decisions & minutes US: Federal Reserve, Federal Open Market Committee decisions ECB: European Central Bank news releases Bank of England: Bankstats, tables A 1.1 and A 2.2.1; and ONS Database.
D2 Public Finances Data: ONS, Public sector finances; Forecasts of budget balance: Office for Budget Responsibility .
D3 Financial Indicators
Financial Times, Markets Data
E1 UK Balance of Trade
ONS, UK Balance of Payments ONS, UK Trade
E2 Exchange Rates Sterling effective exchange rates and sterling-dollar/euro rates: Bank of England, Bankstats database (annual and monthly)
F1 Business and Consumer Confidence
European Commission: Economic Sentiment Indicator Future Output Expectations/Quarterly Business Confidence: Confederation of Business Industry (CBI), Economic and Business Outlook and Quarterly Industrial Trends Survey press releases; Consumer Confidence: GfK NOP Consumer Confidence Index
F2 Retail Sales ONS, Retail Sales
F3 Housing Market Bank of England: Lending to Individuals; Department for Communities and Local Government (DCLG) UK Housing Starts: table 201; Halifax house price data: housing research page; Nationwide house price data: data page
F4 Household Debt Bank of England: Lending to Individuals; The Insolvency Service: Insolvency Statistics
24

RESEARCH PAPER 12/55
6 Glossary Symbols and abbreviations .. Figure(s) not yet available CBI Confederation of British Industry ILO International Labour Organisation IMF International Monetary Fund OECD Organisation for Economic Co-operation
and Development ONS Office for National Statistics Definitions1
Balance of payments: A country’s financial position, with other countries of the world, comprising two parts:
Current account: the balance of imports and exports of goods and services, income and transfers combined;
Capital account: the difference between a country’s capital invested in other countries, and the capital invested by other countries in it.
Technically, the two parts always balance. A balance of payments deficit normally refers to a current account deficit.
Balance of trade: The difference between a country’s exports and imports of either goods only or goods and services combined. Trade in financial services account for around a third of UK exports, and thus partially offsets trade in goods deficits.
Basic prices: Prices excluding taxes and subsidies on products.
Claimant count: The number of people claiming Jobseeker’s Allowance (JSA) benefits.
Consumer Prices Index (CPI): This is the headline UK domestic measure of inflation. It measures the average change from month to month in the prices of consumer goods and services purchased in the UK.
Current account balance: The difference between receipts/payments due to transactions in goods, services, income and transfers between the UK and all other countries. A current account deficit means that total payments exceed total receipts; in the reverse case, the current account is in surplus.
Current budget: Measures the balance of public sector current account revenue over public sector current expenditure.
Current/constant prices: Current prices are the actual or estimated recorded monetary value over a defined period for a group of industries or products. They show the value for each item expressed in terms of the prices of that period.
Constant prices refer to volume measures whose values are derived by applying to current quantities, prices for a specific base period. They allow figures to be represented so that the effects of inflation are removed. The values for each time period are expressed in terms of the prices in a particular base period.
Economically active: Those aged 16 and over who are either in employment or unemployed.
Economically inactive: Those aged 16 and over who are neither in employment nor unemployed. This includes those who do not want a job, those who want a job but have not been seeking work in the last four weeks and those who want a job and are seeking work but not available to start work.
Employment: The number of people with jobs as estimated by the Labour Force Survey (LFS). This includes all people aged 16 or over who did paid work, those who had a job that they were temporarily away from, those on government supported training and employment programmes, and those doing unpaid family work during the survey period. The employment rate refers to the number of people employed as a percentage of the working age population as measured by the LFS.
Exchange rate: The rate at which one currency is traded against another.
Gross Domestic Product (GDP): The total market value of goods and services produced after deducting the cost of goods and services used up in the process of production (intermediate consumption) but before deducting consumption of fixed capital (depreciation).
Gross Domestic Product – Real GDP: Also known as constant price or chained volume measure, this is a measure used to indicate change in the actual quantity of goods and services produced, by adjusting for inflation.
Gross Fixed Capital Formation (GFCF): Expenditure on fixed assets (buildings, vehicles etc.) either for replacing or adding to the stock of existing assets. Business investment is GFCF by the private sector and public corporations on transport equipment, other machinery and equipment and new dwellings and structures other than dwellings.
1. Sources: ONS, HM Treasury, HM Revenue and Customs, Finance-Glossary.com.
25

RESEARCH PAPER 12/55
Gross Value Added (GVA): The difference between output and intermediate consumption for any given sector/industry. That is the difference between the value of goods and services produced and the cost of raw materials and other inputs which are used up in production. GVA is used to measure the productivity of sectors/industries and economies.
Harmonised Indices of Consumer Prices (HICP): Harmonised indices of consumer prices for Member States of the European Union, which enable comparisons to be made across countries. The UK’s CPI measure uses HICP methodology.
Market prices: The prices actually paid by the purchaser for goods and services, including transport costs, trade margins and taxes. GDP at market prices = GDP at basic prices + transport prices paid separately + non deductible taxes on expenditure - subsidies received.
Money supply: The total amount of money in an economy at a given time.
The Public Sector Net Borrowing (PSNB): This measures the public sector’s accumulation of debt net of liquid financial assets. Its approximate stock equivalent is net public sector debt.
Public Sector Net Debt: This is approximately the stock analogue of the PSNB. It measures the public sector’s financial liabilities to the private sector and abroad, net of short-term financial assets such as bank deposits and foreign exchange reserves.
Retail Prices Index (RPI): A domestic indicator of inflation. It measures the average change from month to month in the prices of goods and services purchased in the UK. It is similar to the CPI, but differs in terms of methodology and coverage. For example, the RPI includes housing costs such as mortgage interest payments while the CPI doesn’t.
Seasonally adjusted: Estimates in which the element of variability due to seasonal influences, which may distort the data, has been removed.
Sterling Exchange Rate Index (SERI): This measures the value of sterling against a trade-weighted ‘basket’ of other currencies. The weights used in this index measure currencies’ relative importance to UK trade in goods and services.
UK Base/Repo rate: The rate at which the Bank of England lends to discount houses by buying their bills. The base rate is usually the minimum rate at which banks are prepared to lend money. The high street bank base rate follows that set by the Bank of England, and it acts as the benchmark for [cont]
other interest rates, including mortgages and personal loans.
Unemployment: The ILO definition includes all people who are: out of work, want a job, have actively sought work in the previous four weeks and are available to start work within the next fortnight; or are out of work and have accepted a job that they are waiting to start in the next fortnight.
Unemployment rate: The number of unemployed persons expressed as a percentage of the total economically active population.
Volume/value of retail sales: The volume of retail sales is the total takings adjusted for inflation and the value of retail sales is the total actual takings.
Workforce jobs: The sum of employee jobs, self-employment jobs, those in HM Forces and government-supported trainees.
26