economic issues of broiler production length
TRANSCRIPT
633
Original scientific paper
EP 2014 (61) 3 (633-646)
Economics of Agriculture 3/2014UDC: 636.5:330.143
ECONOMIC ISSUES OF BROILER PRODUCTION LENGTH
ECONOMIC ISSUES OF BROILER PRODUCTION LENGTH
László Szőllősi1, István Szűcs2, András Nábrádi3
Summary
The length of broiler production cycle is also an important factor when profitability is measured. This paper is to determine the effects of different market ages and down-time period, overall broiler production cycle length on performance and economic parameters based on Hungarian production and financial circumstances. A deterministic model was constructed to manage the function-like correlations of age-related daily weight gain, daily feed intake and daily mortality data. The results show that broiler production cycle length has a significant effect on production and economic performance. Cycle length is determined by the length of down-time and grow-out periods. If down-time period is reduced by one day, an average net income of EUR 0.55 per m2 is realizable. However, the production period is not directly proportional either with emerging costs or obtainable revenues. Profit maximization is attainable if the production period is 41-42 days.
Key words: annual broiler cycles, slaughter age, down-time period, profit maximization, simulation model.
JEL: Q12
IntroductionPoultry are kept in most areas of the world and provide an acceptable form of animal protein to most people throughout the world. Intensively kept broiler is seen as a way of rapidly increasing animal protein supplies for rapidly increasing urban populations. Broilers are relatively low priced, reproduce rapidly, and have a high rate of productivity (FAO, 1999). Broiler production is characterized by its high economic return due to its short production cycle, where the production cycle of broiler takes 6-7 weeks meanwhile the production cycle of bovine takes from 3 to 12 months. Therefore the capital cycle is very rapid in
1 László Szőllősi, Ph.D., Assistant Professor, University of Debrecen, Faculty of Economics and Business, Böszörményi Street 138, H-4032 Debrecen, Hungary, Phone: +36 52 526 917, E-mail: [email protected]
2 István Szűcs, Ph.D., Associate professor, University of Debrecen, Faculty of Economics and Business, Böszörményi Street 138, H-4032 Debrecen, Hungary, Phone: +36 52 526 912, E-mail: [email protected]
3 András Nábrádi, Ph.D., Professor, University of Debrecen, Faculty of Economics and Business, Böszörményi Street 138, H-4032 Debrecen, Hungary, Phone: +36 52 526 911, E-mail: [email protected]
634 EP 2014 (61) 3 (633-646)
László Szőllősi, István Szűcs, András Nábrádi
the case of broiler production as compared with the capital cycle in other types of animal production. In the case of broiler production the capital cycle can be repeated 6-7 times a year (Grepay, 2009).
The sales price of broiler products and the price of feed, determining the major cost item (Horne, 2013), the costs of feed changed unfavourably during the previous period. It is necessary to emphasize the significant volatility of the price of feed materials (Rezitis, Stavropoulos, 2009), which is a major uncertainty factor for the poultry sector. Today competitive broiler production cannot be conceived without the thorough knowledge of the affecting determinant factors and their effective applications (Zoltán, 2010). Besides the improvement of production parameters, the efficient exploitation of available resources, e.g. useful floor areas are of key significance.
Genetic improvement, in addition to maximizing live performance in poultry production, has allowed a reduction of age to market. Every year the marketing age of broilers decreases by an average of 0.75 days for the same performance (Gunasekar, 2006). According to Ziggers (2013), in 2020 the Ross 308 broiler will grow to 2.3 kg in 34 days with a feed conversion ratio (FCR) of 1.37. Currently in New Zealand male broilers already reach 2 kg bodyweight in 28-30 days with an FCR of 1.4.
Zoltán (2010) underlines that market demands and economic potentials do not determine merely the volume of activities and their cost-benefit relations, but also the used type and body weight along with market age, the method of processing, product types and packaging. During the last decades, eating habits have globally changed, with a strong preference for meat cuts and processed meat, and consequently the market of chicken cuts has exceeded the whole-bird market (Schmidt, 2008). Popp (2014) claims that in the coming ten years chicken meat will remain the most favourite and cheapest meat, satisfying consumer demands in the form of chicken cuts. This has led to later-finishing birds for the production of commercial cuts because larger birds present higher yield and higher added value (Schmidt, 2008).
An aspect of measuring profitability that is often forgotten is that of time, but time also has an effect on the biological efficiency of the bird (Kleyn, 2002). Thus in addition to several other factors, the profitability of broiler production is also affected by the number of annual cycles as well. Cycle length is also an important factor when the annual return from the broiler business is considered. Extending cycle length will increase the return per bird, whereas, shortening the grow-out time will increase the number of harvests per year (Samarakoon, Samarasinghe, 2012). The number of annual cycles is influenced, on one hand by the length of the down-time period (the period when the floor area is empty) between rotations; on the other hand, the length of the production period of one turn (Aliczki, Bárány, 2013). The former is the period spent on leaning, disinfection and resting while the latter is the function of desired body weight and daily weight gain. Kleyn (2002) pointed out that a 38-day grow-out with an 11-day down-time would lead to an extra harvest per year compared to the traditional practice of 42-day cycles with 14-day intervals. The yearly number of broiler production cycles can be calculated by the following equation:
635EP 2014 (61) 3 (633-646)
ECONOMIC ISSUES OF BROILER PRODUCTION LENGTH
where,
Broilers should be sold at an optimal weight. More profit can be achieved if broilers can be sold at an optimal market weight and meet consumer preferences and market needs (Wang et al., 2012). Increasing the slaughter age is advantageous for processors because it provides highly meaty animals. However, the effects on profit, meat product quality, the environment, and animal welfare have been little investigated (Baéza et al., 2011).
Goliomytis et al. (2003) made a study to investigate the growth pattern of chickens beyond the common slaughter age of 42 days to maturity. Schmidt (2008) carried out a study in an integrated company to evaluate live and economic performance of broilers as a function of market age. Baéza et al. (2011) made a study to evaluate the effects of increasing slaughter age on technical and economic factors, including production efficiency and environmental costs, bird welfare, and breast meat quality in a modern heavy broiler line. Samarakoon, Samarasinghe (2012) made a survey to determine the most profitable grow-out period for broilers using different cost related performance indices. Wang et al. (2012) developed a computer simulation model to evaluate the optimal market age of broilers.
Bodyweight at slaughter increased progressively with age. Net gain, which takes into account both the feed and rearing costs, reached a maximum between 42 and 49 days of age, and then decreased (Baéza et al., 2011). The results of Goliomytis et al. (2003) showed that live bodyweight was rapidly increasing until 44 days of age only, at which maximal growth rate was attained. Beyond this age, growth rate declined and approached zero at maturity.
Feed consumption increased until 84 days of age. The cumulative feed conversion grew at a decreasing rate, but continuously with increasing age (Goliomytis et al. 2003; Wang et al., 2012). Schmidt (2008) determined a 2.1% increase in FCR per day of market age increase.
Goliomytis et al. (2003) mentioned increased age-related mortality and identified its cause in the incidence of leg weakness due to higher body weight. According to results of Baéza et al. (2011), mortality increased from 42 days of age, reaching 5- to 7-fold greater values for broilers reared until 63 days than for broilers reared until 35 or 42 days. Results by Schmidt (2008) highlighted approximately 1% point of increase in mortality between 43 and 46 days of age.
Baéza et al. (2011) pointed out the meat yield increased regularly with age at slaughter. However, estimation of the net gain based on the amount of chickens produced in relation to feed and other production costs was optimal at 42 days of age. According to Schmidt (2008), the net gain reached a maximum between 42 and 49 days of age, and then decreased. It highlights the limitations of increasing broiler age beyond 49 days, mainly because of increased mortality and decreased feed efficiency which both affected the economic efficiency of broiler meat production.

636 EP 2014 (61) 3 (633-646)
László Szőllősi, István Szűcs, András Nábrádi
Schmidt (2008) summarized the findings and claimed that increasing market age significantly affects production efficiency, which may result in higher production costs. Taking into account the main aspects of sustainability (economic and environmental), Baéza et al. (2011) recommended slaughtering chickens at 42 days of age.
The time-related development of indices does not reveal linear correlations between day of life and efficiency. Daily weight gain grows at a decreasing rate as a function of time, reaches its maximum value between 35-42 days of life and then starts to decrease. Simultaneously, specific feed utilization grows proportionately with the growing age of chickens. At the beginning of the production period, a significant amount of energy is used for growing but later most of it is used for subsistence. Although feed intake for chickens increases as time passes and their body weight gets higher, less and less feed intake energy is needed for weight gain (Zoltán, 2010). These correlations are worth considering especially chickens are to be marketed with higher body weight. On one hand, possible failures during the production period emerge more markedly if body weight is higher; on the other hand, the appropriate utilization of capacities and the number of cycles are also key economic issues.
Therefore, this study aimed at determining the effects of different market ages and different down-time period, overall broiler production cycle length on performance and economic parameters based on Hungarian production and financial circumstances.
Materials and methods
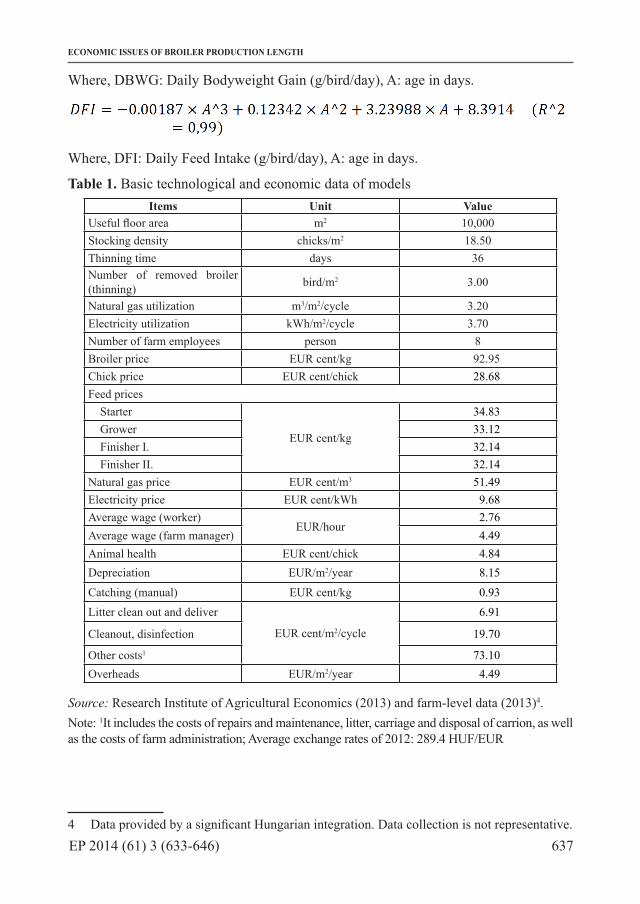
A deterministic simulation model was established for the examination of the cost and income situation of broiler production. Different technological and economic input parameters were used for the model (Table 1). Technological parameters included the technical efficiency indicators of production in which the base values were calculated from farm-level data. The economic parameters contained the Hungarian input and output prices of production as well as its unit cost items relating to the year of 2012.
The simulation model shows the function-like relations expressing the development of age-related daily bodyweight gain, daily feed intake and daily mortality. To determine the parameters of the function we have built on the performance (Aviagen, 2012) identified by ROSS 308 hybrid producers. The standard in Ross 308 broiler as-hatched performance is the achievement of 2.77 kg live weight with an FCR of 1.72 at 42 days of age in recent times (Aviagen, 2012). Average farm level data in our study failed to reach this value; daily weight gain is about 7% and daily feed intake is 3% lower: 2.59 kg live weight with an FCR of 1.88 at 42 days of age. Performance data broken down into days of life, published by Aviagen (2012), (daily weight gain, daily feed intake) were corrected according to these differences and a trend function was fitted to the data. Accordingly, the following correlations were used for modelling:
637EP 2014 (61) 3 (633-646)
ECONOMIC ISSUES OF BROILER PRODUCTION LENGTH
Where, DBWG: Daily Bodyweight Gain (g/bird/day), A: age in days.
Where, DFI: Daily Feed Intake (g/bird/day), A: age in days.
Table 1. Basic technological and economic data of modelsItems Unit Value
Useful floor area m2 10,000Stocking density chicks/m2 18.50Thinning time days 36Number of removed broiler (thinning) bird/m2 3.00
Natural gas utilization m3/m2/cycle 3.20Electricity utilization kWh/m2/cycle 3.70Number of farm employees person 8Broiler price EUR cent/kg 92.95Chick price EUR cent/chick 28.68Feed prices
Starter
EUR cent/kg
34.83Grower 33.12Finisher I. 32.14Finisher II. 32.14
Natural gas price EUR cent/m3 51.49Electricity price EUR cent/kWh 9.68Average wage (worker)
EUR/hour2.76
Average wage (farm manager) 4.49Animal health EUR cent/chick 4.84Depreciation EUR/m2/year 8.15
Catching (manual) EUR cent/kg 0.93Litter clean out and deliver
EUR cent/m2/cycle
6.91
Cleanout, disinfection 19.70
Other costs1 73.10Overheads EUR/m2/year 4.49
Source: Research Institute of Agricultural Economics (2013) and farm-level data (2013)4.Note: 1It includes the costs of repairs and maintenance, litter, carriage and disposal of carrion, as well as the costs of farm administration; Average exchange rates of 2012: 289.4 HUF/EUR
4 Data provided by a significant Hungarian integration. Data collection is not representative.

638 EP 2014 (61) 3 (633-646)
László Szőllősi, István Szűcs, András Nábrádi
Daily mortality was determined on the basis of the mean value of farm level data by function fitting which can be divided into 3 phases:
Where, DM1-7d: Daily Mortality between 1-7 day of age (%), A: age in days.
Where, DM8-41d: Daily Mortality between 8-41 day of age (%), A: age in days.
Where, DM42-49d: Daily Mortality above 42 day of age (%), A: age in days.
According to Esmail (2013), there are many factors (flock size, stocking rate, temperature, lighting, feed and water factors, etc.) which affect feed intake, bodyweight gain and mortality of chickens and hence determine the efficiency of broiler production. This study is beyond the scope of evaluating these factors’ effects, so the before mentioned function-like relations are regarded as constants.
The output parameters of the model include production efficiency indicators, economic indicators per production and capacity units which were determined for a cycle and for one year as well.
According to Wang et al. (2012) the highest EPEF value gives the optimum return, and the best slaughtering age is the day where the highest EPEF as well as the lowest FCR is achieved. However, our objective in broiler production is to measure profit per production unit, in this case per m2 of house space per unit time (Kleyn, 2002; Samarakoon, Samarasinghe, 2012). So, yearly net income per m2 was used to measure economic performance as a function of broiler production cycle length.
Results and discussion
In Hungary, the production period is usually 42-44 days. The length of the production period and final bodyweight is responsive to market demands. With 42-day production and 14-day downtime periods the annual rotation is 6.5. If this period is shorter, space utilization, specific feed utilization and the volume of produced meat/m2 are more favourable and similarly, the fixed costs per one kg of production decrease. When rotation is planned, the period of time required by stock changes (cleaning, floor area preparation) is to be taken into consideration, because it remains constant irrespective of the length of the production period. The floor area should be prepared for the next livestock as fast as possible. However, this process has got its biological limitations.
It should be emphasized that poultry industry and market features, due especially to the lower volume of slaughter during the Christmas and New Year periods are difficult to
639EP 2014 (61) 3 (633-646)
ECONOMIC ISSUES OF BROILER PRODUCTION LENGTH
calculate precisely. The number determined by theoretical calculations could be merely workable if the activities of chick transporting and slaughtering-processing plants could be precisely coordinated with chick placement and slaughter periods. However, such “fine tuning” fails to work in practice, even in integration. At the same time, participation in integration can provide better potentials for programming and planning.
Economic effects of down-time period length
Under Hungarian climatic conditions, with our available technical background and management potentials, broiler producers have 10-14 day long down-time periods. Due to the volatility of programming day-old chick and slaughter chicken transport 7 cycles rarely take place annually. Most frequently, more than 50% of broiler producers rear 6.2-6.4 rotations annually. 6.5-6.8 turns are realizable for 20-25% of producers, the rest of them raises less than 6 cycles and exclude one-two winter cycles.
The following part of our paper strives to demonstrate the effects of down-time period on the development of economic markers. On one hand, down-time period is measured by the length of the down-time period, on the other hand by the excluded winter cycle. We have prepared three model calculations for the investigation. In the first one we used a shorter, 10-day long down-time period. In the second one a 14-day long period was supposed. In the third one we calculated with a 14-day long period and 1 excluded winter cycle. On average, supposing a production period of 42 days and a down-time period of 14 days, annually 6.5 cycles can be completed. Given a shorter, 10-day long period with constant production period, the number of annual cycles can be increased to 7. With a down-time period of 14 days and 1 excluded winter turn the number of realizable rotations is 6. As for cash-flow, revenue and expenditure in rotations do not emerge on a pro-rata basis; however, incurred costs and realizable income can be managed on a pro-rata basis from the viewpoint of evaluating the distribution of income and expenditure. We considered this economic principle in the assessment of the economic results of cycles without whole numbers.
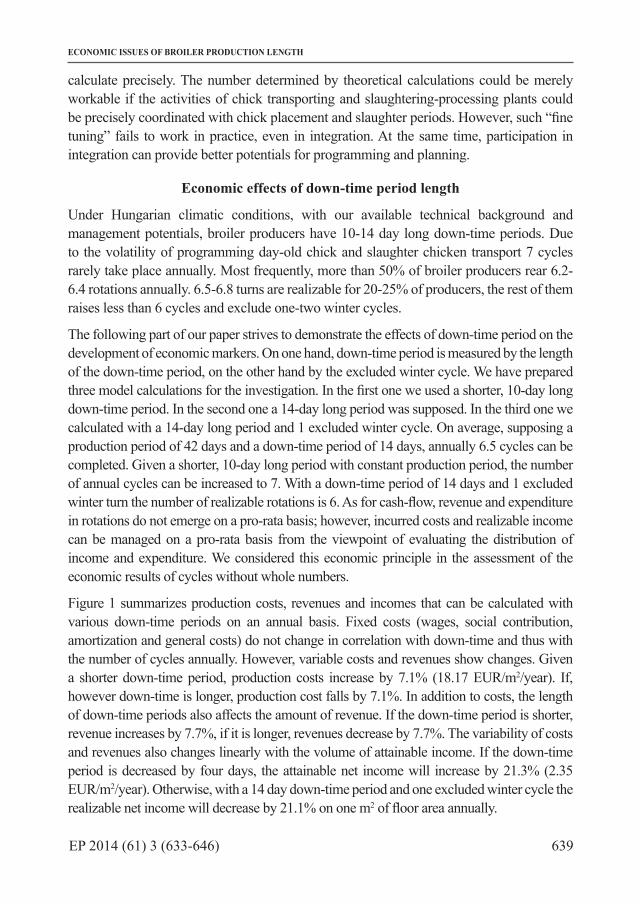
Figure 1 summarizes production costs, revenues and incomes that can be calculated with various down-time periods on an annual basis. Fixed costs (wages, social contribution, amortization and general costs) do not change in correlation with down-time and thus with the number of cycles annually. However, variable costs and revenues show changes. Given a shorter down-time period, production costs increase by 7.1% (18.17 EUR/m2/year). If, however down-time is longer, production cost falls by 7.1%. In addition to costs, the length of down-time periods also affects the amount of revenue. If the down-time period is shorter, revenue increases by 7.7%, if it is longer, revenues decrease by 7.7%. The variability of costs and revenues also changes linearly with the volume of attainable income. If the down-time period is decreased by four days, the attainable net income will increase by 21.3% (2.35 EUR/m2/year). Otherwise, with a 14 day down-time period and one excluded winter cycle the realizable net income will decrease by 21.1% on one m2 of floor area annually.
640 EP 2014 (61) 3 (633-646)
László Szőllősi, István Szűcs, András Nábrádi
Figure 1. Comparison of the division of annual costs and incomes with different down-time periods
Source: own calculation.
Differences of length in the down-time period of floor areas per 100 kg live weight can also be observed if annual data are considered. Table 2 summarizes specific economic figures. Variable costs show no specific changes in relation to the length of the down-time period. Such kind of variable costs are chick, animal health and energy costs. By contrast, the development of fixed costs per a unit of live weight is affected by the live weight produced on an annual basis and produced live weight is influenced the number of cycles. Accordingly, with a shorter down-time period specific production costs decrease by 0.55% (0.51 EUR/100 kg). Due to this, the net income per a unit of product increases by 12.7%. Given a longer down-time period, costs specifically increase by 0.64% (0.57 EUR/100 kg), which can reduce the net income of 100 live weight by 14.8%.
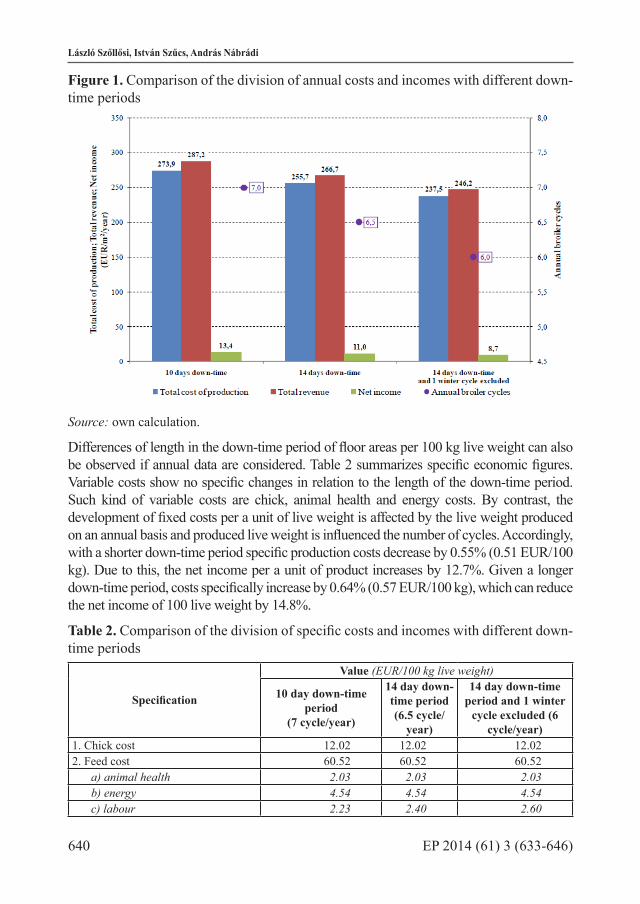
Table 2. Comparison of the division of specific costs and incomes with different down-time periods
Specification
Value (EUR/100 kg live weight)
10 day down-time period
(7 cycle/year)
14 day down-time period(6.5 cycle/
year)
14 day down-time period and 1 winter
cycle excluded (6 cycle/year)
1. Chick cost 12.02 12.02 12.022. Feed cost 60.52 60.52 60.52
a) animal health 2.03 2.03 2.03b) energy 4.54 4.54 4.54c) labour 2.23 2.40 2.60
641EP 2014 (61) 3 (633-646)
ECONOMIC ISSUES OF BROILER PRODUCTION LENGTH
Specification
Value (EUR/100 kg live weight)
10 day down-time period
(7 cycle/year)
14 day down-time period(6.5 cycle/
year)
14 day down-time period and 1 winter
cycle excluded (6 cycle/year)
d) depreciation 2.64 2.84 3.08e) other 3.19 3.19 3.19f) overheads 1.45 1.57 1.70
3. Farm costs (a+b+c+d+e+f) 16.09 16.57 17.144. Total costs of production (1+2+3) 88.62 89.11 89.685. Total revenues 92.95 92.95 92.956. Net income (5-4) 4.33 3.84 3.277. Profitability (%), (6/4×100) 4.88% 4.31% 3.65%
Source: own calculation.
In the case of a 7 day down-time period (7.4 annual cycles) the production cost is 88.26 EUR/100 kg. By contrast, in the case of a 16 day down-time period (number of annual cycles 6.3) production cost increases to 89.35 EUR/100. It means that once the down-time period is increased by one day, specific costs grow by EUR 0.12. As the number of rotations exercises no effects on specific revenues (what practically stands for selling price) attainable income changes proportionately with the cost, but in the opposite direction. What does it mean on an annual basis per one m2? Once the down-time period is reduced by one day, production costs increase by EUR 4.28, revenues grow by EUR 4.84 on average, generating EUR 0.55 higher incomes per m2.
Economic effects of slaughter age
Following the introduction of the impact of the length of the down-time period the effects of the length of the production period on the division of income in broiler production are to be investigated. The length of the production time exerts a fundamental impact on final body weight and thus on the average weight, average daily weight gain plotted against the curve of body weight gain, the volume of utilized feed plotted against the feed intake curve and consequently specific feed utilization and mortality rate. The increase of stocking density (live weight on one m2) related to the length of the production period above the optimal level (regarding animals’ well-being) can, on one hand, negatively influence the development of production indices; on the other hand, the maximum value stipulated by the EU 42 kg/m2 shall not be exceeded. Our calculation considered these latter factors set against the variation of mortality rate, with constant placement density. Due to professional reasons, the removal of 3 birds on day 36th to improve stocking density was merely applied if the production period was 39 day long or longer.
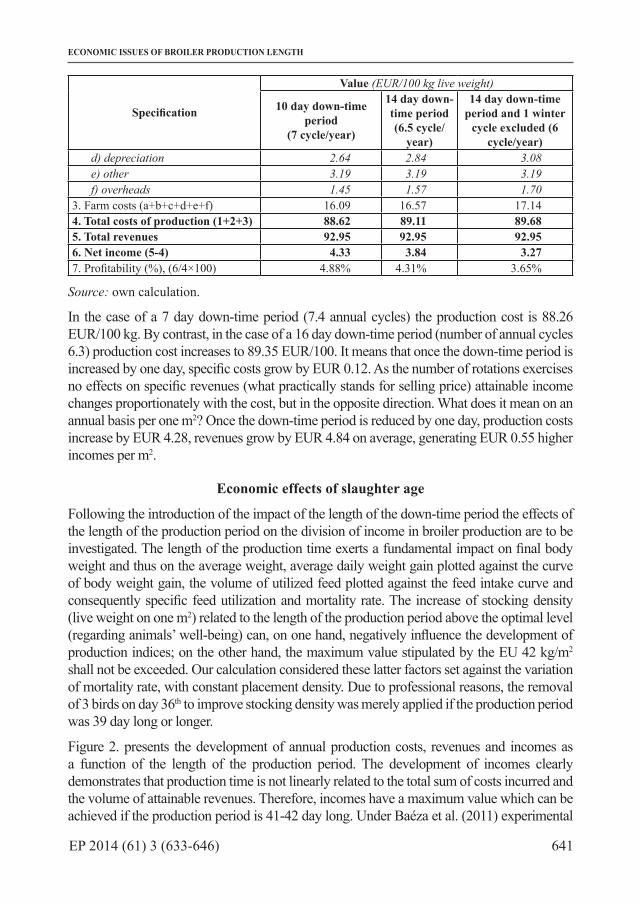
Figure 2. presents the development of annual production costs, revenues and incomes as a function of the length of the production period. The development of incomes clearly demonstrates that production time is not linearly related to the total sum of costs incurred and the volume of attainable revenues. Therefore, incomes have a maximum value which can be achieved if the production period is 41-42 day long. Under Baéza et al. (2011) experimental
642 EP 2014 (61) 3 (633-646)
László Szőllősi, István Szűcs, András Nábrádi
conditions, economic profit evaluated through the net gain reached a maximum at 42 days also. Consequently, this optimal condition is to be provided in practice. It is evident that after 42-43 days income falls sharply; moreover, the production becomes loss-making after day 50. Revenues, in contrast to the progressive growth of body weight, show a degressive growth pattern due to the growing rate of mortality. Simultaneously, costs rise continuously as a function of production time.
Figure 2. Effects of production period length on annual cost and income indicators
Source: own calculation
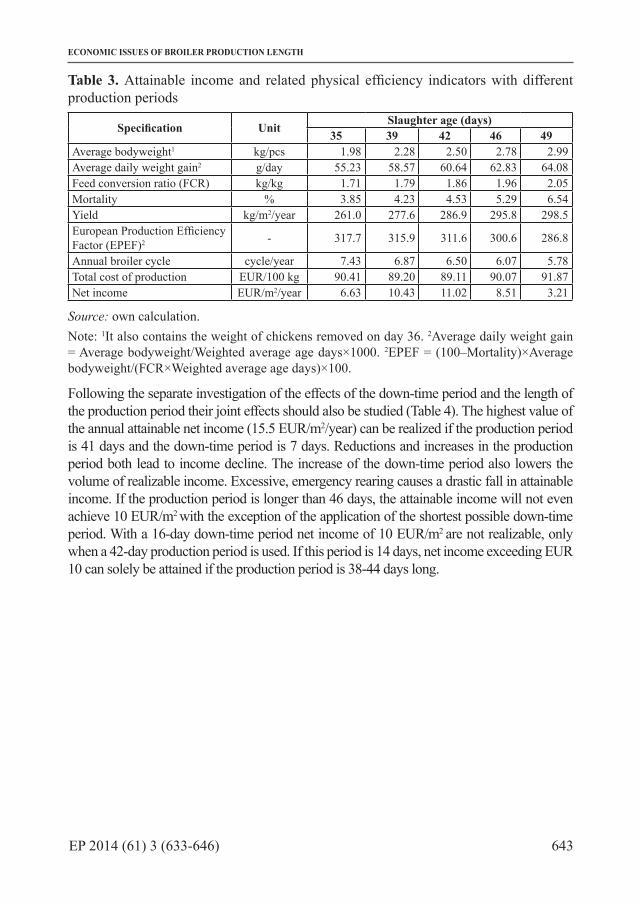
Realizable income and related physical efficiency indicators are presented in further detail in Table 3. Average bodyweight, average daily weight gain and yield increased degressively with age. By contrast, FCR and mortality increased progressively with age. EPEF, which expresses the overall production profile decreased progressively with age. Production cost per a unit of production first decreases and then increases as a function of age. The lowest value (89.08 EUR/100 kg) can be found at day 41. By contrast, the net income per m2 per year offers a better picture about economic performance. Its value increases degressively and starts to fall progressively after day 42. The presented correlations are of general value, but concrete values are solely valid if technological and economic prime data are considered.
643EP 2014 (61) 3 (633-646)
ECONOMIC ISSUES OF BROILER PRODUCTION LENGTH
Table 3. Attainable income and related physical efficiency indicators with different production periods
Specification Unit Slaughter age (days)35 39 42 46 49
Average bodyweight1 kg/pcs 1.98 2.28 2.50 2.78 2.99Average daily weight gain2 g/day 55.23 58.57 60.64 62.83 64.08Feed conversion ratio (FCR) kg/kg 1.71 1.79 1.86 1.96 2.05Mortality % 3.85 4.23 4.53 5.29 6.54Yield kg/m2/year 261.0 277.6 286.9 295.8 298.5European Production Efficiency Factor (EPEF)2 - 317.7 315.9 311.6 300.6 286.8
Annual broiler cycle cycle/year 7.43 6.87 6.50 6.07 5.78Total cost of production EUR/100 kg 90.41 89.20 89.11 90.07 91.87Net income EUR/m2/year 6.63 10.43 11.02 8.51 3.21
Source: own calculation.Note: 1It also contains the weight of chickens removed on day 36. 2Average daily weight gain = Average bodyweight/Weighted average age days×1000. 2EPEF = (100–Mortality)×Average bodyweight/(FCR×Weighted average age days)×100.
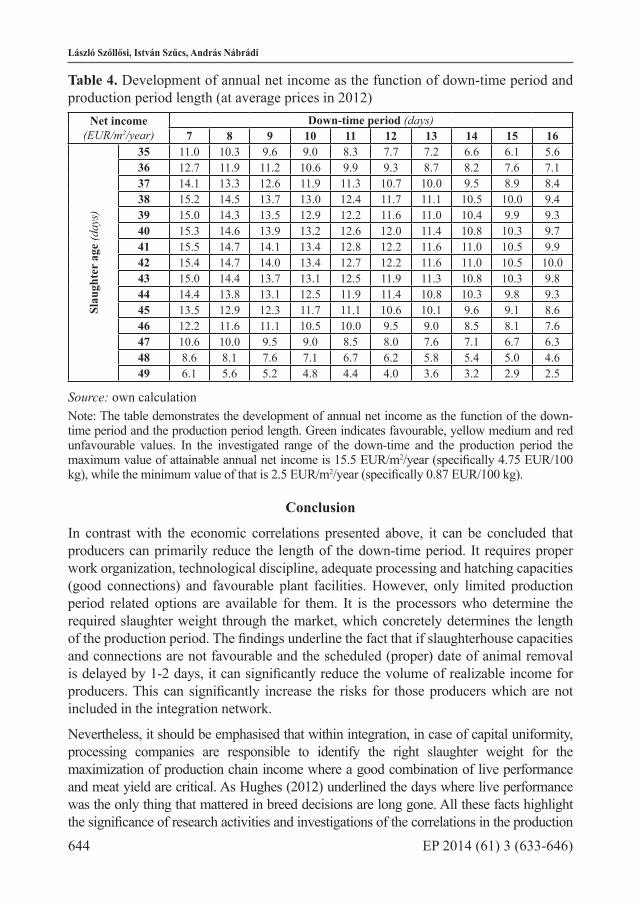
Following the separate investigation of the effects of the down-time period and the length of the production period their joint effects should also be studied (Table 4). The highest value of the annual attainable net income (15.5 EUR/m2/year) can be realized if the production period is 41 days and the down-time period is 7 days. Reductions and increases in the production period both lead to income decline. The increase of the down-time period also lowers the volume of realizable income. Excessive, emergency rearing causes a drastic fall in attainable income. If the production period is longer than 46 days, the attainable income will not even achieve 10 EUR/m2 with the exception of the application of the shortest possible down-time period. With a 16-day down-time period net income of 10 EUR/m2 are not realizable, only when a 42-day production period is used. If this period is 14 days, net income exceeding EUR 10 can solely be attained if the production period is 38-44 days long.
644 EP 2014 (61) 3 (633-646)
László Szőllősi, István Szűcs, András Nábrádi
Table 4. Development of annual net income as the function of down-time period and production period length (at average prices in 2012)
Net income(EUR/m2/year)
Down-time period (days)7 8 9 10 11 12 13 14 15 16
Slau
ghte
r ag
e (d
ays)
35 11.0 10.3 9.6 9.0 8.3 7.7 7.2 6.6 6.1 5.636 12.7 11.9 11.2 10.6 9.9 9.3 8.7 8.2 7.6 7.137 14.1 13.3 12.6 11.9 11.3 10.7 10.0 9.5 8.9 8.438 15.2 14.5 13.7 13.0 12.4 11.7 11.1 10.5 10.0 9.439 15.0 14.3 13.5 12.9 12.2 11.6 11.0 10.4 9.9 9.340 15.3 14.6 13.9 13.2 12.6 12.0 11.4 10.8 10.3 9.741 15.5 14.7 14.1 13.4 12.8 12.2 11.6 11.0 10.5 9.942 15.4 14.7 14.0 13.4 12.7 12.2 11.6 11.0 10.5 10.043 15.0 14.4 13.7 13.1 12.5 11.9 11.3 10.8 10.3 9.844 14.4 13.8 13.1 12.5 11.9 11.4 10.8 10.3 9.8 9.345 13.5 12.9 12.3 11.7 11.1 10.6 10.1 9.6 9.1 8.646 12.2 11.6 11.1 10.5 10.0 9.5 9.0 8.5 8.1 7.647 10.6 10.0 9.5 9.0 8.5 8.0 7.6 7.1 6.7 6.348 8.6 8.1 7.6 7.1 6.7 6.2 5.8 5.4 5.0 4.649 6.1 5.6 5.2 4.8 4.4 4.0 3.6 3.2 2.9 2.5
Source: own calculationNote: The table demonstrates the development of annual net income as the function of the down-time period and the production period length. Green indicates favourable, yellow medium and red unfavourable values. In the investigated range of the down-time and the production period the maximum value of attainable annual net income is 15.5 EUR/m2/year (specifically 4.75 EUR/100 kg), while the minimum value of that is 2.5 EUR/m2/year (specifically 0.87 EUR/100 kg).
Conclusion
In contrast with the economic correlations presented above, it can be concluded that producers can primarily reduce the length of the down-time period. It requires proper work organization, technological discipline, adequate processing and hatching capacities (good connections) and favourable plant facilities. However, only limited production period related options are available for them. It is the processors who determine the required slaughter weight through the market, which concretely determines the length of the production period. The findings underline the fact that if slaughterhouse capacities and connections are not favourable and the scheduled (proper) date of animal removal is delayed by 1-2 days, it can significantly reduce the volume of realizable income for producers. This can significantly increase the risks for those producers which are not included in the integration network.
Nevertheless, it should be emphasised that within integration, in case of capital uniformity, processing companies are responsible to identify the right slaughter weight for the maximization of production chain income where a good combination of live performance and meat yield are critical. As Hughes (2012) underlined the days where live performance was the only thing that mattered in breed decisions are long gone. All these facts highlight the significance of research activities and investigations of the correlations in the production

645EP 2014 (61) 3 (633-646)
ECONOMIC ISSUES OF BROILER PRODUCTION LENGTH
chain, value generation and the continuous monitoring of submarkets (Markovszky, 2004; Molnár, Xavier, 2009; Szőllősi, 2009; Cehla et al., 2011).
In the processing phase of the production chain the key objective is to minimize the specific costs of processing, as this is the way to achieve the highest possible income if prices are given. This is the income which can and should be partly returned to broiler producers. Within integration, potentials are available to realize this. One way for the reduction of specific processing costs is the improvement of yield indicators in relation to processing technology and live weight per hook. This expressly means a shift toward valuable chicken breast in the case of heavier chickens. Naturally, due to the mentioned causes, high average weight is to be achieved under safe conditions, at a low mortality rate with a low FCR, during a short production period. This can merely be guaranteed by in-depth management knowledge, outstanding technological level, with constant, good quality chicks and feed. It means that simultaneous investments should be made into the knowledge base and the development of technological level as well.
Literature1. Aliczki, K., Bárány, L. (2013): Versenyképes-e a magyar húscsirketermelés?
Baromfiágazat, vol. 13(3), pp. 6-8, GBT Press, Budapest.2. Aviagen Ltd. (2012): Ross 308 Broiler: Performance Objectives, 2012, pp.
1-12, Aviagen Group, Huntsville, available at: http://en.aviagen.com/assets/ Tech_Center/Ross_Broiler/Ross308BroilerPerfObj2012R1.pdf.
3. Baéza, E., Arnould, C., Jlali, M., Chartrin, P., Gigaud, V., Mercerand, F., Durand, C., Méteau, K., Le Bihan-Duval, E., Berri, C. (2011): Influence of Increasing Slaughter Age of Chickens on Meat Quality, Welfare, and Technical and Economic Results, Journal of Animal Science, vol. 90, pp. 2003-2013, American Society of Animal Science, Champaign, available at: http://www.journalofanimal science.org/content/90/6/2003.full.pdf+html.
4. Cehla, B., Kovács, S., Nábrádi, A. (2011): Exploitation of relations among the players of the mutton product cycle, Apstract, vol. 4(1-2), pp. 129-134, Agroinform Publishing House, Budapest.
5. Esmail, S. H. (2013): Factors Affecting Feed Intake of Chickens, World Poultry, vol. 29(1), pp. 15-17, Read Business bv, the Netherlands.
6. FAO (1999): Livestock and Environment Toolbox, Food and Agriculture Organisation of the United Nations FAO, Rome, available at: http://www.fao.org/ag/againfo/programmes/en/lead/toolbox/Index.htm.
7. Goliomytis, M., Panopoulou, E., Rogdakiset, E. (2003): Growth Curves for Body Weight and Major Component Parts, Feed Consumption, and Mortality of Male Broiler Chickens Raised to Maturity, Poultry Science, vol. 82, pp. 1061-1068, Poultry Science Association, Champaign, available at: http://ps.oxfordjournals. org/content/82/7/1061.full.pdf.
8. Gunasekar, K. R. (2006): Formulating Feeds for Broiler Performance, The Poultry Site, 24th April 2006, available at: http://www.thepoultrysite.com/articles/ 560/formulating-feed-for-broiler-performance.
646 EP 2014 (61) 3 (633-646)
László Szőllősi, István Szűcs, András Nábrádi
9. Grepay, N. A. (2009): The Main Factors Affecting Poultry Production in Libya, Acta Scientiarum Pololonorum Oeconomia, vol. 8(4), pp. 43-49, Warsaw University of Life Sciences, Warszawa, available at: http://www.aqua.ar.wroc.pl /acta/pl/full/14/2009/000140200900008000040004300049.pdf.
10. Horne, P. L. M. van (2013): Competitiveness of the EU Poultry Meat Sector, LEI Report 2013-068, LEI Wageningen UR, The Hague, pp. 34-43.
11. Hughes, J. (2012): The Economic Importance of Meat Yield in processing, World Poultry, vol. 28(10), pp. 36-37, Read Business bv, the Netherlands.
12. Kleyn, R. (2002): Strategies for Managing Expensive Feed on Farm, SPESFEED Ltd, Rivonia, South Africa, available at: http://spesfeed.com/?wpdmact=process&did=NDQuaG90bGluaw.
13. Markovszky, Gy. (2004): A termékpálya integrációk vizsgálatának lehetőségei, Gazdálkodás, vol. 48(3), pp. 25-31, Nemzeti Agrárszaktanácsadási, Képzési és Vidékfejlesztési Intézet, Budapest.
14. Molnár, A., Xavier, G. (2009): Performance imbalances in the chain: EU traditional food sector, Apstract, vol. 3(3-4), pp. 7-11, Agroinform Publishing House, Budapest.
15. Popp, J. (2014): A baromfiágazat globális helyzete és kilátásai (II), Baromfiágazat, vol. 14(1), pp. 4-11, GBT Press, Budapest.
16. Rezitis, A. N., Stavropoulos, K. S. (2009): Modelling Pork Supply Response and Price Volatility: The Case of Greece, Journal of Agricultural and Applied Economics, vol. 41(1), pp. 145–162, Southern Agricultural Economics Association, available at: http://ageconsearch.umn.edu/bitstream/48764/2/jaae209.pdf.
17. Research Institute of Agricultural Economics (2013): Market Price Information System, Budapest, Hungary, available at: https://pair.aki.gov.hu/web_public/general/home.do.
18. Samarakoon, S. M. R., Samarasinghe, K. (2012): Strategies to Improve the Cost Effectiveness of Broiler Production, Tropical Agricultural Research, vol. 23(4), pp. 338-346, Postgraduate institute of Agriculture University of Peradeniya, Sri Lanka, available at: http://www.sljol.info/index.php/TAR/article/view/4869.
19. Schmidt, G. A. (2008): The Effect of Broiler Market Age on Performance Parameters and Economics, Revista Brasileira de Ciência Avícola, vol. 10(4) pp. 223-225, Fundação APINCO de Ciência e Tecnologia Avícolas, Campinas, available at: http://www.redalyc.org/articulo.oa?id=179713996005.
20. Szőllősi, L. (2009): The Operation of the Hungarian Broiler Product Chain, Apstract, vol. 3(5-6), pp. 47-50, Agroinform Publishing House, Budapest.
21. Wang, B. Y., Chien, L. H., Roan, S. W. (2012): POMA-BROILER: A Computer Simulation Model to Evaluate the Optimal Market Age of Broilers, Journal of Animal and Veterinary Advances, vol. 11(14), pp. 2493-2502, Medwell Journals, available at: http://www.medwelljournals.com/abstract/?doi=javaa.2012.2493.2502.
22. Ziggers, D. (2013): Biomin’s World Nutrition Forum Tackles the Four P’s, World Poultry, vol. 29(1), p. 13, Read Business bv, the Netherlands.
23. Zoltán, P. (2010): Jó indítás, eredményes hizlalás, Baromfiágazat, vol. 10(4), pp. 36-42, GBT Press, Budapest.
Economics of Agriculture, Year 61, No. 3 (553-828) 2014, Belgrade
UDC 338.43:63 ISSN 0352-3462
ECONOMICS OF AGRICULTURE
CONTENT
1. Čolović Vladimir, Mrvić Petrović Nataša CROP INSURANCE – RISKS AND MODELS OF INSURANCE . . . . 561
2. Munćan Petar, Todorović Saša, Munćan Mihajlo PROFITABILITY OF FAMILY FARMS DIRECTED AT CROP PRODUCTION . . . . . . . . . . . . . . . . . . . . . . . . . . . . . . . . . . . . . 575
3. Njegomir Vladimir, Tepavac Rajko, Obradović Miloje AGRICULTURAL INSURANCE UNDER THE SOLVENCY II DIRECTIVE . . . . . . . . . . . . . . . . . . . . . . . . . . . . . . . . . . . 587
4. Pavlović Sanja, Čavlin Gordana COMPETITIVENESS OF DESTINATIONS WITHIN THE RURAL TOURISM CLUSTER: ZLATAR, ZLATIBOR . . . . . . . . . 603
5. Stratan Alexandru MOLDOVAN AGRI-FOOD SECTOR DILEMMA: EAST OR WEST? . . . . . 615
6. Szőllősi László, Szűcs István, Nábrádi András ECONOMIC ISSUES OF BROILER PRODUCTION LENGTH . . . . . . . . . 633
7. Bešić Cariša, Ćoćkalo Dragan, Đorđević Dejan, Bogetić Srđan THE ANALYSIS OF ASPECTS OF FOOD INDUSTRY COMPETITIVENESS IN SERBIA . . . . . . . . . . . . . . . . . . . . . . 647
8. Doitchinova Julia, Stoyanova Zornitsa ACTIVATION OF LOCAL COMMUNITIES FOR DEVELOPMENT OF RURAL AREAS . . . . . . . . . . . . . . . . . . . . 661
9. Ignjatijević Svetlana, Čavlin Miroslav, Đorđević Dragomir MEASUREMENT OF COMPARATIVE ADVANTAGES OF PROCESSED FOOD SECTOR OF SERBIA IN THE INCREASING THE EXPORT . . . . . . . . . . . . . . . . . . . . . . . . 677
10. Nikolić Vladimir, Ivaniš Marko, Stevović Ivan INNOVATION OF ORGANIZATION MODEL FOR INTEGRAL RURAL DEVELOPMENT - SERBIA CASE STUDY . . . . . . . . . . . . 695

Economics of Agriculture, Year 61, No. 3 (553-828) 2014, Belgrade
11. Pavlović Vladan, Cvijanović Janko, Milačić Srećko REPORTING ON THE REASONS FOR THE ACQUISITION OF OWN SHARES . . . . . . . . . . . . . . . . . . . . . . . . . . . . . . . . . . 707
12. Petrović Zdravko, Manojlović Dragan, Jović Vojislav LEGAL PROTECTION OF LAND FROM POLLUTION . . . . . . . . . . 723
13. Popović Vesna, Kljajić Nataša, Subić Jonel NEGOTIN LOWLAND IRRIGATION SYSTEM UPGRADING . . . . . . . 739
14. Puzić Goran, Klevernić Aleksandar, Pavlović Zoran THE COMMON AGRICULTURAL POLICY THROUGH REFORMS TOWARD EUROPE 2020 . . . . . . . . . . . . . . . . . . . . . . . . . . . . . . 759
15. Veselinović Branislav, Drobnjaković Maja QUALITATIVE AND QUANTITATIVE ANALYSIS OF MICRO AND MACRO ASPECTS OF AGRICULTURAL FINANCE . . . . . . . . . 771
16. Vujko Aleksandra, Gajić Tamara THE GOVERNMENT POLICY IMPACT ON ECONOMIC DEVELOPMENT OF TOURISM . . . . . . . . . . . . . . . . . . . . . . . . 789
17. Vukelić Nataša, Rodić Vesna FARMERS’ MANAGEMENT CAPACITIES AS A SUCCESS FACTOR IN AGRICULTURE: A REVIEW . . . . . . . . . . . . . . . . . . 805