broiler fin503
TRANSCRIPT
8/8/2019 Broiler Fin503
http://slidepdf.com/reader/full/broiler-fin503 1/8
International Journal of Poultry Science 4 (12): 947-954, 2005
ISSN 1682-8356
© Asian Network for Scientific Information, 2005
Corresponding Author: Y.J. Johnson, University of Illinois at Urbana-Champaign, College of Veterinary Medicine,
Department of Veterinary Clinical Medicine, 1008 West Hazelwood Drive, Urbana, IL 61802,
USA
947
Airflow Pattern in Broiler Houses as a Risk Factor
for Growth of Enteric Pathogens
M.S. Myint , Y.J. Johnson *, S.L. Branton and E.T. Mallinson1 1 2 1
Virginia-Maryland Regional College of Veterinary Medicine,1
8075 Greenmead Drive, College Park, MD 20742, USA
USDA, ARS, Mississippi State, 606 Spring Street, MS 39762, USA2
Abstract: Increased moisture in litter may create favorable conditions for multiplication of enteric pathogens.
Areas of reduced air-flow within a broiler house are at increased risk of having excess litter moisture. A
cross-sectional study was conducted to assess the association between airflow patterns within a poultry
house and litter Salmonella and fecal coliform distribution. Five commercial broiler houses in two
geographical regions of the USA were sampled. Both conventional and tunnel ventilated houses were
represented in the sample. Airflow was not uniform throughout the houses sampled. Airflow at three feet
(91.2cm) above the litter surface was greater than the airflow at three inches (7.6cm) above the litter surface.
Across a 30 site sampling grid each house had at least 1 region where the airflow velocity was significantlyreduced when compared to other regions within the house at the same height. The Friedman two-way
analysis of variance found an association between regions of reduced airflow within a poultry house and
regions of increased coliform and Salmonella contamination. Across all houses , there was a significant
association between low air flow regions within the poultry house and fecal coliform counts in excess of the
sample median (3.635 cfu /10 g of litter) (p=0.0073). Those litter samples with median fecal coliform counts
in excess of 3.635 cfu/ 10 g of litter were 16 times more likely to come from a low air-flow region within the
poultry house (95% CI 8.001, 31.994).
Key words: Airflow, broiler house, risk factor, enteric pathogens
IntroductionSalmonellosis is the most frequently reported foodborne
illness in the United States, and is the second mostcommon foodborne illness worldwide (Aabo et al .,
1995). Controlling Salmonella and other enteric
pathogens has thus become an important objective for
the poultry industry from both public health and
economic perspectives. Previous Salmonella research
has indicated that control at the farm in broiler litter and
layer manure could lower contamination in poultry
products (Campbell et al ., 1982; Henzler et al ., 1998;
Mallinson et al ., 1995). There are several indicator
variables for environmental moisture. Studies on the
association between environmental moisture and litter
bacterial load have defined moisture as: diffuse wetness
that can be felt as vapor in the atmosphere; condensed
liquid on the surfaces of objects; and water activity (Aw)or equilibrium relative humidity (%ERH) which is the
vapor pressure generated by the moisture present in a
hygroscopic product and reflects the active part of
moisture content or the part which, under normal
circumstances, can be exchanged between the product
and its environment (Campbell et al ., 1982; Henzler et
al ., 1998; Mallinson et al ., 1995). High water parameters
such as these in litter facilitate the multiplication of
enteric pathogens such as Salmonella and E. coli.
Studies have shown that Aw greater than 0.90 at the
broiler litter surface were associated with increased
Salmonella prevalence in poultry houses and on
carcasses of birds processed from these houses (Edel
1994; Mallinson et al ., 1995). These studies conclude
that lower Aw levels at the litter surface are associated
with lower Salmonella loads on carcasses. Therefore,
the transmission of Salmonella from the farm to the
processing plant and potentially to marketed carcasses
may be diminished and controlled by implementing
management strategies that reduce bacterial loads in
the production environment.
Reduction of moisture within a poultry house can be
achieved through adequate ventilation. One of the goals
of tunnel ventilation systems is to reduce moisture in thepoultry house environment (Choiniere et al., 1988;
Wierup, 1997). However, an association between rate
and pattern of airflow within the poultry house and
distribution of litter bacterial load has not been
established. Increased airflow, especially in those
regions of the house where the airflow may be relatively
stagnant even with tunnel ventilation, can lower Aw
8/8/2019 Broiler Fin503
http://slidepdf.com/reader/full/broiler-fin503 2/8
Myint et al .: Airflow Pattern in Broiler Houses as a Risk Factor for Growth of Enteric Pathogens
948
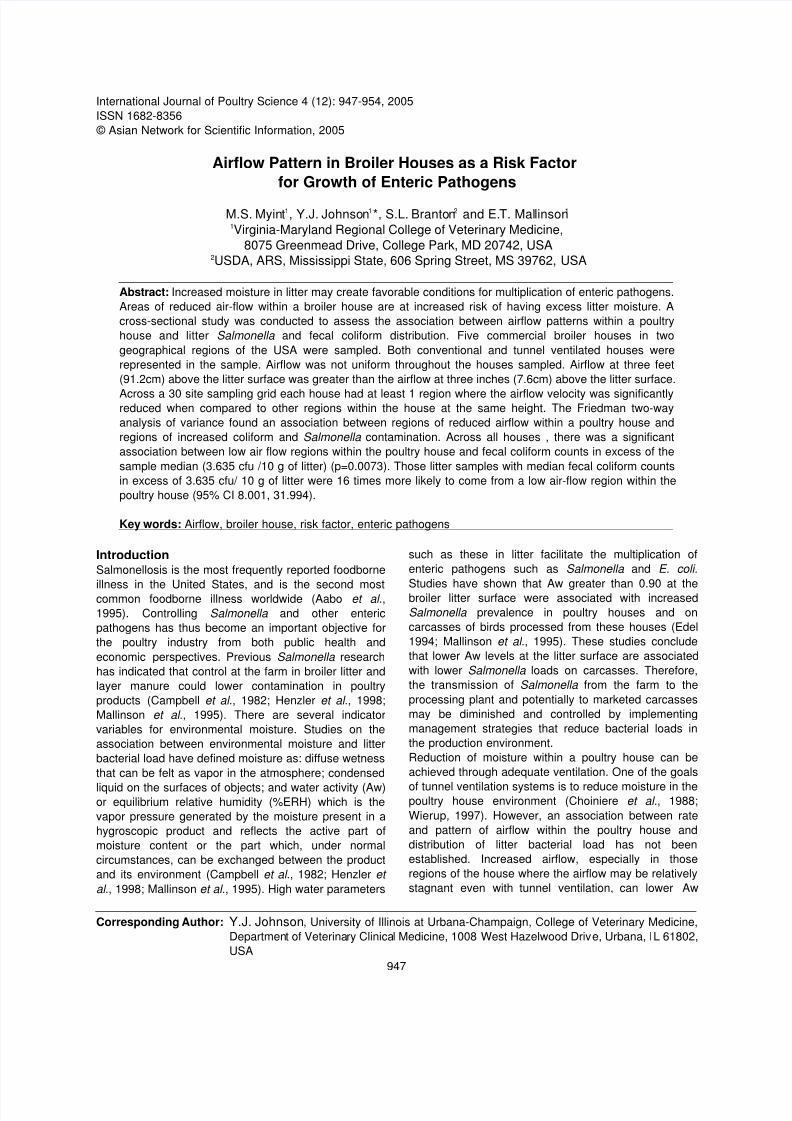
Fig. 1: Average airflow at 3 inches and 3 feet above represented the maximum airflow at a particular location
litter surface for 5 commercial broiler houses in during a 30-s interval. From the collected airflow data, 2
the Mid-Atlantic and Southern region of the maximum, 2 median, and 2 minimum airflow locations
United States. were marked for litter sample collection.Houses 1, 2 and 3 are from the Mid-Atlantic US
Houses 4 and 5 are from the Southern USHouses 1, 4 and 5 had tunnel ventilation
Houses 2 and 3 had conventional ventilation
levels at the litter surface throughout the house. This
may also indirectly reduce bacterial loads in litter and
consequently reduce bacterial loads in the birds at
processing. Identification of regions within the poultry
house with reduced air-flow and increased Salmonella
and fecal coliform (FC)multiplication can lead to the
development of interventions, such as supplemental
ventilation, to control bacterial growth in those “hot
spots”. Many studies have been shown that
environments with low levels of bacterial contamination
are associated both with a reduction in prime broilerproduction costs and Salmonella- negative carcasses at
processing (Campbell et al., 1982; Kingston, 1981;
Mallinson et al., 1995, Pomeroy et al., 1989). This will
enhance poultry health, productivity and product food
safety.
The objectives of this study are:
1. To study airflow patterns inside broiler houses with
different ventilation systems
2. To evaluate the relationship between airflow and the
distribution of Salmonella and fecal coliforms in
broiler house litter.
Materials and MethodsStudy design: A cross-sectional study approach was
used to assess the association between airflow within
a poultry house and litter Salmonella and FC loads. Five
commercial broiler houses at three different commercial
poultry operations located on university farms in the Mid-
Atlantic and Southern regions of the United States were
visited once during the final week of a six-week grow-out
period between April and June, 2004. Each house was
sampled by six-drag swabs (DS) collected from the left,
center and right sections of the poultry house. After
dragging, the swabs were returned to the transport
containers, labeled and placed in an insulated foam box.
Airflow within the poultry house was monitored using a
sampling grid technique in which 30 evenly spaced
intervals of the house were marked. Airflow was then
measured at a height of 3 inches (7.6cm) above the litter
surface and 3 feet (91.4cm) above the litter surface.
Airflow patterns over each sampling site were measured
using a digital Hygro-thermometer, anemometer, data-
logging instrument (Pacer Industries, Inc., Chippewa
Falls, WI) and digital thermo wind meter (Spectrum
technologies, Inc., Plainfield, IL) according to the
manufacturer’s instructions. Each air velocity reading
A 25-gram litter sample was collected at each of the 6
designated locations. Litter samples were transferredonsite into 50 ml centrifuge tubes containing 25 ml of
2% buffered peptone water (BPW). Tubes were labeled
and sealed. Samples were placed in a styrofoam
shipping box containing dry ice and sent to the laboratory
via overnight courier. Drag swab and litter samples were
processed within 24 hrs of collection. All litter samples
were processed according to Mallinson et al. (1989).
The frozen litter samples were thawed quickly in a hot
water bath (41EC). The litter was weighed and
transferred to 225 ml BPW, thoroughly shaken for 10
minutes, then filtered using a stomacher bag (Fisher
brand filtra bag). A 45 ml aliquot of the f iltrate was placed
into a 50ml plastic tube and frozen at -70EC. The
remaining filtrate was placed in a 400ml plastic bottle
and placed in a 37EC incubator overnight.
Salmonella quantification: Litter samples were pre-
screened for Salmonella quantification as previously
described. Salmonella screening was performed by
qualitatively testing for this organism using filtrate. After
primary and selective enrichment in BPW and Rappaport
Vassiliatis (RV) broth, respectively, all samples were
placed on Miller-Mallinson (MM) agar and incubated at
37 C. Plates were read after 24 and 48 hrs of incubation.o
Suspect Salmonella colonies were confirmed by
biochemical tests with Triple Sugar Iron (TSI) and Lysine
Iron (LIA) agar. Positive litter samples were quantifiedwith a three tube serial dilution technique using the most
probable number (MPN) calculation by the FDA-
Bacterial Analytical Manual (BAM) method (Andrews and
Hammack, 2001).
Fecal coliform quantification: FC quantification was
performed by thawing 45-ml aliquot suspension of litter,
which was serially diluted to 200µl, 20µl, 2 µl and 0.2 µl
and filtered through a microbial monitor (Schleicher and
Schuell MicroScience, Inc. USA Riviera Beach, FL) for
8/8/2019 Broiler Fin503
http://slidepdf.com/reader/full/broiler-fin503 3/8
Myint et al .: Airflow Pattern in Broiler Houses as a Risk Factor for Growth of Enteric Pathogens
949
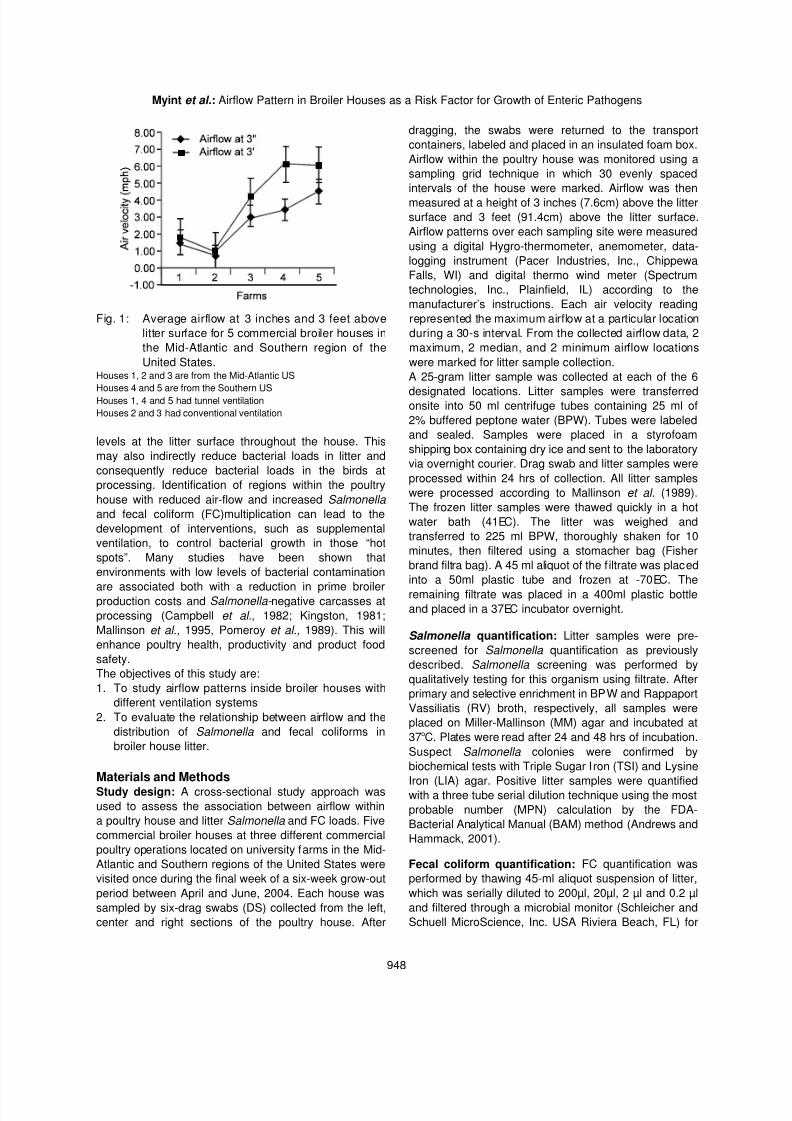
Fig. 2: Airflow pattern in commercial broiler House 1 with tunnel ventilation with fans running, located in the Mid-
Atlantic region of the USA.
Fig. 3: Airflow pattern in commercial broiler House 2 with conventional
ventilation and no running fans at the time of sample collection,
located in the Mid-Atlantic USA.

8/8/2019 Broiler Fin503
http://slidepdf.com/reader/full/broiler-fin503 4/8
Myint et al .: Airflow Pattern in Broiler Houses as a Risk Factor for Growth of Enteric Pathogens
950
Fig. 4: Airflow pattern in commercial broiler House 3 with conventional ventilation
and fans located lengthwise down the center of the house and in use at
the time of sample collection located in the Mid-Atlantic USA.
each dilution. 2ml m-FC medium with rosolic acid, and also statistically significant (p-value <0.0001) (Fig.
(Millipore Corp., Bedford, MA) was added to each 1). Across a 30 site sampling grid each house had at
monitor and incubated at 41 C for 24 hrs. Typical blue least 1 region where the airflow velocity was significantlyo
FC colonies were counted for quantification from each reduced when compared to other regions within the
dilution and colony forming units (cfu) per 10 grams of house at the same height. See figures 2-6 for the airflow
litter sample was calculated based on number of patterns in each house sampled.
colonies, dilution ratio, and l itter sample weight. Table 1 details the descriptive analysis of Salmonella
Statistical analysis: Statistix-8 statistical software each house. Salmonella and FC counts were not
(Tallahassee, FL) was used to analyze the data. Raw normally distributed. These data were transformed
and transformed data were tested for normality using the using the natural log transformation. The natural log of
Shapiro-Wilkes test (Daniel, 1995). The Spearman Rank the bacterial counts was used in the analysis. Overall
Correlation coefficient was used to compare the the prevalence of Salmonella positive houses as
correlation of airflow at 3 inches above litter and FC determined by the DS method was 80% (4 of the 5
counts with airflow at 3 feet above litter and FC counts houses sampled) with 50% (15/30) swabs testing
(Daniel, 1995). The Friedman two-way analysis of positive. By individual litter sample, the prevalence of
variance by rank and simple regression analysis were Salmonella positive houses was 60% (3 of the 5 houses
used to model the relationship between airflow levels sampled) with 33.3% (10/30) litter samples testing
and the FC count in the broiler litter samples (Daniel, positive.
1995). Simple regression analysis was also used to The results of the Spearman Rank Correlation
model the relationship between FC count and coefficient analysis of airflow velocity and FC counts
Salmonella MPN. Fisher’s exact test was used to were inconsistent across the houses. For houses 1 andcompare binary outcomes and to estimate odds ratios 5 airflow velocity at a height of 3 feet (-0.8 and -0.6
(Daniel, 1995). respectively) was better correlated with FC count than
ResultsThe results of descriptive analysis of airflow patterns in
each house are detailed in Fig. 1. Briefly, airflow was not
uniform throughout the houses sampled irrespective of
ventilation system. Airflow at three feet (91.2cm) above
the litter surface was greater than the airflow at three
inches (7.6cm) above the litter surface in each house
MPN, and fecal coliform counts for litter samples from
velocity at 3 inches (-0.4 and -0.3) above the litter
surface. For house 2 the correlation was greater at 3
inches (-0.8) than at 3 feet (-0.6) and in houses 3 and 4
there was no difference in the magnitude of the
correlation coefficients at the 2 heights.
Across all 5 houses, the Friedman’s two-way analysis of
variance by rank found an association between low
airflow and elevated FC rank when compared to
8/8/2019 Broiler Fin503
http://slidepdf.com/reader/full/broiler-fin503 5/8
Myint et al .: Airflow Pattern in Broiler Houses as a Risk Factor for Growth of Enteric Pathogens
951
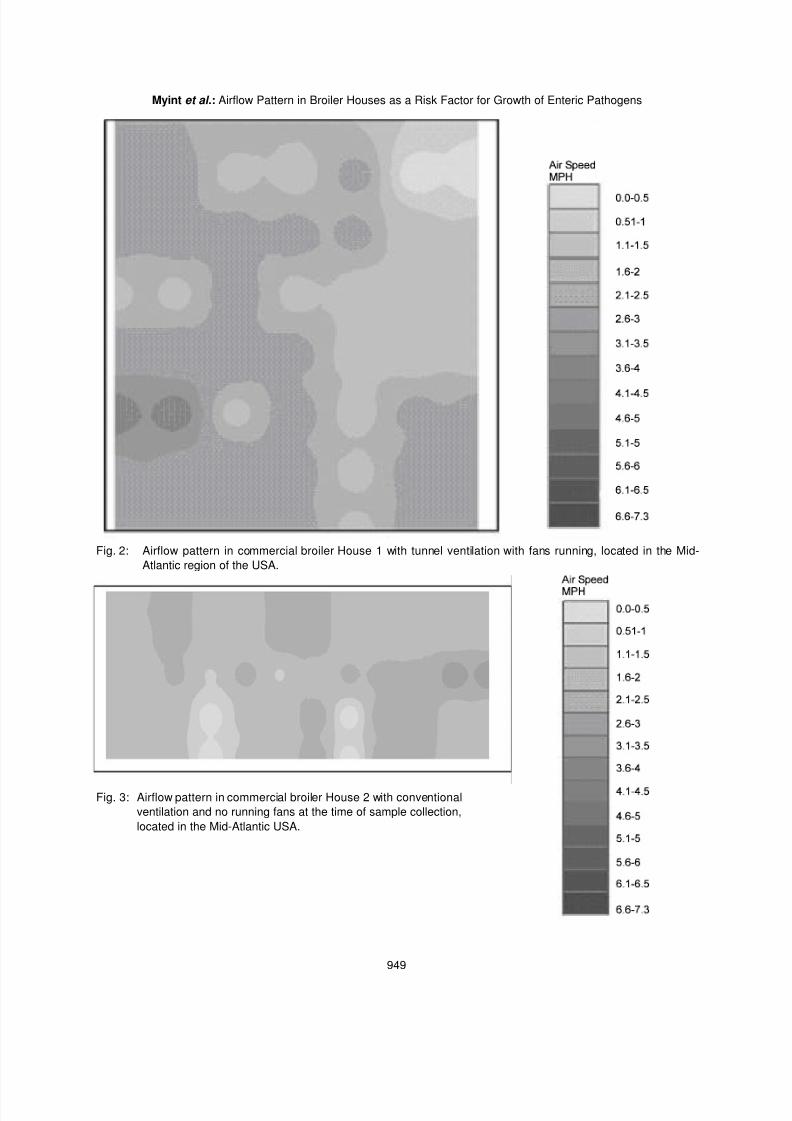
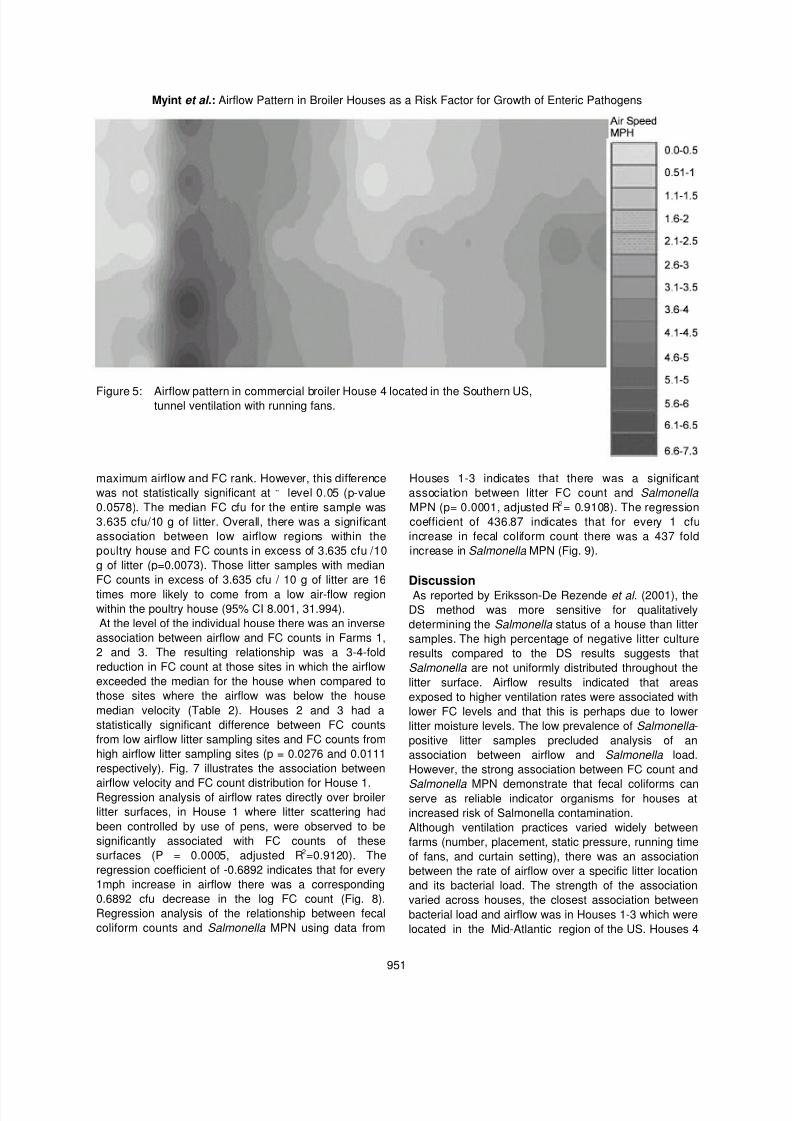
Figure 5: Airflow pattern in commercial broiler House 4 located in the Southern US,tunnel ventilation with running fans.
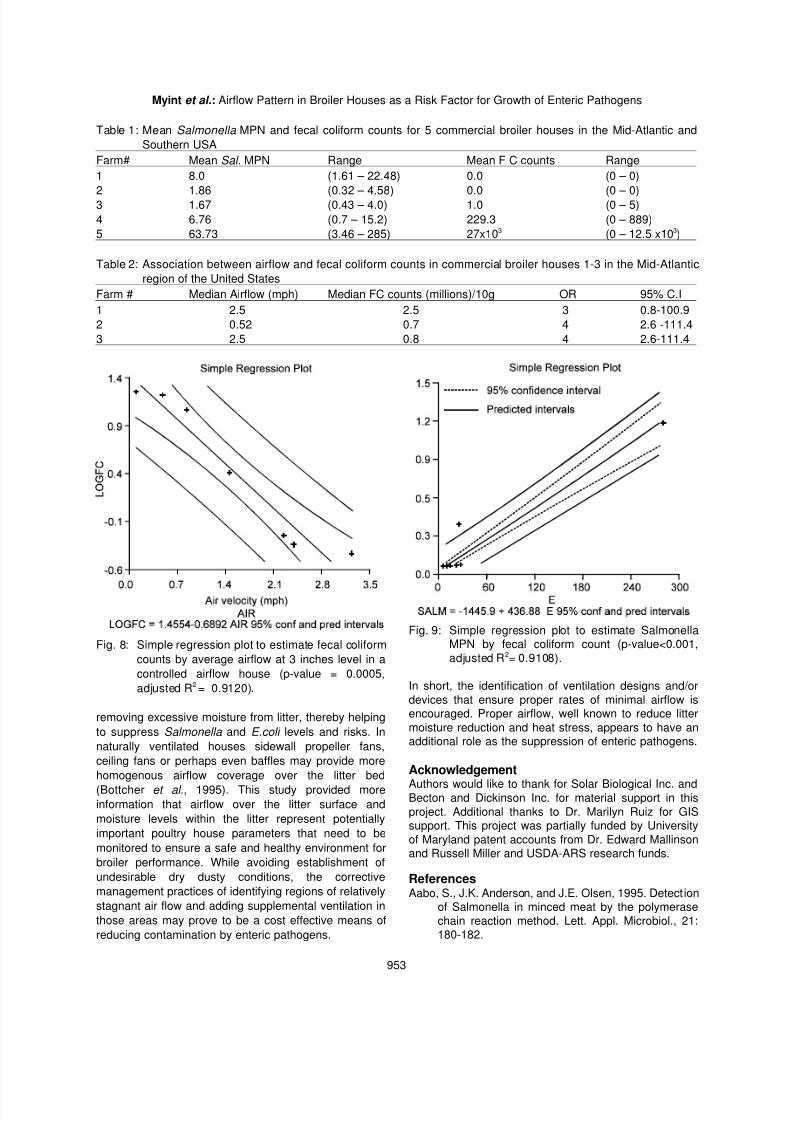
maximum airflow and FC rank. However, this difference Houses 1-3 indicates that there was a significant
was not statistically significant at " level 0.05 (p-value association between litter FC count and Salmonella
0.0578). The median FC cfu for the entire sample was MPN (p= 0.0001, adjusted R = 0.9108). The regression
3.635 cfu/10 g of litter. Overall, there was a significant coefficient of 436.87 indicates that for every 1 cfu
association between low airflow regions within the increase in fecal coliform count there was a 437 fold
poultry house and FC counts in excess of 3.635 cfu /10 increase in Salmonella MPN (Fig. 9).
g of litter (p=0.0073). Those litter samples with median
FC counts in excess of 3.635 cfu / 10 g of litter are 16
times more likely to come from a low air-flow region
within the poultry house (95% CI 8.001, 31.994).
At the level of the individual house there was an inverse
association between airflow and FC counts in Farms 1,
2 and 3. The resulting relationship was a 3-4-fold
reduction in FC count at those sites in which the airflow
exceeded the median for the house when compared to
those sites where the airflow was below the house
median velocity (Table 2). Houses 2 and 3 had a
statistically significant difference between FC counts
from low airflow litter sampling sites and FC counts from
high airflow litter sampling sites (p = 0.0276 and 0.0111
respectively). Fig. 7 illustrates the association between
airflow velocity and FC count distribution for House 1.Regression analysis of airflow rates directly over broiler
litter surfaces, in House 1 where litter scattering had
been controlled by use of pens, were observed to be
significantly associated with FC counts of these
surfaces (P = 0.0005, adjusted R =0.9120). The2
regression coefficient of -0.6892 indicates that for every
1mph increase in airflow there was a corresponding
0.6892 cfu decrease in the log FC count (Fig. 8).
Regression analysis of the relationship between fecal
coliform counts and Salmonella MPN using data from
2
DiscussionAs reported by Eriksson-De Rezende et al . (2001), the
DS method was more sensitive for qualitatively
determining the Salmonella status of a house than litter
samples. The high percentage of negative litter culture
results compared to the DS results suggests that
Salmonella are not uniformly distributed throughout the
litter surface. Airflow results indicated that areas
exposed to higher ventilation rates were associated with
lower FC levels and that this is perhaps due to lower
litter moisture levels. The low prevalence of Salmonella -
positive litter samples precluded analysis of an
association between airflow and Salmonella load.
However, the strong association between FC count and
Salmonella MPN demonstrate that fecal coliforms canserve as reliable indicator organisms for houses at
increased risk of Salmonella contamination.
Although ventilation practices varied widely between
farms (number, placement, static pressure, running time
of fans, and curtain setting), there was an association
between the rate of airflow over a specific litter location
and its bacterial load. The strength of the association
varied across houses, the closest association between
bacterial load and airflow was in Houses 1-3 which were
located in the Mid-Atlantic region of the US. Houses 4

8/8/2019 Broiler Fin503
http://slidepdf.com/reader/full/broiler-fin503 6/8
Myint et al .: Airflow Pattern in Broiler Houses as a Risk Factor for Growth of Enteric Pathogens
952
Fig. 6: Airflow pattern in commercial broiler House 5 located in the Southern US, tunnel ventilation with running fans
Fig. 7: Fecal Coliform counts and airflow pattern in House 1, a tunnel ventilated house.
and 5 were located in the Southern US where ambient propeller fans, tunnel ventilated houses had a greater
temperature and relative humidity were much higher at and unvarying flow of air (3.3 to 4.8 mph) over the entire
the time the samples were collected compared to those litter surface. It was also noted that, velocity at 3 inches
in the Mid-Atlantic. To further analyze the impact of above litter surface was lower than at 3 feet above the
geographic location, weather conditions, and seasonal surface. Lacy et al. (1992) reported that tunnel ventilation
patterns, prospective studies need to be conducted with had advantages of reduction of heat stress related
a larger sample size. mortality and improved feed conversion and these
In contrast to houses that were ventilated by wind and advantage could also be serve as an effective means of
8/8/2019 Broiler Fin503
http://slidepdf.com/reader/full/broiler-fin503 7/8
Myint et al .: Airflow Pattern in Broiler Houses as a Risk Factor for Growth of Enteric Pathogens
953
Table 1: Mean Salmonella MPN and fecal coliform counts for 5 commercial broiler houses in the Mid-Atlantic and
Southern USA
Farm# Mean Sal. MPN Range Mean F C counts Range
1 8.0 (1.61 – 22.48) 0.0 (0 – 0)
2 1.86 (0.32 – 4.58) 0.0 (0 – 0)3 1.67 (0.43 – 4.0) 1.0 (0 – 5)
4 6.76 (0.7 – 15.2) 229.3 (0 – 889)
5 63.73 (3.46 – 285) 27x10 (0 – 12.5 x10 )3 3
Table 2: Association between airflow and fecal coliform counts in commercial broiler houses 1-3 in the Mid-Atlantic
region of the United States
Farm # Median Airflow (mph) Median FC counts (millions)/10g OR 95% C.I
1 2.5 2.5 3 0.8-100.9
2 0.52 0.7 4 2.6 -111.4
3 2.5 0.8 4 2.6-111.4
Fig. 8: Simple regression plot to estimate fecal coliform
counts by average airflow at 3 inches level in a
controlled airflow house (p-value = 0.0005,
adjusted R = 0.9120).2
removing excessive moisture from litter, thereby helping
to suppress Salmonella and E.coli levels and risks. In
naturally ventilated houses sidewall propeller fans,
ceiling fans or perhaps even baffles may provide more
homogenous airflow coverage over the litter bed
(Bottcher et al ., 1995). This study provided moreinformation that airflow over the litter surface and
moisture levels within the litter represent potentially
important poultry house parameters that need to be
monitored to ensure a safe and healthy environment for
broiler performance. While avoiding establishment of
undesirable dry dusty conditions, the corrective
management practices of identifying regions of relatively
stagnant air flow and adding supplemental ventilation in
those areas may prove to be a cost effective means of
reducing contamination by enteric pathogens.
Fig. 9: Simple regression plot to estimate SalmonellaMPN by fecal coliform count (p-value<0.001,
adjusted R = 0.9108).2
In short, the identification of ventilation designs and/or
devices that ensure proper rates of minimal airflow isencouraged. Proper airflow, well known to reduce litter
moisture reduction and heat stress, appears to have anadditional role as the suppression of enteric pathogens.
Acknowledgement
Authors would like to thank for Solar Biological Inc. andBecton and Dickinson Inc. for material support in this
project. Additional thanks to Dr. Marilyn Ruiz for GISsupport. This project was partially funded by University
of Maryland patent accounts from Dr. Edward Mallinsonand Russell Miller and USDA-ARS research funds.
ReferencesAabo, S., J.K. Anderson, and J.E. Olsen, 1995. Detection
of Salmonella in minced meat by the polymerase
chain reaction method. Lett. Appl. Microbiol., 21:180-182.

8/8/2019 Broiler Fin503
http://slidepdf.com/reader/full/broiler-fin503 8/8
Myint et al .: Airflow Pattern in Broiler Houses as a Risk Factor for Growth of Enteric Pathogens
954
Andrews, W.H. and T.S. Hammack, 2001. United States Kingston, D.J., 1981. A comparison of culturing drag
Food and Drug Administration, Center for Food
Safety & Applied Nutrition, Bacteriological Analytical
Manual Online. Chapter-5; Appendix-D Salmonella,
Most Probable Number.http://www.cfsan.fda.
gov/~ebam/bam-toc.html.
Bottcher, R.W., J.R. Magura, J.S. Young and G.R.
Boughman, 1995. Effects of tilt angles on airflow
for poultry house mixing fans. Appl. Eng. Agri.,
14:87-96.
Campbell, D.F., S.S. Green, C.S. Custer and R.W.
Johnson, 1982. Incidence of Salmonella in fresh-
dressed turkeys raised under Salmonella-
controlled and uncontrolled environments. Poult
Sci., 61: 1962-1967.
Choiniere, Y., F. Blais, J.A. Munroe, 1988. A wind tunnel
study of airflow patterns in a naturally ventilated
building. Can. Agri. Eng., 30: 293-297.
Daniel, W.D., 1995. Biostatistics: A foundation foranalysis in the health science, Sixth edition. John
Wiley & Sons, Inc. publishing.
Edel, W., 1994. Salmonella enteritidis eradication
program in poultry breeder flocks in the
Netherlands. Int. J. Food Microbiol., 21: 171-178.
Eriksson-De Rezende, C.L., E.T. Mallinson, N.L.
Tablante, R. Morales, A. Park, L.E. Carr and S.W.
Joseph, 2001. Effect of dry litter and airflow in
reducing Salmonella and Escherichia coli
populations in the broiler production environment.
J. Appl. Poult. Res., 10: 245-251.
Henzler, D.J., D.C. Kradel and W.M. Sischo, 1998.
Management and environmental risk factors for
Salmonella enteritidis contamination of eggs. Am.
J. Vet. Res., 59: 824-829.
swabs and litter for identification of infections with
Salmonella pp. in commercial chicken flocks.
Avian Dis., 25: 513-516.
Lacy, M.P. and M. Czarick, 1992. Tunnel-ventilated broilerhouses. Broiler performance and operating cost. J.
Appl. Poult. Res., 1: 104-109.
Mallinson, E.T. and G.H. Snoeyenbos, 1989.
Salmonellosis. In H.G. Purchase, J.H.Arp, C.H.
Domermuth, and J.E. Pearson (eds). A Laboratory
Manual for the Isolation and Identification of Avian
pathogens. 3rd ed. Kendall/Hunt Publishing,
Dubuque, IA, pp: 3-11.
Mallinson, E.T., L.E. Carr, G.W. Malone, C.A. Wabeck,
D.H. Palmer, E.B, Pusey, E. Russek-Cohen and
S.W. Joseph, 1995. Lower water activity in broiler
litter and the reduction of Salmonella on farms and
processed carcasses. Bull. 348. MarylandCooperative Extension Service, College Park, MD,
pp: 1-12.
Pomeroy, B.S., K.V. Nagaraja, L.T. Ausherman, I.L.
Peterson and K.A. Friendshuh, 1989. Studies on
feasibility of producing Salmonella-free turkeys.
Avian Dis., 33:1-7.
Wierup, M., 1997. Principles for integrated surveillance
and control of Salmonella in swine production.
Proceedings, Second International Symposium on
Epidemiology and Control of Salmonella in Pork.
Copenhagen, Denmark, August, 20-22, pp: 42-49.