economic perspective on deep and under cover exploration - trench et al - mar 2015 - centre for...
TRANSCRIPT

AN ECONOMIC PERSPECTIVE ON DEEP
AND UNDER COVER EXPLORATION:
What are we looking for and how do we
get there?
Allan Trench12, John P. Sykes12 & Matthew Kanakis23
1. Department of Mineral & Energy Economics, Curtin University
2. Centre for Exploration Targeting, Curtin University & University of Western Australia
3. Consultant, KMPG, Perth WA 6000
ASEG-PESA 2015 Workshop
Geophysical signature of mineral systems; more than bumps
Perth, Australia: 19th Feb 2015
GEOPHYSICS
ASEG-PESA 2015 Workshop: Geophysical signatures of mineral systems; more than bumps
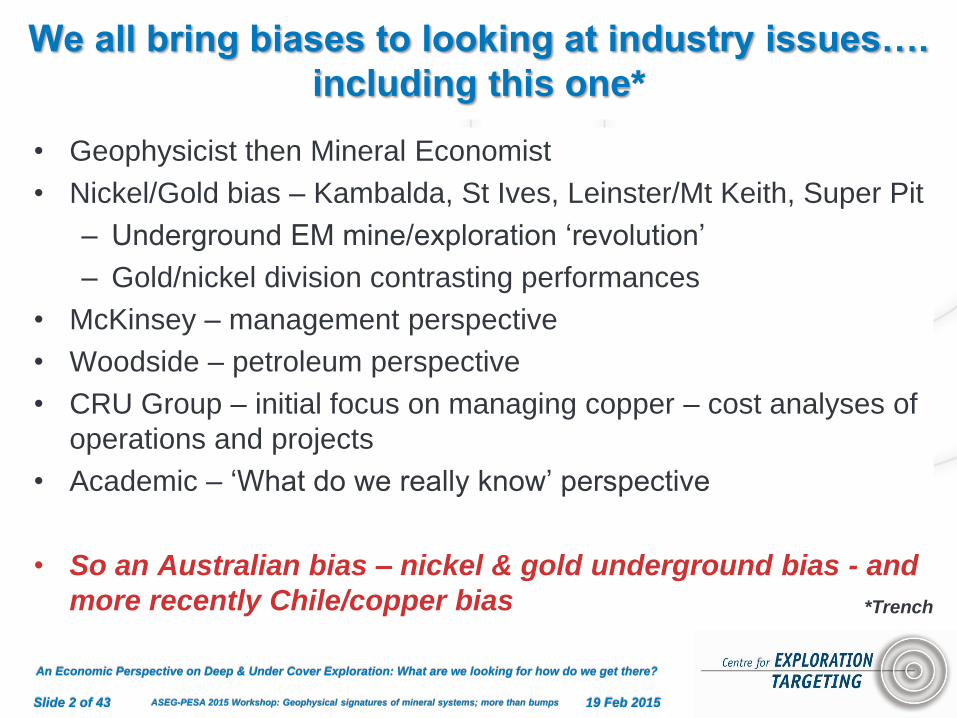
We all bring biases to looking at industry issues….
including this one*
• Geophysicist then Mineral Economist
• Nickel/Gold bias – Kambalda, St Ives, Leinster/Mt Keith, Super Pit
– Underground EM mine/exploration ‘revolution’
– Gold/nickel division contrasting performances
• McKinsey – management perspective
• Woodside – petroleum perspective
• CRU Group – initial focus on managing copper – cost analyses of
operations and projects
• Academic – ‘What do we really know’ perspective
• So an Australian bias – nickel & gold underground bias - and
more recently Chile/copper bias
19 Feb 2015
An Economic Perspective on Deep & Under Cover Exploration: What are we looking for how do we get there?
*Trench
Slide 2 of 43

ASEG-PESA 2015 Workshop: Geophysical signatures of mineral systems; more than bumps
Personal perspectives (bias) on the deep exploration
and development challenge….
• It is possible to make any project look simple on a spreadsheet
• Reality is far more complex
• Most spreadsheet cost models have an underlying and linear ‘sanctity of
grade’ built in
• Ore geometry and scale effects are as important – especially between
mines
• Cost modelling gets underground ‘wrong’ more often than for pits
• Economics suffers some similar ambiguity challenges to geophysics – i.e.
multiple solutions are possible using different costs and shapes
• Mine economics can suffer the same ‘black box’ challenges as for
geophysics – e.g. understanding what is really being measured in a model,
and the multiple definitional issues of reported costs
• Bias towards real data and factual analogues over model-only
solutions: Model simplicity can be good (being wary of the ‘sanctity of
grade’ trap)
19 Feb 2015
An Economic Perspective on Deep & Under Cover Exploration: What are we looking for how do we get there?
*Trench
Slide 3 of 43

ASEG-PESA 2015 Workshop: Geophysical signatures of mineral systems; more than bumps
WHAT ARE WE LOOKING FOR?
QUALITY NEW DISCOVERIES
An economic perspective on deep and under cover exploration
19 Feb 2015
An Economic Perspective on Deep & Under Cover Exploration: What are we looking for how do we get there?
Slide 4 of 43

ASEG-PESA 2015 Workshop: Geophysical signatures of mineral systems; more than bumps
What can mineral economics contribute?
• What are we looking for? Quality new discoveries
– Future precious and base metals discovery at depth more so than bulks
– What ‘quality’ really means (or otherwise) in Copper, Nickel & Gold as examples
• Sometimes quality will be deep and high-grade, but not always
• Quality may be deep, low-grade, but scalable for example
• How do we get there? Better Understanding
– Through a clearer understanding of the impact of grade, scale, mineralisation-style and geometrical effects on mine economics
• The excellent case study of Australian Gold Mine ‘geological economics’ (Kanakis (2014)
• Where to next? We need to get to first base yet
– Where mineral economists will likely mislead you (and fool ourselves too)
– Some high-level project economics from in-ground discovery to out-of-ground value creation
– So much more fact-based and modelling work ahead
19 Feb 2015
An Economic Perspective on Deep & Under Cover Exploration: What are we looking for how do we get there?
Slide 5 of 43

ASEG-PESA 2015 Workshop: Geophysical signatures of mineral systems; more than bumps
We don’t yet understand grade effects on
economics – in pits or u/g – although it looks simple
19 Feb 2015
An Economic Perspective on Deep & Under Cover Exploration: What are we looking for how do we get there?
Grade Enhancement Near Surface Mined First
Low
grade
High
grade
(blind)
Enrichment zone
General
grade
decline
with
depth
Surface
So Grade Must Fall Over Time....and costs rise?
Enriched
cap
High
grade pod
Mine design brings
this forward
%
Cu
(eq)
GEOLOGY
Preferential ‘Bring-Forward’ of High Grade
High grade
taken first Pit outline 2013
MINING
High Prices ‘Creates’ Low Grade Ore
ECONOMICS
Economic low-grade
Final pit
outline
Slide 6 of 43

ASEG-PESA 2015 Workshop: Geophysical signatures of mineral systems; more than bumps
...and if we don’t fully understand grade-economics
then we have a major problem: Grades vary a lot...
19 Feb 2015
An Economic Perspective on Deep & Under Cover Exploration: What are we looking for how do we get there?
0%
10%
20%
30%
40%
50%
60%
70%
80%
90%
100%
<0.5% 0.5 - 0.8% 0.8 - 1.0 1.0 - 2.0 2.0 - 4.0
Cu ore grade
IOCG Nickel-copper sulphide Porphyry Sedimentary copper Strata bound VMS
Copper deposit type & ore grade (N = 208 projects)
CRU, MEG
Slide 7 of 43
ASEG-PESA 2015 Workshop: Geophysical signatures of mineral systems; more than bumps
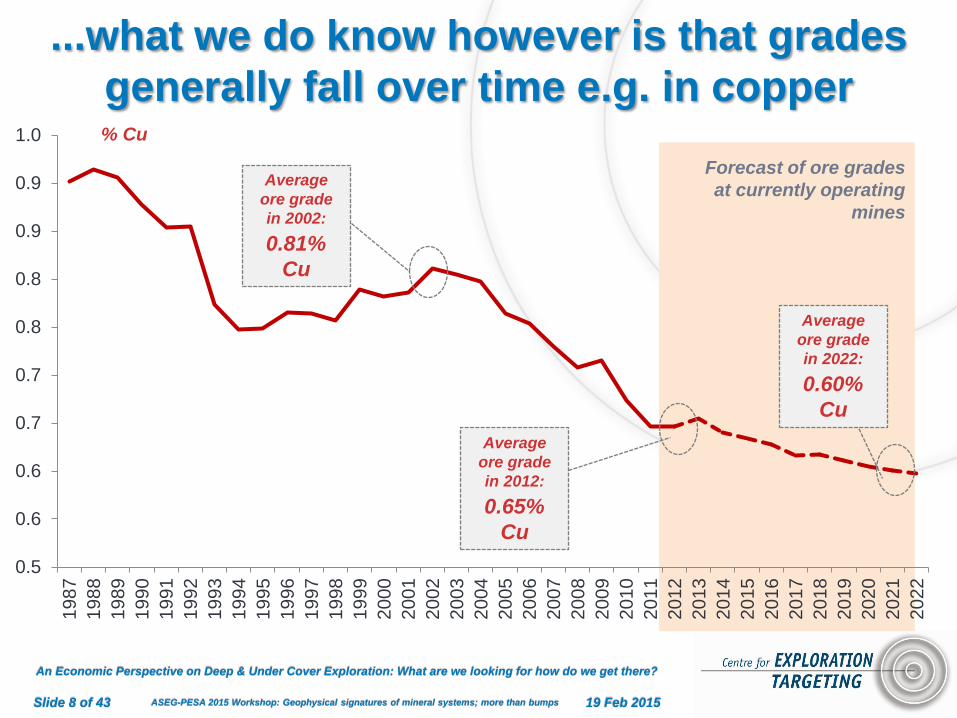
...what we do know however is that grades
generally fall over time e.g. in copper
19 Feb 2015
An Economic Perspective on Deep & Under Cover Exploration: What are we looking for how do we get there?
0.5
0.6
0.6
0.7
0.7
0.8
0.8
0.9
0.9
1.0
1987
1988
1989
1990
1991
1992
1993
1994
1995
1996
1997
1998
1999
2000
2001
2002
2003
2004
2005
2006
2007
2008
2009
2010
2011
2012
2013
2014
2015
2016
2017
2018
2019
2020
2021
2022
Forecast of ore grades
at currently operating
mines
Average
ore grade
in 2012:
0.65%
Cu
Average
ore grade
in 2022:
0.60%
Cu
Average
ore grade
in 2002:
0.81%
Cu
% Cu
Slide 8 of 43

ASEG-PESA 2015 Workshop: Geophysical signatures of mineral systems; more than bumps
And we also know that falling grades of themselves
do not drive higher prices in real terms…
0
2000
4000
6000
8000
10000
12000
14000
Long Term Real & Nominal Copper Prices: 1914-2013 (US$/tonne)
Nominal Copper Price Real Copper Price Average Real Copper Price
19 Feb 2015
An Economic Perspective on Deep & Under Cover Exploration: What are we looking for how do we get there?
Source: Sykes & Trench, 2014; Data from United States Department of Labour (2014); Historical nominal copper prices 1914-2011
from the United States Geological Survey (2012) and 2012-13 from Metal Pages (2014)
Slide 9 of 43

ASEG-PESA 2015 Workshop: Geophysical signatures of mineral systems; more than bumps
Declining grades are likely – so the economics of
mining of lower grades matters..
19 Feb 2015
An Economic Perspective on Deep & Under Cover Exploration: What are we looking for how do we get there?
0
0.5
1
1.5
2
2.5
3
DR Congo Zambia Russia China Australia Canada Peru Chile UnitedStates
Mexico
Grade of exploration projects in top 10 copper producers (%Cu)
CRU Consulting analysis of MEG data (Active Exploration Projects)
Slide 10 of 43

ASEG-PESA 2015 Workshop: Geophysical signatures of mineral systems; more than bumps
... despite the ‘future is underground’ not being
universal – e.g. pits still dominate Cu pipeline
19 Feb 2015
An Economic Perspective on Deep & Under Cover Exploration: What are we looking for how do we get there?
Source: CRU, MEG
Open pit
100%
Underground
100%
DRC
Peru
USA Russia
Chile
Canada Mexico
Zambia Australia
China
Production & Pre-production
Open pit
100%
Underground
100%
DRC
Peru USA Russia
Chile
Canada
Mexico
Zambia Australia China
Feasibility
Slide 11 of 43
ASEG-PESA 2015 Workshop: Geophysical signatures of mineral systems; more than bumps
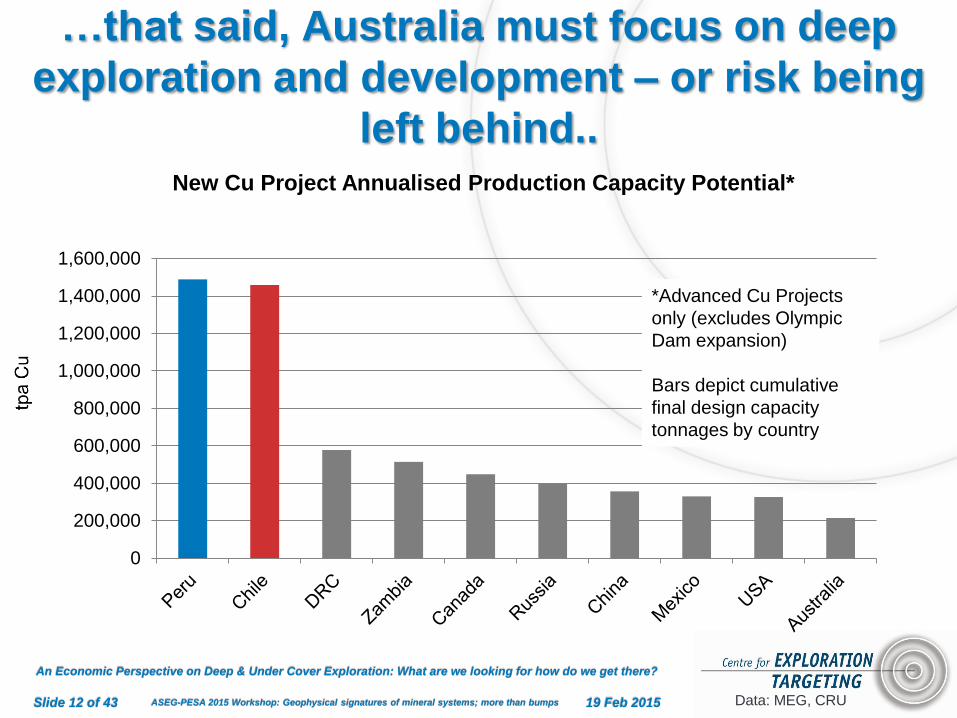
…that said, Australia must focus on deep
exploration and development – or risk being
left behind..
19 Feb 2015
An Economic Perspective on Deep & Under Cover Exploration: What are we looking for how do we get there?
0
200,000
400,000
600,000
800,000
1,000,000
1,200,000
1,400,000
1,600,000
New Cu Project Annualised Production Capacity Potential*
Data: MEG, CRU
*Advanced Cu Projects
only (excludes Olympic
Dam expansion)
Bars depict cumulative
final design capacity
tonnages by country
Slide 12 of 43

ASEG-PESA 2015 Workshop: Geophysical signatures of mineral systems; more than bumps
What is the cost of going deeper? With lots of
stripping, open pits soon become expensive
0.00
5.00
10.00
15.00
20.00
25.00
30.00
35.00
40.00
OpEx (US$/t ore)
19 Feb 2015
An Economic Perspective on Deep & Under Cover Exploration: What are we looking for how do we get there?
0
50
100
150
200
250
300
CapEx (US$ million/t ore capacity)
Costs based on 10,000 tpd capacity, estimated from CostMine, 2014
Slide 13 of 43

ASEG-PESA 2015 Workshop: Geophysical signatures of mineral systems; more than bumps
In Cu, underground mines are cost
disadvantaged versus pits (in contrast to Ni)
19 Feb 2015
An Economic Perspective on Deep & Under Cover Exploration: What are we looking for how do we get there?
Copper costs - Net of by-product cash costs by mining type, 2014, $/t
Data: CRU
-5,000
0
5,000
10,000
15,000
20,000
0 2,000 4,000 6,000 8,000 10,000 12,000
Underground Open Pit Mixed
Slide 14 of 43

ASEG-PESA 2015 Workshop: Geophysical signatures of mineral systems; more than bumps
Geology (geometry, style), commodity value and ore
value (grade) influence mine development choice
0%
10%
20%
30%
40%
50%
60%
70%
80%
90%
100%
Open Pit Open Pit & Undergound Underground Other Unknown
19 Feb 2015
An Economic Perspective on Deep & Under Cover Exploration: What are we looking for how do we get there?
Data: RMG
Other: Either tailings, placer or offshore operations (or in-situ leach for uranium)
Slide 15 of 43

ASEG-PESA 2015 Workshop: Geophysical signatures of mineral systems; more than bumps
…with deeper developments more typical for
precious metals over base and bulks
Platinum
Open Pit
Open Pit & Underground
Underground
Other
Unknown
Other: Either tailings, placer or offshore operations (or in-situ leach for uranium)
Nickel
Open Pit
Open Pit & Underground
Underground
Other
Unknown
Iron Ore
Open Pit
Open Pit & Underground
Underground
Other
Unknown
Data: Raw Materials Group
19 Feb 2015
An Economic Perspective on Deep & Under Cover Exploration: What are we looking for how do we get there?
Slide 16 of 43
ASEG-PESA 2015 Workshop: Geophysical signatures of mineral systems; more than bumps
HOW DO WE GET THERE?
BETTER UNDERSTANDING
An economic perspective on deep and under cover exploration
19 Feb 2015
An Economic Perspective on Deep & Under Cover Exploration: What are we looking for how do we get there?
Slide 17 of 43
ASEG-PESA 2015 Workshop: Geophysical signatures of mineral systems; more than bumps
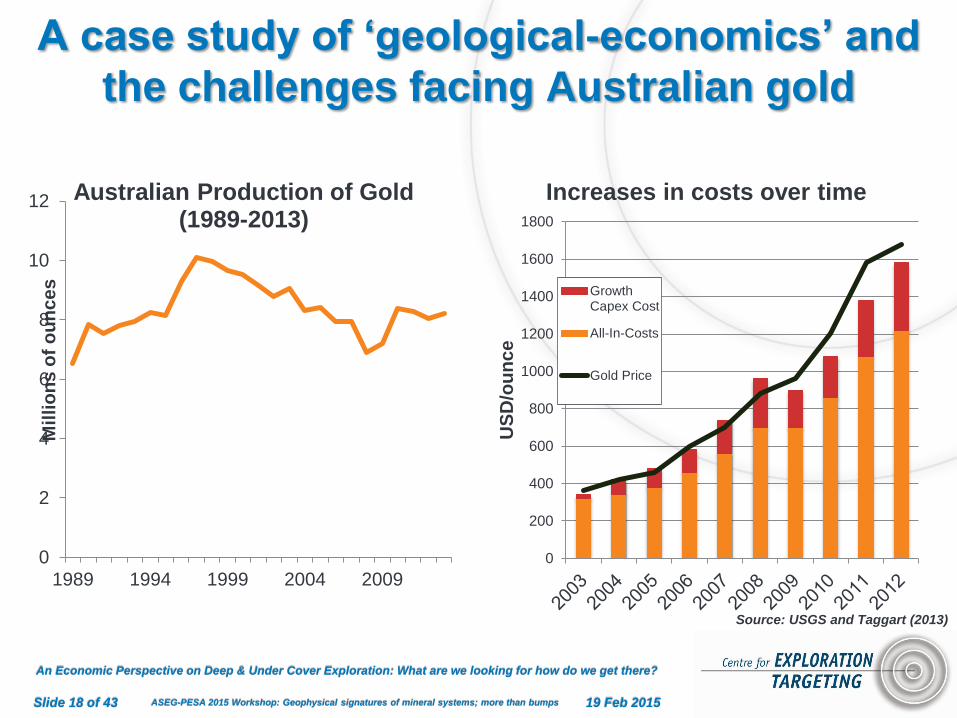
A case study of ‘geological-economics’ and
the challenges facing Australian gold
0
2
4
6
8
10
12
1989 1994 1999 2004 2009
Mil
lio
ns
of
ou
nc
es
Australian Production of Gold (1989-2013)
0
200
400
600
800
1000
1200
1400
1600
1800
US
D/o
un
ce
Increases in costs over time
GrowthCapex Cost
All-In-Costs
Gold Price
19 Feb 2015
An Economic Perspective on Deep & Under Cover Exploration: What are we looking for how do we get there?
Source: USGS and Taggart (2013)
Slide 18 of 43

ASEG-PESA 2015 Workshop: Geophysical signatures of mineral systems; more than bumps
Australian gold: About 50 mines with close to 50:50
underground to open pit split of production
19 Feb 2015
An Economic Perspective on Deep & Under Cover Exploration: What are we looking for how do we get there?
Fact Key Figure(s)/Mine example(s)
Total Australian and New Zealand Production Dec Half-
Year 2013 Recorded in the Study. 4,126,319 oz.
Percentage of Gold Production from Underground Mines 56%
Percentage of Gold Production from Open Pit Mines 44%
Percentage of Production that is Gold Only 72%
Percentage of Production that is Polymetallic 28%
Mined Grade Dec Half-Year 2013
Production-Weighted Average Gold Grade 3.26 g/t
Highest Grade Mine Andy Well (12.45 g/t)
Lowest Grade Mine Cadia Hill (0.36 g/t)
Cost Information Dec Half-Year 2013
Lowest Cost Mine Cadia Hill/Cadia East/Ridgeway $242/oz. (cash costs) $302/oz.
(AISC)
Highest Cost Mine Challenger $1427.64/oz. (cash costs) Henty $1527/oz. (AISC)
Lowest Cost Quartile Threshold (25th Percentile) $700/oz. (cash costs) $925/oz. (AISC)
Highest Cost Quartile Threshold (75th Percentile) $950/oz. (cash costs) $1205/oz. (AISC)
Source: Kanakis (2014)
Slide 19 of 43

ASEG-PESA 2015 Workshop: Geophysical signatures of mineral systems; more than bumps
How do you think a production cost versus grade
chart might look for Australian gold mines? This?
Co
sts
($A
U)
Grade (g/t)
19 Feb 2015
An Economic Perspective on Deep & Under Cover Exploration: What are we looking for how do we get there?
Source: Kanakis (2014)
Higher grade,
lower cost
mines
Lower grade,
higher cost
mines
Slide 20 of 43

ASEG-PESA 2015 Workshop: Geophysical signatures of mineral systems; more than bumps
It is actually not that simple:
High grade doesn’t equate to low cost!
19 Feb 2015
An Economic Perspective on Deep & Under Cover Exploration: What are we looking for how do we get there?
0
200
400
600
800
1000
1200
1400
1600
1800
2000
0.00 2.00 4.00 6.00 8.00 10.00 12.00 14.00
All
in
Su
sta
inin
g C
osts
($A
U)
Operating Grade Q4 (g/t)
Open Pit
Underground
Source: Kanakis (2014)
Slide 21 of 43
ASEG-PESA 2015 Workshop: Geophysical signatures of mineral systems; more than bumps
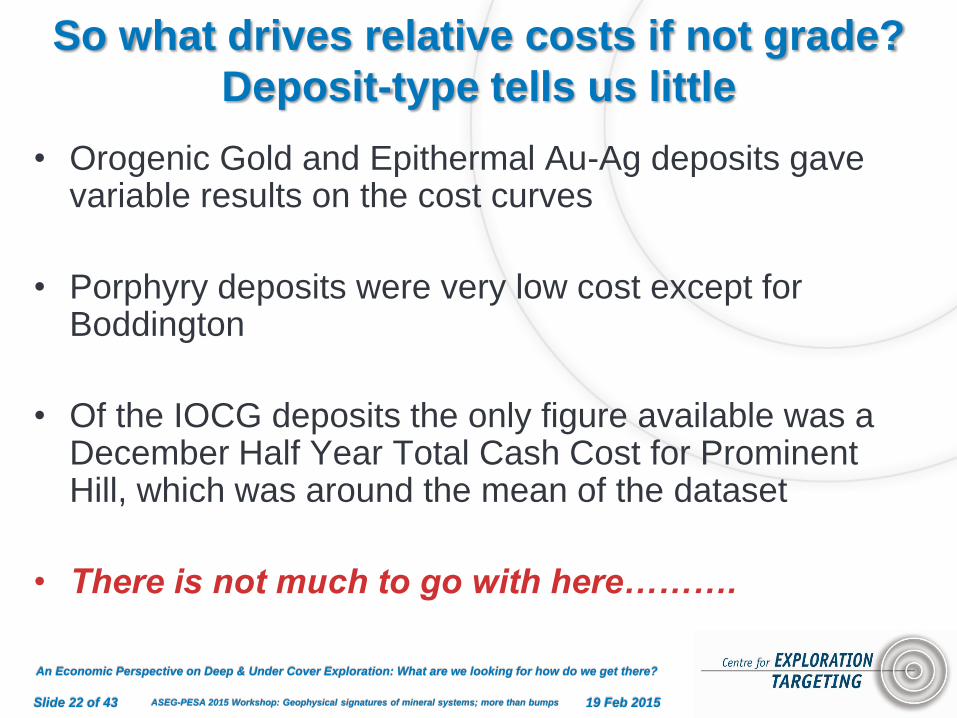
So what drives relative costs if not grade?
Deposit-type tells us little
• Orogenic Gold and Epithermal Au-Ag deposits gave variable results on the cost curves
• Porphyry deposits were very low cost except for Boddington
• Of the IOCG deposits the only figure available was a December Half Year Total Cash Cost for Prominent Hill, which was around the mean of the dataset
• There is not much to go with here……….
19 Feb 2015
An Economic Perspective on Deep & Under Cover Exploration: What are we looking for how do we get there?
Slide 22 of 43
ASEG-PESA 2015 Workshop: Geophysical signatures of mineral systems; more than bumps
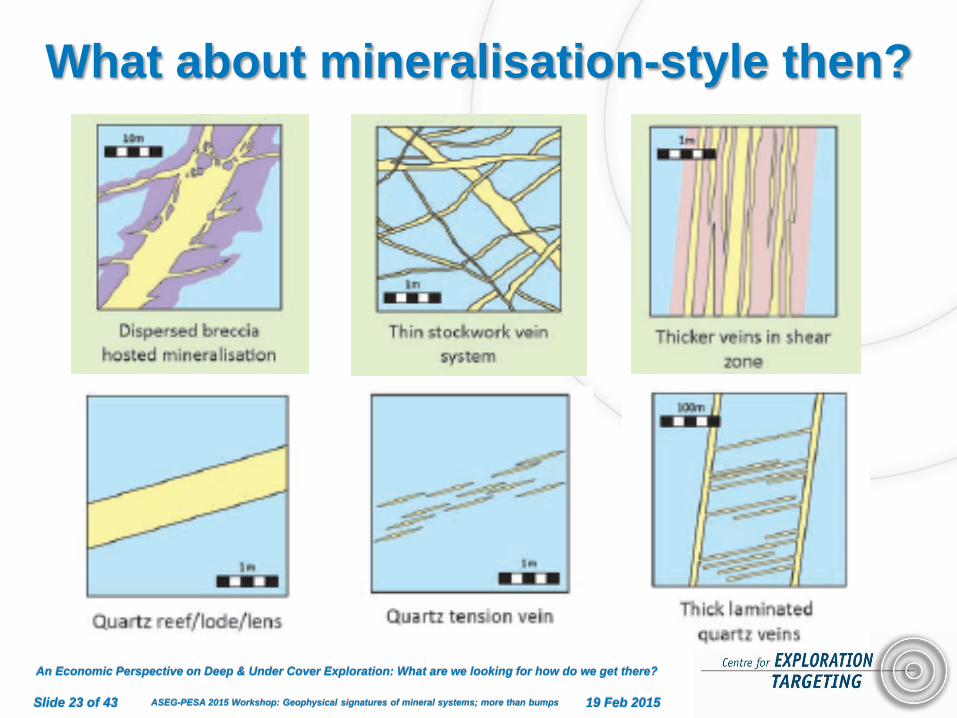
What about mineralisation-style then?
19 Feb 2015
An Economic Perspective on Deep & Under Cover Exploration: What are we looking for how do we get there?
Slide 23 of 43

ASEG-PESA 2015 Workshop: Geophysical signatures of mineral systems; more than bumps
Disseminated mineralisation appears
important
0.00%
10.00%
20.00%
30.00%
40.00%
50.00%
60.00%
70.00%
80.00%
90.00%
100.00%
Q1 Q2 Q3 Q4
Pro
du
cti
on
(%
of
qu
art
ile t
ota
l)
Percentage of deposits with different mineralisation style in
each cost quartile
Vein/Reef Style
Disseminated
• Deposits with more
disseminated style
mineralisation displayed lower
costs than those with vein/reef
style mineralisation
• Relationship especially evident
in the cash cost datasets.
19 Feb 2015
An Economic Perspective on Deep & Under Cover Exploration: What are we looking for how do we get there?
Source: Kanakis (2014)
Slide 24 of 43

ASEG-PESA 2015 Workshop: Geophysical signatures of mineral systems; more than bumps
Geometry clearly matters too: Lower
cost deposits are equidimensional • Deposits were defined
as equidimensional,
planar and cylindrical
shaped.
• Equidimensional
deposits gave much
lower costs than planar
and cylindrical deposits.
• Gently dipping planar
deposits also give lower
costs than steeply
dipping planar deposits.
19 Feb 2015
An Economic Perspective on Deep & Under Cover Exploration: What are we looking for how do we get there?
Planar Deposit
Cylindrical Deposit
Equidimensional
Deposit
Source: Kanakis (2014)
Slide 25 of 43
ASEG-PESA 2015 Workshop: Geophysical signatures of mineral systems; more than bumps
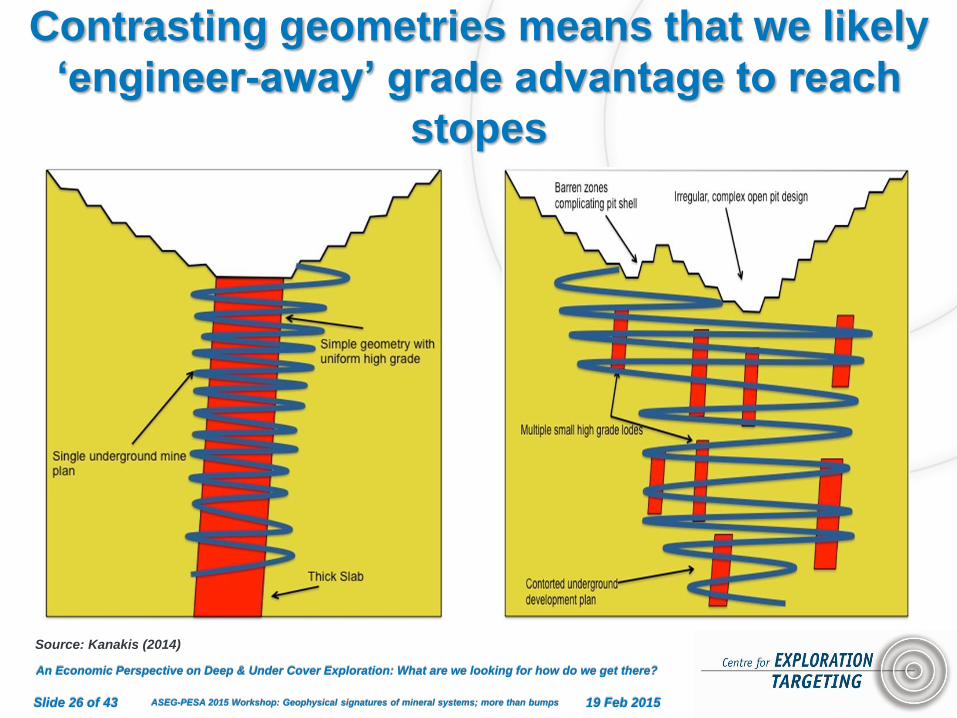
Contrasting geometries means that we likely
‘engineer-away’ grade advantage to reach
stopes
19 Feb 2015
An Economic Perspective on Deep & Under Cover Exploration: What are we looking for how do we get there?
Source: Kanakis (2014)
Slide 26 of 43

ASEG-PESA 2015 Workshop: Geophysical signatures of mineral systems; more than bumps 19 Feb 2015
An Economic Perspective on Deep & Under Cover Exploration: What are we looking for how do we get there?
The cost drivers differ markedly between pits and
underground – both by function and composition
Open Pit Underground
Source: National Bank Financial Feb 15
Slide 27 of 43

ASEG-PESA 2015 Workshop: Geophysical signatures of mineral systems; more than bumps
WHERE TO NEXT?
An economic perspective on deep and under cover exploration
19 Feb 2015
An Economic Perspective on Deep & Under Cover Exploration: What are we looking for how do we get there?
Slide 28 of 43

ASEG-PESA 2015 Workshop: Geophysical signatures of mineral systems; more than bumps
So is a new underground target better
economically than a typical new pit? Typical Australian medium sized
OPEN PIT gold mine
• Resource contained Au: 4.0Moz
• Reserve contained Au: 2.8Moz
• Mining Losses: 95%
• Mine Life: 15 years
• Throughput: 3.5Mt/y
• Grade: 1.5g/t
• Processing Recovery: 85%
• Production: 150,000oz/y
• Opex: $750/oz
• Capex: $150 million
• Construction: 2 years
Typical Australian medium sized
UNDERGROUND gold mine
• Resource contained Au: 13.3Moz
• Reserve contained Au: 6.7Moz
• Mining Losses: 75%
• Mine Life: 30 years
• Throughput: 1.0Mt/y
• Grade: 5.0g/t
• Processing Recovery: 90%
• Production: 150,000oz/y
• Opex: $850/oz
• Capex: $65 million
• Construction: 4 years
19 Feb 2015
An Economic Perspective on Deep & Under Cover Exploration: What are we looking for how do we get there?
Based on data collated by Matthew Kanakis (and some tacit assumptions by Sykes & Trench)
Slide 29 of 43

ASEG-PESA 2015 Workshop: Geophysical signatures of mineral systems; more than bumps
First convert resource to reserve…
0
1000
2000
3000
4000
5000
6000
Resource(in-ground)
Reserve (in-ground)
Mined Gold ProcessedGold
NPV ofRevenues
NPV ofProfits
NPV Project
Va
lue
(U
S$
M)
Typical medium sized Australian OPEN PIT gold mine
19 Feb 2015
An Economic Perspective on Deep & Under Cover Exploration: What are we looking for how do we get there?
0
3000
6000
9000
12000
15000
18000
Resource(in-ground)
Reserve (in-ground)
Mined Gold ProcessedGold
NPV ofRevenues
NPV ofProfits
NPV Project
Va
lue
(U
S$
M)
Typical medium sized Australian UNDERGROUND gold mine
Resource: 4.0Moz Au @
US$1,300/oz = US$5.2 billion
Resource to Reserve
Conversion (high) = 70%
Reserve: 2.8Moz Au @
US$1,300/oz = US$3.6 billion
Reserve conversion
losses = US$1.6 billion
Resource: 13.3Moz Au @
US$1,300/oz = US$17.5 billion
Resource to Reserve Conversion
(low) = 50%
Reserve: 6.7Moz Au @
US$1,300/oz = US$8.5 billion
Reserve conversion
losses = US$9 billion
NB: Calculations have undergone rounding so may not be fully accurate
Slide 30 of 43
ASEG-PESA 2015 Workshop: Geophysical signatures of mineral systems; more than bumps
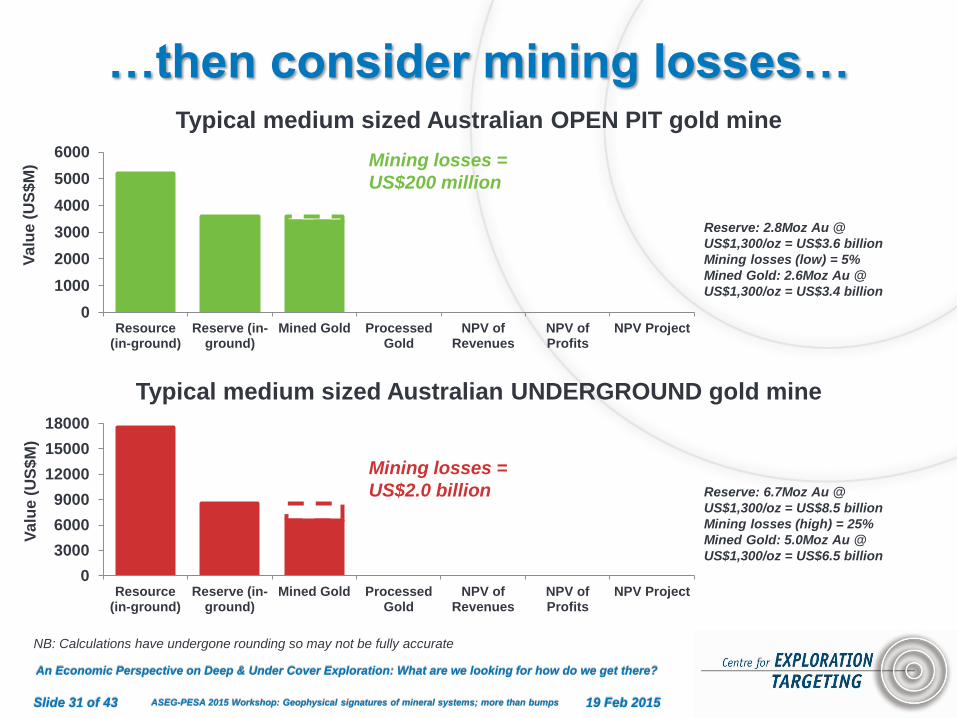
…then consider mining losses…
0
1000
2000
3000
4000
5000
6000
Resource(in-ground)
Reserve (in-ground)
Mined Gold ProcessedGold
NPV ofRevenues
NPV ofProfits
NPV Project
Va
lue
(U
S$
M)
Typical medium sized Australian OPEN PIT gold mine
19 Feb 2015
An Economic Perspective on Deep & Under Cover Exploration: What are we looking for how do we get there?
0
3000
6000
9000
12000
15000
18000
Resource(in-ground)
Reserve (in-ground)
Mined Gold ProcessedGold
NPV ofRevenues
NPV ofProfits
NPV Project
Va
lue
(U
S$
M)
Typical medium sized Australian UNDERGROUND gold mine
Reserve: 2.8Moz Au @
US$1,300/oz = US$3.6 billion
Mining losses (low) = 5%
Mined Gold: 2.6Moz Au @
US$1,300/oz = US$3.4 billion
Mining losses =
US$200 million
Reserve: 6.7Moz Au @
US$1,300/oz = US$8.5 billion
Mining losses (high) = 25%
Mined Gold: 5.0Moz Au @
US$1,300/oz = US$6.5 billion
NB: Calculations have undergone rounding so may not be fully accurate
Mining losses =
US$2.0 billion
Slide 31 of 43

ASEG-PESA 2015 Workshop: Geophysical signatures of mineral systems; more than bumps
…then consider processing losses…
0
1000
2000
3000
4000
5000
6000
Resource(in-ground)
Reserve (in-ground)
Mined Gold ProcessedGold
NPV ofRevenues
NPV ofProfits
NPV Project
Va
lue
(U
S$
M)
Typical medium sized Australian OPEN PIT gold mine
19 Feb 2015
An Economic Perspective on Deep & Under Cover Exploration: What are we looking for how do we get there?
0
3000
6000
9000
12000
15000
18000
Resource(in-ground)
Reserve (in-ground)
Mined Gold ProcessedGold
NPV ofRevenues
NPV ofProfits
NPV Project
Va
lue
(U
S$
M)
Typical medium sized Australian UNDERGROUND gold mine
Mined Gold: 2.6Moz Au @
US$1,300/oz = US$3.4 billion
Processing losses (high) = 15%
Processed Gold: 2.3Moz Au @
US$1,300/oz = US$3.0 billion
Processing losses
= US$400 million
Mined Gold: 5.0Moz Au @
US$1,300/oz = US$6.5 billion
Processing losses (low) = 10%
Processed Gold: 4.5Moz Au @
US$1,300/oz = US$6.0 billion
NB: Calculations have undergone rounding so may not be fully accurate
Processing losses
= US$500 million
Slide 32 of 43

ASEG-PESA 2015 Workshop: Geophysical signatures of mineral systems; more than bumps
…and mining over several years…
0
1000
2000
3000
4000
5000
6000
Resource(in-ground)
Reserve (in-ground)
Mined Gold ProcessedGold
NPV ofRevenues
NPV ofProfits
NPV Project
Va
lue
(U
S$
M)
Typical medium sized Australian OPEN PIT gold mine
19 Feb 2015
An Economic Perspective on Deep & Under Cover Exploration: What are we looking for how do we get there?
0
3000
6000
9000
12000
15000
18000
Resource(in-ground)
Reserve (in-ground)
Mined Gold ProcessedGold
NPV ofRevenues
NPV ofProfits
NPV Project
Va
lue
(U
S$
M)
Typical medium sized Australian UNDERGROUND gold mine
Processed Gold: 2.3Moz Au @
US$1,300/oz = US$3.0 billion
Discount Rate = 10%
Mine Life = 15 years
NPV of Revenues: 150Koz/y Au @
US$1,300/oz = US$1.5 billion
Time cost of money
= US$1.5 billion
Processed Gold: 4.5Moz Au @
US$1,300/oz = US$6.0 billion
Discount Rate = 10%
Mine Life = 30 years
NPV of Revenues: 150Koz/y Au @
US$1,300/oz = US$1.9 billion
NB: Calculations have undergone rounding so may not be fully accurate
Time cost of money
= US$4.1 billion
Slide 33 of 43

ASEG-PESA 2015 Workshop: Geophysical signatures of mineral systems; more than bumps
…not forgetting operating costs…
0
1000
2000
3000
4000
5000
6000
Resource(in-ground)
Reserve (in-ground)
Mined Gold ProcessedGold
NPV ofRevenues
NPV ofProfits
NPV Project
Va
lue
(U
S$
M)
Typical medium sized Australian OPEN PIT gold mine
19 Feb 2015
An Economic Perspective on Deep & Under Cover Exploration: What are we looking for how do we get there?
0
3000
6000
9000
12000
15000
18000
Resource(in-ground)
Reserve (in-ground)
Mined Gold ProcessedGold
NPV ofRevenues
NPV ofProfits
NPV Project
Va
lue
(U
S$
M)
Typical medium sized Australian UNDERGROUND gold mine
NPV of Revenues: 150Koz/y Au @
US$1,300/oz = US$1.5 billion
Operating Costs = US$750/oz
NPV of Profits: 150Koz/y Au @
US$1,300/oz = US$640 million
Operating costs =
US$860 million
NPV of Revenues: 150Koz/y Au @
US$1,300/oz = US$1.9 billion
Operating Costs = US$850/oz
NPV of Profits: 150Koz/y Au @
US$1,300/oz = US$640 million
NB: Calculations have undergone rounding so may not be fully accurate
Operating costs =
US$1.26 billion
Slide 34 of 43

ASEG-PESA 2015 Workshop: Geophysical signatures of mineral systems; more than bumps
…and capital costs for a project…
0
1000
2000
3000
4000
5000
6000
Resource(in-ground)
Reserve (in-ground)
Mined Gold ProcessedGold
NPV ofRevenues
NPV ofProfits
NPV Project
Va
lue
(U
S$
M)
Typical medium sized Australian OPEN PIT gold mine
19 Feb 2015
An Economic Perspective on Deep & Under Cover Exploration: What are we looking for how do we get there?
0
3000
6000
9000
12000
15000
18000
Resource(in-ground)
Reserve (in-ground)
Mined Gold ProcessedGold
NPV ofRevenues
NPV ofProfits
NPV Project
Va
lue
(U
S$
M)
Typical medium sized Australian UNDERGROUND gold mine
NPV of Profits: 150Koz/y Au @
US$1,300/oz = US$640 million
Capital Cost = US$150 million
Construction Time = 2 years
NPV of Project: 150Koz/y Au @
US$1,300/oz = US$390 million
Construction costs
= US$250 million
NPV of Profits: 150Koz/y Au @
US$1,300/oz = US$640 million
Capital Cost = US$65 million
Construction Time = 4 years
NPV of Project: 150Koz/y Au @
US$1,300/oz = US$375 million
NB: Calculations have undergone rounding so may not be fully accurate
Construction costs
= US$265 million
Slide 35 of 43

ASEG-PESA 2015 Workshop: Geophysical signatures of mineral systems; more than bumps
In the end there’s little difference?
0
1000
2000
3000
4000
5000
6000
Resource(in-ground)
Reserve (in-ground)
Mined Gold ProcessedGold
NPV ofRevenues
NPV ofProfits
NPV Project
Va
lue
(U
S$
M)
Typical medium sized Australian OPEN PIT gold mine
19 Feb 2015
An Economic Perspective on Deep & Under Cover Exploration: What are we looking for how do we get there?
0
3000
6000
9000
12000
15000
18000
Resource(in-ground)
Reserve (in-ground)
Mined Gold ProcessedGold
NPV ofRevenues
NPV ofProfits
NPV Project
Va
lue
(U
S$
M)
Typical medium sized Australian UNDERGROUND gold mine
NB: Calculations have undergone rounding so may not be fully accurate
Total project
economic costs =
US$17.1 billion
Total project value
= US$375 million
Total project
economic costs =
US$4.8 billion
Total project value
= US$390 million
Slide 36 of 43

ASEG-PESA 2015 Workshop: Geophysical signatures of mineral systems; more than bumps
Where mineral economists will likely
mislead you (and ourselves too)
• Over-simplistic economic models of underground
targets – all economic assumptions, limited geology
& mining inputs
• Hard-wiring of a simple ‘grade drives economics’
modelling assumption (to the exclusion of
complexity & scale effects; orebody shape,
mineralisation style)
• Limited factual analysis of existing underground
deposits and their economics versus pit
developments
• Lack of ‘modifying factors’ within analyses
19 Feb 2015
An Economic Perspective on Deep & Under Cover Exploration: What are we looking for how do we get there?
Slide 37 of 43
ASEG-PESA 2015 Workshop: Geophysical signatures of mineral systems; more than bumps
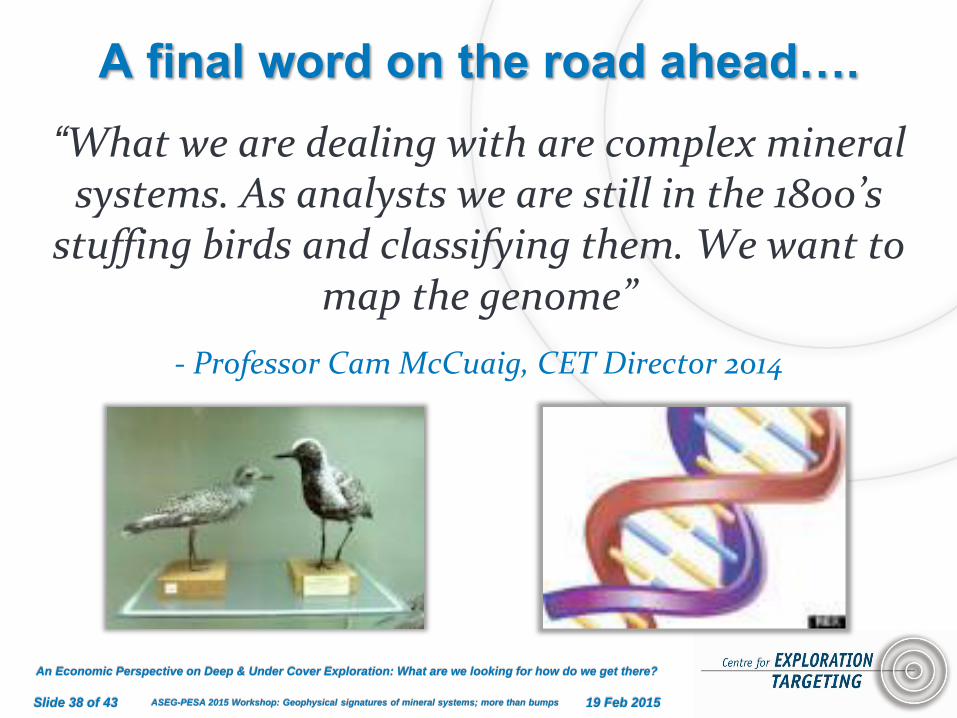
A final word on the road ahead….
“What we are dealing with are complex mineral systems. As analysts we are still in the 1800’s
stuffing birds and classifying them. We want to map the genome”
- Professor Cam McCuaig, CET Director 2014
19 Feb 2015
An Economic Perspective on Deep & Under Cover Exploration: What are we looking for how do we get there?
Slide 38 of 43

THANK YOU
For more information:
Centre for Exploration Targeting: www.cet.edu.au
Contact information:
John P. Sykes: [email protected]
Allan Trench: [email protected]
Matthew Kanakis: [email protected]

FURTHER READING • Kanakis, M.D., 2014. Grade Expectations – Australian Gold Mines defy the ‘Grade is King’ Cost
Hypothesis, Australian Institute of Geologists News, 188, November, 6-10.
• Kanakis, M.D., 2014. Grade Expectations – Australian Gold Mines defy the ‘Grade is King’ Cost
Hypothesis, Centre for Exploration Targeting Newsletter, 29, September, 14-17.
• McCuaig, T.C., Vann, J.E., & Sykes, J.P., 2014. Mines versus Mineralisation - Deposit Quality,
Mineral exploration Strategy and the Role of 'Boundary Spanners', Ninth International Mining Geology
Conference, Adelaide, 18-20 August, 33-41.
• Sykes, J.P., & Trench, A., 2014. Finding the Copper mine of the 21st century: Conceptual
Exploration Targeting for Hypothetical Copper Reserves, Society of Economic Geologists Special
Publication 18, 273–300.
• Sykes, J.P., & Trench, A., 2014. Resources versus Reserves - Towards a Systems-based
Understanding of Exploration and Mine Project Development and the Role of the Mining Geologist,
Ninth International Mining Geology Conference, Adelaide, 18-20 August, 243-270.
• Trench, A., & Sykes, J.P., 2014. Perspectives on Mineral Commodity Price Cycles and their
Relevance to Underground Mining, 12th AusIMM Underground Operators' Conference, Adelaide, 24-
26 March, 19-31.
• Trench, A., Packey, D., & Sykes, J.P., 2014. Non-Technical Risks and Their Impact on the Mining
Industry. AusIMM Monograph 30: Mineral Resource and Ore Reserve Estimation, Chapter 7: Risk in
Resource and Reserve Estimation, 605-617.
ASEG-PESA 2015 Workshop: Geophysical signatures of mineral systems; more than bumps
BACKUP – BROADER RISK
DISCUSSION
An economic perspective on deep and under cover exploration
19 Feb 2015
An Economic Perspective on Deep & Under Cover Exploration: What are we looking for how do we get there?
Slide 41 of 43

ASEG-PESA 2015 Workshop: Geophysical signatures of mineral systems; more than bumps
What does economic mean nowadays?
You can choose either technical vs
political risk?
0.00
0.25
0.50
0.75
1.00
1.25
1.50
1.75
2.00
0.0
1.0
2.0
3.0
4.0
5.0
6.0
7.0
8.0
Weda Bay,Indonesia
Dumont,Canada
(QC)
Kalgoorlie(Heron),Australia
(WA)
Zebediela,SouthAfrica
Jacaré,Brazil
Gag Island,Indonesia
MountMargaret,Australia
(WA)
Maturi,USA (MN)
Turnagain,Canada
(BC)
Sulawesi,Indonesia
Nic
ke
l G
rad
e (
%)
Co
nta
ine
d N
ick
el (M
t)
Size, Grade & Political Risk for Top 10 Largest Nickel Projects showing that the highest grade projects are in the riskiest
political environments
19 Feb 2015
An Economic Perspective on Deep & Under Cover Exploration: What are we looking for how do we get there?
1st Quartile 2nd Quartile 3rd Quartile 4th Quartile
Data: Schodde; Fraser Institute
Slide 42 of 43

ASEG-PESA 2015 Workshop: Geophysical signatures of mineral systems; more than bumps
Actually… it’s quantity and a more
subtle notion of ‘quality’
0.00
0.50
1.00
1.50
2.00
2.50
3.00
3.50
4.00
0.0
5.0
10.0
15.0
20.0
25.0
30.0
35.0
40.0
Co
pp
er
Gra
de (
%)
Co
nta
ine
d C
op
per
(Mt)
Size, Grade & Political Risk for Top 10 Largest Copper Projects demonstrating that there is no clear relationship between
grade and political risk. Mine type, by-products etc coalesce to form a more subtle concept of ‘quality’
19 Feb 2015
An Economic Perspective on Deep & Under Cover Exploration: What are we looking for how do we get there?
1st Quartile 2nd Quartile 3rd Quartile 4th Quartile
Data: Schodde; Fraser Institute
Slide 43 of 43